Page 1
© Ricardo plc 2021
Creating a world
fit for the future
© Ricardo plc 2021
Technological, Operational and
Energy Pathways for Maritime
Transport to Reduce Emissions
Towards 2050
14th Concawe Symposium
28 September 2021
Page 2
2© Ricardo plc
Our Vision:
We want to create a world where everyone
can live sustainably
Our Mission:
Solving the world’s most pressing energy
and environmental challenges
Page 3
3© Ricardo plc
• Develop holistic evidence-based view (literature,
external expert input, modelling)
• Describe scientific understanding of
decarbonisation opportunities by 2050, including
– fuels / energy carriers
– technologies
– operational measures
• Quantify GHG emission reductions of packages
of most promising opportunities
• Identify challenges: barriers and enablers to
unlock and scale-up potential solutions
Context: Demand for maritime freight is
forecast to continue rising significantly
The objectives of the study were:Technological, Operational and Energy Pathways for Maritime Transport to Reduce Emissions Towards 2050
0
50
100
150
200
200
0
200
5
201
0
201
5
202
0
202
5
203
0
203
5
204
0
204
5
205
0
Mari
tim
e fre
ight
dem
an
d (
trill
ion tonne
-m
iles)
ITF 2019
IMO GHG4 SSP1 RCP4.5
IMO GHG4 SSP2 RCP2.6
IMO GHG4 SSP4 RCP6.0
Data sources: International Transport Forum Transport Outlook (2019), IMO 4th GHG study
Page 4
4© Ricardo plc
• IMO’s short-term
measures at the vessel
level supporting this
ambition:
EEDI, EEXI, CII, SEEMP
• Revised IMO strategy
planned for 2023
• Current “tank-to-wake”
estimates may give way to
“well-to-wake”
• New vessels should start
using zero GHG energy
carriers by 2030
IMO’s initial GHG strategy set a level of ambition that will require not just technical
innovation but also zero carbon, net zero and low carbon fuels
Technological, Operational and Energy Pathways for Maritime Transport to Reduce Emissions Towards 2050
Graphic source: Ricardo Typical vessel life of 20 to 30 years
Page 5
5© Ricardo plc
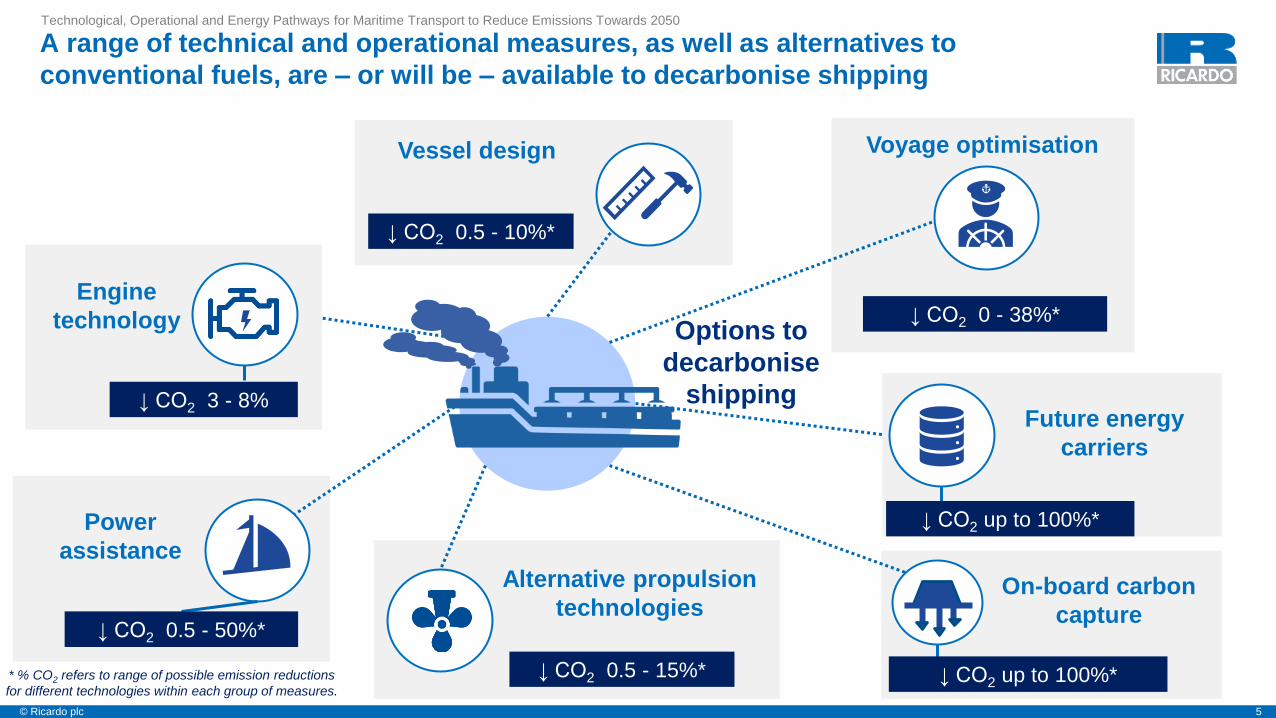
A range of technical and operational measures, as well as alternatives to
conventional fuels, are – or will be – available to decarbonise shipping
Technological, Operational and Energy Pathways for Maritime Transport to Reduce Emissions Towards 2050
Options to
decarbonise
shipping
Vessel design
Alternative propulsion
technologiesOn-board carbon
capture
↓ CO2 0.5 - 10%*
↓ CO2 0.5 - 15%* ↓ CO2 up to 100%*
Future energy
carriers
↓ CO2 up to 100%*
↓ CO2 0 - 38%*
↓ CO2 0.5 - 50%*
* % CO2 refers to range of possible emission reductions
for different technologies within each group of measures.
Power
assistance
↓ CO2 3 - 8%
Engine
technology
Voyage optimisation
Page 6
6© Ricardo plc
Three packages of measures were assembled as plausible pathways to achieving
the IMO’s decarbonisation ambition level
Technological, Operational and Energy Pathways for Maritime Transport to Reduce Emissions Towards 2050
Package 2Package 1 Package 3
Characterised by an early pursuit
of carbon-free alternative fuels
A moderate uptake of an interim
alternative fuel (represented by
LNG) in the short-term
Maximum use of
decarbonisation measures while
using conventional fuels.
From 2025, HFO and MDO use is
assumed to be increasingly substituted
with drop-in biofuels (FAME, HVO).
LNG transitions to bio methane (bio-
LNG) from 2030 onwards.
Medium take up of energy efficiency
technologies and operational
measures. A 20% speed reduction is
assumed for slow steaming.
No onboard CCS.
Introduction of new build ships using
grey hydrogen and grey ammonia,
and battery electric (coastal shipping)
from 2025. Followed by a transition
from grey to blue fuel pathways and to
green from 2035 onwards.
Medium take up of energy efficiency
technologies and operational
measures. A 10% speed reduction is
assumed for slow steaming.
No onboard CCS.
Conventional fuels, HFO and MDO,
with a later transition to reduced
carbon alternative fuels using
pathways that provide some reductions
in emissions Gradual transition to use
of bio-LNG, green methanol and green
ammonia.
High take up of energy efficiency
technologies and operational
measures. A 30% speed reduction is
assumed for slow steaming.
Onboard CCS post 2030.
Page 7
7© Ricardo plc
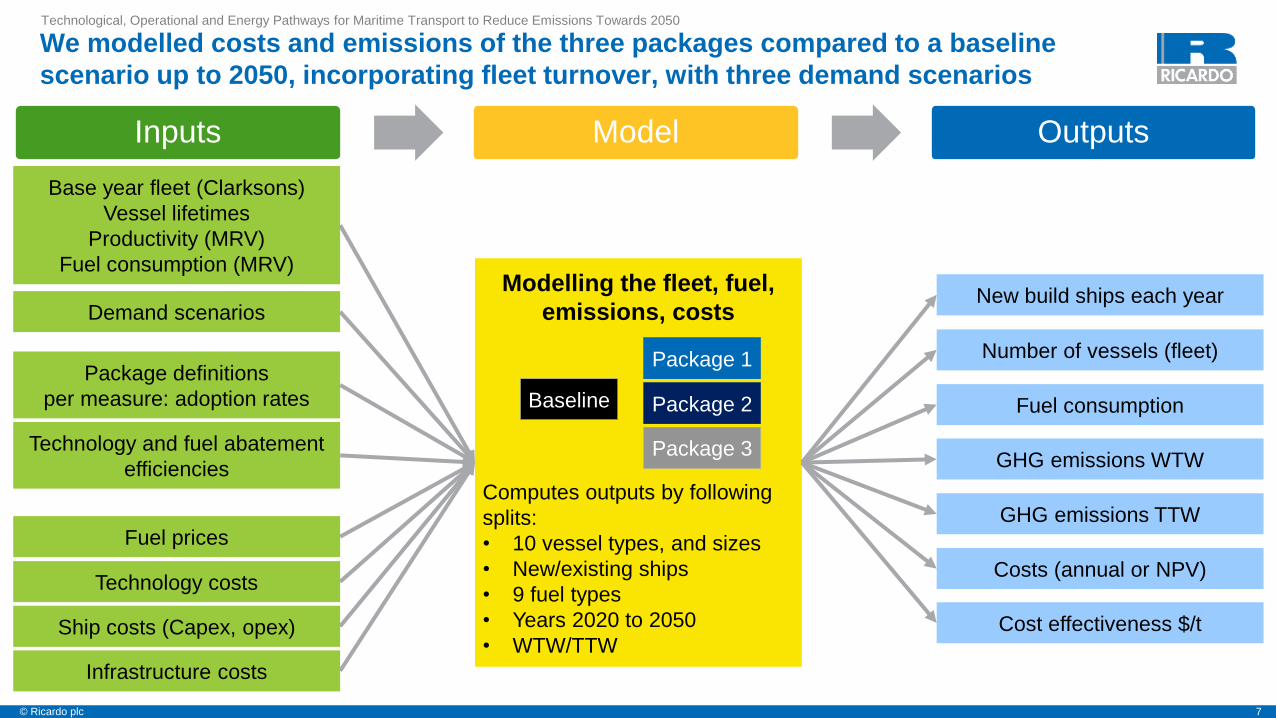
We modelled costs and emissions of the three packages compared to a baseline
scenario up to 2050, incorporating fleet turnover, with three demand scenarios
Technological, Operational and Energy Pathways for Maritime Transport to Reduce Emissions Towards 2050
Base year fleet (Clarksons)
Vessel lifetimes
Productivity (MRV)
Fuel consumption (MRV)
Inputs Model Outputs
Demand scenarios
Package definitions
per measure: adoption rates
Technology and fuel abatement
efficiencies
Fuel prices
Technology costs
Ship costs (Capex, opex)
Infrastructure costs
Modelling the fleet, fuel,
emissions, costs
Computes outputs by following
splits:
• 10 vessel types, and sizes
• New/existing ships
• 9 fuel types
• Years 2020 to 2050
• WTW/TTW
Package 2
Package 1
Package 3
Baseline
Number of vessels (fleet)
Fuel consumption
GHG emissions WTW
GHG emissions TTW
Costs (annual or NPV)
Cost effectiveness $/t
New build ships each year
Page 8
8© Ricardo plc
• Text box
Fuel consumption of the three packages out to 2050Technological, Operational and Energy Pathways for Maritime Transport to Reduce Emissions Towards 2050
0
500
1,000
1,500
2,000
2,500
3,000
2020 2025 2030 2035 2040 2045 2050
Maritim
e fuel consum
ption (
Mboe
)
First H2 /
NH3 ships
H2 / NH3 for all
new ships
HFO
MDOAmmonia
2020 2025 2030 2035 2040 2045 2050
New & existing
LNG → bio-LNG
2025 new &
existing
transition to
bio-diesel
HFO
LNG
BioLNG
HVO
FAME
2020 2025 2030 2035 2040 2045 2050
First ammonia,
bio-LNG,
methanol ships
Existing LNG
→ bio-LNG
HFO
MDOMethanol
Package 2Package 1 Package 3
Page 9
9© Ricardo plc
Energy efficiency technologies are key in providing shorter term GHG reductions
but are insufficient alone to meet IMO ambition; higher risk CCS a small benefit.
The largest reductions in WTW GHG emissions result from fuel switching
Technological, Operational and Energy Pathways for Maritime Transport to Reduce Emissions Towards 2050
2020 2025 2030 2035 2040 2045 2050 2020 2025 2030 2035 2040 2045 2050
Package 2Package 1 Package 3
WTW CO2e emissions - contribution of technology and fuels - Central scenario
Reductions
from fuelReductions
from fuelReductions
from fuel
0
200
400
600
800
1000
1200
1400
1600
2020 2025 2030 2035 2040 2045 2050
WT
W C
O2e
em
issio
ns (
mill
ion
to
nn
es/y
r)
Reductions
from fuel
Page 10
10© Ricardo plc
Package 3Package 2Package 1
Net present value (10% discount rate) of cost increments from baseline costs range from
+3% to +11% among packages
Technological, Operational and Energy Pathways for Maritime Transport to Reduce Emissions Towards 2050
• +$235bn above baseline (+4%)
• Half of additional cost is fuel (inc.
infrastructure)
• +$632bn above baseline (+11%)
• 3/4 of additional cost is fuel (inc.
infrastructure)
• +$181bn above baseline (+3%)
• Lower fuel spend
• Cost increase driven by capex spend
on vessels
Page 11
11© Ricardo plc
10% discount rate for costs, 0% for emissions
5% discount rate for costs and emissions
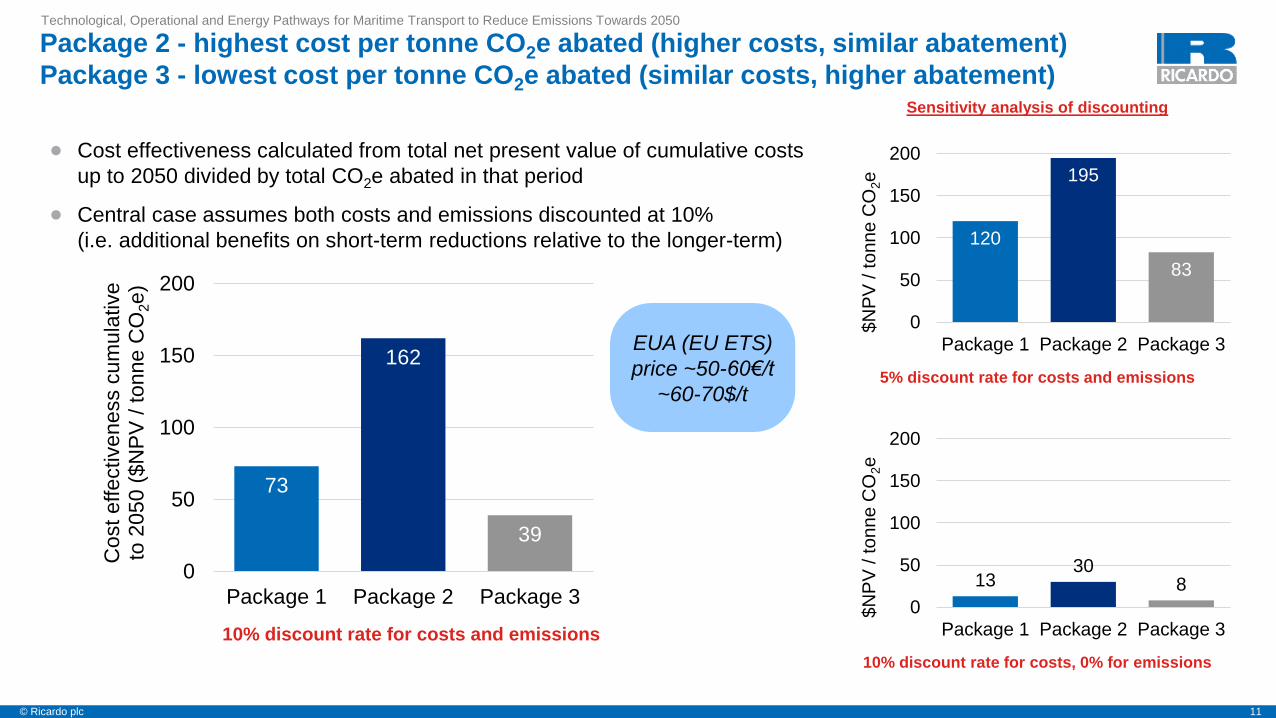
• Cost effectiveness calculated from total net present value of cumulative costs
up to 2050 divided by total CO2e abated in that period
• Central case assumes both costs and emissions discounted at 10%
(i.e. additional benefits on short-term reductions relative to the longer-term)
Package 2 - highest cost per tonne CO2e abated (higher costs, similar abatement)
Package 3 - lowest cost per tonne CO2e abated (similar costs, higher abatement)
Technological, Operational and Energy Pathways for Maritime Transport to Reduce Emissions Towards 2050
73
162
39
0
50
100
150
200
Package 1 Package 2 Package 3
Cost effectiveness c
um
ula
tive
to 2
05
0 (
$N
PV
/ t
on
ne
CO
2e
)
10% discount rate for costs and emissions
Sensitivity analysis of discounting
120
195
83
0
50
100
150
200
Package 1 Package 2 Package 3
$N
PV
/ to
nn
e C
O2e
1330
8
0
50
100
150
200
Package 1 Package 2 Package 3
$N
PV
/ to
nn
e C
O2e
EUA (EU ETS)
price ~50-60€/t
~60-70$/t
Page 12
12© Ricardo plc
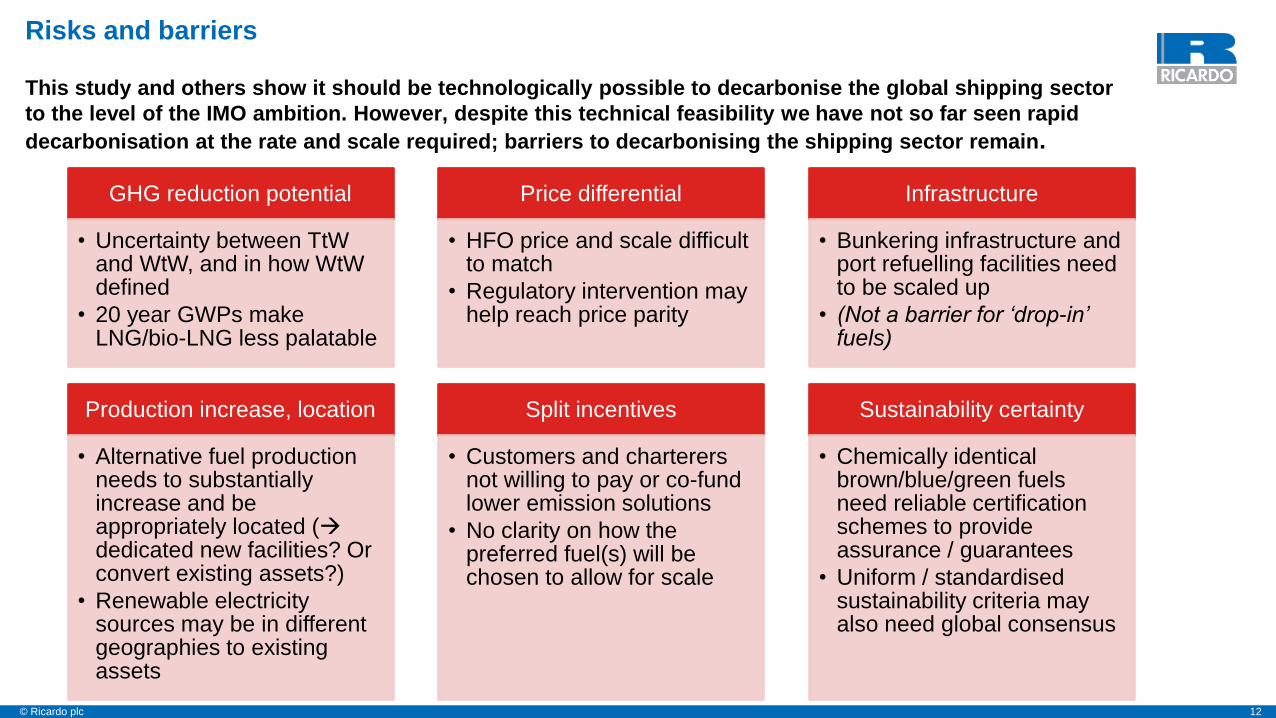
Risks and barriers
This study and others show it should be technologically possible to decarbonise the global shipping sector
to the level of the IMO ambition. However, despite this technical feasibility we have not so far seen rapid
decarbonisation at the rate and scale required; barriers to decarbonising the shipping sector remain.
GHG reduction potential
• Uncertainty between TtWand WtW, and in how WtWdefined
• 20 year GWPs make LNG/bio-LNG less palatable
Price differential
• HFO price and scale difficult to match
• Regulatory intervention may help reach price parity
Infrastructure
• Bunkering infrastructure and port refuelling facilities need to be scaled up
• (Not a barrier for ‘drop-in’ fuels)
Production increase, location
• Alternative fuel production needs to substantially increase and be appropriately located (→dedicated new facilities? Or convert existing assets?)
• Renewable electricity sources may be in different geographies to existing assets
Split incentives
• Customers and charterers not willing to pay or co-fund lower emission solutions
• No clarity on how the preferred fuel(s) will be chosen to allow for scale
Sustainability certainty
• Chemically identical brown/blue/green fuels need reliable certification schemes to provide assurance / guarantees
• Uniform / standardised sustainability criteria may also need global consensus
Page 13
13© Ricardo plc
Help shortlist the fuel choices
Support proof of concept demonstrations
Accommodate increased alternative fuel demand (10-14 EJ/year by 2050)
Provide ‘Green’ certification and fuel sustainability
information
Support change to well-to-wake
• Exploration & production – Demand for marine fuels
derived from petroleum and natural gas is expected to
reduce in the long term, but with uncertainty about how
demand for specific products will change over time
• Transport & storage – Bulk transportation and
import/export patterns are likely to change unevenly in
different regions
• Refining and distribution – Opportunities to capitalise
on unique expertise and experience but with challenges
in the transition away from petroleum products
Fuel suppliers’ role in the transition and
overcoming barriers and reducing risk
Opportunities and Challenges
Implications for the fuel production industryTechnological, Operational and Energy Pathways for Maritime Transport to Reduce Emissions Towards 2050
Increased demand for H2
and synthetic fuels
(especially ‘blue’ fuel)
Transitioning away from
petroleum products difficult
due to demand prediction
uncertainty
Fuel production located
nearer to demand centres
would reduce need to ship
oil/products globally
Uncertain trends for natural
gas demand make
predictions difficult
Plan for associated bunkering infrastructure & port refuelling facilities, est. $500-1,300bn (from 2020-50), excepting
‘drop-in’ fuel pathways
Page 14
14© Ricardo plc
• Vessel designers and builders should incorporate best available energy efficiency technology.
• Vessel owners and operators should plan for new vessels investments, accounting for additional
technology and fuel costs, and target “green” finance from banks to support these investments.
• Vessel operators could lobby for regulatory changes to support zero carbon fuels uptake and reduce
price differential and make more commercially competitive.
• As fleets transition to alternative fuels, vessel operators will need to ensure the relevant fuels are
available at the ports needed. Early discussions with port operators are required to ensure that the
necessary fuels infrastructure will be in place as they begin to use the new fuels.
• The industry should monitor and support the future development of onboard CCS to ensure that it can be
incorporated in new vessels if the demand arises. However, CCS (including its costs and risks) will not be
needed if a rapid switch to zero carbon fuels is made.
Implications for the global maritime industryTechnological, Operational and Energy Pathways for Maritime Transport to Reduce Emissions Towards 2050
Page 15
15© Ricardo plc
• There are a range of fuel options currently being assessed; multiple pathways of different alternative fuels
could meet IMO’s initial ambition for 2050 (remains to be seen if 2023 update may be tighter)
• The IMO ambition is estimated to be met by all three packages when emissions are calculated on a
well-to-wake basis; but only packages 1 (fuel switch: ammonia, hydrogen) and 3 (greater efficiency
technology emphasis, CCS, + bioLNG, ammonia, methanol) would meet the ambition on a tank-to-wake basis
• Fuel costs are such a large component of total costs, that energy efficiency measures to reduce fuel
consumption are total cost savers (reduced spend on fuel; increased capex spend on vessels; reduced
impact on fuel supply industry)
• The ‘drop-in’ fuel package 2 (biofuel, bio-LNG) which faces fewer barriers to deployment is estimated
to be much more expensive compared to the fuel switches of packages 1 and 3 that would require new
vessel engine investments
• Long vessel lifetimes means emission pathways become locked in for longer (e.g. than road transport) hence
important to act sooner rather than later to effect meaningful change
ConclusionsTechnological, Operational and Energy Pathways for Maritime Transport to Reduce Emissions Towards 2050
Page 16
16© Ricardo plc
[email protected]
Thank you for your attention