Light Flicker from LED Lighting Systems - An Urgent Problem to SolveFlicker is the modulation of a lamp’s light output caused by fluctuations of the mains voltage supply. Recent research has shown that fluctuations of short wavelength emissions are perceived to a higher extent and light flicker may have a huge influence on the well-being of end users. Prof. Georges Zissis, Head of Light & Matter Research Group at the LAPLACE Université de Toulouse presents and discusses the influence of driver topologies, research results, metrics and standards.
Light flicker is one of the so-called Temporal Light Artefacts (TLA) defined as undesired changes in visual perception induced by a light stimulus whose luminance or spectral distribution fluctuates with time for an observer in a certain environment. The second TLA is the stroboscopic effect. Light flicker combined with rotating, moving parts or spatial patterns may be responsible for stroboscopic effects. Stroboscopic effects might induce hazards to workers in proximity to rotating machines and tools. The typical frequency range in which the stroboscopic effect is perceived is from 80 Hz up to 2000 Hz.
With the ever-increasing penetration of light emitting diode lamps in more applications and considering that their mode of operation differs from the legacy technologies, one might expect that light flicker would disappear.
Recent investigations show that some LED lighting products may exhibit anomaly high flicker rates, especially under dimming conditions. While today there are no mandatory regulations, there are some stringent recommendations. This is an important item for both consumer satisfaction and consumer acceptance of Solid State Lighting products.
Light Flicker and its Impact on Health and Well-BeingLight flicker has always been an issue for lamps with possible important health impacts. There are more conditions that are supposed to be sensitive to flicker but regardless of how much they correlate to this, everyone would like to see it minimized. It isn’t uncommon to hear people in offices complain about headaches and dizziness brought on by fluorescent lamps with magnetic ballasts [1, 2]. In fact, research has shown that fluctuations of short wavelength emissions are perceived to a higher extent [3, 4].
It is known that exposure to light flicker (in particular at frequencies between 3 Hz and 55 Hz) can cause photosensitive epileptic seizures in various forms, depending on the individual and his visual pathology, the contrast, the wavelength and the viewing angle or distance. Approximately 1 in 4,000 humans suffer from photosensitive epilepsy. Women and elder people are more sensitive to flicker than men and younger people.
Furthermore, it is known that people who suffer from migraines are more likely to be sensitive to flicker.
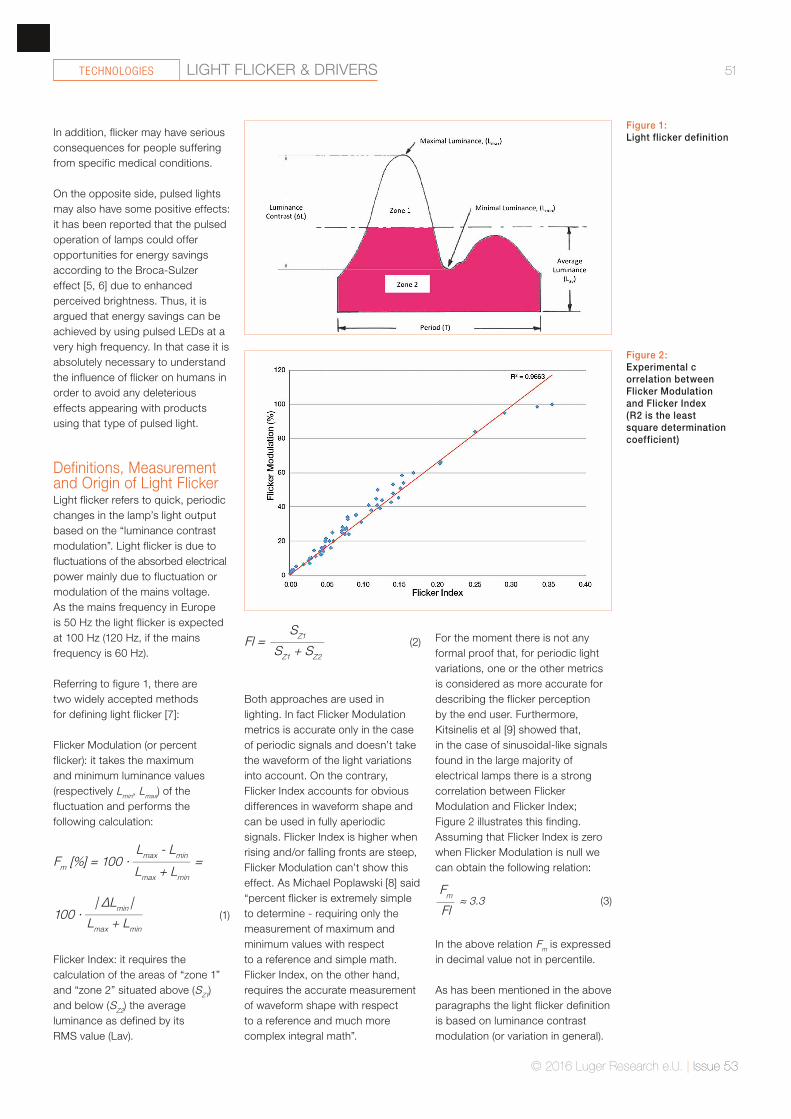
Figure 2: Experimental c orrelation between Flicker Modulation and Flicker Index (R2 is the least square determination coefficient)
Figure 1: Light flicker definition
LIGHT FLICKER & DRIVERSTECHNOLOGIES
In addition, flicker may have serious consequences for people suffering from specific medical conditions.
On the opposite side, pulsed lights may also have some positive effects: it has been reported that the pulsed operation of lamps could offer opportunities for energy savings according to the Broca-Sulzer effect [5, 6] due to enhanced perceived brightness. Thus, it is argued that energy savings can be achieved by using pulsed LEDs at a very high frequency. In that case it is absolutely necessary to understand the influence of flicker on humans in order to avoid any deleterious effects appearing with products using that type of pulsed light.
Definitions, Measurement and Origin of Light FlickerLight flicker refers to quick, periodic changes in the lamp’s light output based on the “luminance contrast modulation”. Light flicker is due to fluctuations of the absorbed electrical power mainly due to fluctuation or modulation of the mains voltage. As the mains frequency in Europe is 50 Hz the light flicker is expected at 100 Hz (120 Hz, if the mains frequency is 60 Hz).
Referring to figure 1, there are two widely accepted methods for defining light flicker [7]:
Flicker Modulation (or percent flicker): it takes the maximum and minimum luminance values (respectively Lmin, Lmax) of the fluctuation and performs the following calculation:
Fm [%] = 100 ∙ Lmax - Lmin________________
Lmax + Lmin
=
100 ∙ | ΔLmin |________________
Lmax + Lmin
(1)
Flicker Index: it requires the calculation of the areas of “zone 1” and “zone 2” situated above (SZ1) and below (SZ2) the average luminance as defined by its RMS value (Lav).
Fl = SZ1_______________
SZ1 + SZ2
(2)
Both approaches are used in lighting. In fact Flicker Modulation metrics is accurate only in the case of periodic signals and doesn’t take the waveform of the light variations into account. On the contrary, Flicker Index accounts for obvious differences in waveform shape and can be used in fully aperiodic signals. Flicker Index is higher when rising and/or falling fronts are steep, Flicker Modulation can’t show this effect. As Michael Poplawski [8] said “percent flicker is extremely simple to determine - requiring only the measurement of maximum and minimum values with respect to a reference and simple math. Flicker Index, on the other hand, requires the accurate measurement of waveform shape with respect to a reference and much more complex integral math”.
For the moment there is not any formal proof that, for periodic light variations, one or the other metrics is considered as more accurate for describing the flicker perception by the end user. Furthermore, Kitsinelis et al [9] showed that, in the case of sinusoidal-like signals found in the large majority of electrical lamps there is a strong correlation between Flicker Modulation and Flicker Index; Figure 2 illustrates this finding. Assuming that Flicker Index is zero when Flicker Modulation is null we can obtain the following relation:
Fm_____
Fl ≈ 3.3 (3)
In the above relation Fm is expressed in decimal value not in percentile.
As has been mentioned in the above paragraphs the light flicker definition is based on luminance contrast modulation (or variation in general).
Figure 3: Experimental set-up for light flicker measurement in LAPLACE laboratory
Figure 4: Schematics of usual LED ballast architecture
LIGHT FLICKER & DRIVERSTECHNOLOGIES
However, luminance measurements are rather difficult to carry out. For this reason Zissis [10] proposed to measure light flicker based on luminous flux time variation instead of luminance contrast modulation. This is a good approximation because it smooth’s the spatial variation of the light emitted by the lamp. The measurement can then be carried out using an Ulbricht integrating sphere equipped by a time resolved light detector.
Figure 3 shows the original set-up at LAPLACE laboratory in Toulouse. This is a very robust way to evaluate light flicker. In this primitive version of the set-up an Ø80 cm integrating sphere was equipped with a selenium cell as a photo-detector coupled to a Tektronix 2002B oscilloscope for detecting and recording the light waveforms and a true-RMS voltmeter for measuring the average light output (in millivolts) independently. The selenium cell has a rather slow answer and thus only low frequency flicker can be detected (up to 1 kHz). Since then the photo-detector was replaced by a rapid photodiode (SLD-70BG2) coupled with a logarithmic amplifier in order to resolve light flicker at higher frequencies (up to 100 kHz).
To compare the light flicker behaviour of different technologies (especially LED omni-directional lamps and LED spots) a 100 W A-shape incandescent lamp has been used as reference. The reference lamp exhibited a 10% Flicker Modulation value at 100 Hz, the light signal was very close to sin2(2πƒt) shape. This is perfectly logical. Light fluctuation in an incandescent lamp is, in fine, due to the variation of filament temperature within a full AC-period; the temperature depends on the Joule heating which is proportional to sin2(2πƒt) and light emission follows Stefan’s law proportional to the 4th power of the filament temperature (thus a small variation within an AC-period is responsible for measurable luminous flux variations at twice the mains frequency). This amount of light flicker at 100 Hz is not perceivable by the human eye.
LED flicker characteristics are primarily a function of the LED driver. However, LEDs have to be driven in DC-current; so, in theory light flicker should be missing. However, a LED lamp uses a driver (CIE official vocabulary imposes the use of term “ballast” instead of
“driver”) that is interfacing the LEDs inside the bulb to the mains plug. Figure 5 shows simple schematics of LED ballast generic architecture. Light flicker is then linked to two facts: (1) residual ripple after the rectifier-filter stage and (2) final stage converter architecture.
Residual ripple is responsible for light flicker at a frequency of twice the mains, whereas, converter architecture usually leads to high frequency flicker (several tens of kilohertz). Low quality, low price, ballasts using passive filters are usually responsible for high light flicker. As US-DoE mentioned [11], a low cost requirement for a small integral LED lamp may force a fundamental trade-off between flicker and the power factor. Add to that, that very often, passive elements used as filters (for instance chemical capacitors) have a low lifespan and a huge impact on the environment [11]. All in all, a large amount light flicker at 100 Hz constitutes a serious indication that ballast quality and reliability are probably unacceptably low.
Dimming a LED source can increase or induce flicker, most notably when phase-cut controls are used and/or pulse-width modulation (PWM) is employed within the driver to reduce the average light output from the LED source.
It should be noted that Kitsinelis et al [13] proposed a very effective way to detect light flicker using the camera of a cellular phone.
Figure 5 shows the obtained results by this method. The simplicity of the method allows its use by the general consumer: just use a smart phone with an integrated camera, target the lamp and look at the phone screen. If striations appear around the lamp (dark fringes), then flicker is present. The spatial frequency of the fringes is related to the flicker frequency and the frame rate of the camera. The contrast between the fringes is a straightforward estimation
of the Flicker Modulation. Generally speaking, when fringes are visible Flicker Modulation is higher than 20%. Large fluctuations (i.e. large flicker) are clearly recorded as striped images on the smartphone display. The stripes tend to fade with lower Flicker Modulation but they can still be detected by fine-tuning the camera settings such as the exposure. Lamps that show no flicker or very small fluctuations will be seen with no fringes on the display and the recorded images.
This easy and quick flicker test with such a widely available tool as a mobile phone may prove useful to consumers seeking to avoid the undesirable effects of flicker even at such non visible frequencies.
Light Flicker Measurement ResultsGlobally, 26 lamps (LED, but also CFLs) have been tested with this device under real operating conditions (230 V 50 Hz pure
LIGHT FLICKER & DRIVERSTECHNOLOGIES
Figure 5: Flicker detection using the built in camera of a cell phone obtained by LAPLACE. Flicker leads to the appearance of dark fringes on the image
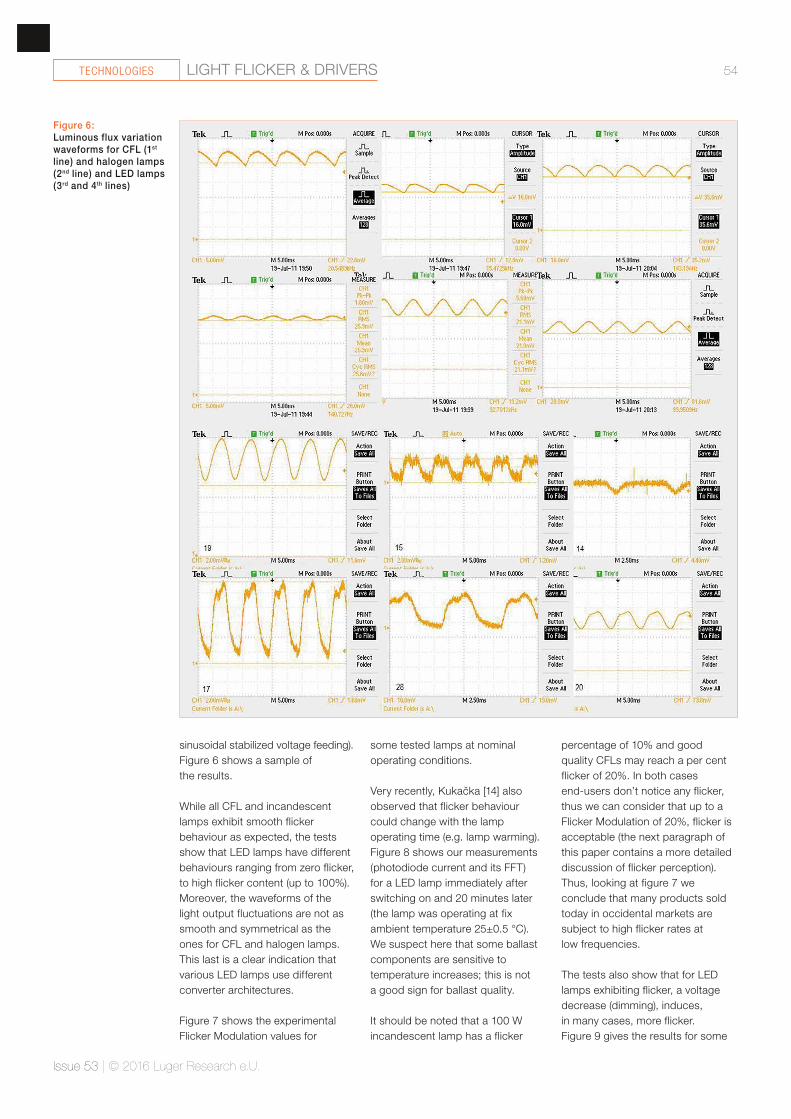
sinusoidal stabilized voltage feeding). Figure 6 shows a sample of the results.
While all CFL and incandescent lamps exhibit smooth flicker behaviour as expected, the tests show that LED lamps have different behaviours ranging from zero flicker, to high flicker content (up to 100%). Moreover, the waveforms of the light output fluctuations are not as smooth and symmetrical as the ones for CFL and halogen lamps. This last is a clear indication that various LED lamps use different converter architectures.
Figure 7 shows the experimental Flicker Modulation values for
some tested lamps at nominal operating conditions.
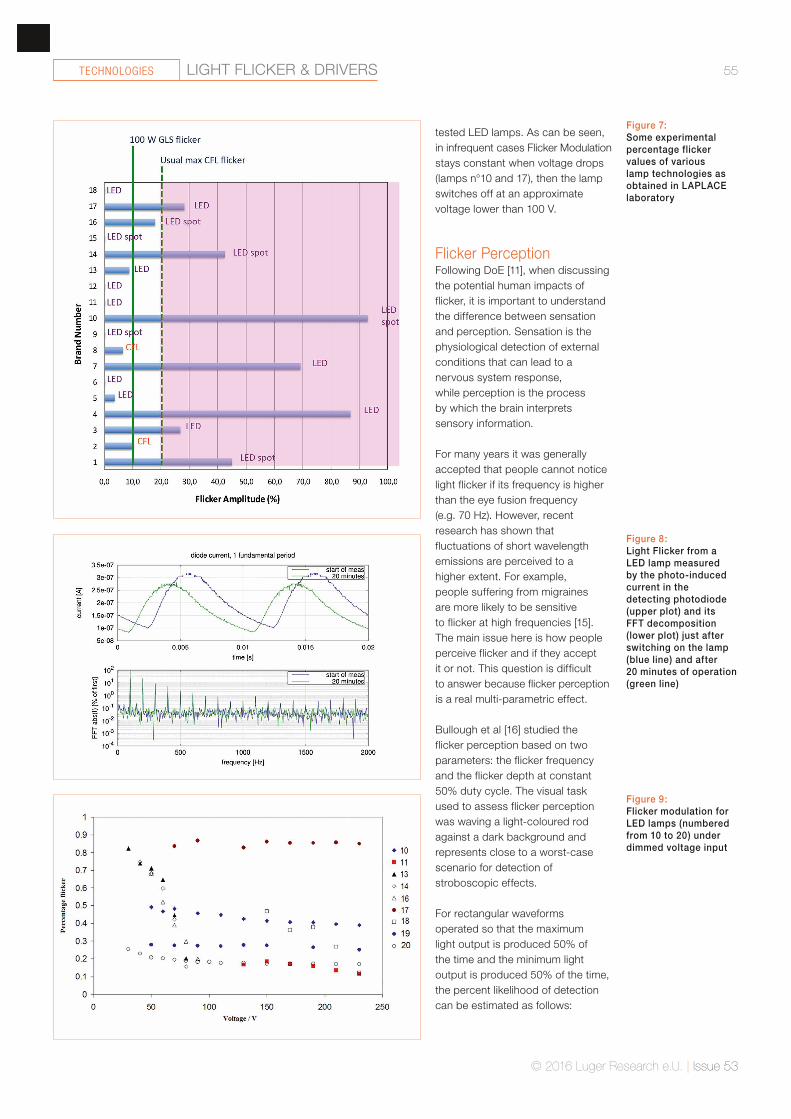
Very recently, Kukačka [14] also observed that flicker behaviour could change with the lamp operating time (e.g. lamp warming). Figure 8 shows our measurements (photodiode current and its FFT) for a LED lamp immediately after switching on and 20 minutes later (the lamp was operating at fix ambient temperature 25±0.5 °C). We suspect here that some ballast components are sensitive to temperature increases; this is not a good sign for ballast quality.
It should be noted that a 100 W incandescent lamp has a flicker
percentage of 10% and good quality CFLs may reach a per cent flicker of 20%. In both cases end-users don’t notice any flicker, thus we can consider that up to a Flicker Modulation of 20%, flicker is acceptable (the next paragraph of this paper contains a more detailed discussion of flicker perception). Thus, looking at figure 7 we conclude that many products sold today in occidental markets are subject to high flicker rates at low frequencies.
The tests also show that for LED lamps exhibiting flicker, a voltage decrease (dimming), induces, in many cases, more flicker. Figure 9 gives the results for some
Figure 6: Luminous flux variation waveforms for CFL (1st line) and halogen lamps (2nd line) and LED lamps (3rd and 4th lines)
tested LED lamps. As can be seen, in infrequent cases Flicker Modulation stays constant when voltage drops (lamps n°10 and 17), then the lamp switches off at an approximate voltage lower than 100 V.
Flicker PerceptionFollowing DoE [11], when discussing the potential human impacts of flicker, it is important to understand the difference between sensation and perception. Sensation is the physiological detection of external conditions that can lead to a nervous system response, while perception is the process by which the brain interprets sensory information.
For many years it was generally accepted that people cannot notice light flicker if its frequency is higher than the eye fusion frequency (e.g. 70 Hz). However, recent research has shown that fluctuations of short wavelength emissions are perceived to a higher extent. For example, people suffering from migraines are more likely to be sensitive to flicker at high frequencies [15]. The main issue here is how people perceive flicker and if they accept it or not. This question is difficult to answer because flicker perception is a real multi-parametric effect.
Bullough et al [16] studied the flicker perception based on two parameters: the flicker frequency and the flicker depth at constant 50% duty cycle. The visual task used to assess flicker perception was waving a light-coloured rod against a dark background and represents close to a worst-case scenario for detection of stroboscopic effects.
For rectangular waveforms operated so that the maximum light output is produced 50% of the time and the minimum light output is produced 50% of the time, the percent likelihood of detection can be estimated as follows:
Figure 7: Some experimental percentage flicker values of various lamp technologies as obtained in LAPLACE laboratory
Figure 8: Light Flicker from a LED lamp measured by the photo-induced current in the detecting photodiode (upper plot) and its FFT decomposition (lower plot) just after switching on the lamp (blue line) and after 20 minutes of operation (green line)
Figure 9: Flicker modulation for LED lamps (numbered from 10 to 20) under dimmed voltage input
where ƒ is the flicker frequency (in Hz) and Fm the Flicker Modulation (in %). This equation is applicable to frequencies from 100 Hz to 10 kHz and for Flicker Modulation values from 5% to 100%.
To assess acceptability of flicker producing noticeable stroboscopic effects, a five-point scale was used. The results suggest that even when stroboscopic effects from flicker were readily detected, they were not always judged as unacceptable. The acceptability rate, a, can be estimated using the following empirical relation:
a [%] = 2 - 4
______________
1 + (f/fb) (5)
where ƒ is the flicker frequency (Hz) and fb the borderline frequency (Hz) between acceptability and unacceptability, that can be given as follows:
fb [Hz] = 130log(Fm - 73) (6)
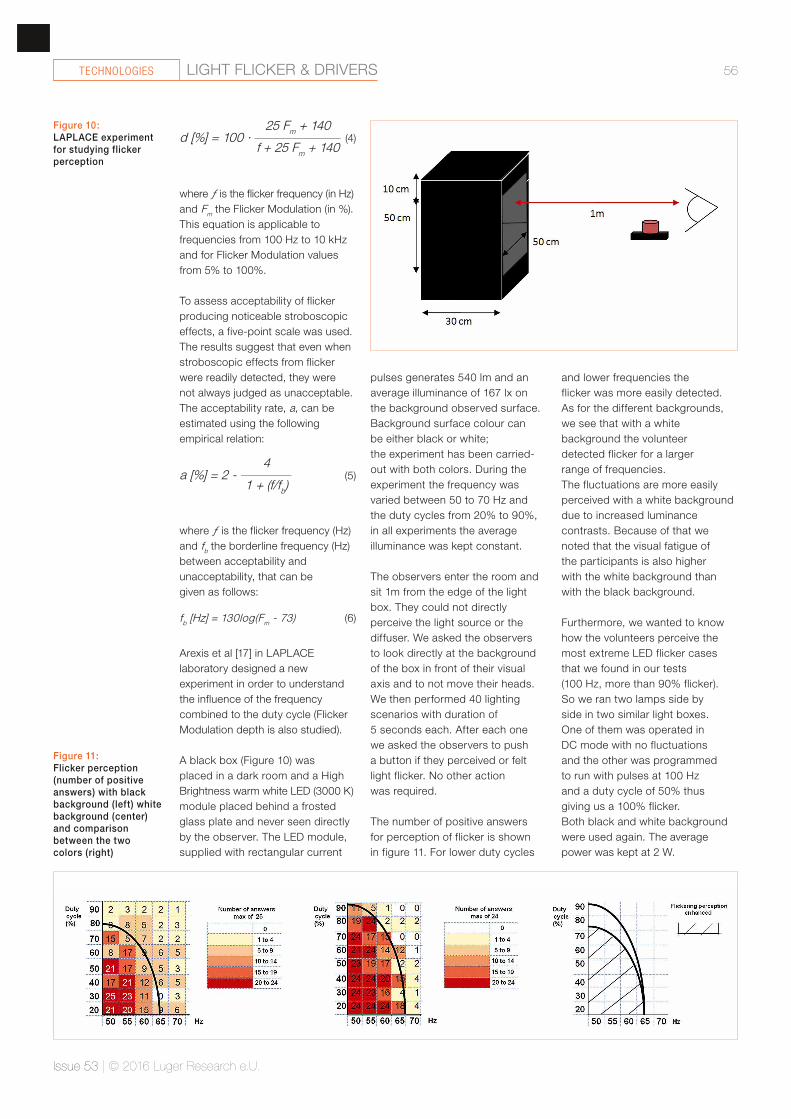
Arexis et al [17] in LAPLACE laboratory designed a new experiment in order to understand the influence of the frequency combined to the duty cycle (Flicker Modulation depth is also studied).
A black box (Figure 10) was placed in a dark room and a High Brightness warm white LED (3000 K) module placed behind a frosted glass plate and never seen directly by the observer. The LED module, supplied with rectangular current
pulses generates 540 lm and an average illuminance of 167 lx on the background observed surface. Background surface colour can be either black or white; the experiment has been carried-out with both colors. During the experiment the frequency was varied between 50 to 70 Hz and the duty cycles from 20% to 90%, in all experiments the average illuminance was kept constant.
The observers enter the room and sit 1m from the edge of the light box. They could not directly perceive the light source or the diffuser. We asked the observers to look directly at the background of the box in front of their visual axis and to not move their heads. We then performed 40 lighting scenarios with duration of 5 seconds each. After each one we asked the observers to push a button if they perceived or felt light flicker. No other action was required.
The number of positive answers for perception of flicker is shown in figure 11. For lower duty cycles
and lower frequencies the flicker was more easily detected. As for the different backgrounds, we see that with a white background the volunteer detected flicker for a larger range of frequencies. The fluctuations are more easily perceived with a white background due to increased luminance contrasts. Because of that we noted that the visual fatigue of the participants is also higher with the white background than with the black background.
Furthermore, we wanted to know how the volunteers perceive the most extreme LED flicker cases that we found in our tests (100 Hz, more than 90% flicker). So we ran two lamps side by side in two similar light boxes. One of them was operated in DC mode with no fluctuations and the other was programmed to run with pulses at 100 Hz and a duty cycle of 50% thus giving us a 100% flicker. Both black and white background were used again. The average power was kept at 2 W.
Figure 10: LAPLACE experiment for studying flicker perception
Figure 11: Flicker perception (number of positive answers) with black background (left) white background (center) and comparison between the two colors (right)
• With both black and white background 16 out of 16 volunteers noted that the pulsed LED was brighter (Broca - Sulzer effect)
• 15 out of 16 volunteers did not perceive a light fluctuation with any background colour. More especially, 8 out of 8 did not perceive a fluctuation with the white background and 7 out of 8 volunteers did not perceive a light fluctuation with the black background (the one that perceived it was correct in identifying the pulsed lamp)
• When both lamps were set to pulse (100 Hz, 50% duty cycle) with different backgrounds then all our volunteers agreed that the white background gives a higher brightness impression, and two noted a fluctuation with the black background
There are two important points here. The first one is that the pulsed operation of LED lamps can indeed give us energy savings if people perceive them as brighter for the same power input. The second point here is that although in our visual perception experiment the white background made it easier for flicker to be detected, in the 100 Hz test this was no longer relevant and in fact the mobile phone camera and three volunteers detected it with the black background.
In her PhD thesis, Arexis [18] tried to identify the combinations of [frequency, duty cycle] that flicker is not perceivable by end-users (the sample size was in the order of 500 people).
To achieve that study four situations were defined as follows:
• Situation 1: 0% of end-users perceive flicker
• Situation 2: 5% of maximum end-users perceive flicker
• Situation 3: 20% of maximum end-users perceive flicker
• Situation 4: at least 50% of end-users perceive flicker
Using the obtained answers a Pareto optimality procedure was used in order to define the [frequency, duty cycle] areas that flicker is not perceivable. Pareto optimality is a state of allocation of resources in which it is impossible to make any one individual better off without making at least one individual worse off. To achieve this classification Arexis used the work of Villa et al [19] based on NSGA-II genetic algorithm. Figure 12 shows an example of results obtained by this method. As can be seen, the Pareto solutions are organized in 7 distinct islands: Island 7 corresponds to situation 1 (no flicker perception), Islands 5 and 6 to situation 2 (almost imperceptible flicker), Island 4 to the situation 3 (perceptible flicker) and Islands 1 and 3 correspond to situation 4 (noticeable flicker). This type of classification allows choosing power supply characteristics in such a way in order to avoid flicker and achieve energy savings.
Flicker and StandardsAs has seen in the above paragraphs flicker is a very important issue that could implead SSL technology adoption from the general public. However, for the moment, no regulation of light flicker is really implemented in various world-region regulations. Flicker requirements could significantly improve commercial lamp evaluation for flicker, but in Energy Star® only apply to
dimmable lamps within Energy Star requirements [20]. This is not an acceptable situation that scientists and policy makers tend to remediate.
In the absence of flicker metrics and waveforms, specifiers can pursue qualitative means for evaluating flicker. Specifiers should consider how the risk of flicker-related problems is heightened or reduced by a given light source, the type of space, its occupants, and the tasks being performed. In fact, flicker effects can be different following the executed task by the end-user. For static tasks or tasks with moderate eye motion limiting FI at values lower than 0.5 should fine. In the case of more stringent tasks implying rapid movement of objects or visual fixation locations, FI should be lower than 0.1. The case of confined environments has to be considered apart.
A first attempt to provide a generally accepted standard was to limit flicker passing through a maximum acceptable Flicker Index as a function of frequency within the 100 Hz to 800 Hz range following a linear relation:
max (Fl) = 0.001 ∙ f (7)
where ƒ is the flicker frequency expressed in hertz. This criterion leads to FI<1,2 for USA at 120 Hz and FI<1,0 at 100 Hz for Europe. The rationale used by the US Environmental Protection Agency (EPA) to establish that limit appears to originate from experiments on high-quality conventional light
Figure 12: Pareto optimal solutions obtained by Arexis. The numbers indicate distinct “islands” in the [frequency, duty cycle] domain based on the 4 zones assumption (0%, 5%, 20%, 50%)
sources, including CFLs, performed by the US Department of Energy (DoE); in this work, the highest FI value is 0.11 for magnetically ballasted CFLs. For the moment this requirement is still not included in the last version Energy Star requirements [20].
The Institute of Electrical and Electronics Engineers (IEEE) P1789 committee who has been working on light flicker for several years has recently published recommendations based Flicker Modulation metrics [21]. Figure 13 shows the proposed limits by Lehman and Wilkins [22]. It is more appropriate to refer to flicker based on fd as the dominant flicker frequency (the term “dominant frequency” is used at two instances in IEEE 1789 recommended practice 2 [25] but not defined in the text). Furthermore, the IEEE recommendation fixes 90 Hz as cut-off frequency. This may be seen as a bad choice
because it leads to the rejection of “European flicker” at 100 Hz but not “US flicker” at 120 Hz. This recommendation leads to a Flicker Modulation up to 8.0% at 100 Hz and 9.6% at 120 Hz.
It should be underlined that IEEE 1789 is a recommendation and in any case can’t be seen as a flicker measurement standard. In fact, we don’t know how to handle complex waveforms with several Fourier components at different frequencies. IEEE 1789 suggests using spectral analysis based on Fourier transform but the “integrated criterion” is still an open area of research. IEEE 1789 suggests an algebraic sum but also mentions other integration methods (Minkowski norm for instance).
International Energy Agency 4E-SSL annex is now working also to establish flicker criteria inspired by the above IEEE recommendation.
The proposed criteria will be adapted to the “tier concept” proposed in the annex. These recommendations will be published sometime in 2016 in the next version of Performance Criteria. More information can be found at ssl.iea-4e.org web page.
More recently, Bullough and Marcus [23] conducted a study in which different temporal flicker waveforms at several frequencies, suggested that Flicker Index was a superior metric for characterizing stroboscopic effects than percent flicker. This is going to the opposite way of the IEEE standard.
In addition, NEMA in its position paper [24] asserts that current TLA standardization is hampered by lack of adequate TLA assessment metrics and that new flicker metrics and associated measurement methods for lighting are required. It is also underlined that this could add unnecessary cost to the electronics gears that may be not really justified.
Today, as per DoE advice [20], “…in the absence of flicker metrics LED systems should always be visually evaluated, ideally with flicker-sensitive clients. Waving a finger or pencil rapidly under the LED source, or spinning a flicker wheel, can expose the presence of flicker through the stroboscopic effect, even for those who are not naturally sensitive…” We should express the wish that a formal world acceptable standard will be adopted before “toxic”, low quality products and unscrupulous sellers poison the market.
Figure 13: Flicker Modulation depth as a function of flicker frequency. Flicker modulation is given for no effect level (green) and low risk level (yellow)
LIGHT FLICKER & DRIVERSTECHNOLOGIES
New Cree® XLamp® XQ-E High Intensity Color LEDs Offer Highest Candela Per formanceXLamp® XQ-E High Intensity LEDs are the industry’s first family of color LEDs optimized to deliver the highest candela performance. The XQ-E High Intensity LED is the smallest building block for color LED designs, allowing lighting manufacturers to boost performance and reduce size for directional applications.
For additional information, please visit www.cree.com/xlamp/xqehi
References:[1] Berman S.M., D.S. Greenhouse, I.L. Bailey, R. Clear and T.W Raasch, Human electroretinogram responses to
video displays, fluorescent lighting and other high frequency sources. Optometry and Vision Science 68(8), 645-662, 1990
[2] Wilkins A.J., I.M. Nimmo-Smith, A. Slater and L. Bedocs, Fluorescent lighting, headaches and eye-strain, Lighting Research and Technology, 21(1), 11-18, 1989
[3] Wilkins A.J., C. Clark, Modulation from fluorescent lamps, Lighting Research and Technology 22(2), 103-109, 1990
[4] Wilkins A.J., P. Wilkinson, A tint to reduce eye-strain from fluorescent lighting, Preliminary observations, Ophthalmic and Physiological Optics, 11, 172-175, 1991
[5] Hart WM Jr., Adler’s physiology of the eye. Clinical application. Editors R.A. Moses RA, W.M. Hart, The C. V. Mosby Company St Louis, 1987
[6] Jinno M., K. Morita, Y. Tomita Y. Toda, H. Motomura, Journal of Light and visual environment 32(2), 2008[7] Rea, M.S. (editor). IESNA Lighting Handbook: Reference and Application, 9th edition. New York: Illuminating
Engineering Society, 2000[8] Poplawski, M., N.J. Miller, Exploring flicker in Solid-State Lighting: What you might find, and how to deal with it,
Pacific Northwest National Laboratory, 2010 - http://www.e3tnw.org/Documents/2011%20IES%20flicker%20paper%20poplawski-miller-FINAL.pdf
[9] Kitsinelis S., G. Zissis, L. Arexis, A study of flicker of commercial lamps, Light & Engineering 20(3) pp 25-33, 2012
[10] Zissis G., S. Kitsinelis, L. Arexis, Etude comparative des effets stroboscopiques d’un échantillon de systèmes d’éclairage, Final Rapport, ANSES Convention 2010-CRD-22, 2011
[11] US Department of Energy, Solid-State Lighting Technology Fact Sheet: Flicker, Building Technologies Office, PNNL-SA-94791, March 2013
[12] Tähkämö L., M. Bazzana, P. Ravel, F. Grannec, Ch. Martinsons, G. Zissis Life cycle assessment of light-emitting diode downlight luminaire—a case study, International Journal of Life Cycle Assessment 18(1), DOI 10.1007/s11367-012-0542-4, 2013
[13] Kitsinelis S., G. Zissis, Proceedings of 13th Int. Symposium on the Science and Technology of Lighting Systems, pp. 363-364, Troy NY (USA), 24-29 July 2012
[14] Kukačka L., P. Dupuis, G. Zissis, M. Kolàĭ, Retrofit LED Lamps - Photometric Flicker Analysis, Proceedings 50th IEEE IAS Annual Meeting, 18-22 October 2015, Dallas TX (USA).
[15] Shady S., D.I.A. MacLeod, H.S. Fisher, Proceedings of the National Academy of Sciences (PNAS), 101(14): 5170-5173, 2004,
[16] Bullough J. D., K. Sweater Hickcox, T. Klein, A. Lok, N. Narendran, Flicker Parameters for Reducing Stroboscopic Effects from Solid-state Lighting Systems, ASSIST recommends 11(1), May 2012
[17] Arexis-Boisson L., S. Kitsinelis, G. Zissis, J. Salon, S. Martin, N. Ouahhabi, Visual Perception of LED Flickering Controlled in a Colored Environment, Journal Light & Visual Environment 37(4), pp. 183-188, DOI IEIJ130000504, 2014
[18] Arexis, L. Etude et optimisation d’un système d’éclairage efficace énergétiquement et adapté aux besoins de ses utilisateurs (santé, sécurité et qualité de vie), Thèse de l’Université de Toulouse, 19 june 2014.
[19] Villa C., Labayrade R., Multiobjective optimisation of lighting installations taking into account user preferences - a pilot study, Lighting Research and Technology, 45(2), pp. 176-196, DOI 10.1177/1477153511435629, 2013
[20] ENERGY STAR® Program Requirements for Lamps (Light Bulbs) V2.0-Draft 3, 4 September 2015 - http://www.energystar.gov/sites/default/files/ENERGY%20STAR%20Lamps%20V1%201_Specification.pdf
[21] IEEE, Standard 1789-2015 - IEEE Recommended Practices for Modulating Current in High-Brightness LEDs for Mitigating Health Risks to Viewers, June 2015
[22] Lehman B., A.J. Wilkins, Designing to Mitigate the Effects of Flicker in LED Lighting: Reducing risks to health and safety, IEEE Power Electronics Magazine, pp. 18-26, DOI 10.1109/MPEL.2014.2330442, September 2014
[23] Bullough, J. D., D. Marcus, Influence of flicker characteristics on stroboscopic effects. Lighting Research and Technology, doi: 10.1177/1477153515599566, 2015.
[24] NEMA, Temporal Light Artifacts (Flicker and Stroboscopic Effects), A NEMA Lighting Systems Division Position Paper, 15 June 2015 - https://www.nema.org/news/Pages/NEMA-Lighting-Systems-Division-Publishes-Position-Paper-on-Temporal-Light-Artifacts.aspx


![Driving the Flicker-Free Effect...An average person will generally not see light flicker between 60Hz-90Hz and is known as the critical flicker fusion frequency (CFF)[3]. When light](https://static.documents.pub/doc/80x56/5eaa66036d10e71f9a796a89/driving-the-flicker-free-effect-an-average-person-will-generally-not-see-light.jpg)


