13
TECHNOLOGY DISRUPTORS IN TOURISM OCTOBER 2019 Image courtesy of Getty Images
TECHNOLOGY DISRUPTORS IN TOURISM
OCTOBER 2019
Image courtesy of Getty Images

TECHNOLOGY DISRUPTORS IN TOURISM TOURISM RESEARCH AUSTRALIA2
INTRODUCTIONNew technologies have the potential to enhance and challenge sectors of the tourism industry, changing the way operators target travellers, disrupting existing service offerings and forcing a re-imagining of the visitor experience and the end-to-end visitor journey.
The accommodation and aviation sectors have already experienced significant disruption from digital technology. The next wave of disruption is expected to impact the shopping, tours and food and beverage sectors, through growth in the sharing economy, emerging payments platforms, and augmented reality (AR) and virtual reality (VR).
The entertainment and transport sectors will likely continue to evolve as next wave technologies emerge. Tours could take on a theatrical aspect, using a combination of storytelling, historical and future imagery using AR. Transport, meanwhile, will see significant impacts from continuing progress towards autonomous vehicle technology.
Given the nature of disruptive technologies and the challenges of predicting how they will affect existing businesses, traditional operators may need to adapt in order to be competitive. The five technologies discussed in this report are not sector specific. All five are currently available to tourists, and their impact on the tourism sector (both immediate and potential) is emerging as take-up increases.
SOCIAL MEDIA
While Facebook, Twitter, Instagram and Snapchat are the most recognised examples, social media also includes the following:
n YouTube, Flickr, Lonely Planet blogs, personal blogs and individual websites that enable development and sharing of new content
n Wikitravel, Lonely Planet forums, Whirlpool and Fodor’s Travel Talk which share editable content and knowledge in a social way
n TripAdvisor and Yelp that enable individuals to review or rate companies, experiences or locations.
SHARING ECONOMY
Sharing economy platforms include online such as Airbnb, Uber and Deliveroo. These platforms have had considerable success in providing new accommodation, transport and food service offerings to travellers, but in the process have caused major disruptions to traditional operators.
NEW PAYMENT PLATFORMS
App based payment systems and Tap’n’Go technology are offering rapid, secure transactions that move payment to the background, rather than interfering with customer experiences. Some examples include PayPal, PayWave, PayPass, Apple Pay, Union Pay and Alipay.
VISITOR TRACKING
Using devices or apps to track movements can offer visitors real time information on travel and waiting times and provide personal reviews on nearby offerings. Operators can use the data to adapt their offerings to better meet visitor expectations.
AUGMENTED REALITY AND VIRTUAL REALITY
Pokémon Go, a mobile-based game, is a recent example of augmented reality. Although not developed specifically for tourism, it took a tourism slant by directing players to local landmarks in order to ‘catch’ Pokémon.
Virtual reality has been used in tourism through Tourism Australia’s app, Australia in 360˚ which allows users to experience our country in immersive videos. The accommodation sector offers virtual tours of hotels and hotel rooms.
3TECHNOLOGY DISRUPTORS IN TOURISM TOURISM RESEARCH AUSTRALIA
SOCIAL MEDIA AR/VR VISITOR TRACKING
SHARING ECONOMY
NEW PAYMENT PLATFORMS
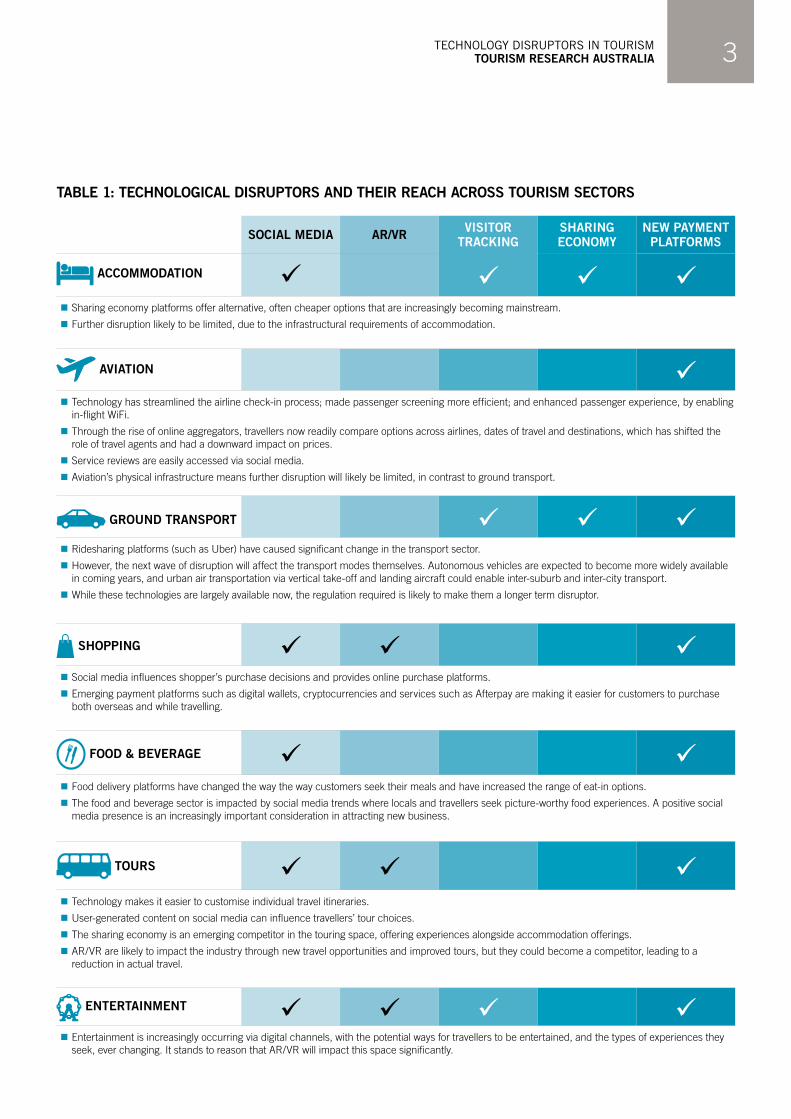
ACCOMMODATION n Sharing economy platforms offer alternative, often cheaper options that are increasingly becoming mainstream.
n Further disruption likely to be limited, due to the infrastructural requirements of accommodation.
AVIATION n Technology has streamlined the airline check-in process; made passenger screening more efficient; and enhanced passenger experience, by enabling in-flight WiFi.
n Through the rise of online aggregators, travellers now readily compare options across airlines, dates of travel and destinations, which has shifted the role of travel agents and had a downward impact on prices.
n Service reviews are easily accessed via social media.
n Aviation’s physical infrastructure means further disruption will likely be limited, in contrast to ground transport.
GROUND TRANSPORT n Ridesharing platforms (such as Uber) have caused significant change in the transport sector.
n However, the next wave of disruption will affect the transport modes themselves. Autonomous vehicles are expected to become more widely available in coming years, and urban air transportation via vertical take-off and landing aircraft could enable inter-suburb and inter-city transport.
n While these technologies are largely available now, the regulation required is likely to make them a longer term disruptor.
SHOPPING
n Social media influences shopper’s purchase decisions and provides online purchase platforms.
n Emerging payment platforms such as digital wallets, cryptocurrencies and services such as Afterpay are making it easier for customers to purchase both overseas and while travelling.
FOOD & BEVERAGE n Food delivery platforms have changed the way the way customers seek their meals and have increased the range of eat-in options.
n The food and beverage sector is impacted by social media trends where locals and travellers seek picture-worthy food experiences. A positive social media presence is an increasingly important consideration in attracting new business.
TOURS n Technology makes it easier to customise individual travel itineraries.
n User-generated content on social media can influence travellers’ tour choices.
n The sharing economy is an emerging competitor in the touring space, offering experiences alongside accommodation offerings.
n AR/VR are likely to impact the industry through new travel opportunities and improved tours, but they could become a competitor, leading to a reduction in actual travel.
ENTERTAINMENT n Entertainment is increasingly occurring via digital channels, with the potential ways for travellers to be entertained, and the types of experiences they seek, ever changing. It stands to reason that AR/VR will impact this space significantly.
TABLE 1: TECHNOLOGICAL DISRUPTORS AND THEIR REACH ACROSS TOURISM SECTORS

TECHNOLOGY DISRUPTORS IN TOURISM TOURISM RESEARCH AUSTRALIA4
SOCIAL MEDIASocial media is now a mainstream platform for sharing information and enabling targeted marketing. Globally, more than 3 billion people – almost half of the world’s population – are active consumers of social media with around 1 million new users being added each day.
The peak impact of social media on the tourism industry will be reached within the next five years. This is expected to have modest positive impacts on tourism industry revenue and substantially benefit the decision making of domestic travellers.
CURRENT USEPlatforms such as Facebook, Twitter, Instagram and Snapchat are now integral to the travel experience, allowing users to share their travel experiences and photos (including food, landmarks and attractions) with family, friends and followers in real time:
n The majority (72%) of people post holiday photos on social media while travelling.1
n Social media influenced 36% of domestic travellers, most often on where they chose to go (19%) or where they stayed (12%).
n Social media usage increased during travel relative to their normal day-to-day usage, especially when travelling for a holiday.
n Younger people were more likely to turn to social media for information, while older cohorts were more likely to access visitor information centres. Those aged 35-44 were just as likely to use either source of information while travelling.
While 85% of Australians continue to engage with social media, daily usage has dropped to 55% and is now close to 2014 levels. This means it could lose its effectiveness as a marketing channel.
Consumers are increasingly expecting a social media presence from tourism suppliers, along with the ability to communicate with them quickly. In today’s online world, 52% of small businesses respond to customer enquiries and complaints within 10 minutes. One-third of businesses consider 10 minutes to be the ideal timeframe.2
FUTURE USEThere has been a shift away from sharing personal content, with communication moving towards sharing articles and memes.
This means social media in the future will include more visual content, more mobile-native platforms, incorporation of AR/VR and greater opportunity for users to opt for ‘premium’ or advertisement-free content.
One-quarter of domestic travellers expect to be using social media more in the next five years for tourism decisions.
BARRIERS AND CHALLENGES
Increased online use has been shadowed by increased privacy concerns. The main concerns for domestic travellers in relation to social media use include:
n security of personal information (43% of respondents)
n the quality of internet connections (39%)
n mobile data costs (33%).
While 60% of domestic travellers cited the benefits of being able to provide feedback to tourism suppliers, this can be detrimental if businesses receive poor ratings. There is also a significant investment to successfully manage brands.
Risks also abound when tourists visit through a digital lens. Travellers seeking photo opportunities can cause management problems at some locations, e.g. the Instagram-famous Wedding Cake Rock in the Royal National Park in NSW has seen visitors putting their life at risk seeking the perfect photo.3
BENEFITS AND OPPORTUNITIES
Over one-third (36%) of domestic travellers consider a key benefit of social media is its use as a channel for seeking recommendations from family and friends.
International markets are shifting towards using social media platforms to advertise:
n The US’ total spend on advertising on social media grew from 25% in 2014 to 33% in 2018.4
n The UK increased social media spending from 8% in 2005 to 48% in 2016.5
Social media can lead to valuable opportunities for tourism operators and destinations. As a result of its reputation on social media, Lake Tyrrell in Victoria (also known as the sky mirror) has attracted significant numbers of Chinese tourists, resulting in local and government investment in infrastructure to support an otherwise struggling regional area.6
As social media evolves, the ability to stand out creatively and technologically will become more important in attracting and engaging travellers. The tourism industry will also need to be mindful of the impact of social media on consumer expectations. Delivering meaningful experiences will involve managing the expectations of consumers who want to mirror what they’ve seen online.
5TECHNOLOGY DISRUPTORS IN TOURISM TOURISM RESEARCH AUSTRALIA
THE SHARING ECONOMYEmpowered by developments in communications technology, sharing economy platforms such as Airbnb and Uber have taken off globally, streamlining transactions, lowering costs and providing new accommodation, transport and food service offerings to travellers.
The peak impact of the sharing economy on the industry will be within the next five years. It should have a large positive impact on revenue, improving customer experiences and on domestic travellers’ decision making.
CURRENT USE AMONG DOMESTIC TRAVELLERS
n Half (49%) of domestic travellers have used sharing economy services while travelling.
n One-third have used accommodation platforms (32%) or ride sharing platforms (27%) during their domestic trip.
n Younger people were more likely to use accommodation and ride sharing platforms while travelling, with the majority being aged 18-34.
n Usage was higher among those utilising other technologies (such as social media, visitor tracking and AR/VR) while travelling.
n Thirty-seven per cent of holiday and 38% of business travellers used accommodation platforms, while 31% of holiday and 44% of business travellers used ride sharing platforms – slightly more than other visitor types.
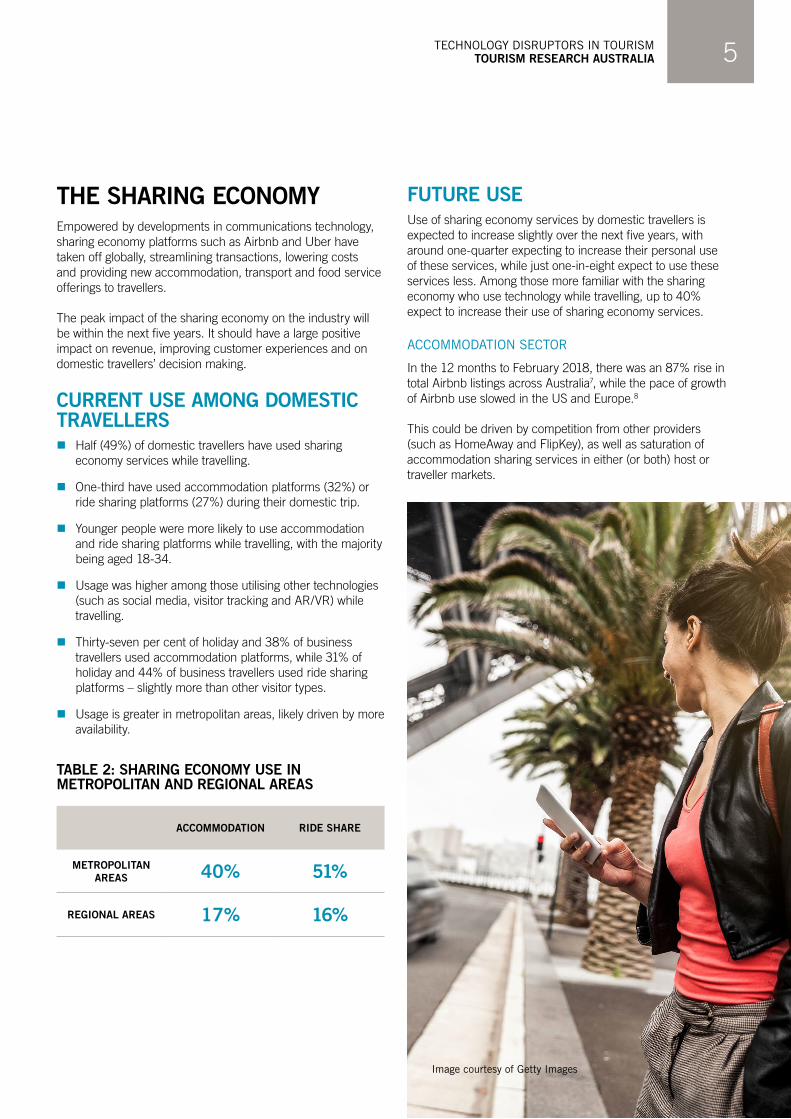
n Usage is greater in metropolitan areas, likely driven by more availability.
TABLE 2: SHARING ECONOMY USE IN METROPOLITAN AND REGIONAL AREAS
ACCOMMODATION RIDE SHARE
METROPOLITAN AREAS 40% 51%
REGIONAL AREAS 17% 16%
FUTURE USEUse of sharing economy services by domestic travellers is expected to increase slightly over the next five years, with around one-quarter expecting to increase their personal use of these services, while just one-in-eight expect to use these services less. Among those more familiar with the sharing economy who use technology while travelling, up to 40% expect to increase their use of sharing economy services.
ACCOMMODATION SECTOR
In the 12 months to February 2018, there was an 87% rise in total Airbnb listings across Australia7, while the pace of growth of Airbnb use slowed in the US and Europe.8
This could be driven by competition from other providers (such as HomeAway and FlipKey), as well as saturation of accommodation sharing services in either (or both) host or traveller markets.
Image courtesy of Getty Images
TECHNOLOGY DISRUPTORS IN TOURISM TOURISM RESEARCH AUSTRALIA6
BARRIERS AND CHALLENGES
Thirty-nine per cent of survey respondents cited the need to trust strangers as one of the main barriers related to the sharing economy, and 39% cited issues with personal safety.
From the other side, regulation, city planning or simply consumer responses to public environmental concerns could pose threats to transport sharing services in the medium term. Within the Melbourne CBD and inner-city, ‘short-term residents were more than three times more likely to be subject to complaints about behaviour than long-term ones’.13
Ride sharing could be contributing to greater, rather than lesser, traffic, carbon emissions and declines in public transport use.14 In the Boston metro area, over 40% of transport sharing services users would have taken public transport if Uber or Lyft had not been available, and 12% would have walked or biked.15
Many Australian cities are considering regulation, with South Australia and Tasmania the only states that have regulated short-term rentals through Airbnb. NSW planning policymakers and regulators are also responding. In June 2018, the NSW Government announced reforms to impose a 180-day cap on the number of days that empty properties can be rented in Sydney, and to give strata corporations the power to ban Airbnb in their buildings. Airbnb hosts must also submit data to the Department of Fair Trading.16
BENEFITS AND OPPORTUNITIES
For those who have used sharing economy services, the top three benefits are:
n saving money (identified in the top 3 by 53% of respondents)
n the large range of offerings (40%)
n ease of use (40%).
The lower average price of sharing economy listings may encourage people to travel who otherwise could not have afforded hotel accommodation, or encourage more frequent travel, larger groups travelling together, longer trips or more days/nights spent in one location. Airbnb properties in central Sydney are, on average, $88 cheaper per night, while this difference is $50 per night outside central Sydney.17
Forty-one per cent of respondents to an earlier study agreed that sharing economy accommodation increases the frequency of their travel, mainly due to the social aspects of its use, while a 2016 survey undertaken across the US and Europe showed that 2% of trips would not have been taken if not for Airbnb.18
Ride sharing benefits also go beyond the financial:
n Shorter wait times – The more efficient matching systems of UberX is reducing customer wait times, enabling tourists to devote more time actively engaging at tourism destinations or visiting more locations.
n Safety – Most transport sharing services address safety concerns through identification of drivers and passengers, and the ability for passengers to share a real-time mapped route of their trip with friends and family.
n Coverage – 64% of Uber rides start in ‘transport deserts’ located 800m or more from medium frequency public transport19, and three-quarters of Airbnb properties in major Australian markets are located outside traditional tourist areas.20 Where these are not well integrated with existing ground transport, Uber could be playing a direct role in facilitating greater visitation in local areas ‘off the beaten track’.
There is a broader strategy, delivered via Airbnb Experiences, to expand Airbnb beyond a ‘home sharing company’ to an ‘end-to-end travel company’ matching seekers and providers of tourist activities such as cooking classes and walking tours. Airbnb Experiences is currently available through an app in 60 cities worldwide with around 5,000 tourist activities (generating $2 million in revenue in 2017).21
TRANSPORT SECTOR
Ride sharing is expected to reach 30% market share by 2019–20.9 If this were the case, ride sharing revenues in Australia would near $1.65 billion.
Ride sharing companies are also branching out into other transport modes. For example, Uber has launched boat-hailing services in Egypt and Croatia, and has operated helicopters in the south of France since 2016.10 In India and Pakistan, rickshaws and motorcycles are similarly available on Uber.
Once autonomous vehicles (AVs) reach commercial adoption, ride sharing and car sharing is predicted to converge as they both target similar customers; those who want the convenience and cost savings of accessing a ride or car nearby.11
Commercial adoption of AVs will begin around 2020 in Australia and AVs will make up around 50% of vehicles sales and around 40% of vehicle travel by 2040.12

7TECHNOLOGY DISRUPTORS IN TOURISM TOURISM RESEARCH AUSTRALIA
NEW PAYMENT PLATFORMSPayment platforms, such as PayPal, Tap’n’Go technology and dedicated apps are reducing friction at the point of sale, providing tourists ready access to goods and services. While use is widespread, tourism is leading the way, with payment for Uber rides, Deliveroo meals or Airbnb stays being discrete automatic activities separate from services provided.
Key developments relevant to tourism include:
n digital wallets – apps that store your credit/debit card information to make contactless payments using a smartphone, as well as making online shopping checkout a quicker and easier experience (similar to PayPal)
n mobile point of sale – tapping a smartphone (linked to a ‘digital wallet’) over a card terminal rather than a physical card
n Near Field Communications (NFC) – a way for smartphones to interact with another device within a radius of about 4 cm, wirelessly. It does not need an internet connection.
CURRENT USEDomestic travellers have shifted away from using cash to pay for holidays over the last decade. Almost 80% of payments for holidays were made by card in 2017.22
Contactless technology is now the preferred day-to-day method of payment for 51% of Australian consumers,23 but smaller amounts ($1 to $10) are more likely to be cash payments.24
There are likely to be similar factors driving payment methods during domestic travel.
As far as platforms go, more than one-third of domestic travellers used Tap’n’Go technology while travelling, and almost half used PayPal, though other emerging payment platforms are not as well known or used.
International visitors were more likely to use Apple Pay, PayPal, Union Pay and Alipay while travelling in Australia, compared with domestic travellers.
The preference for payment platforms changed with nationality:
n New Zealand respondents preferred PayWave, PayPass or other Tap’n’Go technologies (27%)
n US (36%) and the UK (26%) were the most likely to use PayPal (36% and 26%, respectively)
n Chinese visitors preferred Union Pay (65%) and Alipay (55%)
n Japanese visitors preferred Apple Pay (22%).
FUTURE USEThe emerging systems will have an overall positive impact on reducing costs, increasing revenue and improving customer experiences in the domestic tourism industry.
Travellers anticipate that their use of emerging payment systems in future will be at or above current levels. One-quarter of domestic respondents expect the use of emerging payment services to increase in the future – this increases to 45% for international visitors.
Among Chinese visitors, almost three-quarters expect to use more emerging payment services in the future. The travel and retail sectors have recognised the opportunity presented by this market and have introduced new payment options:
n Fashion brands such as Cue, Dion Lee and Veronika Maine now accept Alipay and WeChat in Australian stores. During Chinese New Year, Australia was the biggest market for cross-border WeChat payments outside of Asia.24
n State and territory tourism organisations have encouraged local businesses to adopt Chinese tourists’ preferred payment platforms, and to advertise their destinations on these payment platforms.
BARRIERS AND CHALLENGES
Security is a major concern for those travelling overseas – in fact, 83% of millennials changed their travel behaviour when they carried large amounts of cash overseas. They were less likely to open their wallets in the presence of others, were reluctant to leave their bags at accommodation and hid money on their person.26 Likewise, over one-quarter (27%) of domestic travellers identify security as one of the barriers to travel. The use of emerging payment platforms, therefore, can be an attractive option.
The shift towards digital wallets substituting physical cash can alleviate safety concerns and improve the visitor experience, with stolen wallets able to be blocked remotely.
However, the slow and inconsistent roll out of these technologies mean that consumers are not able to use digital wallets and NFC even if they want to.
FOR TRAVELLERS
Personal habits, such as using card or cash for payments, can be a barrier to travellers adopting these technologies, as can surcharges. Lack of awareness or exposure to the technologies may contribute to privacy or safety concerns regarding the technology. Increasing familiarity with emerging payment platforms can help to overcome existing concerns and lead to increased use of these technologies.
TECHNOLOGY DISRUPTORS IN TOURISM TOURISM RESEARCH AUSTRALIA8
FOR TOURISM OPERATORS
Emerging payment platforms have the potential to bring increased and new streams of revenue for tourism suppliers. The challenges over the next five to 10 years will be:
n determining if the benefits of allowing consumers more ways to pay justifies the costs of making them available
n ensuring support from banks and financial institutions of the chosen platform
n managing the security of transactions.
BENEFITS AND OPPORTUNITIES
Domestic travellers reported the top benefits of emerging payment platforms as:
n being cashless (cited by 43% of respondents)
n allowing them to pay how they want to (38%)
n convenience when travelling (37%).
DIGITAL WALLETS AND MOBILE PAYMENTS
Recently, digital wallets have increasingly become available in Australia with most major banks launching their own digital wallets or working with third party applications (such as Apple Pay, Google Pay, Samsung Pay, Fitbit Pay and Garmin Pay). The increased availability of digital wallets has also resulted in increased transactions with 18.5 million mobile transactions made in the first half of 2018, a 156% increase compared with the previous period.27 That said, mobile wallets are still at the early adopter stage, with only 2% of consumers preferring this method of payment.23
Paying for public transport can be a challenge when travelling – visitors need to understand the local ticketing system, which can be time consuming and detract from the visitor experience. Transport NSW now accepts swipe on credit card payments on ferries and light rail as an alternative to purchasing an Opal card and to avoid ticketing confusion.29
Afterpay is another example of an innovation that can facilitate purchases while travelling. Afterpay is an Australian company that presents a buy-now-pay-later model, which can potentially broaden the customer base. The majority of Afterpay’s customers are millennials and it has developed a loyal and growing customer base.28 This growth has resulted in adoption by a range of merchants, from David Jones to Dreamworld.
INTERNATIONAL EXPERIENCE WITH PAYMENT PLATFORMSINDIA
The increased level of technology adoption, e-commerce growth and consumers’ demand for convenience has resulted in a strong growth of the mobile wallet industry in India. Mobile wallet transactions have grown more than 50 times from being worth INR₹10 billion in transactions in 2013 to INR₹532 billion in 2017, and is expected to grow to INR₹32 trillion in 2021.29
Changes in regulatory conditions (such as the demonetisation of currency notes) and policy measures by the Government of India and the Reserve Bank of India have driven the shift towards a cashless society.
EUROPE
More than 68% of Europeans had used digital wallets, card-on-file services or mobile payment services by 2017. By 2020, 92% of millennials are expected to be using mobile money. The top five types of merchants for mobile payments are restaurants, supermarkets, transit, convenience food and drink, and leisure and entertainment.30
THE US
While much of the technology enabling emerging payment platforms originated in the US, this market has not adopted emerging payment platforms as quickly as some other international counterparts.33 Contactless cards (using NFC technology) have experienced lower adoption rates than in Australia, reflecting barriers such as the different requirements across US financial institutions.
9TECHNOLOGY DISRUPTORS IN TOURISM TOURISM RESEARCH AUSTRALIA
VISITOR TRACKING Technological advancements have led to tools such as GPS, cameras, smartphones and sensors being used to track visitors. Movements can be monitored by a mobile phone app or an external physical device carried while travelling.
Visitor tracking will have a small positive impact on revenue in the domestic tourism industry, with the peak impact expected over the next five to 10 years.
CURRENT USEKnowledge of visitor tracking technologies is low, with only 40% awareness among domestic travellers, and only one-in-10 having used visitor tracking while travelling. The most likely users were younger (23% of those aged 25-34), social media users (28%) and AR/VR users (56%), compared to the average of 12%. This likely reflects a group tendency to adopt new technology.
FUTURE USEKnowledge of future use is low. One-third of domestic travellers (32%) are unsure of how much they will be using visitor tracking technology in the future. This likely reflects its early stage of development, low understanding and use, and high perceived barriers to take up.
That said, almost one-quarter (23%) of travellers expect their use will increase during domestic travel. Younger people, previous users and those who had used other technology disruptors during travel were also expecting to use visitor tracking more in the future.
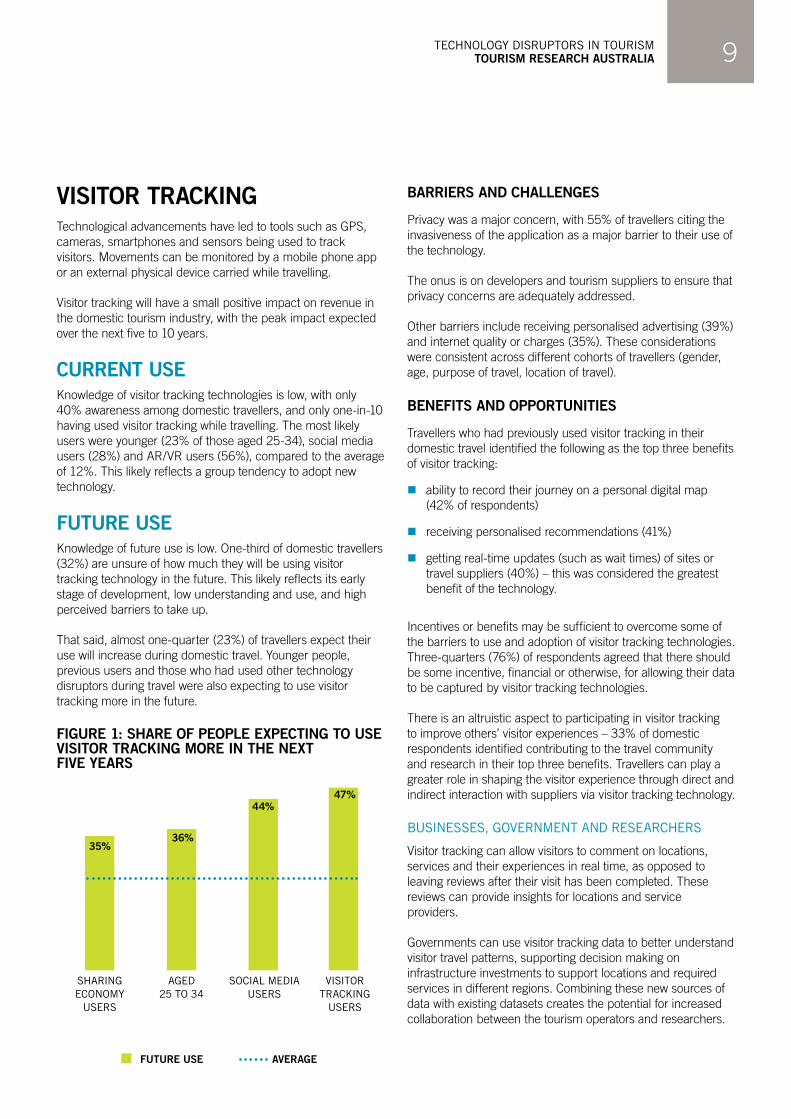
FIGURE 1: SHARE OF PEOPLE EXPECTING TO USE VISITOR TRACKING MORE IN THE NEXT FIVE YEARS
FUTURE USE AVERAGE
SHARING ECONOMY
USERS
AGED 25 TO 34
SOCIAL MEDIA USERS
VISITOR TRACKING
USERS
35%36%
44%47%
BARRIERS AND CHALLENGES
Privacy was a major concern, with 55% of travellers citing the invasiveness of the application as a major barrier to their use of the technology.
The onus is on developers and tourism suppliers to ensure that privacy concerns are adequately addressed.
Other barriers include receiving personalised advertising (39%) and internet quality or charges (35%). These considerations were consistent across different cohorts of travellers (gender, age, purpose of travel, location of travel).
BENEFITS AND OPPORTUNITIES
Travellers who had previously used visitor tracking in their domestic travel identified the following as the top three benefits of visitor tracking:
n ability to record their journey on a personal digital map (42% of respondents)
n receiving personalised recommendations (41%)
n getting real-time updates (such as wait times) of sites or travel suppliers (40%) – this was considered the greatest benefit of the technology.
Incentives or benefits may be sufficient to overcome some of the barriers to use and adoption of visitor tracking technologies. Three-quarters (76%) of respondents agreed that there should be some incentive, financial or otherwise, for allowing their data to be captured by visitor tracking technologies.
There is an altruistic aspect to participating in visitor tracking to improve others’ visitor experiences – 33% of domestic respondents identified contributing to the travel community and research in their top three benefits. Travellers can play a greater role in shaping the visitor experience through direct and indirect interaction with suppliers via visitor tracking technology.
BUSINESSES, GOVERNMENT AND RESEARCHERS
Visitor tracking can allow visitors to comment on locations, services and their experiences in real time, as opposed to leaving reviews after their visit has been completed. These reviews can provide insights for locations and service providers.
Governments can use visitor tracking data to better understand visitor travel patterns, supporting decision making on infrastructure investments to support locations and required services in different regions. Combining these new sources of data with existing datasets creates the potential for increased collaboration between the tourism operators and researchers.
TECHNOLOGY DISRUPTORS IN TOURISM TOURISM RESEARCH AUSTRALIA10
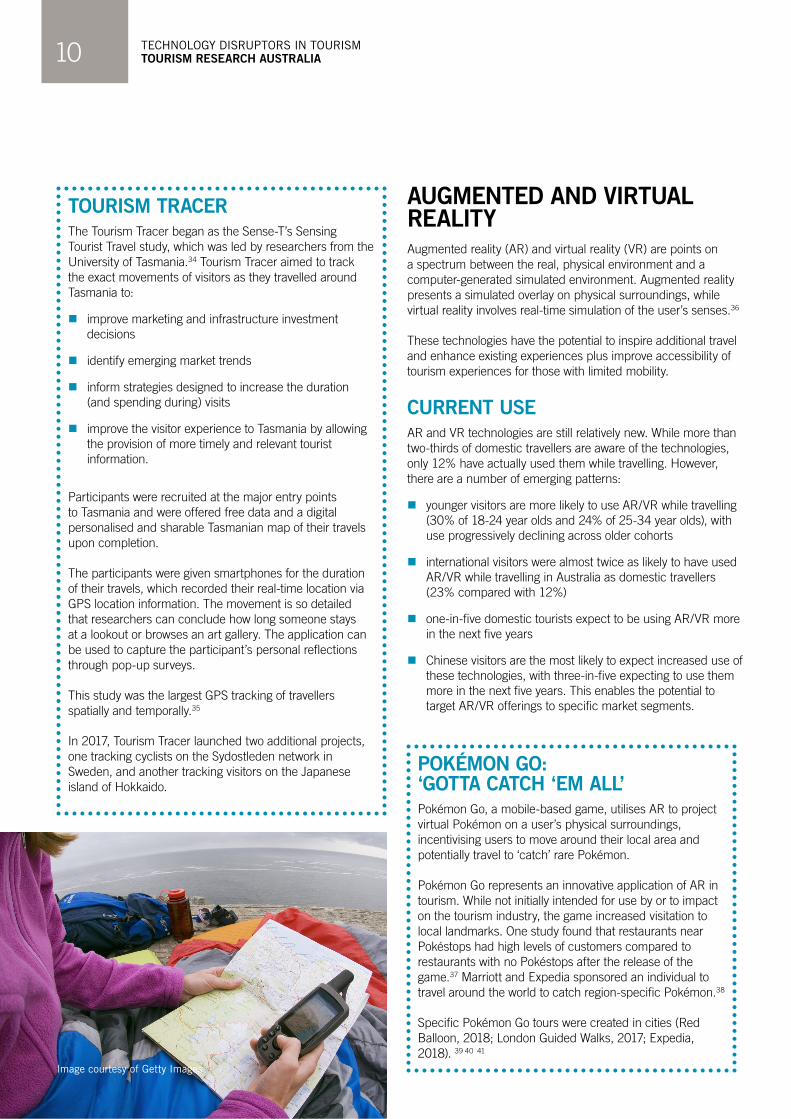
TOURISM TRACERThe Tourism Tracer began as the Sense-T’s Sensing Tourist Travel study, which was led by researchers from the University of Tasmania.34 Tourism Tracer aimed to track the exact movements of visitors as they travelled around Tasmania to:
n improve marketing and infrastructure investment decisions
n identify emerging market trends
n inform strategies designed to increase the duration (and spending during) visits
n improve the visitor experience to Tasmania by allowing the provision of more timely and relevant tourist information.
Participants were recruited at the major entry points to Tasmania and were offered free data and a digital personalised and sharable Tasmanian map of their travels upon completion.
The participants were given smartphones for the duration of their travels, which recorded their real-time location via GPS location information. The movement is so detailed that researchers can conclude how long someone stays at a lookout or browses an art gallery. The application can be used to capture the participant’s personal reflections through pop-up surveys.
This study was the largest GPS tracking of travellers spatially and temporally.35
In 2017, Tourism Tracer launched two additional projects, one tracking cyclists on the Sydostleden network in Sweden, and another tracking visitors on the Japanese island of Hokkaido.
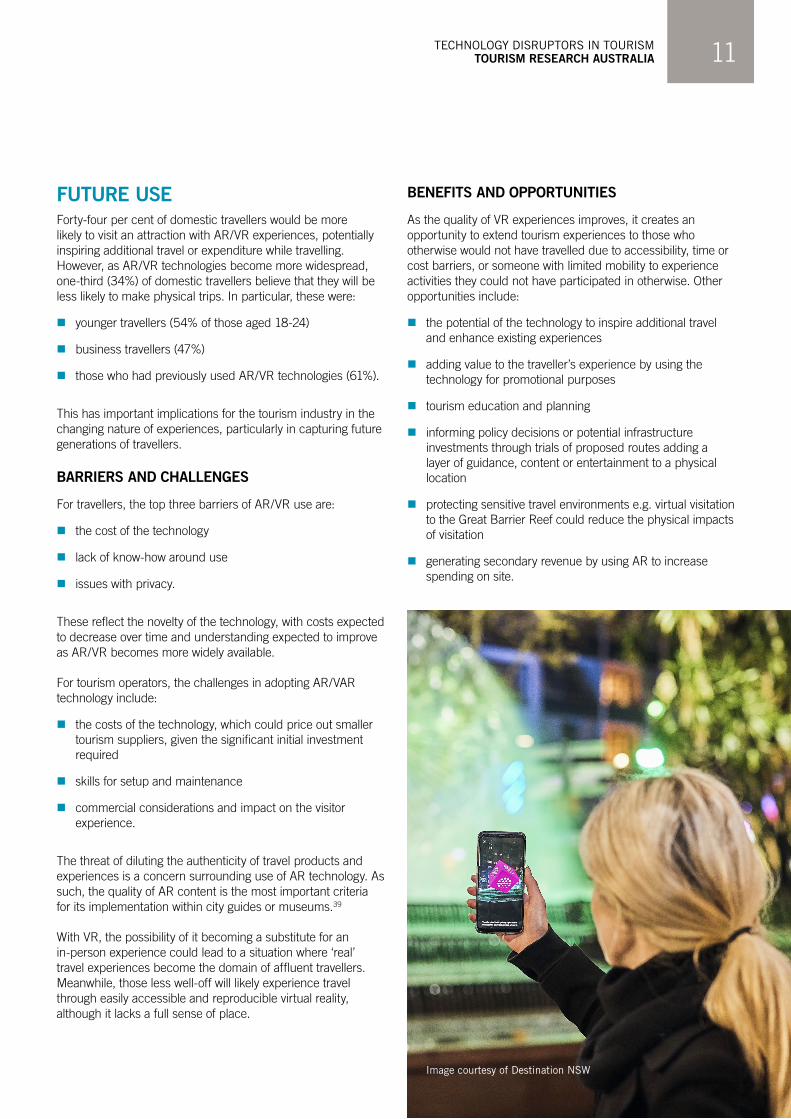
AUGMENTED AND VIRTUAL REALITYAugmented reality (AR) and virtual reality (VR) are points on a spectrum between the real, physical environment and a computer-generated simulated environment. Augmented reality presents a simulated overlay on physical surroundings, while virtual reality involves real-time simulation of the user’s senses.36
These technologies have the potential to inspire additional travel and enhance existing experiences plus improve accessibility of tourism experiences for those with limited mobility.
CURRENT USEAR and VR technologies are still relatively new. While more than two-thirds of domestic travellers are aware of the technologies, only 12% have actually used them while travelling. However, there are a number of emerging patterns:
n younger visitors are more likely to use AR/VR while travelling (30% of 18-24 year olds and 24% of 25-34 year olds), with use progressively declining across older cohorts
n international visitors were almost twice as likely to have used AR/VR while travelling in Australia as domestic travellers (23% compared with 12%)
n one-in-five domestic tourists expect to be using AR/VR more in the next five years
n Chinese visitors are the most likely to expect increased use of these technologies, with three-in-five expecting to use them more in the next five years. This enables the potential to target AR/VR offerings to specific market segments.
POKÉMON GO: ‘GOTTA CATCH ‘EM ALL’Pokémon Go, a mobile-based game, utilises AR to project virtual Pokémon on a user’s physical surroundings, incentivising users to move around their local area and potentially travel to ‘catch’ rare Pokémon.
Pokémon Go represents an innovative application of AR in tourism. While not initially intended for use by or to impact on the tourism industry, the game increased visitation to local landmarks. One study found that restaurants near Pokéstops had high levels of customers compared to restaurants with no Pokéstops after the release of the game.37 Marriott and Expedia sponsored an individual to travel around the world to catch region-specific Pokémon.38
Specific Pokémon Go tours were created in cities (Red Balloon, 2018; London Guided Walks, 2017; Expedia, 2018). 39 40 41
Image courtesy of Getty Images
11TECHNOLOGY DISRUPTORS IN TOURISM TOURISM RESEARCH AUSTRALIA
FUTURE USEForty-four per cent of domestic travellers would be more likely to visit an attraction with AR/VR experiences, potentially inspiring additional travel or expenditure while travelling. However, as AR/VR technologies become more widespread, one-third (34%) of domestic travellers believe that they will be less likely to make physical trips. In particular, these were:
n younger travellers (54% of those aged 18-24)
n business travellers (47%)
n those who had previously used AR/VR technologies (61%).
This has important implications for the tourism industry in the changing nature of experiences, particularly in capturing future generations of travellers.
BARRIERS AND CHALLENGES
For travellers, the top three barriers of AR/VR use are:
n the cost of the technology
n lack of know-how around use
n issues with privacy.
These reflect the novelty of the technology, with costs expected to decrease over time and understanding expected to improve as AR/VR becomes more widely available.
For tourism operators, the challenges in adopting AR/VAR technology include:
n the costs of the technology, which could price out smaller tourism suppliers, given the significant initial investment required
n skills for setup and maintenance
n commercial considerations and impact on the visitor experience.
The threat of diluting the authenticity of travel products and experiences is a concern surrounding use of AR technology. As such, the quality of AR content is the most important criteria for its implementation within city guides or museums.39
With VR, the possibility of it becoming a substitute for an in-person experience could lead to a situation where ‘real’ travel experiences become the domain of affluent travellers. Meanwhile, those less well-off will likely experience travel through easily accessible and reproducible virtual reality, although it lacks a full sense of place.
BENEFITS AND OPPORTUNITIES
As the quality of VR experiences improves, it creates an opportunity to extend tourism experiences to those who otherwise would not have travelled due to accessibility, time or cost barriers, or someone with limited mobility to experience activities they could not have participated in otherwise. Other opportunities include:
n the potential of the technology to inspire additional travel and enhance existing experiences
n adding value to the traveller’s experience by using the technology for promotional purposes
n tourism education and planning
n informing policy decisions or potential infrastructure investments through trials of proposed routes adding a layer of guidance, content or entertainment to a physical location
n protecting sensitive travel environments e.g. virtual visitation to the Great Barrier Reef could reduce the physical impacts of visitation
n generating secondary revenue by using AR to increase spending on site.
Image courtesy of Destination NSW
TECHNOLOGY DISRUPTORS IN TOURISM TOURISM RESEARCH AUSTRALIA12
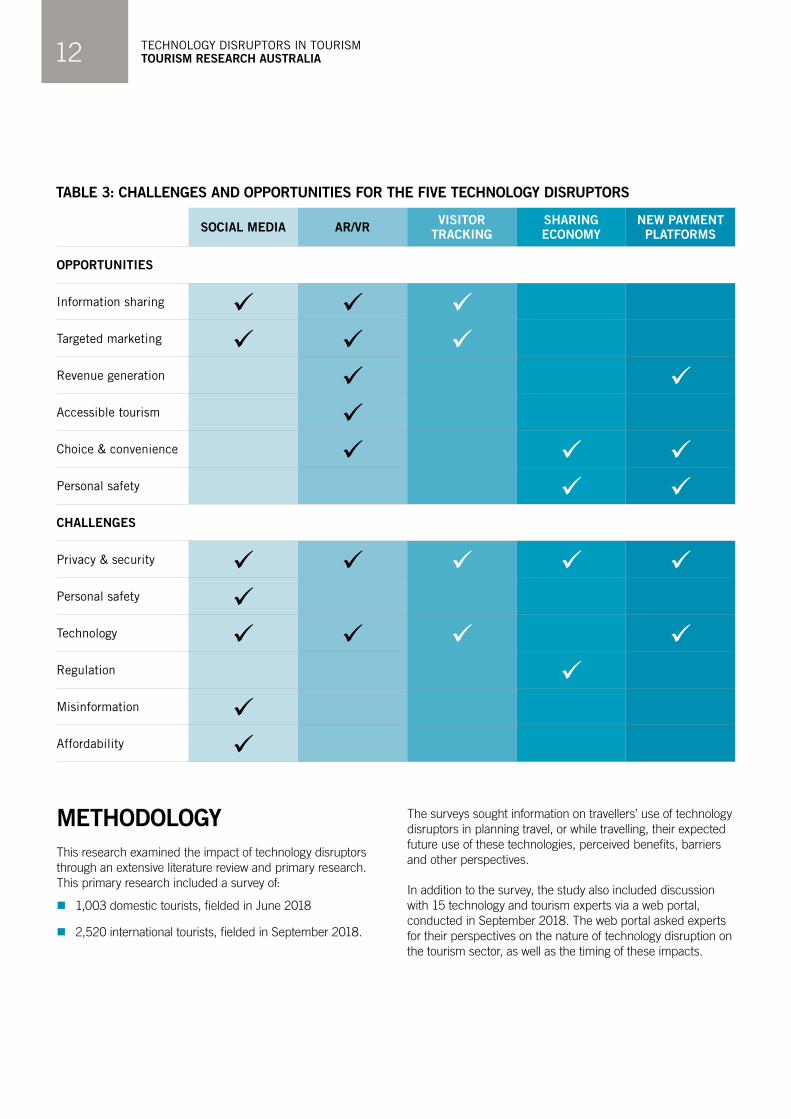
SOCIAL MEDIA AR/VR VISITOR TRACKING
SHARING ECONOMY
NEW PAYMENT PLATFORMS
OPPORTUNITIES
Information sharing Targeted marketing Revenue generation Accessible tourism Choice & convenience Personal safety CHALLENGES
Privacy & security Personal safety Technology Regulation Misinformation Affordability
TABLE 3: CHALLENGES AND OPPORTUNITIES FOR THE FIVE TECHNOLOGY DISRUPTORS
METHODOLOGYThis research examined the impact of technology disruptors through an extensive literature review and primary research. This primary research included a survey of:
n 1,003 domestic tourists, fielded in June 2018
n 2,520 international tourists, fielded in September 2018.
The surveys sought information on travellers’ use of technology disruptors in planning travel, or while travelling, their expected future use of these technologies, perceived benefits, barriers and other perspectives.
In addition to the survey, the study also included discussion with 15 technology and tourism experts via a web portal, conducted in September 2018. The web portal asked experts for their perspectives on the nature of technology disruption on the tourism sector, as well as the timing of these impacts.
13TECHNOLOGY DISRUPTORS IN TOURISM TOURISM RESEARCH AUSTRALIA
REFERENCES1. Smart Insights. (2017). Retrieved from How Social Media and Mobile
Technology Impact Travel: https://www.smartinsights.com/social-media-marketing/social-media-mobile-technology-impact-travel/
2. Deloitte Access Economics. (2017). Retrieved from Digital opportunities for today’s small business: https://www2.deloitte.com/content/dam/Deloitte/au/Documents/Economics/deloitte-au-economics-digital-opportunities-for-todays-small-business-salesforce-220317.pdf
3. Phelan L. (2018) ‘Risking my life’: new fence to stop selfies at Wedding Cake Rock, Sydney Morning Herald, 11 December. Retrieved from https://www.smh.com.au/national/nsw/risking-my-life-new-fence-to-stop-selfies-at-wedding-cake-rock-20181205-p50kbz.html
4. Del Gigante, M. (2018). How Social Media Has Changed The Ad Game. Retrieved from MDG Advertising: https://www.mdgadvertising.com/marketing-insights/infographics/how-social-media-changed-the-ad-game-infographic/
5. House of Lords. (2018, April 11). UK advertising in a digital age. Retrieved from House of Lords: https://publications.parliament.uk/pa/ld201719/ldselect/ldcomuni/116/116.pdf
6. Thompson, A, (2018) ‘New infrastructure to bring in tourists at Lake Tyrell. The Weekly Times. August 22. Retrieved from https://www.weeklytimesnow.com.au/country-living/new-infrastructure-to-bring-in-tourists-at-lake-tyrell/news-story/c8a5456d1c64bb05c04f0d99b82ec175
7. Farnsworth, S. (2018). Airbnb in Australia: Entire homes, commercial listings ‘surge’ amid growing concerns. ABC News. 23 February. Retrieved from http://www.abc.net.au/news/2018-02-23/entire-homes-commercial-listings-have-surged-on-airbnb/9473368
8. Sickel, J. (2017). Airbnb Adoption Growth Has Plateaued, According to Morgan Stanley, Business Travel News. 13 November. Retrieved from http://www.businesstravelnews.com/Lodging/Airbnb-Adoption-Growth-Has-Plateaued-According-to-Morgan-Stanley
9. Deloitte Access Economics. (2016). Economic effects of ridesharing in Australia. Retrieved from https://www2.deloitte.com/content/dam/Deloitte/au/Documents/Economics/deloitte-au-economics-economic-effects-of-ridesharing-australia-150216.pdf
10. Salinas, S. (2018, June 9). Uber and Lyft are racing to own every mode of transportation — they’re getting close. Retrieved from CNBC: https://www.cnbc.com/2018/06/09/uber-and-lyft-are-racing-to-own-every-mode-of-transportation.html
11. Bert, J., Collie, B., Gerrits, M., & Xu, G. (2016, Feb 23). What’s Ahead for Car Sharing. Retrieved from BCG: https://www.bcg.com/publications/2016/automotive-whats-ahead-car-sharing-new-mobility-its-impact-vehicle-sales.aspx
12. Litman, T. (2018). Autonomous Vehicle Implementation Predictions. Victoria Transport Policy Institute, as presented at the DTU Transport Summit Copenhagen, 31 May 2018
13. Jericho, G. (2016). The dark side of Uber: why the sharing economy needs tougher rules. The Guardian, April 18. Retrieved from https://www.theguardian.com/business/grogonomics/2016/apr/18/uber-airbnb-sharing-economy-tougher-rules-australia
14. Sherman, L. (2018). Is Uber for everything a good thing?, Forbes, July 17 Retrieved from https://www.forbes.com/sites/lensherman/2018/07/17/is-uber-for-everything-a-good-thing/#51de91210eff
15. Bliss, L. (2018, January 12). To measure the ‘Uber Effect’, cities get creative. CityLab. January 12. Retrieved from https://www.citylab.com/transportation/2018/01/to-measure-the-uber-effect-cities-get-creative/550295/
16. NSW Government (2018) New short-term holiday letting regulations. Retrieved from https://www.fairtrading.nsw.gov.au/news-and-updates/news/new-short-term-holiday-letting-regulations
17. Deloitte Access Economics. (2017). Economic effects of Airbnb in Australia: New South Wales.
18. Deloitte Access Economics. (2017). Economic effects of Airbnb in Australia.
19. Deloitte Access Economics. (2016). Economic Effects of ridesharing in Australia: Uber. Retrieved from https://www2.deloitte.com/content/dam/Deloitte/au/Documents/Economics/deloitte-au-economics-economic-effects-of-ridesharing-australia-150216.pdf
20. Airbnb (2017) New Study: Airbnb Community Contributes AUD $214 Million to Sydney and its Suburbs, Brings Tourists to New Neighbourhoods. Retrieved from https://www.airbnb.com.au/press/news/new-study-airbnb-community-contributes-aud-214-million-to-sydney-and-its-suburbs-brings-tourists-to-new-neighbourhoods
21. Airbnb (2018), Airbnb Doubles Down on Experiences, Expanding to 1000 Destinations and Adding New Passion Categories in 2018. February 23. Retrieved from https://press.airbnb.com/airbnb-doubles-down-on-experiences-expanding-to-1000-destinations-and-adding-new-categories-in-2018/
22. Doyle, M.-A., Fisher, C., Tellez, E., & Yadav, A. (2017). How Australians Pay: Evidence from the 2016 Consumer Payments Survey. Research Discussion Papers. Reserve Bank of Australia. Retrieved from Reserve Bank of Australia: http://www.rba.gov.au/publications/rdp/2017/pdf/rdp2017-04.pdf
23. Square. (2018). Retrieved from https://www.smh.com.au/business/small-business/rise-of-tap-and-go-slugs-bottom-lines-20180913-p503jd.html
24. Doyle, M.-A., Fisher, C., Tellez, E., & Yadav, A. (2017). How Australians Pay: Evidence from the 2016 Consumer Payments Survey. Research Discussion Papers. Reserve Bank of Australia. Retrieved from Reserve Bank of Australia: http://www.rba.gov.au/publications/rdp/2017/pdf/ rdp2017-04.pdf
25. Traill-Nash, G. (2018). Cue, Dion Lee, Veronika Maine launch WeChat Pay and Alipay. The Australian. March 7. Retrieved from https://www.theaustralian.com.au/life/fashion/cue-dion-lee-veronika-maine-launch-wechat-pay-and-alipay/news-story/0bffabaa6c404b6ef2c2ce588ab02a17
26. Westpac. (2016). Millennial travellers spend $11.3 billion overseas per year. Westpac. August 4. Retrieved from https://www.westpac.com.au/about-westpac/media/media-releases/2016/4-August/
27. Johnston, M. (2018). ANZ sees dramatic uptake in digital wallet payments. itnews. May 1. Retrieved from https://www.itnews.com.au/news/anz-sees-dramatic-uptake-in-digital-wallet-payments-490005
28. Square. (2018). Retrieved from https://www.smh.com.au/ business/small-business/rise-of-tap-and-go-slugs-bottom-lines-20180913-p503jd.html
29. NSW Government. (2018) Transport NSW: Contactless Payments. Retrieved from https://transportnsw.info/tickets-opal/opal/contactless-payments
30. AFR. (2018, Jan 16). Afterpay becomes a powerful payments disrupter. Australian Financial Review. January 16. Retrieved from https://www.afr.com/brand/chanticleer/afterpay-becomes-a-powerful-payments-disrupter-20180116-h0jaoi
31. Deloitte. (2017). Leading the cashless charge – Evolution of the digital wallet industry in India. Retrieved from https://www2.deloitte.com/content/dam/Deloitte/in/Documents/strategy/in-strategy-leading-the-cashless-charge-noexp.pdf
32. Visa Europe. (2017). Mobile Money Takes Off as 77% of Europeans Use their Phones to Bank and Make Everyday Payments. September 21. Retrieved from https://www.visaeurope.com/newsroom/news/mobile-money-takes-off-as-77-of-europeans-use-their-phones-to-bank-and-make-everyday-payments
33. Statista. (2017). Most popular digital wallets according to consumers in the United States as of December 2016. Retrieved from https://www.statista.com/statistics/284108/consumer-awareness-of-digital-wallets-in-the-united-states/
34. Sense-T. (2018). Sensing Tourist Travel. Retrieved from Sense-T: http://www.sense-t.org.au/projects-and-research/tourism
35. Tourism Tracer. (2018). About Tracer. Retrieved from https://tourismtracer.com/about/
36. Yung, R., & Khoo-Lattimore, C. (2017). New realities: a systematic literature review on virtual reality and augmented reality in tourism research. Current Issues in Tourism, 1–26
37. Pamuru, V., Khern-am-nuai, W., & Kannan, K. N. (2017). The Impact of an Augmented Reality Game on Local Businesses: A Study of Pokemon Go on Restaurants. Retrieved from SSRN: https://papers.ssrn.com/sol3/papers.cfm?abstract_id=2968221
38. Weinberger, M. (2016). This is what it’s like to travel the world on a global Pokémon Go adventure. Business Insider. September 3. Retrieved from http://www.businessinsider.com/pokemon-go-nick-johnson-trip-2016-9/?r=AU&IR=T/#johnsons-trip-began-on-july-29th-flying-from-new-yorks-jfk-airport-to-paris-1
39. Red Balloon. (2018). Pokemon Day Tour - $249. Retrieved from https://www.redballoon.com.au/unique-experiences/pokemon-day-tour-group
40. London Guided Walks. (2017). Pokemon Go London Adventures. Retrieved from https://www.londonguidedwalks.co.uk/pokemon-go-tours.php
41. Expedia. (2018). Pokémon Go Tour. Retrieved from https://www.expedia.com/things-to-do/pokemon-go-tour.a440876.activity-details
42. tom Dieck, C. M., & Jung, T. (2015). A theoretical model of mobile augmented reality acceptance in urban heritage tourism. Current Issues in Tourism, 1–21
For more information, go to www.tra.gov.au


