80
Propylene via Propane Dehydrogenation, Part 2
| Date post: | 27-Oct-2014 |
| Category: |
Documents |
| Upload: | intratec-solutions |
| View: | 458 times |
| Download: | 51 times |

Propylene via Propane
Dehydrogenation, Part 2

Copyrights © 2013 by Intratec Solutions LLC. All rights reserved. Printed in the United States of America.
#TEC006B
Technology Economics
Propylene Production via Propane Dehydrogenation, Part 2
2013
Abstract
Propylene has established itself as a major member of the global olefins business, second only to ethylene. Globally, the greatestvolume of propylene is generated as a by-product in steam crackers and through the fluid catalytic cracking (FCC) process.
With ethane prices falling in the USA due to the exploration of shale gas reserves, the low price of ethylene produced from this rawmaterial has given ethane-fed steam crackers in North America a feedstock advantage. Such a change has put naphtha-fed steamcrackers at a disadvantage, with many of them shutting down or revamping to use ethane as feedstock. Nevertheless, thepropylene output rates from ethane-fed crackers are negligible. This, along with the rise in propylene demand, has resulted in atight propylene market.
For this reason, new and novel lower-cost chemical processes for on-purpose propylene production technologies are of highinterest to the petrochemical marketplace. Such processes include: Metathesis, Propane Dehydrogenation (PDH), Methanol-to-Olefins/Methanol-to-Propylene (MTO/MTP), High Severity FCC, and Olefins Cracking. Among those, MTO/MTP and PDH stand outdue to the use of low-cost raw materials. In the US, some major companies, including Dow Chemical and Enterprise Products, arebuilding PDH plants to take advantage of shale gas, the fastest growing source of gas in the country. In Middle East, the propaneoutput is expected to be capable of supplying not only domestic needs, but also the demand from China, where many PDHprojects are scheduled to go on stream within the next few years.
In this study, the production of propylene through the dehydrogenation of propane is reviewed. Included in the analysis is anoverview of the technology and economics of a method similar to the Lummus CATOFIN® process, the technology selected byEnterprise Products to produce propylene on Texas Gulf Coast. Both the capital investment and the operating costs are presentedfor a plant constructed on the US Gulf Coast and in China. Process consumptions were validated through a comparison withpublicly available information about Petrologistics’ PDH unit, located in Texas and based on CATOFIN technology.
The economic analysis presented in this report is based on a plant fully integrated with a petrochemical complex and capable ofproducing 590 kta of polymer grade propylene. The estimated CAPEX for such a plant on the US Gulf Coast is USD 493 million.While China presented the lowest CAPEX, the USA presented the most advantageous operational margins, due to the rise of shalegas and reduction in propane prices. The more competitive raw material justifies Enterprise Products choice for a new PDH plantin Texas. Although China still depends on imported propane from Middle East, being subjected to shortages of supply, thehistorical operational margins are high enough to explain the number of PDH planned projects in the country. The attractivenessof propane dehydrogenation is proven by the calculated internal rate of return above 30% in the United States.

ii
… It was actually an advisoryservice ordered by one of ourclients, now disclosed to ourreadership with his consent.
It results from the innovativeconcept, designed by Intratec for
leading companies in the chemical and alliedsectors who have asked for more affordableand reliable studies to plan their investments.
Intratec’s strategy works by charging clientslower-than-market fees to conduct atechnology advisory service with theunderstanding that such studies may bereleased, after an agreed upon period of time,as publications.
Available through well-known sales channelssuch as Amazon, Google Books and HPMagCloud, our publications can be purchasedby any interested reader.
In short, our clients receivetraditionally expensive studiesfor a fraction of the cost, andour readers get unprecedentedaccess to real professionalpublications at steep discounts.
How Readers Benefit?
From academics to industry executives, ourreaders benefit by gaining access to realconsulting cases, released for the first time tothe market as one-of-a-kind publications ataffordable prices.
Through our university discount policy,students and faculty members will be able tobecome familiar with challenges faced byindustry for a price similar to a usual textbook.
How Clients Benefit?
While traditional consulting firms charge theirclients hundreds of thousands of dollars,Intratec offers, from the convenience of a webbrowser, a much better advisory experiencefor a price 80% lower than market.
What is Technology
Economics?
Advisory services targeting investments onnew chemical units, answering:
What is the process? What equipment isnecessary?
What are the raw materials and utilitiesconsumptions?
What are the operating and capitalexpenses?
In which locations is this technology moreprofitable?
Each new assignment comprises of a studystructured like this publication, valuablespreadsheets and broad support.
This Publication Was Not a Publication…

iii
Reshaping the Advisory Industry
1) Our publications are accessed and attested to by a huge audience . . .
2) . . . including potential clients who like the publication structure . . .
3) . . . and order advisory services based on the same format.
4) If our clients agree, their advisory services are disclosed as publications.
Everyone Benefits from Cost Sharing & Online Experience
1) Readers purchase our publications at steep discounts online . . .
4) . . . because they were actually consulting cases . . .
3) . . . requested online by the initial client . . .
2) . . . who shared the costs with the readers.
For a better understanding of our innovative concept, please visit www.intratec.us.
Consulting as Publications at a Glance
1
Information, analyses and/or models herein presentedare prepared on the basis of publicly availableinformation and non-confidential information disclosedby third parties. Third parties, including, but not limitedto technology licensors, trade associations ormarketplace participants, may have provided some ofthe information on which the analyses or data are based.Intratec Solutions LLC (known as “Intratec”) does notbelieve that such information will contain anyconfidential information but cannot provide anyassurance that any third party may, from time to time,claim a confidential obligation to such information.
The aforesaid information, analyses and models aredeveloped independently by Intratec and, as such, arethe opinion of Intratec and do not represent the point ofview of any third parties nor imply in any way that theyhave been approved or otherwise authorized by thirdparties that are mentioned in this publication.
The application of the solutions presented in thispublication without license from the owners infringes onthe intellectual property rights of the owners, includingpatent rights, trademark rights, and rights to tradesecrets and proprietary information.
Intratec conducts analyses and prepares publicationsand models for readers in conformance with generallyaccepted professional standards. Although thestatements in this publication are derived from or basedon several sources that Intratec believe to be reliable,Intratec does not guarantee their accuracy, reliability, orquality; any such information, or resulting analyses, maybe incomplete, inaccurate or condensed. All estimatesincluded in this publication are subject to changewithout notice. This publication is for informationalpurposes only and is not intended as anyrecommendation of investment.
Reader agrees it will not, without prior written consent ofIntratec, represent, directly or indirectly, that its productshave been approved or endorsed by the other parties.
In no event shall Intratec, its employees, representatives,resellers or distributors be liable to readers or any otherperson or entity for any direct, indirect, special,exemplary, punitive, or consequential damages,including lost profits, based on breach of warranty,contract, negligence, strict liability or otherwise, arisingfrom the use of this publication, whether or not they or ithad any knowledge, actual or constructive, that suchdamages might be incurred.
Reader shall indemnify and hold harmless Intratec and itsresellers, representatives, distributors, and informationproviders against any claim, damages, loss, liability orexpense arising out of reader’s use of the publication inany way contrary to the present terms and conditions.
Intratec publications are the product of extensive workand original research and are protected by internationalcopyright law.
Products supplied as printed reports or books should notbe copied but can be included in schools, universities orcorporate libraries and circulated to colleagues to theextended permitted by copyright law.
Products supplied digitally are licensed, not sold. Thepurchaser is responsible for ensuring that license termsare adhered to at all times. PDF documents may besupplied watermarked with the customer’s name, emailand/or company. Digital documents are supplied withan enterprise license and can be shared by all employeesand on-site contractors of a single organization.Members of the organization may make such copies asare necessary to facilitate this distribution. An enterpriselicense does not permit sharing with externalorganizations.
Reader agrees that Intratec retains all rights, title andinterest, including copyright and other proprietary rights,in this publication and all material, including but notlimited to text, images, and other multimedia data,provided or made available as part of this publication.
Terms & Conditions

2
Contents
About this Study .............................................................................................................................................................. 8
Object of Study.............................................................................................................................................................................................................................8
Analysis Performed ....................................................................................................................................................................................................................8
Construction Scenarios ..............................................................................................................................................................................................................8
Location Basis ...................................................................................................................................................................................................................................9
Design Conditions......................................................................................................................................................................................................................9
Study Background ........................................................................................................................................................ 10
About Propylene ......................................................................................................................................................................................................................10
Introduction.................................................................................................................................................................................................................................... 10
Applications.................................................................................................................................................................................................................................... 10
Manufacturing Alternatives ..............................................................................................................................................................................................11
Licensor(s) & Historical Aspects......................................................................................................................................................................................13
Technical Analysis......................................................................................................................................................... 14
Chemistry.......................................................................................................................................................................................................................................14
Raw Material ................................................................................................................................................................................................................................14
Technology Overview...........................................................................................................................................................................................................16
Detailed Process Description & Conceptual Flow Diagram.......................................................................................................................17
Area 100: Reaction and Catalyst Regeneration .......................................................................................................................................................17
Area 200: Product Recovery ................................................................................................................................................................................................ 17
Key Consumptions ..................................................................................................................................................................................................................... 18
Technical Assumptions ........................................................................................................................................................................................................... 18
Labor Requirements.................................................................................................................................................................................................................. 18
ISBL Major Equipment List .................................................................................................................................................................................................21
OSBL Major Equipment List ..............................................................................................................................................................................................23
Other Process Remarks ........................................................................................................................................................................................................24
Technology Advances.............................................................................................................................................................................................................. 24
Reactor Operating Cycle......................................................................................................................................................................................................... 24
PDH-Integration Alternatives............................................................................................................................................................................................... 25
Economic Analysis ........................................................................................................................................................ 26
General Assumptions............................................................................................................................................................................................................26

3
Project Implementation Schedule...............................................................................................................................................................................27
Capital Expenditures..............................................................................................................................................................................................................27
Fixed Investment......................................................................................................................................................................................................................... 27
Working Capital............................................................................................................................................................................................................................ 30
Other Capital Expenses ........................................................................................................................................................................................................... 31
Total Capital Expenses ............................................................................................................................................................................................................. 31
Operational Expenditures ..................................................................................................................................................................................................31
Manufacturing Costs................................................................................................................................................................................................................. 31
Historical Analysis........................................................................................................................................................................................................................ 32
Economic Datasheet .............................................................................................................................................................................................................32
Regional Comparison & Economic Discussion.................................................................................................... 35
Regional Comparison............................................................................................................................................................................................................35
Capital Expenses.......................................................................................................................................................................................................................... 35
Operational Expenses............................................................................................................................................................................................................... 35
Economic Datasheet................................................................................................................................................................................................................. 35
Economic Discussion ............................................................................................................................................................................................................36
References....................................................................................................................................................................... 38
Acronyms, Legends & Observations....................................................................................................................... 39
Technology Economics Methodology................................................................................................................... 40
Introduction.................................................................................................................................................................................................................................40
Workflow........................................................................................................................................................................................................................................40
Capital & Operating Cost Estimates ............................................................................................................................................................................42
ISBL Investment............................................................................................................................................................................................................................ 42
OSBL Investment ......................................................................................................................................................................................................................... 42
Working Capital............................................................................................................................................................................................................................ 43
Start-up Expenses ....................................................................................................................................................................................................................... 43
Other Capital Expenses ........................................................................................................................................................................................................... 44
Manufacturing Costs................................................................................................................................................................................................................. 44
Contingencies ............................................................................................................................................................................................................................44
Accuracy of Economic Estimates..................................................................................................................................................................................45
Location Factor..........................................................................................................................................................................................................................45
Appendix A. Mass Balance & Streams Properties............................................................................................... 47
Appendix B. Utilities Consumption Breakdown ................................................................................................. 52
Appendix C. Carbon Footprint ................................................................................................................................. 53

4
Appendix D. Equipment Detailed List & Sizing................................................................................................... 54
Appendix E. Detailed Capital Expenses................................................................................................................. 64
Direct Costs Breakdown......................................................................................................................................................................................................64
Indirect Costs Breakdown ..................................................................................................................................................................................................65
Appendix F. Economic Assumptions...................................................................................................................... 66
Capital Expenditures..............................................................................................................................................................................................................66
Construction Location Factors ...........................................................................................................................................................................................66
Working Capital............................................................................................................................................................................................................................ 66
Other Capital Expenses ........................................................................................................................................................................................................... 66
Operational Expenses ...........................................................................................................................................................................................................67
Fixed Costs ...................................................................................................................................................................................................................................... 67
Depreciation................................................................................................................................................................................................................................... 67
EBITDA Margins Comparison...............................................................................................................................................................................................67
Appendix G. Released Publications ........................................................................................................................ 68
Appendix H. Technology Economics Form Submitted by Client ................................................................. 69

5
List of Tables
Table 1 – Construction Scenarios Assumptions (Based on Degree of Integration) ......................................................................................9
Table 2 – Location & Pricing Basis ....................................................................................................................................................................................................9
Table 3 – General Design Assumptions .......................................................................................................................................................................................9
Table 4 – Major Propylene Consumers......................................................................................................................................................................................10
Table 5 - Raw Materials & Utilities Consumption (per ton of product)................................................................................................................18
Table 6 – Design & Simulation Assumptions.........................................................................................................................................................................18
Table 7 – Labor Requirements for a Typical Plant ..............................................................................................................................................................18
Table 8 – Main Streams Operating Conditions and Composition..........................................................................................................................21
Table 9 – Inside Battery Limits Major Equipment List......................................................................................................................................................21
Table 10 - Outside Battery Limits Major Equipment List ...............................................................................................................................................23
Table 11 – Base Case General Assumptions...........................................................................................................................................................................26
Table 12 - Bare Equipment Cost per Area (USD Thousands)......................................................................................................................................27
Table 13 – Total Fixed Investment Breakdown (USD Thousands) ..........................................................................................................................27
Table 14 – Working Capital (USD Million) ................................................................................................................................................................................30
Table 15 – Other Capital Expenses (USD Million) ...............................................................................................................................................................31
Table 16 – CAPEX (USD Million) ......................................................................................................................................................................................................31
Table 17 – Manufacturing Fixed Cost (USD/ton) ................................................................................................................................................................31
Table 18 – Manufacturing Variable Cost (USD/ton)..........................................................................................................................................................32
Table 19 – OPEX (USD/ton)................................................................................................................................................................................................................32
Table 20 – Technology Economics Datasheet: Propylene via Propane Dehydrogenation on the US Gulf Coast...............34
Table 21 – Technology Economics Datasheet: Propylene via Propane Dehydrogenation in China ............................................37
Table 22 – Project Contingency......................................................................................................................................................................................................44
Table 23 – Criteria Description.........................................................................................................................................................................................................44
Table 24 – Accuracy of Economic Estimates .........................................................................................................................................................................45
Table 25 – Detailed Material Balance & Streams Properties........................................................................................................................................47
Table 26 – Utilities Consumption Breakdown ......................................................................................................................................................................52
Table 27 – Assumptions for CO2e Emissions Calculation.............................................................................................................................................53
Table 28 – CO2e Emissions (ton/ton prod.)............................................................................................................................................................................53
Table 29 - Compressors ........................................................................................................................................................................................................................54
Table 30 – Drivers......................................................................................................................................................................................................................................54
Table 31 – Heat Exchangers ..............................................................................................................................................................................................................55
Table 32 – Pumps......................................................................................................................................................................................................................................59

6
Table 33 – Columns.................................................................................................................................................................................................................................60
Table 34 – Utilities Supply...................................................................................................................................................................................................................61
Table 35 – Vessels & Tanks ..................................................................................................................................................................................................................61
Table 36 – Indirect Costs Breakdown for the Base Case (USD Thousands) ......................................................................................................65
Table 37 – Detailed Construction Location Factor............................................................................................................................................................66
Table 38 – Working Capital Assumptions (Base Case) ....................................................................................................................................................66
Table 39 – Other Capital Expenses Assumptions (Base Case) ...................................................................................................................................66
Table 40 – Other Fixed Cost Assumptions ..............................................................................................................................................................................67
Table 41 – Depreciation Value & Assumptions ....................................................................................................................................................................67

7
List of Figures
Figure 1 – Construction Scenarios Assumptions (Based on Degree of Integrations) ..................................................................................8
Figure 2 – Propylene from Multiple Sources .........................................................................................................................................................................12
Figure 3 – Propane Dehydrogenation Reaction Network............................................................................................................................................14
Figure 4 – US Natural Gas Production History and Forecast (Trillion Cubic Feet)........................................................................................15
Figure 5 – Process Block Flow Diagram.....................................................................................................................................................................................16
Figure 6 – Inside Battery Limits Conceptual Process Flow Diagram.....................................................................................................................19
Figure 7 – Typical Operating Cycle for a Eight Reactor System................................................................................................................................24
Figure 8 – Project Implementation Schedule .......................................................................................................................................................................26
Figure 9 – Total Direct Cost of Different Integration Scenarios (USD Thousands) ......................................................................................29
Figure 10 – Total Fixed Investment of Different Integration Scenarios (USD Thousands) ....................................................................29
Figure 11 – Total Fixed Investment Validation (USD Million) .....................................................................................................................................30
Figure 12 – OPEX and Product Sales History (USD/ton) ................................................................................................................................................33
Figure 13 – EBITDA Margin & IP Indicators History Comparison..............................................................................................................................33
Figure 14 – CAPEX per Location (USD Million).....................................................................................................................................................................35
Figure 15 – Operating Costs Breakdown per Location (USD/ton) .........................................................................................................................36
Figure 16 – Methodology Flowchart...........................................................................................................................................................................................41
Figure 17 – Location Factor Composition ...............................................................................................................................................................................46
Figure 18 – ISBL Direct Costs Breakdown by Equipment Type (Base Case).....................................................................................................64
Figure 19 – OSBL Direct Costs by Equipment Type (Base Case) ..............................................................................................................................64
Figure 20 – Historical EBITDA Margins Regional Comparison ...................................................................................................................................67

8
Intr
ate
c | A
bo
ut
this
Stu
dy
This study follows the same pattern as all TechnologyEconomics studies developed by Intratec and is based onthe same rigorous methodology and well-defined structure(chapters, type of tables and charts, flow sheets, etc.).
This chapter summarizes the set of information that servedas input to develop the current technology evaluation. Allrequired data were provided through the filling of theTechnology Economics Form available at Intratec’s website.
You may check the original form in the “Appendix H.Technology Economics Form Submitted by Client”.
Object of Study
This assignment assesses the economic feasibility of anindustrial unit for propylene production via propanedehydrogenation, implementing technology similar to theCB&I Lummus CATOFIN process.
The current assessment is based on economic datagathered on Q1 2012 and a chemical plant’s nominalcapacity of 590 kta (thousand metric tons per year).
Analysis Performed
Construction Scenarios
The economic analysis is based on the construction of aplant inside a petrochemical complex, in which propanefeedstock is locally provided and propylene product isconsumed by a nearby polypropylene unit. Therefore, nostorage for product or raw material is required. Additionally,the petrochemical complex supplies most utilities.
Since the Outside Battery Limits (OSBL) requirements–storage and utilities supply facilities – significantly impactthe capital cost estimates for a new venture, they may play adecisive role in the decision as to whether or not to invest.Thus, in this study three distinct OSBL configurations arecompared. Those scenarios are summarized in Figure 1 andTable 1
About this Study
Figure 1 – Construction Scenarios Assumptions (Based on Degree of Integrations)
Non-Integrated
Petrochemical Complex
Raw MaterialsStorage
ISBL Unit
Products Consumer
Petrochemical Complex
Partially Integrated Fully Integrated
Raw MaterialsProvider
ISBL Unit
Products Consumer
Raw MaterialsStorage
ISBL Unit
Products Storage
Grassroots unit Unit is part of a petrochemical complex Most infrastructure is already installed
Source: Intratec – www.intratec.us

9
Intr
ate
c | A
bo
ut
this
Stu
dy
Location Basis Regional specific conditions influence both constructionand operating costs. This study compares the economicperformance of two identical plants operating in differentlocations: the US Gulf Coast and China.
The assumptions that distinguish the two regions analyzedin this study are provided in Table 2.
Design Conditions
The process analysis is based on rigorous simulation modelsdeveloped on Aspentech Aspen Plus and Hysys, whichsupport the design of the chemical process, equipment andOSBL facilities.
The design assumptions employed are depicted in Table 3.
Cooling water temperature 24 °C
Cooling water range 11 °C
Steam (High Pressure) 39 bar abs
Refrigerant (Propylene) -45 °C
Wet Bulb Air Temperature 25 °C
Table 1 – Construction Scenarios Assumptions (Based on Degree of Integration)
Storage Capacity (Base Case for Evaluation)
Feedstock & Chemicals 20 days of operation 20 days of operation Not included
End-products & By-products 20 days of operation Not included Not included
Utility Facilities Included All required All required Only refrigeration unit
Support & Auxiliary Facilities
(Area 900)
Control room, labs, gate house,
maintenance shops,
warehouses, offices, change
house, cafeteria, parking lot
Control room, labs,
maintenance shops,
warehouses
Control room and labs
Source: Intratec – www.intratec.us
Table 2 – Location & Pricing Basis
Source: Intratec – www.intratec.us
Table 3 – General Design Assumptions
Source: Intratec – www.intratec.us
10
Intr
ate
c | S
tud
y B
ackg
rou
nd
About Propylene
Introduction
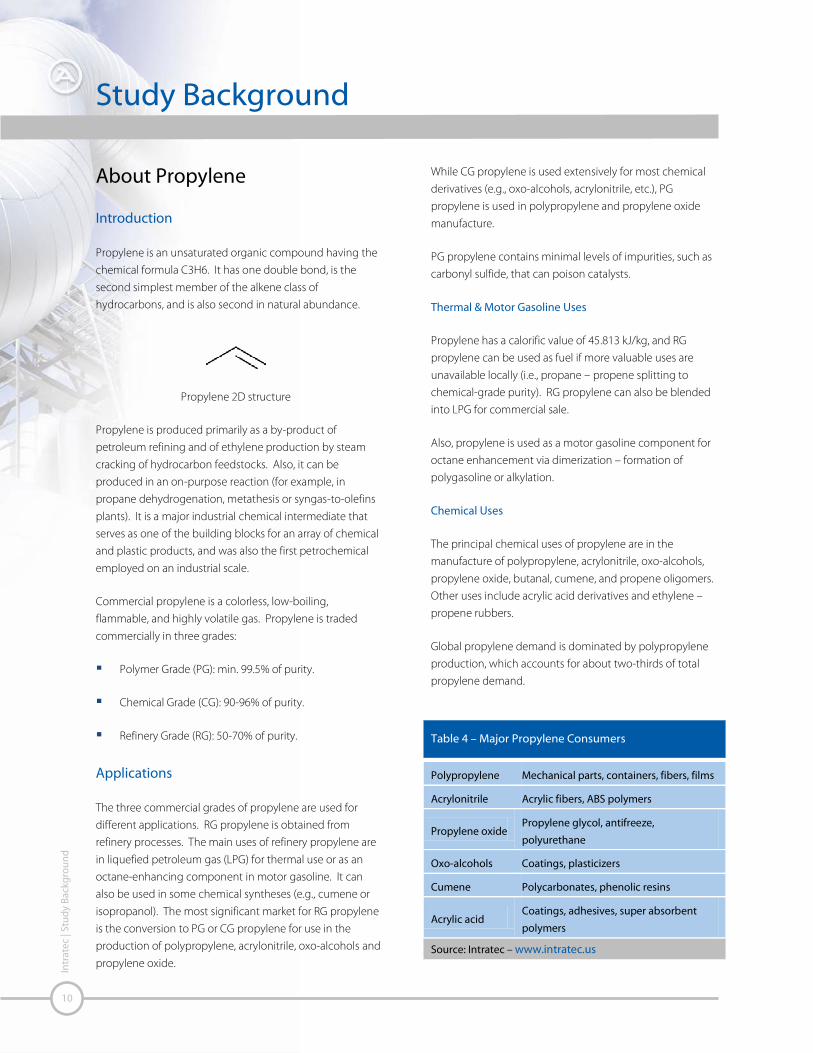
Propylene is an unsaturated organic compound having thechemical formula C3H6. It has one double bond, is thesecond simplest member of the alkene class ofhydrocarbons, and is also second in natural abundance.
Propylene 2D structure
Propylene is produced primarily as a by-product ofpetroleum refining and of ethylene production by steamcracking of hydrocarbon feedstocks. Also, it can beproduced in an on-purpose reaction (for example, inpropane dehydrogenation, metathesis or syngas-to-olefinsplants). It is a major industrial chemical intermediate thatserves as one of the building blocks for an array of chemicaland plastic products, and was also the first petrochemicalemployed on an industrial scale.
Commercial propylene is a colorless, low-boiling,flammable, and highly volatile gas. Propylene is tradedcommercially in three grades:
Polymer Grade (PG): min. 99.5% of purity.
Chemical Grade (CG): 90-96% of purity.
Refinery Grade (RG): 50-70% of purity.
Applications
The three commercial grades of propylene are used fordifferent applications. RG propylene is obtained fromrefinery processes. The main uses of refinery propylene arein liquefied petroleum gas (LPG) for thermal use or as anoctane-enhancing component in motor gasoline. It canalso be used in some chemical syntheses (e.g., cumene orisopropanol). The most significant market for RG propyleneis the conversion to PG or CG propylene for use in theproduction of polypropylene, acrylonitrile, oxo-alcohols andpropylene oxide.
While CG propylene is used extensively for most chemicalderivatives (e.g., oxo-alcohols, acrylonitrile, etc.), PGpropylene is used in polypropylene and propylene oxidemanufacture.
PG propylene contains minimal levels of impurities, such ascarbonyl sulfide, that can poison catalysts.
Thermal & Motor Gasoline Uses
Propylene has a calorific value of 45.813 kJ/kg, and RGpropylene can be used as fuel if more valuable uses areunavailable locally (i.e., propane – propene splitting tochemical-grade purity). RG propylene can also be blendedinto LPG for commercial sale.
Also, propylene is used as a motor gasoline component foroctane enhancement via dimerization – formation ofpolygasoline or alkylation.
Chemical Uses
The principal chemical uses of propylene are in themanufacture of polypropylene, acrylonitrile, oxo-alcohols,propylene oxide, butanal, cumene, and propene oligomers.Other uses include acrylic acid derivatives and ethylene –propene rubbers.
Global propylene demand is dominated by polypropyleneproduction, which accounts for about two-thirds of totalpropylene demand.
Polypropylene Mechanical parts, containers, fibers, films
Acrylonitrile Acrylic fibers, ABS polymers
Propylene oxide Propylene glycol, antifreeze,
polyurethane
Oxo-alcohols Coatings, plasticizers
Cumene Polycarbonates, phenolic resins
Acrylic acid Coatings, adhesives, super absorbent
polymers
Study Background
Table 4 – Major Propylene Consumers
Source: Intratec – www.intratec.us

11
Intr
ate
c | S
tud
y B
ackg
rou
nd
Manufacturing Alternatives
Propylene is commercially generated as a co-product, eitherin an olefins plant or a crude oil refinery’s fluid catalyticcracking (FCC) unit, or produced in an on-purpose reaction(for example, in propane dehydrogenation, metathesis orsyngas-to-olefins plants).
Globally, the largest volume of propylene is produced inNGL (Natural Gas Liquids) or naphtha steam crackers, whichgenerates ethylene as well. In fact, the production ofpropylene from such a plant is so important that the name“olefins plant” is often applied to this kind of manufacturingfacility (as opposed to “ethylene plant”). In an olefins plant,propylene is generated by the pyrolysis of the incomingfeed, followed by purification. Except where ethane is usedas the feedstock, propylene is typically produced at levelsranging from 40 to 60 wt% of the ethylene produced. Theexact yield of propylene produced in a pyrolysis furnace is afunction of the feedstock and the operating severity of thepyrolysis.
The pyrolysis furnace operation usually is dictated bycomputer optimization, where an economic optimum forthe plant is based on feedstock price, yield structures,energy considerations, and market conditions for themultitude of products obtained from the furnace. Thus,propylene produced by steam cracking varies according toeconomic conditions.
In an olefins plant purification area, also called separationtrain, propylene is obtained by distillation of a mixed C3stream, i.e., propane, propylene, and minor components, ina C3-splitter tower. It is produced as the overheaddistillation product, and the bottoms are a propane-enriched stream. The size of the C3-splitter depends on thepurity of the propylene product.
The propylene produced in refineries also originates fromother cracking processes. However, these processes can becompared to only a limited extent with the steam crackerfor ethylene production because they use completelydifferent feedstocks and have different productionobjectives.
Refinery cracking processes operate either purely thermallyor thermally – catalytically. By far the most importantprocess for propene production is the fluid- catalyticcracking (FCC) process, in which the powdery catalyst flowsas a fluidized bed through the reaction and regeneration
areas. This process converts heavy gas oil preferentially intogasoline and light gas oil.
The propylene yielded from olefins plants and FCC units istypically considered a co-product in these processes, whichare primarily driven by ethylene and motor gasolineproduction, respectively. Currently, the markets haveevolved to the point where modes of by-productproduction can no longer satisfy the demand for propylene.
A trend toward less severe cracking conditions, and thus toincrease propylene production, has been observed in steamcracker plants using liquid feedstock. As a result, new andnovel lower-cost chemical processes for on-purposepropylene production technologies are of high interest tothe petrochemical marketplace. Such processes include:
Olefin Metathesis. Also known as disproportionation,metathesis is a reversible reaction between ethyleneand butenes in which double bonds are broken andthen reformed to form propylene. Propylene yields ofabout 90 wt% are achieved. This option may also beused when there is no butene feedstock. In this case,part of the ethylene feeds an ethylene-dimerizationunit that converts ethylene into butene.
Propane Dehydrogenation. A catalytic process thatconverts propane into propylene and hydrogen (by-product). The yield of propylene from propane isabout 85 wt%. The reaction by-products (mainlyhydrogen) are usually used as fuel for the propanedehydrogenation reaction. As a result, propylenetends to be the only product, unless local demandexists for the hydrogen by-product.
Methanol-to-Olefins/Methanol-to-Propylene. Agroup of technologies that first converts synthesis gas(syngas) to methanol, and then converts the methanolto ethylene and/or propylene. The process alsoproduces water as by-product. Synthesis gas isproduced from the reformation of natural gas or by thesteam-induced reformation of petroleum productssuch as naphtha, or by gasification of coal. A largeamount of methanol is required to make a world-scaleethylene and/or propylene plant.
High Severity FCC. Refers to a group of technologiesthat use traditional FCC technology under severeconditions (higher catalyst-to-oil ratios, higher steaminjection rates, higher temperatures, etc.) in order tomaximize the amount of propylene and other lightproducts. A high severity FCC unit is usually fed with
12
Intr
ate
c | S
tud
y B
ackg
rou
nd
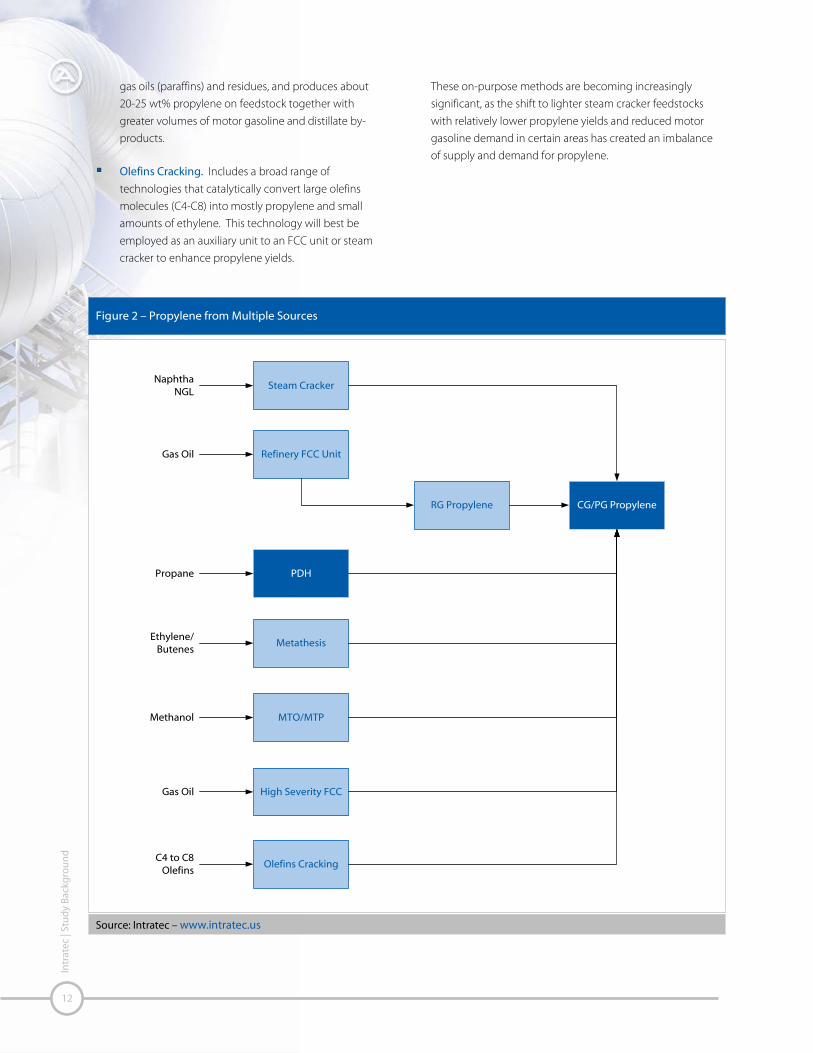
gas oils (paraffins) and residues, and produces about20-25 wt% propylene on feedstock together withgreater volumes of motor gasoline and distillate by-products.
Olefins Cracking. Includes a broad range oftechnologies that catalytically convert large olefinsmolecules (C4-C8) into mostly propylene and smallamounts of ethylene. This technology will best beemployed as an auxiliary unit to an FCC unit or steamcracker to enhance propylene yields.
These on-purpose methods are becoming increasinglysignificant, as the shift to lighter steam cracker feedstockswith relatively lower propylene yields and reduced motorgasoline demand in certain areas has created an imbalanceof supply and demand for propylene.
Figure 2 – Propylene from Multiple Sources
Steam Cracker
Refinery FCC Unit
PDH
Metathesis
MTO/MTP
High Severity FCC
Olefins Cracking
NaphthaNGL
RG Propylene CG/PG Propylene
Gas Oil
Propane
Ethylene/Butenes
Methanol
C4 to C8Olefins
Gas Oil
Source: Intratec – www.intratec.us
13
Intr
ate
c | S
tud
y B
ackg
rou
nd
Licensor(s) & Historical Aspects
The continuous rise in petroleum prices, in addition to theincrease in world demand for propylene, has led thechemical industry to innovate in the development ofproduction routes utilizing sources other than oil. In thiscontext, the recent success of shale gas exploitation in theUS is playing a key role in the shift to natural gas as a sourceof feed to olefins production. This occurs because, inaddition to methane, natural gas comprises C2-C4 paraffins,such as propane, which is more frequently being used inthe production of propylene by a dehydrogenation process.
In this context, commercial interest in propanedehydrogenation (PDH) has been increasing. Numerousplants dedicated to the process are currently underconstruction outside the United States and some areplanned for construction in the US. There are already fivelicensed technologies:
CATOFIN® from Lummus Technology;
Oleflex™ from UOP;
Fluidized Bed Dehydrogenation (FBD) fromSnamprogetti/Yarsintez;
STAR process® from Krupp Uhde; and
PDH from Linde/BASF.
The CATOFIN® process for propylene production is anextension of the CATADIENE process, originally developedin the 1960s and 1970s by Houdry for the dehydrogenationof n-butane to butadiene. The technology was firstemployed to produce isobutylene from isobutane in the1980s, with the expectation that it would supply the growthdemand of isobutylene. Isobutylene is a raw material forMTBE, an oxygenate compound that, at the time, was inincreasing demand following a U.S. amendment thatallowed the increase of oxygen content in the gasolinepool.
The CATOFIN process is now owned by Süd-Chemie and,after it was purchased from Air Products & Chemicals, wasexclusively licensed by Lummus Technology. Licensedcapacities range from 250 kta to 750 kta. At present, thereare 14 CATOFIN operating units and a total of 20 licenseesworldwide.
Major projects have been conducted, specifically in the USA.For instance, in Texas, Petrologistics operates one of the
world’s largest propane dehydrogenation units based onCATOFIN technology (about 650 kta). The construction of a750 kta CATOFIN unit has also been announced byEnterprise Products and is planned to go on stream in thenext few years.
China built its first unit PDH in mid-2010, but has at least 9plants planned. It has been confirmed that three of suchunits will rely on CATOFIN technology. The first of the threeis intended to go on stream in late 2012, while theremaining are scheduled to go on stream in 2014 and 2015.Capacities vary between 500 and 600 kta.

14
Intr
ate
c | T
ech
nic
al A
nal
ysis
Chemistry
In this technology, the dehydrogenation, an endothermicequilibrium reaction, is carried out in the presence of heavy-metal catalyst (chromium), which is manufactured by theHoudry Group of Süd-Chemie, in Louisville, Kentucky. Thefollowing equation shows the propane dehydrogenationreaction:
Propane Propylene Hydrogen
About 86 wt% of propane is converted to propylene. Thepropylene yield is favored by higher temperatures andlower pressures.
However, higher process temperatures increase thepropylene yield, provoking thermal cracking reactions.Those reactions generate undesirable by-products, thusincreasing purification costs downstream. Typical thermalcracking side reactions are shown in Figure 3.
To mitigate cracking reactions, dehydrogenation reactionoccurs in conditions such as temperature ranges between580 and 650°C, and pressures slightly below atmospheric.
Raw Material
The feedstock to a PDH process unit is propane. Propane isrecovered from propane-rich liquefied petroleum gas (LPG)streams from natural gas processing plants. Propane mayalso be obtained in smaller amounts as a by-product ofpetroleum refinery operations, such as hydrocracking andfluidized catalytic cracking (FCC).
Technical Analysis
Figure 3 – Propane Dehydrogenation Reaction Network
CH3 – CH2 – CH3
CH3 – CH = CH2
R
CH2 = CH2 C2H2n+2
CH2 = CH – CH2 – CH3
CH2 = CH – CH2 = CH3
CnH(n+y)CnH2n
Coke
CH3 – CH – CH2 – CH = CH2
CH3
–
Side reactions increase withtemperature and conversion
Aromatization
Alkylation
Side ChainAromatization
Polymerization
Coking
Dehydrogenation
Dehydrogenation
– CH4
cracking
Oligomerization
Source: Encyclopedia of Hydrocarbons, Volume II

15
Intr
ate
c | T
ech
nic
al A
nal
ysis
As natural gas offerings in the USA are significantlyincreasing due to the rising exploitation of shale gas,propane and ethane prices are decreasing.
This changes both ethylene and propylene industrialproduction by prompting new steam crackers to useethane as feedstock and causing existing naphtha crackersto shut down (or to be reconfigured to crack ethane). Sucha shift to lighter feedstock in crackers reduces both ethyleneproduction costs and propylene output as a by-product,since cracking ethane yields negligible amounts ofpropylene as by-product in comparison with crackingnaphtha.
The large amounts of shale gas reserves in the US areconsidered to be capable of supplying ethane to crackersfor many years. According to the forecast from the USEnergy Information Administration (EIA), in 2035, about halfof the natural gas production in the US will be from shalegas. This, along with the increasing trends in bothpropylene demand and propane supply, makes the PDHprocess an attractive chemical route to evaluate, not only inthe US, but also in China, where feedstock propaneimported from Middle East is available at low prices,allowing attractive margins for PDH processes.
However, in certain regions, propylene production mustcompete with the use of propane. Propane prices may beelevated in cold countries where it is used as fuel fortransportation and for domestic heating. Therefore, PDHunits may have elevated raw material costs in WesternEurope countries during the winter due to the demand forpropane as fuel.
Figure 4 – US Natural Gas Production History and
Forecast (Trillion Cubic Feet)
Source: US Energy Information Administration (EIA) AOE2012
0
5
10
15
20
25
30
1990 1995 2000 2005 2010 2015 2020 2025 2030 2035
Non-associated onshore Associated with oil
Coalbed methane Alaska
Non-associated offshore Tight gas
Shale gas
ForecastHistory

16
Intr
ate
c | T
ech
nic
al A
nal
ysis
Technology Overview
The process is separated into two different areas: thereaction and catalyst regeneration area; and the productrecovery area.
Fresh feed is mixed with recycle feed from a propylene-propane splitter (P-P Splitter) bottoms and vaporized byexchange with process streams. To achieve reactiontemperature, feed is then heated in the charge heater.
The reaction step is continuous and uses a cyclic reactoroperation, in which multiple reactors go through acontrolled sequence of reaction and the fixed catalyst bedregeneration. Since regeneration is a heat-driven processand it has been verified that temperatures decrease in thereactors due to the endothermic reactions, ancillary heatingequipment is required. Regeneration prepares the off-linereactors for their next reaction phase through the burningof any carbon deposited on the catalyst and reheating thereactor.
The reactor effluent is routed through a high pressuresteam generator, feed-effluent exchanger, and trim coolerto the compressor. The compressor discharge is cooled,dried and routed to a low temperature separation unit toreject light ends.
The low temperature area off-gas, which is hydrogen-rich, issent to a Pressure Swing Adsorption (PSA) unit. This unitseparates high-purity hydrogen by-product from light fuelgas. The liquid stream from low temperature separation,
fed to distillation facilities for product recovery.
The distillation facilities mainly consist of a deethanizer andpropylene-propane splitter. The deethanizer recovers fuelC2 and lighter hydrocarbons as the top product. Propyleneand propane are obtained as the bottom product andfollow to the P-P splitter, which produces PG propylene andrecycles propane bottom product to the reaction area.
Figure 5 – Process Block Flow Diagram
Fresh Propane
Fuel Generated
Recovered Propane
H2 By-Product
PG PropyleneArea 100Reaction & Catalyst
Regeneration
Area 200Product Recovery
C4 HydrocarbonsBy-Product
Source: Intratec – www.intratec.us

17
Intr
ate
c | T
ech
nic
al A
nal
ysis

18
Intr
ate
c | T
ech
nic
al A
nal
ysis
Labor Requirements
Table 5 - Raw Materials & Utilities Consumption (per ton
of product)
Source: Intratec – www.intratec.us
Table 6 – Design & Simulation Assumptions
Source: Intratec – www.intratec.us
Table 7 – Labor Requirements for a Typical Plant
Source: Intratec – www.intratec.us

19
Intr
ate
c | T
ech
nic
al A
nal
ysis
Figure 6 – Inside Battery Limits Conceptual Process Flow Diagram
Source: Intratec – www.intratec.us

20
Intr
ate
c | T
ech
nic
al A
nal
ysis
Figure 6 – Inside Battery Limits Conceptual Process Flow Diagram (Cont.)
Source: Intratec – www.intratec.us

21
Intr
ate
c | T
ech
nic
al A
nal
ysis
Table 8 presents the main streams composition andoperating conditions. For a more complete materialbalance, see the “Appendix A. Mass Balance & StreamsProperties.”
Information regarding utilities flow rates is provided in“Appendix B. Utilities Consumption Breakdown.” For furtherdetails on greenhouse gas emissions caused by this process,see “Appendix C. Carbon Footprint.”
ISBL Major Equipment List
Table 9 shows the equipment list by area. It also presents abrief description and the main materials used.
Find main specifications for each piece of equipment in“Appendix D. Equipment Detailed List & Sizing.”

22
Intr
ate
c | T
ech
nic
al A
nal
ysis

23
Intr
ate
c | T
ech
nic
al A
nal
ysis
OSBL Major Equipment List
The OSBL is divided into three main areas: storage (Area700), energy and water facilities (Area 800), and support &auxiliary facilities (Area 900).
Table 10 shows the list of tanks located in the storage areaand the energy facilities required in the construction of anon-integrated unit.

24
Intr
ate
c | T
ech
nic
al A
nal
ysis
Figure 7 – Typical Operating Cycle for a Eight Reactor System
Source: Intratec – www.intratec.us

25
Intr
ate
c | T
ech
nic
al A
nal
ysis

26
Intr
atec
| Ec
on
om
ic A
nal
ysis
General Assumptions
The general assumptions for the base case of this analysisare outlined below.
In Table 11, the IC Index stands for Intratec chemical plantConstruction Index, an indicator, published monthly byIntratec, to scale capital costs from one time period toanother.
This index reconciles prices trends of fundamentalcomponents of a chemical plant construction such as labor,material and energy, providing meaningful historical andforecast data for our readers and clients.
The assumed operating hours per year indicated does notrepresent any technology limitation; rather, it is anassumption based on usual industrial operating rates
Additionally, Table 11 discloses assumptions regarding theproject complexity, technology maturity and data reliability,which are of major importance for attributing reasonablecontingencies for the investment and for evaluating theoverall accuracy of estimates. Definitions and figures forboth contingencies and accuracy of economic estimatescan be found in this publication in the chapter “TechnologyEconomics Methodology.”
Economic Analysis
Table 11 – Base Case General Assumptions
Source: Intratec – www.intratec.us
Figure 8 – Project Implementation Schedule
Source: Intratec – www.intratec.us

27
Intr
atec
| Ec
on
om
ic A
nal
ysis
Project Implementation
Schedule
The main objective of knowing upfront the projectimplementation schedule is to enhance the estimates forboth capital initial expenses and return on investment.
The implementation phase embraces the period from thedecision to invest to the start of commercial production.This phase can be divided into five major stages: (1) BasicEngineering, (2) Detailed Engineering, (3) Procurement, (4)Construction, and (5) Plant Start-up.
The duration of each phase is detailed in Figure 8.
Capital Expenditures
Fixed Investment
Table 12 shows the bare equipment cost associated witheach area of the project.
Table 13 presents the breakdown of the total fixedinvestment (TFI) per item (direct & indirect costs and projectcontingencies). For further information about thecomponents of the TFI please see the chapter “TechnologyEconomics Methodology”.
Fundamentally, the direct costs are the total direct materialand labor costs associated with the equipment (includinginstallation bulks). The total direct cost represents the totalbare equipment installed cost.
“Appendix E. Detailed Capital Expenses” provides a detailedbreakdown for the direct expenses, outlining the share ofeach type of equipment in total.
After defining the total direct cost, the TFI is established byadding field indirects, engineering costs, overhead, contractfees and contingencies.
Indirect costs are defined by the American Association ofCost Engineers (AACE) Standard Terminology as those"costs which do not become a final part of the installationbut which are required for the orderly completion of theinstallation."
Table 12 - Bare Equipment Cost per Area (USD
Thousands)
Source: Intratec – www.intratec.us
Table 13 – Total Fixed Investment Breakdown (USD
Thousands)
Source: Intratec – www.intratec.us

28
Intr
atec
| Ec
on
om
ic A
nal
ysis
The indirect project expenses are further detailed in“Appendix E. Detailed Capital Expenses”
Alternative OSBL Configurations
The total fixed investment for the construction of a newchemical plant is greatly impacted by how well it will beable to take advantage of the infrastructure already installedin that location.
For example, if there are nearby facilities consuming a unit’sfinal product or supplying a unit’s feedstock, the need forstorage facilities significantly decreases, along with the totalfixed investment required. This is also true for supportfacilities that can serve more than one plant in the samecomplex, such as a parking lot, gate house, etc.
This study analyzes the total fixed investment for threedistinct scenarios regarding OSBL facilities:
Non-Integrated Plant
Plant Partially Integrated
Plant Fully Integrated
The detailed definition, as well as the assumptions used foreach scenario is presented in the chapter “About this Study”
The influence of the OSBL facilities on the capitalinvestment is depicted in Figure 9 and in Figure 10.

29
Intr
atec
| Ec
on
om
ic A
nal
ysis
Figure 9 – Total Direct Cost of Different Integration Scenarios (USD Thousands)
Source: Intratec – www.intratec.us
Figure 10 – Total Fixed Investment of Different Integration Scenarios (USD Thousands)
Source: Intratec – www.intratec.us

30
Intr
atec
| Ec
on
om
ic A
nal
ysis
Working Capital
Working capital, described in Table 14, is another significantinvestment requirement. It is needed to meet the costs oflabor; maintenance; purchase, storage, and inventory offield materials; and storage and sales of product(s).
Assumptions for working capital calculations are found in“Appendix F. Economic Assumptions.”
Figure 11 – Total Fixed Investment Validation (USD Million)
Source: Intratec – www.intratec.us
Table 14 – Working Capital (USD Million)
Source: Intratec – www.intratec.us

31
Intr
atec
| Ec
on
om
ic A
nal
ysis
Other Capital Expenses
Start-up costs should also be considered when determiningthe total capital expenses. During this period, expenses areincurred for employee training, initial commercializationcosts, manufacturing inefficiencies and unscheduled plantmodifications (adjustment of equipment, piping,instruments, etc.).
Initial costs are not addressed in most studies on estimatingbut can become a significant expenditure. For instance, theinitial catalyst load in reactors may be a significant cost and,in that case, should also be included in the capitalestimates.
The purchase of technology through paid-up royalties orlicenses is considered to be part of the capital investment.
Other capital expenses frequently neglected are landacquisition and site development. Although these are smallparts of the total capital expenses, they should be included.
Assumptions used to calculate other capital expenses areprovided in “Appendix F. Economic Assumptions.”
Total Capital Expenses
Table 16 presents a summary of the total CapitalExpenditures (CAPEX) detailed in previous sections.
Operational Expenditures
Manufacturing Costs
The manufacturing costs, also called OperationalExpenditures (OPEX), are composed of two elements: a fixedcost and a variable cost. All figures regarding operationalcosts are presented in USD per ton of product.
Table 17 shows the manufacturing fixed cost.
To learn more about the assumptions for manufacturingfixed costs, see the “Appendix F. Economic Assumptions.”
Table 15 – Other Capital Expenses (USD Million)
Source: Intratec – www.intratec.us
Table 16 – CAPEX (USD Million)
Source: Intratec – www.intratec.us
Table 17 – Manufacturing Fixed Cost (USD/ton)
Source: Intratec – www.intratec.us
32
Intr
atec
| Ec
on
om
ic A
nal
ysis
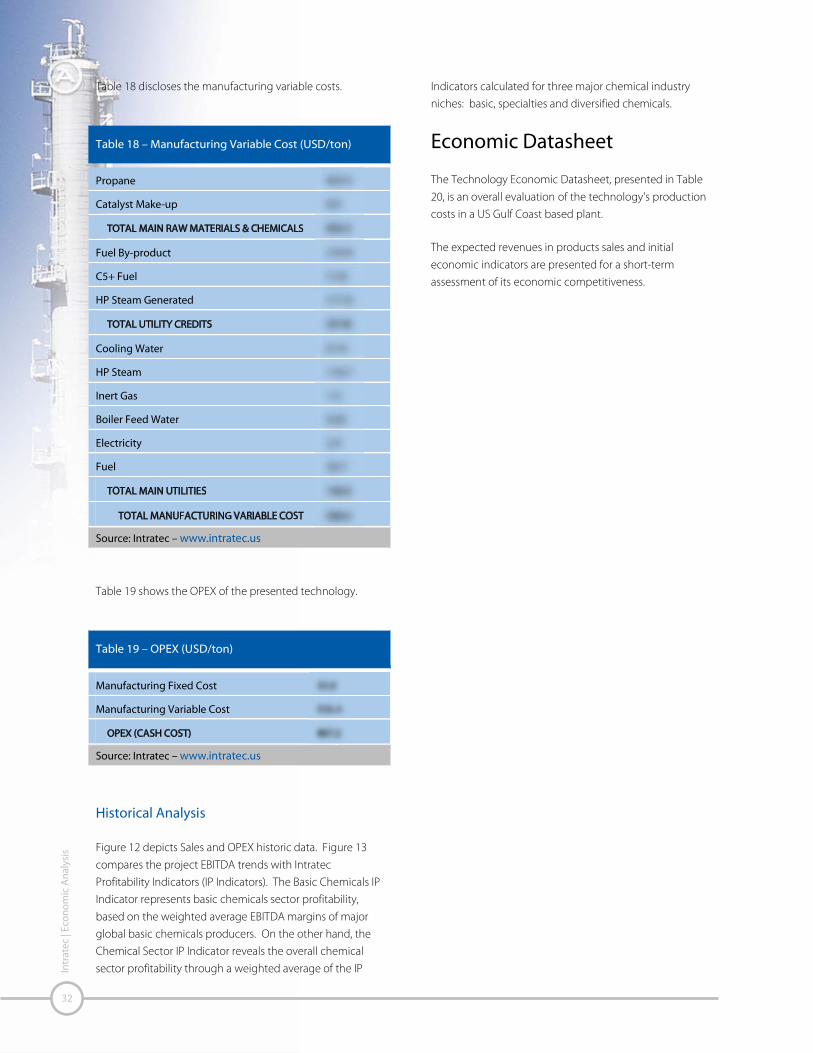
Table 18 discloses the manufacturing variable costs.
Table 19 shows the OPEX of the presented technology.
Historical Analysis
Figure 12 depicts Sales and OPEX historic data. Figure 13compares the project EBITDA trends with IntratecProfitability Indicators (IP Indicators). The Basic Chemicals IPIndicator represents basic chemicals sector profitability,based on the weighted average EBITDA margins of majorglobal basic chemicals producers. On the other hand, theChemical Sector IP Indicator reveals the overall chemicalsector profitability through a weighted average of the IP
Indicators calculated for three major chemical industryniches: basic, specialties and diversified chemicals.
Economic Datasheet
The Technology Economic Datasheet, presented in Table20, is an overall evaluation of the technology's productioncosts in a US Gulf Coast based plant.
The expected revenues in products sales and initialeconomic indicators are presented for a short-termassessment of its economic competitiveness.
Table 18 – Manufacturing Variable Cost (USD/ton)
Source: Intratec – www.intratec.us
Table 19 – OPEX (USD/ton)
Source: Intratec – www.intratec.us

33
Intr
atec
| Ec
on
om
ic A
nal
ysis
Figure 12 – OPEX and Product Sales History (USD/ton)
Source: Intratec – www.intratec.us
Figure 13 – EBITDA Margin & IP Indicators History Comparison
Source: Intratec – www.intratec.us

34
Intr
atec
| Ec
on
om
ic A
nal
ysis

35
Intr
ate
c | R
egio
nal
Co
mp
aris
on
& E
con
om
ic D
iscu
ssio
n
Regional Comparison
Capital Expenses
Variations in productivity, labor costs, local steel prices,equipment imports needs, freight, taxes and duties onimports, regional business environments and localavailability of sparing equipment were considered whencomparing capital expenses for the different regions underconsideration in this report.
Capital costs are adjusted from the base case (a plantconstructed on the US Gulf Coast) to locations of interest byusing location factors calculated according to theaforementioned items. For further information aboutlocation factor calculation, please examine the chapter“Technology Economics Methodology”. In addition, thelocation factors for the regions analyzed are further detailedin “Appendix F. Economic Assumptions.”
Figure 14 summarizes the total Capital Expenditures(CAPEX) for the locations under analysis.
Operational Expenses
Specific regional conditions influence prices for rawmaterials, utilities and products. Such differences are thusreflected in the operating costs. An OPEX breakdownstructure for the different locations approached in this studyis presented in Figure 15.
Economic Datasheet
The Technology Economic Datasheet, presented in Table21, is an overall evaluation of the technology's capitalinvestment and production costs in the alternative locationanalyzed in this study.
Regional Comparison & Economic Discussion
Figure 14 – CAPEX per Location (USD Million)
Source: Intratec – www.intratec.us

36
Intr
ate
c | R
egio
nal
Co
mp
aris
on
& E
con
om
ic D
iscu
ssio
n
Figure 15 – Operating Costs Breakdown per Location (USD/ton)
Source: Intratec – www.intratec.us

37
Intr
ate
c | R
egio
nal
Co
mp
aris
on
& E
con
om
ic D
iscu
ssio
n

38
Intr
atec
| R
efe
ren
ces
References

39
Intr
ate
c | A
cro
nym
s, L
eg
en
ds
& O
bse
rvat
ion
s
AACE: American Association of Cost Engineers
C: Distillation, stripper, scrubber columns (e.g., C-101 woulddenote a column tag)
C2, C3, ... Cn: Hydrocarbons with "n" carbon atoms
C2=, C3=, ... Cn=: Alkenes with "n" number of carbon atoms
CAPEX: Capital expenditures
CC: Distillation column condenser
CG: Chemical grade
CK: Distillation column compressor
CP: Distillation column reflux pump
CR: Distillation column reboiler
CT: Cooling tower
CV: Distillation column accumulator drum
E: Heat exchangers, heaters, coolers, condensers, reboilers(e.g., E-101 would denote a heat exchanger tag)
EBIT: Earnings before Interest and Taxes
EBITDA: Earnings before Interests, Taxes, Depreciation andAmortization
EIA: Energy Information Administration
F: Furnaces, fired heaters (e.g., F-101 would denote afurnace tag)
FCC: Fluid catalytic cracking
IC Index: Intratec Chemical Plant Construction Index
IP Indicator: Intratec Chemical Sector Profitability Indicator
ISBL: Inside battery limits
K: Compressors, blowers, fans (e.g., K-101 would denote acompressor tag)
KPI: Key Performance Indicator
kta: thousands metric tons per year
LPG: Liquefied petroleum gas
MTO: Methanol-to-Olefins
MTP: Methanol-to-Propylene
NGL: Natural gas liquids
OCT: Olefin Conversion Technology
OPEX: Operational Expenditures
OSBL: Outside battery limits
P: Pumps (e.g., P-101 would denote a pump tag)
PDH: Propane dehydrogenation
PG: Polymer grade
PP: Polypropylene
P-P: Propane-Propylene
PSA: Pressure swing adsorption
R: Reactors, treaters (e.g., R-101 would denote a reactor tag)
RF: Refrigerant
RG: Refinery grade
SB: Steam boiler
Syngas: Synthesis gas
T: Tanks (e.g., T-101 would denote a tank tag)
TFI: Total Fixed Investment
TPC: Total process cost
V: Horizontal or vertical drums, vessels (e.g., V-101 woulddenote a vessel tag)
WD: Demineralized water
X: Special equipment (e.g., X-101 would denote a specialequipment tag)
Obs.: 1 ton = 1 metric ton = 1,000 kg
Acronyms, Legends & Observations
40
Intr
ate
c | T
ech
no
log
y Ec
on
om
ics
Met
ho
do
log
y
Intratec Technology Economics methodologyensures a holistic, coherent and consistenttechno-economic evaluation, ensuring a clearunderstanding of a specific mature chemicalprocess technology.
Introduction
The same general approach is used in the development ofall Technology Economics assignments. To know moreabout Intratec’s methodology, see Figure 16.
While based on the same methodology, all TechnologyEconomics studies present uniform analyses with identicalstructures, containing the same chapters and similar tablesand charts. This provides confidence to everyone interestedin Intratec’s services since they will know upfront what theywill get.
Workflow
Once the scope of the study is fully defined andunderstood, Intratec conducts a comprehensivebibliographical research in order to understand technicalaspects involved with the process analyzed.
Subsequently, the Intratec team simultaneously developsthe process description and the conceptual process flowdiagram based on:
a. Patent and technical literature research
b. Non-confidential information provided by technologylicensors
c. Intratec's in-house database
d. Process design skills
Next, all the data collected are used to build a rigoroussteady state process simulation model in Aspen Hysysand/or Aspen Plus, leading commercial processflowsheeting software tools.
From this simulation, material balance calculations areperformed around the process, key process indicators areidentified and main equipment listed.
Equipment sizing specifications are defined based onIntratec's equipment design capabilities and an extensiveuse of AspenONE Engineering Software Suite that enablesthe integration between the process simulation developedand equipment design tools. Both equipment sizing andprocess design are prepared in conformance with generallyaccepted engineering standards.
Then, a cost analysis is performed targeting ISBL & OSBLfixed capital costs, manufacturing costs, and overall workingcapital associated with the examined process technology.Equipment costs are primarily estimated using AspenProcess Economic Analyzer (formerly Aspen Icarus)customized models and Intratec's in-house database.
Cost correlations and, occasionally, vendor quotes of uniqueand specialized equipment may also be employed. One ofthe overall objectives is to establish Class 3 cost estimates1
with a minimum design engineering effort.
Next, capital and operating costs are assembled in MicrosoftExcel spreadsheets, and an economic analysis of suchtechnology is performed.
Finally, two analyses are completed, examining:
a. The total fixed investment in different constructionscenarios, based on the level of integration of the plantwith nearby facilities
b. The capital and operating costs for a second differentplant location
1 These are estimates that form the basis for budget authorization,appropriation, and/or funding. Accuracy ranges for this class ofestimates are + 10% to + 30% on the high side, and - 10 % to - 20 %on the low side.
Technology Economics Methodology

41
Intr
ate
c | T
ech
no
log
y Ec
on
om
ics
Met
ho
do
log
y
Figure 16 – Methodology Flowchart
Intratec Internal Database
Non-ConfidentialInformation from
Technology Licensors orSuppliers
Aspen Plus, Aspen HysysAspen Exchanger Design &
Rating, KG Tower, Sulcoland Aspen Energy Analyzer
Bibliographical Research
Material & Energy Balances, KeyProcess Indicators, List of
Equipment & Equipment Sizing
Capital Cost (CAPEX)& Operational Cost (OPEX)
Estimation
Patent and TechnicalLiterature Databases
Pricing Data Gathering: RawMaterials, Chemicals,Utilities and Products
Aspen Process EconomicAnalyzer, Aspen Capital
Cost Estimator, Aspen In-Plant Cost Estimator &
Intratec In-House Database
Construction LocationFactor
(http://base.intratec.us)
Project Development Phases
Information Gathering / Tools
Vendor Quotes
Study Understanding -Validation of Project Inputs
Technical Validation –Process Description &
Flow Diagram
Final Review &Adjustments
Economic Analysis
Analyses ofDifferent Construction
Scenarios and Plant Location
Source: Intratec – www.intratec.us

42
Intr
ate
c | T
ech
no
log
y Ec
on
om
ics
Met
ho
do
log
y
Capital & Operating Cost
Estimates
The cost estimate presented in the current study considersa process technology based on a standardized designpractice, typical of a major chemical company. The specificdesign standards employed can have a significant impacton capital costs.
The basis for the capital cost estimate is that the plant isconsidered to be built in a clear field with a typical largesingle-line capacity. In comparing the cost estimate herebypresented with an actual project cost or contractor'sestimate, the following must be considered:
Minor differences or details (many times, unnoticed)between similar processes can affect cost noticeably.
The omission of process areas in the design consideredmay invalidate comparisons with the estimated costpresented.
Industrial plants may be overdesigned for particularobjectives and situations.
Rapid fluctuation of equipment or construction costsmay invalidate cost estimate.
Equipment vendors or engineering companies mayprovide goods or services below profit margins duringeconomic downturns.
Specific locations may impose higher taxes and fees,which can impact costs considerably.
In addition, no matter how much time and effort aredevoted to accurately estimating costs, errors may occurdue to the aforementioned factors, as well as cost and laborchanges, construction problems, weather-related issues,strikes, or other unforeseen situations. This is partiallyconsidered in the project contingency. Finally, it mustalways be remembered that an estimated project cost is notan exact number, but rather is a projection of the probablecost.
ISBL Investment
The ISBL investment includes the fixed capital cost of themain processing units of the plant necessary to themanufacturing of products. The ISBL investment includesthe installed cost of the following items:
Process equipment (e.g., reactors and vessels, heatexchangers, pumps, compressors, etc.)
Process equipment spares
Housing for process units
Pipes and supports within the main process units
Instruments, control systems, electrical wires and otherhardware
Foundations, structures and platforms
Insulation, paint and corrosion protection
In addition to the direct material and labor costs, the ISBLaddresses indirect costs, such as construction overheads,including: payroll burdens, field supervision, equipmentrentals, tools, field office expenses, temporary facilities, etc.
OSBL Investment
The OSBL investment accounts for auxiliary items necessaryto the functioning of the production unit (ISBL), but whichperform a supporting and non-plant-specific role. OSBLitems considered may vary from process to process. TheOSBL investment could include the installed cost of thefollowing items:
Storage and packaging (storage, bagging and awarehouse) for products, feedstocks and by-products
Steam units, cooling water and refrigeration systems
Process water treating systems and supply pumps
Boiler feed water and supply pumps
Electrical supply, transformers, and switchgear
Auxiliary buildings, including all services andequipment of: maintenance, stores warehouse,laboratory, garages, fire station, change house,cafeteria, medical/safety, administration, etc.
General utilities including plant air, instrument air, inertgas, stand-by electrical generator, fire water pumps,etc.
Pollution control, organic waste disposal, aqueouswaste treating, incinerator and flare systems

43
Intr
ate
c | T
ech
no
log
y Ec
on
om
ics
Met
ho
do
log
y
Working Capital
For the purposes of this study,2 working capital is defined asthe funds, in addition to the fixed investment, that acompany must contribute to a project. Those funds mustbe adequate to get the plant in operation and to meetsubsequent obligations.
The initial amount of working capital is regarded as aninvestment item. This study uses the followingitems/assumptions for working capital estimation:
Accounts receivable. Products and by-productsshipped but not paid by the customer; it representsthe extended credit given to customers (estimated as acertain period – in days – of manufacturing expensesplus depreciation).
Accounts payable. A credit for accounts payable suchas feedstock, catalysts, chemicals, and packagingmaterials received but not paid to suppliers (estimatedas a certain period – in days – of manufacturingexpenses).
Product inventory. Products and by-products (ifapplicable) in storage tanks. The total amount dependson sales flow for each plant, which is directly related toplant conditions of integration to the manufacturing ofproduct‘s derivatives (estimated as a certain period – indays – of manufacturing expenses plus depreciation,defined by plant integration circumstances).
Raw material inventory. Raw materials in storagetanks. The total amount depends on raw materialavailability, which is directly related to plant conditionsof integration to raw material manufacturing(estimated as a certain period – in days – of rawmaterial delivered costs, defined by plant integrationcircumstances).
In-process inventory. Material contained in pipelinesand vessels, except for the material inside the storagetanks (assumed to be 1 day of manufacturingexpenses).
Supplies and stores. Parts inventory and minor spareequipment (estimated as a percentage of totalmaintenance materials costs for both ISBL and OSBL).
2 The accounting definition of working capital (total current assetsminus total current liabilities) is applied when considering theentire company.
Cash on hand. An adequate amount of cash on handto give plant management the necessary flexibility tocover unexpected expenses (estimated as a certainperiod – in days – of manufacturing expenses).
Start-up Expenses
When a process is brought on stream, there are certain one-time expenses related to this activity. From a timestandpoint, a variable undefined period exists between thenominal end of construction and the production of qualityproduct in the quantity required. This period is commonlyreferred to as start-up.
During the start-up period expenses are incurred foroperator and maintenance employee training, temporaryconstruction, auxiliary services, testing and adjustment ofequipment, piping, and instruments, etc. Our method ofestimating start-up expenses consists of four components:
Labor component. Represents costs of plant crewtraining for plant start-up, estimated as a certainnumber of days of total plant labor costs (operators,supervisors, maintenance personnel and laboratorylabor).
Commercialization cost. Depends on raw materialsand products negotiation, on how integrated the plantis with feedstock suppliers and consumer facilities, andon the maturity of the technology. It ranges from 0.5%to 5% of annual manufacturing expenses.
Start-up inefficiency. Takes into account thoseoperating runs when production cannot bemaintained or there are false starts. The start-upinefficiency varies according to the process maturity:5% for new and unproven processes, 2% for new andproven processes, and 1% for existing licensedprocesses, based on annual manufacturing expenses.
Unscheduled plant modifications. A key fault thatcan happen during the start-up of the plant is the riskthat the product(s) may not meet specificationsrequired by the market. As a result, equipmentmodifications or additions may be required.

44
Intr
ate
c | T
ech
no
log
y Ec
on
om
ics
Met
ho
do
log
y
Other Capital Expenses
Prepaid Royalties. Royalty charges on portions of theplant are usually levied for proprietary processes. Avalue ranging from 0.5 to 1% of the total fixedinvestment (TFI) is generally used.
Site Development. Land acquisition and sitepreparation, including roads and walkways, parking,railroad sidings, lighting, fencing, sanitary and stormsewers, and communications.
Manufacturing Costs
Manufacturing costs do not include post-plant costs, whichare very company specific. These consist of sales, generaland administrative expenses, packaging, research anddevelopment costs, and shipping, etc.
Operating labor and maintenance requirements have beenestimated subjectively on the basis of the number of majorequipment items and similar processes, as noted in theliterature.
Plant overhead includes all other non-maintenance (laborand materials) and non-operating site labor costs forservices associated with the manufacture of the product.Such overheads do not include costs to develop or marketthe product.
G & A expenses represent general and administrative costsincurred during production such as: administrativesalaries/expenses, research & development, productdistribution and sales costs.
Contingencies
Contingency constitutes an addition to capital costestimations, implemented based on previously availabledata or experience to encompass uncertainties that mayincur, to some degree, cost increases. According torecommended practice, two kinds of contingencies areassumed and applied to TPC: process contingency andproject contingency.
Process contingency is utilized in an effort to lessen theimpact of absent technical information or the uncertainty ofthat which is obtained. In that manner, the reliability of theinformation gathered, its amount and the inherentcomplexity of the process are decisive for its evaluation.Errors that occur may be related to:
Uncertainty in process parameters, such as severity ofoperating conditions and quantity of recycles
Addition and integration of new process steps
Estimation of costs through scaling factors
Off-the-shelf equipment
Hence, process contingency is also a function of thematurity of the technology, and is usually a value between5% and 25% of the direct costs.
The project contingency is largely dependent on the plantcomplexity and reflects how far the conducted estimation isfrom the definitive project, which includes, from theengineering point of view, site data, drawings and sketches,suppliers’ quotations and other specifications. In addition,during construction some constraints are verified, such as:
Project errors or incomplete specifications
Strike, labor costs changes and problems caused byweather
Intratec’s definitions in relation to complexity and maturityare the following:
Complexity
SimpleSomewhat simple, widely known
processes
Typical Regular process
Complex
Several unit operations, extreme
temperature or pressure, more
instrumentation
Maturity
New &
ProvenFrom 1 to 2 commercial plants
Licensed 3 or more commercial plants
Table 22 – Project Contingency
Plant Complexity Complex Typical Simple
Project Contingency 25% 20% 15%
Source: Intratec – www.intratec.us
Table 23 – Criteria Description
Source: Intratec – www.intratec.us

45
Intr
ate
c | T
ech
no
log
y Ec
on
om
ics
Met
ho
do
log
y
Accuracy of Economic Estimates
The accuracy of estimates gives the realized range of plantcost. The reliability of the technical information available isof major importance.
The non-uniform spread of accuracy ranges (+30 to – 20 %,rather than ±25%, e.g.) is justified by the fact that theunavailability of complete technical information usuallyresults in under estimating rather than over estimatingproject costs.
Location Factor
A location factor is an instantaneous, total cost factor usedfor converting a base project cost from one geographiclocation to another.
A properly estimated location factor is a powerful tool, bothfor comparing available investment data and evaluatingwhich region may provide greater economic attractivenessfor a new industrial venture. Considering this, Intratec hasdeveloped a well-structured methodology for calculatingLocation Factors, and the results are presented for specificregions’ capital costs comparison.
Intratec’s Location Factor takes into consideration thedifferences in productivity, labor costs, local steel prices,equipment imports needs, freight, taxes and duties onimported and domestic materials, regional businessenvironments and local availability of sparing equipment.For such analyses, all data were taken from internationalstatistical organizations and from Intratec’s database.Calculations are performed in a comparative manner, takinga US Gulf Coast-based plant as the reference location. Thefinal Location Factor is determined by four major indexes:Business Environment, Infrastructure, Labor, and Material.
The Business Environment Factor and the InfrastructureFactor measure the ease of new plant installation in
different countries, taking into consideration the readinessof bureaucratic procedures and the availability and qualityof ports or roads.
Labor and material, in turn, are the fundamentalcomponents for the construction of a plant and, for thisreason, are intrinsically related to the plant costs. Thisconcept is the basis for the methodology, which aims torepresent the local discrepancies in labor and material.
Productivity of workers and their hourly compensation areimportant for the project but, also, the qualification ofworkers is significant to estimating the need for foreignlabor.
On the other hand, local steel prices are similarly important,since they are largely representative of the costs ofstructures, piping, equipment, etc. Considering thecontribution of labor in these components, workers’qualifications are also indicative of the amount that needsto be imported. For both domestic and imported materials,a Spare Factor is considered, aiming to represent the needfor spare rotors, seals and parts of rotating equipment.
The sum of the corrected TFI distribution reflects the relativecost of the plant, this sum is multiplied by the Infrastructureand the Business Environment Factors, yielding the LocationFactor.
For the purpose of illustrating the conducted methodology,a block flow diagram is presented in Figure 17 in which thefour major indexes are presented, along with some of theircomponents.
Table 24 – Accuracy of Economic Estimates
Reliability Low Moderate High Very
High
Accuracy+ 30%
- 20%
+ 22%
- 18%
+ 18%
- 14%
+ 10%
- 10%
Source: Intratec – www.intratec.us

46
Intr
ate
c | T
ech
no
log
y Ec
on
om
ics
Met
ho
do
log
y
Figure 17 – Location Factor Composition
Infrastructure FactorLabor Index
Location Factor
Material Index Business Environment
Factor
Local Labor IndexRelative SalaryProductivity
Expats Labor
Domestic Material IndexRelative Steel PricesLabor IndexTaxes and FreightRatesSpares
Imported MaterialTaxes and FreightRatesSpares
Ports, Roads, Airportsand Rails (Availabilityand Quality)CommunicationTechnologiesWarehouseInfrastructureBorder ClearanceLocal Incentives
Readiness ofBureaucraticProceduresLegal Protection ofInvestorsTaxes
Source: Intratec – www.intratec.us

47
Intr
ate
c | A
pp
en
dix
A. M
ass
Bal
ance
& S
tre
ams
Pro
pe
rtie
s

48
Intr
ate
c | A
pp
en
dix
A. M
ass
Bal
ance
& S
tre
ams
Pro
pe
rtie
s
Mass Enthalpy
(kcal/kg)
Mass Heat Capacity
(kJ/kg °C)

49
Intr
atec
| A
pp
end
ix A
. Mas
s B
alan
ce &
Str
eam
s P
rop
erti
esMass Heat Capacity
(kJ/kg °C)
Viscosity (cP)

50
Intr
ate
c | A
pp
en
dix
A. M
ass
Bal
ance
& S
tre
ams
Pro
pe
rtie
s

51
Intr
ate
c | A
pp
en
dix
A. M
ass
Bal
ance
& S
tre
ams
Pro
pe
rtie
s

52
Intr
ate
c | A
pp
en
dix
B. U
tilit
ies
Co
nsu
mp
tio
n B
reak
do
wn

53
Intr
atec
| A
pp
end
ix C
. Car
bo
n F
oo
tpri
nt
The process’ carbon footprint can be defined as the totalamount of greenhouse gas (GHG) emissions caused by theprocess operation.
Although it is difficult to precisely account for the totalemissions generated by a process, it is possible to estimatethe major emissions, which can be divided into:
Direct emissions. Emissions caused by process wastestreams combusted in flares.
Indirect emissions. The ones caused by utilitiesgeneration or consumption, such as the emissions dueto using fuel in furnaces for heating process streams.Fuel used in steam boilers, electricity generation, andany other emissions in activities to support processoperation are also considered indirect emissions.
In order to estimate the direct emissions, it is necessary toknow the composition of the streams, as well as theoxidation factor.
Estimation of indirect emissions requires specific data,which depends on the plant location, such as the localelectric power generation profile, and on the plantresources, such as the type of fuel used.
The assumptions for the process carbon footprintcalculation are presented in Table 27 and the results areprovided in Table 28
Equivalent carbon dioxide (CO2e) is a measure thatdescribes the amount of CO2 that would have the sameglobal warming potential of a given greenhouse gas, whenmeasured over a specified timescale.
All values and assumptions used in calculations are basedon data provided by the Environment Protection Agency(EPA) Climate Leaders Program.
Appendix C. Carbon Footprint
Table 27 – Assumptions for CO2e Emissions Calculation
Source: Intratec – www.intratec.us
Table 28 – CO2e Emissions (ton/ton prod.)
Source: Intratec – www.intratec.us

54
Intr
atec
| A
pp
end
ix D
. Eq
uip
men
t D
etai
led
Lis
t &
Siz
ing
Actual gas flow rate
Inlet (m3/h)
Design gauge
pressure Outlet (barg)
Source: Intratec – www.intratec.us

55
Intr
atec
| A
pp
end
ix D
. Eq
uip
men
t D
etai
led
Lis
t &
Siz
ing
Design gauge pressure
(barg)
Design temperature
(deg C)
Shell design
temperature (deg C)
Shell material
Tube design gauge
pressure (barg)
Tube design
temperature (deg C)

56
Intr
atec
| A
pp
end
ix D
. Eq
uip
men
t D
etai
led
Lis
t &
Siz
ing
Shell design
temperature (deg C)
Shell material
Tube design gauge
pressure (barg)
Tube design
temperature (deg C)

57
Intr
atec
| A
pp
end
ix D
. Eq
uip
men
t D
etai
led
Lis
t &
Siz
ing
Design gauge
pressure (barg)
Design temperature
(deg C)
Duty (MW)
Heat transfer area
(m2)
Shell design
temperature (deg C)
Tube design gauge
pressure (barg)
Shell material
Tube design
temperature (deg C)

58
Intr
atec
| A
pp
end
ix D
. Eq
uip
men
t D
etai
led
Lis
t &
Siz
ing
Design gauge pressure
(barg)
Design temperature
(deg C)
Material
Shell design gauge
pressure (barg)
Shell design
temperature (deg C)
Shell material
Tube design gauge
pressure (barg)
Tube design
temperature (deg C)

59
Intr
atec
| A
pp
end
ix D
. Eq
uip
men
t D
etai
led
Lis
t &
Siz
ing
Design temperature
(deg C)
Liquid flow rate
(m3/h)
Source: Intratec – www.intratec.us

60
Intr
atec
| A
pp
end
ix D
. Eq
uip
men
t D
etai
led
Lis
t &
Siz
ing

61
Intr
atec
| A
pp
end
ix D
. Eq
uip
men
t D
etai
led
Lis
t &
Siz
ing
Design gauge
pressure (barg)
Design temperature
(deg C)
Design gauge
pressure (barg)
Design temperature
(deg C)

62
Intr
atec
| A
pp
end
ix D
. Eq
uip
men
t D
etai
led
Lis
t &
Siz
ing
Table 35 – Vessels & Tanks (Cont.)
Design gauge
pressure (barg)
Design temperature
(deg C)
Design gauge
pressure (barg)
Design
temperature
(deg C)
Liquid volume
(m3)

63
Intr
atec
| A
pp
end
ix D
. Eq
uip
men
t D
etai
led
Lis
t &
Siz
ing
Design gauge
pressure (barg)
Design temperature
(deg C)

64
Intr
atec
| A
pp
end
ix E
. De
taile
d C
apit
al E
xpe
nse
s
Direct Costs Breakdown
Appendix E. Detailed Capital Expenses
Figure 18 – ISBL Direct Costs Breakdown by Equipment Type (Base Case)
Source: Intratec – www.intratec.us
Figure 19 – OSBL Direct Costs by Equipment Type (Base Case)
Source: Intratec – www.intratec.us

65
Intr
atec
| A
pp
end
ix E
. De
taile
d C
apit
al E
xpe
nse
s

66
Intr
ate
c | A
pp
en
dix
F. E
con
om
ic A
ssu
mp
tio
ns
Capital Expenditures
For a better description of working capital and other capitalexpenses components, as well as the location factorsmethodology, see the chapter “Technology EconomicsMethodology.”
Construction Location Factors
Working Capital
Raw Materials
Inventory
Supplies and
Stores
Appendix F. Economic Assumptions
Table 37 – Detailed Construction Location Factor
Source: Intratec – www.intratec.us
Table 38 – Working Capital Assumptions (Base Case)
Source: Intratec – www.intratec.us
Table 39 – Other Capital Expenses Assumptions (Base
Case)
Source: Intratec – www.intratec.us

67
Intr
ate
c | A
pp
en
dix
F. E
con
om
ic A
ssu
mp
tio
ns
Operational Expenses
Fixed Costs
Fixed costs are estimated based on the specificcharacteristics of the process. The fixed costs, like operatingcharges and plant overhead, are typically calculated as apercentage of the industrial labor costs, and G & A expensesare added as a percentage of the operating costs.
The goal of depreciation is to allow a credit againstmanufacturing costs, and hence taxes, for the non-recoverable capital expenses of an investment. Thedepreciable portion of capital expense is the total fixedinvestment.
Table 41 shows the project depreciation value and theassumptions used in its calculation.
Table 40 – Other Fixed Cost Assumptions
Source: Intratec – www.intratec.us
Figure 20 – Historical EBITDA Margins Regional Comparison
Source: Intratec – www.intratec.us
Table 41 – Depreciation Value & Assumptions
Source: Intratec – www.intratec.us

68
Intr
atec
| A
pp
end
ix G
. Rel
ease
d P
ub
licat
ion
s
The list below is intended to be an easy and quick way toidentify Intratec reports of interest. For a more completeand up-to-date list, please visit the Publications section onour website, www.intratec.us.
TECHNOLOGY ECONOMICS
Propylene Production via Metathesis: Propyleneproduction via metathesis from ethylene and butenes,in a process similar to Lummus OCT.
Propylene Production via Propane
Dehydrogenation: Propane dehydrogenation (PDH)process conducted in moving bed reactors, in aprocess similar to UOP OLEFLEX™.
Propylene Production from Methanol: Propyleneproduction from methanol, in a process is similar toLurgi MTP®.
Polypropylene Production via Gas Phase Process: Agas phase type process similar to the Dow UNIPOL™ PPprocess to produce both polypropylene homopolymerand random copolymer.
Polypropylene Production via Gas Phase Process,
Part 2: A gas phase type process similar to LummusNOVOLEN® for production of both homopolymer andrandom copolymer.
Sodium Hypochlorite Chemical Production: Sodiumhypochlorite (bleach) production, in a widely usedindustrial process, similar to that employed by SolvayChemicals, for example.
Propylene Production via Propane
Dehydrogenation, Part 2: Propane dehydrogenation(PDH) in fixed bed reactors, in a process is similar toLummus CATOFIN®.
Propylene Production via Propane
Dehydrogenation, Part 3: Propane dehydrogenation(PDH) by applying oxydehydrogenation, in a processsimilar to the STAR PROCESS® licensed by Uhde.
CONCEPTUAL DESIGN
Membranes on Polyolefins Plants Vent Recovery:
The Report evaluates membrane units for theseparation of monomer and nitrogen in PP plants,similar to the VaporSep® system commercialized byMTR.
Use of Propylene Splitter to Improve Polypropylene
Business: The report assesses the opportunity ofpurchasing the less valued RG propylene to producethe PG propylene raw material used in a PP plant.
Appendix G. Released Publications

Appendix H.
Technology Economics Form
Submitted by Client

Chemical Produced by the Technology to be Studied
Define the main chemical product of your interest. Possible choices are presented below.
Choose a Chemical Acetic Acid Acetone Acrylic Acid
Acrylonitrile Adipic Acid Aniline
Benzene Butadiene n-Butanol
Isobutylene Caprolactam Chlorine
Cumene Dimethyl Ether (DME) Ethanol
Ethylene Bio-Ethylene Ethylene Glycol
Ethylene Oxide Formaldehyde HDPE
Isoprene LDPE LLDPE
MDI Methanol Methyl Methacrylate
Phenol Polypropylene (PP) Polybutylene Terephthalate
Polystyrene (PS) Polyurethanes (PU) Polyvinyl Chloride (PVC)
Propylene Propylene Glycol Propylene Oxide (PO)
Terephthalic Acid Vinyl Chloride (VCM)
If the main chemical product of your target technology is not found above, please check the "Technology Economic Form - Specialties".
Chemical Process Technology to be Studied
Identify the mature chemical process technology you would like us to assess. Intratec considers mature technologies the ones already used ona commercial scale plant.
Technology Description
E. g. technology for propylene production from methanol - similar to Lurgi MTP
Commercial Scale Unit. Inform the exact location of one commercial scale plant under operation.
Plant Location: I don't know
I know the location of a commercial plant:
If there is no commercial scale plant based on the technology of your interest, you are referred to Intratec's Research Potential advisory serviceat www.intratec.us/advisory/research-potential/overview
Industrial Unit Description
Plant Nominal Capacity Operating Hours
Inform the plant capacity to be considered in the study. Providethe main product capacity in kta (thousands of metric tons peryear of main chemical product).
Inform the assumption for the number of hours the plantoperates in a year.
Plant Capacity 150 kta
300 kta
Other (kta)
Operating Hours 8,000 h/year
Other (h/year)
Technology for Propane Dehydrogenation. Similar to CB&I Lummus CATOFIN
Petrologistics Houston Site, TX - United States
590

Analysis Date
Define the date (quarter and year) that will be considered in the analysis. Our databases can provide consolidated values from the year 2000up to the last closed quarter, quarter-to-date values are estimated.
Quarter Year
Storage Facilities
Define the assumptions employed for the storage facilities design.
Products 20 days
Other
By-Products 20 days
Other
Raw Materials 20 days
Other
Utilities Supply Facilities
The construction of supply facilities for the utilities required (e.g. cooling tower, boiler unit, refrigeration unit) impacts the capital investmentfor the construction of the unit.
Consider construction of supply facilities ? Yes No
General Design Conditions
General utilities and environmental conditions that may be relevant to the process simulation are presented below. Provide other assumptions ifyou deem necessary.
Specification Unit Default Value User-specified value
Cooling water temperature ºC 24 DSPEC1
Cooling water range ºC 11 DSPEC2
Steam (Low Pressure) bar abs 7 DSPEC3
Steam (Medium Pressure) bar abs 11 DSPEC4
Steam (High Pressure) bar abs 28 DSPEC5
Refrigerant (Ethylene) ºC -100 DSPEC6
Refrigerant (Propane) ºC -40 DSPEC7
Refrigerant (Propylene) ºC -45 DSPEC8
Dry Bulb Air Temperature ºC 38 DSPEC9
Wet Bulb Air Temperature ºC 25 DS10
Industrial Unit Location
The location of an industrial unit influences in prices for both construction and operation of the unit. In this study, the economicperformances of TWO similar units erected in different locations are compared.
The first plant is located in the United States (US Gulf Coast) and the second location is defined by YOU.
Plant Location I would like to keep the plant location confidential.
Country (or region) to be considered.
E.g. Louisiana (USA), China or Saudi Arabia. Please define only one location.
Plant Location DataProvider
I will use Intratec's Internal Database containing standard chemical prices and location factors(only for Germany, Japan, China or Brazil).
I will provide location specific data. Please fill the Custom Location topic below.
Q1 2012
0 0 0
39
China

Custom Location Description. Describe both capital investment and prices at your custom location.
A) Capital Investment. Provide the relative capital cost at your custom location in comparison to the United States (U.S. Gulf Coast)
Custom Location Relative Cost (%)
130% means that the capital costs in the custom location are 30% higher than the costs in the United States.
B) Raw Materials Prices. Describe the raw material prices to be considered in the custom location.
Item Description Price Unit Price
Raw1 RU1 RP1
Raw2 RU2 RP2
Raw3 RU3 RP3
E.g. Propane USD/metric ton 420
C) Product Prices. Describe the products prices to be considered in the custom location.
Item Description Price Unit Price
Prod1 PU1 PP1
Prod2 PU2 PP2
Prod3 PU3 PP3
E.g. Polypropylene USD/metric ton 1700
D) Utilities Prices. Describe the utilities prices to be considered in the custom location.
Item Description Price Unit Price
Electricity UP1
Steam (Low Pressure) UP2
Steam (High Pressure) UP3
Fuel UP4
Clarified Water UP5
Util6 UU6 YP6
Util7 UU7 UP7
Util8 UU8 UP8
E) Labor Prices. Describe the labor prices to be considered in the custom location.
Item Description Price Unit Price
Operating Labor USD/operator/hour LP1
Supervision Labor USD/supervisor/hour LP1
F) Others. Describe any other price you deem necessary to be considered in the custom location.
Item Description Price Unit Price
Other1 OU1 OP1
Other2 OU2 OP2
Other3 OU3 OP3
E.g. Catalyst USD/metric ton 5000

Other Remarks
If you have any other comments, feel free to write them below:
Comments:
Complementary Files
Along with this form, you may also upload any other chemical document deemed relevant for the description of the project, such asarticles, brochures, book sections, patents, etc. Multiple files may be uploaded.
If you are filling this form offline please upload this form and any complementary files at www.intratec.us/advisory/technology-economics/order-commodities
Non-Disclosure Period & Pricing
You can keep your study confidential or get discounts, by allowing Intratec to disclose it to the market as a publication, after anagreed non-disclosure period, starting at the date you place your order.
Choose an Option 6 months 24 months 36 months Never Disclosed
Non-Disclosure Period Price
6 months $8,000 (9 x $899) Save 84% - Payment of our advisory service is conducted
24 months $28,000 (9 x $3,111) Save 44% automatically, in equal and pre-defined installments
36 months $40,000 (11 x $3,636) Save 20% - Every 15 days, an installment will be charged to your
Never Disclosed $50,000 (13 x $3,846) credit card or PayPal account.
Pay Less! Benefit From a 5% Discount
Inform us the email address of the Intratec Agent that introduced you to our advisory services you will benefit from a 5% discount on the totalprice of your service. To know more about Intratec New Business Development Agents, please visit www.intratec.us/be-our-agent.
Intratec Agent Email
Evaluate our Intratec Agent. Your opinion will be kept confidential.
Unsatisfied Neutral Satisfied
Knowledge about Intratecofferings and presentation skills
Kindness and Helpfulness
DOWNLOAD EXAMPLES OF FILLED FORMS HERE.
DOWNLOAD A PDF VERSION OF THIS FORM HERE.
NEED ASSISTANCE ? SEND AN EMAIL TO [email protected].
v.1-mar-13
In addition to the ISBL facilities, please consider the installation of a refrigeration unit able to provide the required refrigerationcapacity.


Technology Economics
Standardized advisory services developed under Intratec’s Consulting as Publications innovative approach. Technology Economics studies answer main questions surrounding process technologies:
- What is the process? What equipment is necessary?
- What are the raw materials and utilities consumption rates?
- What are the capital and operating expenses breakdown?
- What are the economic indicators?
- In which regions is this technology more profitable?


![2015eprints.kfupm.edu.sa/139823/1/AFEES_THESIS_Dec_26_2015.pdfThesis Title : [Oxidative Dehydrogenation of Propane to Propylene Over VOx/CaO- Al2O3 in a Fluidized Bed ] Major Field](https://static.documents.pub/doc/80x56/6079e89e4e7fb7642b42d43e/thesis-title-oxidative-dehydrogenation-of-propane-to-propylene-over-voxcao-.jpg)