Modeling of Oxidative Dehydrogenation of Propane for Propylene Production in a Membrane Reactor Proceedings of European Congress of Chemical Engineering (ECCE-6) Copenhagen, 16-20 September 2007 Modeling of Oxidative Dehydrogenation of Propane for Propylene Production in a Membrane Reactor M. Fard Mostafavi, a M.R. Omidkhah *a a Department of Chemical Engineering, Tarbiat Modares University, Tehran, Iran Abstract This study examines the oxidative dehydrogenation of propane in the membrane reactor and then tries to present the oxygen diffusion model from the membrane in to the reactor in order to complete dehydrogenation reaction. During the diffusion of oxygen from the membrane in to the reactor, it is believed that the membrane contains γ-Al 2 O 3 and SiO 2 layers, which are protector and distributor, respectively. The distributor layer is applied simply to dispense the oxygen and as such, it doesn’t have any catalytic property. To calculate the diffusion coefficient of gas species in the reactor, Dusty Gas Model was employed. In this particular model, three diffusion mechanisms of Knudsen, viscose and molecular were taken into consideration. However, for the calculation of diffusion coefficients of each gas species in the composite membrane, the molecular diffusion mechanism was not considered. Furthermore, Knudsen mechanism has been considered only for gas transfer in the composite membrane because the mean free-path of gas species such as propane, propylene, oxygen, water vapor, oxides of carbon is much larger than the average size of the pores diameter of the porous membrane. The mass balance equation of gas species are written at 748, 773, 798 and 823 K respectively, in the shell and the tube of the membrane reactor. Runge-Kutta method and MATAB software were applied during the course of the current research to solve the equations. The findings of the aforementioned equations indicated a reasonable concurrence between the results accumulated from the experiments and modeling. Keywords: Modeling, oxidative dehydrogenation of propane, propylene and membrane reactor 1. Introduction Natural gas is full of light paraffin such as ethane, propane and butane, which can contribute, in different reactions to produce valuable olefinic products (Alfonso et al. 2000). Catalyst coking occurs due to the necessarily high temperature in the reversible endothermic processes, and as such some form of catalyst regeneration is required. To overcome high temperature requirement, a number of alternative procedures have PDF created with pdfFactory Pro trial version www.pdffactory.com
Transcript
Modeling of Oxidative Dehydrogenation of Propane for Propylene Production in a Membrane Reactor Proceedings of European Congress of Chemical Engineering (ECCE-6) Copenhagen, 16-20 September 2007
Modeling of Oxidative Dehydrogenation of Propane for Propylene Production in a Membrane Reactor M. Fard Mostafavi,a M.R. Omidkhah*a
aDepartment of Chemical Engineering, Tarbiat Modares University, Tehran, Iran
Abstract
This study examines the oxidative dehydrogenation of propane in the membrane reactor and then tries to present the oxygen diffusion model from the membrane in to the reactor in order to complete dehydrogenation reaction. During the diffusion of oxygen from the membrane in to the reactor, it is believed that the membrane contains γ-Al2O3 and SiO2 layers, which are protector and distributor, respectively. The distributor layer is applied simply to dispense the oxygen and as such, it doesn’t have any catalytic property. To calculate the diffusion coefficient of gas species in the reactor, Dusty Gas Model was employed. In this particular model, three diffusion mechanisms of Knudsen, viscose and molecular were taken into consideration. However, for the calculation of diffusion coefficients of each gas species in the composite membrane, the molecular diffusion mechanism was not considered. Furthermore, Knudsen mechanism has been considered only for gas transfer in the composite membrane because the mean free-path of gas species such as propane, propylene, oxygen, water vapor, oxides of carbon is much larger than the average size of the pores diameter of the porous membrane. The mass balance equation of gas species are written at 748, 773, 798 and 823 K respectively, in the shell and the tube of the membrane reactor. Runge-Kutta method and MATAB software were applied during the course of the current research to solve the equations. The findings of the aforementioned equations indicated a reasonable concurrence between the results accumulated from the experiments and modeling.
Keywords: Modeling, oxidative dehydrogenation of propane, propylene and membrane reactor
1. Introduction
Natural gas is full of light paraffin such as ethane, propane and butane, which can contribute, in different reactions to produce valuable olefinic products (Alfonso et al. 2000). Catalyst coking occurs due to the necessarily high temperature in the reversible endothermic processes, and as such some form of catalyst regeneration is required. To overcome high temperature requirement, a number of alternative procedures have
PDF created with pdfFactory Pro trial version www.pdffactory.com
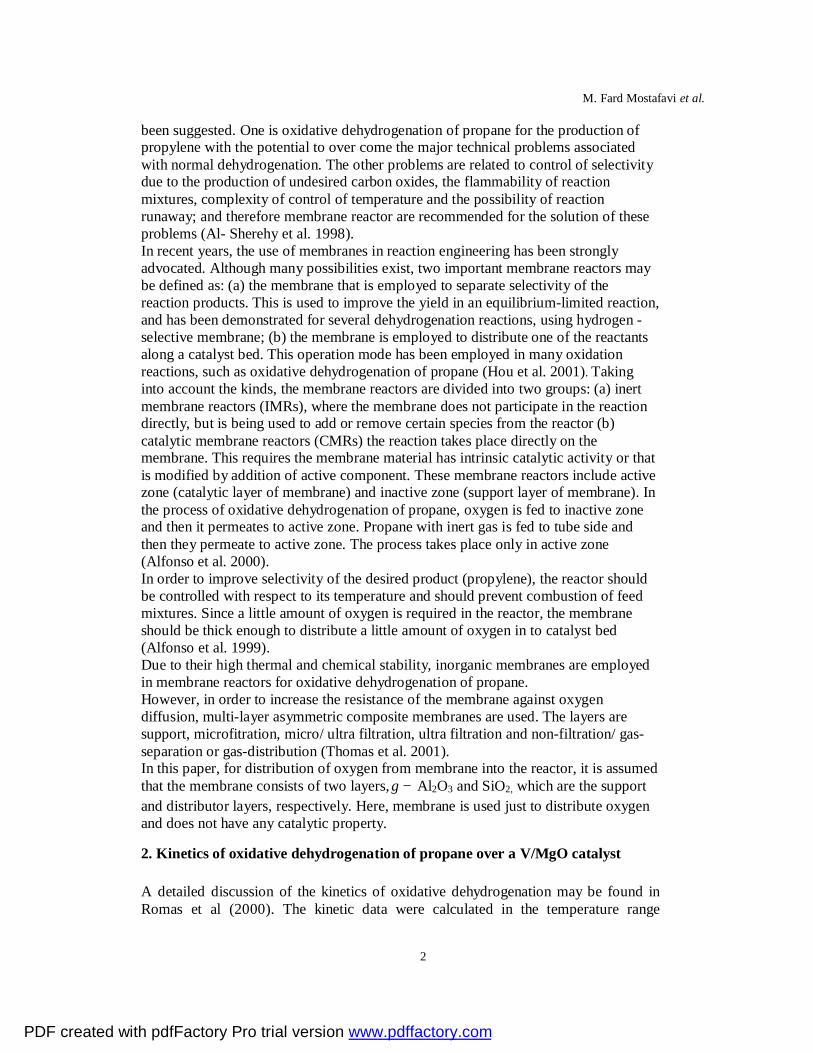
been suggested. One is oxidative dehydrogenation of propane for the production of propylene with the potential to over come the major technical problems associated with normal dehydrogenation. The other problems are related to control of selectivity due to the production of undesired carbon oxides, the flammability of reaction mixtures, complexity of control of temperature and the possibility of reaction runaway; and therefore membrane reactor are recommended for the solution of these problems (Al- Sherehy et al. 1998). In recent years, the use of membranes in reaction engineering has been strongly advocated. Although many possibilities exist, two important membrane reactors may be defined as: (a) the membrane that is employed to separate selectivity of the reaction products. This is used to improve the yield in an equilibrium-limited reaction, and has been demonstrated for several dehydrogenation reactions, using hydrogen - selective membrane; (b) the membrane is employed to distribute one of the reactants along a catalyst bed. This operation mode has been employed in many oxidation reactions, such as oxidative dehydrogenation of propane (Hou et al. 2001). Taking into account the kinds, the membrane reactors are divided into two groups: (a) inert membrane reactors (IMRs), where the membrane does not participate in the reaction directly, but is being used to add or remove certain species from the reactor (b) catalytic membrane reactors (CMRs) the reaction takes place directly on the membrane. This requires the membrane material has intrinsic catalytic activity or that is modified by addition of active component. These membrane reactors include active zone (catalytic layer of membrane) and inactive zone (support layer of membrane). In the process of oxidative dehydrogenation of propane, oxygen is fed to inactive zone and then it permeates to active zone. Propane with inert gas is fed to tube side and then they permeate to active zone. The process takes place only in active zone (Alfonso et al. 2000). In order to improve selectivity of the desired product (propylene), the reactor should be controlled with respect to its temperature and should prevent combustion of feed mixtures. Since a little amount of oxygen is required in the reactor, the membrane should be thick enough to distribute a little amount of oxygen in to catalyst bed (Alfonso et al. 1999). Due to their high thermal and chemical stability, inorganic membranes are employed in membrane reactors for oxidative dehydrogenation of propane. However, in order to increase the resistance of the membrane against oxygen diffusion, multi-layer asymmetric composite membranes are used. The layers are support, microfitration, micro/ ultra filtration, ultra filtration and non-filtration/ gas-separation or gas-distribution (Thomas et al. 2001). In this paper, for distribution of oxygen from membrane into the reactor, it is assumed that the membrane consists of two layers, −γ Al2O3 and SiO2, which are the support and distributor layers, respectively. Here, membrane is used just to distribute oxygen and does not have any catalytic property.
2. Kinetics of oxidative dehydrogenation of propane over a V/MgO catalyst
A detailed discussion of the kinetics of oxidative dehydrogenation may be found in Romas et al (2000). The kinetic data were calculated in the temperature range
PDF created with pdfFactory Pro trial version www.pdffactory.com
Modeling of Oxidative Dehydrogenation of Propane for Propylene Production in a Membrane Reactor
3
between 450-550 C. The reaction took place in the fixed-bed reactor that led to the produce propylene, water vapor and carbon oxides (Hou et al. 2001). The model is as below:
Table 1: The amounts of pre-exponential factor of reaction j, adsorption constant of water vapour, activation
energy of reaction i and adsorption heat of water vapour [20]
Ei activation energy of reaction i, kJ/mol fH2O defined in section 2 fi molar flux of component i, kmol/m2s ∆Hh adsorption heat of water vapour, kJ/mol Kh adsorption constant of water vapour, 1/bar ki reaction rate constant of reaction i, kmol/kg s bar ki0 pre- exponential factor of reaction i, kmol/kg s bar pi partial pressure of component I, bar ri reaction rate of reaction i, kmol/kg s s active site of catalyst
oθ fractional surface coverage of oxygen
Sθ fractional vacant surface
PDF created with pdfFactory Pro trial version www.pdffactory.com
3. Different types of feed arrangements used in the reactor
Two membrane reactor configurations that were compared in this work:
Figure 1: Scheme of the different reactor configurations used in this work (Ramos et al. 2001).
IMRHe+O2 (Fig 1b.) when the inert gas is fed along with oxygen, and IMRO2 (Fig .1c) when the inert gas is premixed with propane. The system can also be operated as a conventional fixed bed. (Fig. 1a) by co-feeding all the reactants to the tube side and closing the valves on the shell side.
4. Gas transport through the membranes
Sorption and diffusion are two major processes that play important roles in the overall gas transport, where sorption describes the interactions between gas molecules and the membrane surface, and diffusion describes the rate of gas passage through the membrane. Sorption of gas molecules from the bulk gaseous state to the surface of the membranes occur physically or chemically depending on the nature of the force between the gas molecules and the surface. Chemisorption occurs once the interactions are strong while physisorption occurs when the interactions with the surface are weak. In the subsequent transport process the adsorbed molecules diffuses through the membrane in various way under the driving force of a concentration gradient (Lee et al. 2002). Detailed discussions about sorption and diffusion steps follow in the following sections.
PDF created with pdfFactory Pro trial version www.pdffactory.com
Modeling of Oxidative Dehydrogenation of Propane for Propylene Production in a Membrane Reactor
5
4.1. Sorption
Gas transport through micro porous or dense materials such as zeolites requires adsorption of molecules before the subsequent diffusion process. Adsorption is usually not multilayer, and often well below a monolayer (Lee et al. 2002).Adsorption isotherms are not valid for gas species. The amount of gas that is adsorbed in porous membrane is negligible. In modelling of oxidative dehydrogenation of propane in membrane reactor, the asymmetric composite membrane is being used and it is assumed that the temperature is constant. Therefore, adsorption gas species is not considered.
4.2. Diffusion
Diffusion of molecules through a membrane proceeds in various ways depending on the nature of the interaction between the diffusing gas molecules and the membrane. The ratio of the molecular size of the diffusing gas, the mean free path of the diffusing gas molecules and the pore diameter of the porous membrane play important roles in determining which diffusion mechanism may apply (Lee et al. 2002). We have focused on three different gas diffusion mechanisms i.e. Knudsen, Transition and Viscous. Before discussing these mechanisms, it is worth to mentioning that the mean free path of the diffusing gas molecules calculates by Eq (11) (Treybal et al. 1968).
)5(22.3
MgRT
P cπµ
λ =
gc 980 gr mass cm/grf s2 M molecular weight, gr/grmol p pressure, gf/cm2 R universal gas constant, 84780 grf cm/ grmol K T temperature, K λ mean free path of the diffusing gas molecules, cm µ viscosity, poise π 3.1416
4.2.1. Knudsen diffusion Knudsen diffusion occurs when the mean free path of the diffusing gas molecules is much larger than the average size of the pores diameter ( )pd>>λ . Knudsen diffusivity is given by Eq (12) (Burggraaf et al. 1996). Error! Objects cannot be created from editing field codes.
4.2.2. Transition flow or slip flow Transition flow occurs once the mean free path of the diffusing gas molecules is equal to the average size of the pores diameter ( )pd=λ (Burggraaf et al. 1996).
PDF created with pdfFactory Pro trial version www.pdffactory.com
4.2.3. Viscous flow Viscous flow occurs when the mean free path of the diffusing gas molecules is much smaller than the average size of the pores diameter ( )pd<<λ (Burggraaf et al. 1996).
5. Asymmetric composite membrane
These membranes consist of several layers. Two models descript the diffusion gas through these membranes: . Dusty Gas Model . Configurational diffusion
5.1. Dusty Gas Model
The DGM is frequently used to model multi-component transfer through asymmetric composite membrane. The main model equation capable to predict molar flux densities (Ji) for all components is: (Thomas et al. 2001)
)7(834
0, aMRTkD
i
eeiK π
=
)7(
)7(]
2[
00262.0
,
122
12
21
213
12
cDD
bP
MMMMT
D
ije
ji τε
σ
=
Ω
+
=
B0
e Permeability(m2)
dp mean pore diameter (m) Dij binary diffusion coeffcient (m2/s) Dc
i diffusion coefficient of configurational diffusion (m2/s) De
K,i Knudsen diffusion coefficient (m2/s) Ei
C activation energy of configurational diffusion (J/mol K) J molar flux density (mol/s m2) ke
0 Knudsen coefficient (m) L membrane length (m) M molar mass (kg/mol)
.n molar flux (mol/s) p pressure (pa)
)7(,...,1,)1(,,1,
0 niDJ
DJxJx
ppD
BRTxx
RTp
eiK
in
ijjeij
jiije
iK
ei
i =+−
=∇+−∇− ∑≠=η
PDF created with pdfFactory Pro trial version www.pdffactory.com
Modeling of Oxidative Dehydrogenation of Propane for Propylene Production in a Membrane Reactor
7
r radius (m) ℜ universal gas constant (J/mol K) T temperature (K) x mole-fraction Greek symbols Ε porosity η viscosity (Pa.s) ρg Probability factor τ tortuosity
Three gas-phase transport mechanisms considered by this model are: . Molecular diffusion; . Knudsen diffusion; . Viscous flux. The left side of Eq (7) quantifies the driving forces formed by partial pressure and overall pressure differences across the membrane. The first term on the right side takes into account interactions between the molecules in the gas phase. The second term considers the resistance between the molecules in the gas phase and the solid assumed consisting of regularly distributed dust molecules fixed in space. The binary diffusion coefficient (Dij) can be estimated using the Chapman- Enskog equation. The three membrane parameters of the DGM, i.e. the Knudsen coefficient
(ke0), the permeability constant (Be0) and the ratio of porosity to tortuosity
τε , have
to be determined experimentally. If a single gas permeates through a membrane the DGM reduces to:
)8(8341 0
0 ppBMRTk
RTJ
i
e
i
ei ∇
+−=
ηπ
For a cylindrical membrane after integration, the following linear dependence of the
ratio of the molar flow rates over the pressure difference,
∆pni versus the mean
pressure ( P ) holds:
)9(834
)/ln(2 0
0
.
+
ℜℜ
−=∆
pBM
TkrrT
Lp
n
i
e
i
e
innerouter
i
ηππ
PDF created with pdfFactory Pro trial version www.pdffactory.com
The slope of this linear dependence is proportional to the permeability constant, Be0,
and the intercept contains the Knudsen coefficient, ek0 . One can estimate a mean pore
diameter, knowing k0e and B0
e and assuming non- interconnected circular capillaries (Thomas et al. 2001).
(10) e
e
p kBd
0
08=
and a mean ratio of porosity and tortuosity. (Thomas et al. 2001).
)11(2
)(
0
20
e
e
Bk
=τε
In order to calculate diffusion coefficient of each gas species in the asymmetric composite membrane, it is assumed that just specimen is present in the reactor; and thus, molecular diffusion has not been taken into account. Table 2 presents some information about the properties of composite membrane reactor under study.
Modeling of Oxidative Dehydrogenation of Propane for Propylene Production in a Membrane Reactor
9
5.1.1. Description of gas permeation through asymmetric porous membranes with the DGM
When a gas permeates through an asymmetric structure consisting of several porous membranes the resulting pressure profiles depend on the properties of all layers.
Figure 2: Pressure profile across an asymmetric membrane (support and two layers) (Thomas et al. 2001)
Figure 2 schematically illustrates the situation for a support and two additional layers. Assuming DGM to be applicable based on Eq. (9), the steady state permeation of a single gas can be described using the following three equations:
)12(2
834
)/ln(2
)(121
sup,0sup,
0121121
.
++
ℜ×
ℜ−=
−ppB
MTk
rrTL
ppn
i
potte
i
portei
ηππ
)13(2
834
)/ln(2
)(2312
1,01,
023122312
.
++
ℜ×
ℜ−=
−ppB
MTk
rrTL
ppn
i
layere
i
layerei
ηππ
)14(2
834
)/ln(2
)(323
2,02,
0332323
.
++
ℜ×
ℜ−=
−ppB
MTk
rrTL
ppn
i
layere
i
layerei
ηππ
If the geometrical (r1, r12, r23, r3) and membrane parameters (k0
e and Be0) and the
pressures p1 and p3 are known, it is possible to determine the molar flow rate, ni, the
PDF created with pdfFactory Pro trial version www.pdffactory.com
intersectional pressures, p12 and p23, and thus the whole pressure profile across the membrane (Thomas et al. 2001).
5.2. Configurational diffusion If the pore diameter is smaller than the range of the range of the sizes of the molecules mass transfer characteristics change and the configurational diffusion regime is reached (Burggraaf et al. 1996). Since the sizes of the molecules such as propane, oxygen, propylene, water vapour and carbon oxides (0.3 nm) are smaller than the pore diameter of support layer (4 nm) and distributed layer (0.5 nm), therefore this model has not been considered in the present study.
6. Modeling of oxidative dehydrogenation of propane for propylene production in membrane reactor
Modelling of oxidative dehydrogenation of propane in membrane reactor has been developed with the following assumptions: (1) Steady state operation; (2) Isothermal state operation; (3) Isobaric reactor conditions; (4) Neglecting the pressure drop due to the wall friction, compared due to particle; (5) Cylindrical symmetry; (6) Using inert membrane reactor in the modelling; (7) Using V/MgO catalyst containing 24% wt V2O5 and 76% wt MgO in the process; (Ramos et al. 2000). (8) Concentration gradient of gas species is considered axially; (9) Because of a little pressure difference along the radial position, mass transport by convection in radial position is negligible compared with the diffusion transport; (10) The mean free path of the diffusing gas species such as propane, oxygen, propylene, water vapour and carbon oxides is much larger than the pore diameters of the support layer Alـ Oγ 2 3 and distributor layer (SiO2), therefore mass transport of gas species in asymmetric composite membrane occurs with the Knudsen mechanism and the term is related to Viscous flow in DGM is omitted; (11) Using the DGM for modelling of diffusion of gas species in the asymmetric composite membrane. 7. Calculation of the mean free path and comparing it with the pore diameters of porous membrane The mean free path of the diffusing gas species is calculated by Eq. (5). The amount of the mean free path of gas species such as propane, oxygen, propylene, water vapour and carbon oxides in different temperatures is presented in Table 3.
PDF created with pdfFactory Pro trial version www.pdffactory.com
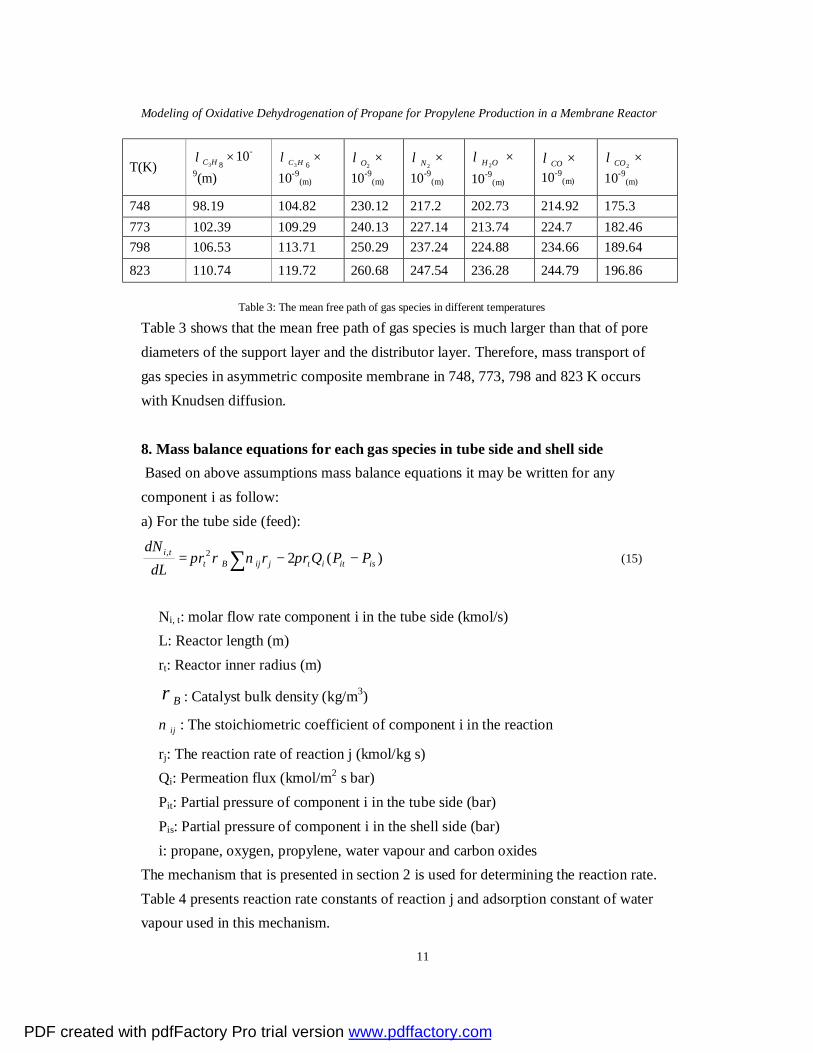
Table 3: The mean free path of gas species in different temperatures
Table 3 shows that the mean free path of gas species is much larger than that of pore diameters of the support layer and the distributor layer. Therefore, mass transport of gas species in asymmetric composite membrane in 748, 773, 798 and 823 K occurs with Knudsen diffusion. 8. Mass balance equations for each gas species in tube side and shell side Based on above assumptions mass balance equations it may be written for any component i as follow: a) For the tube side (feed):
(15) )(22,isititjijBt
ti PPQrrrdL
dN−−= ∑ πνρπ
Ni, t: molar flow rate component i in the tube side (kmol/s) L: Reactor length (m) rt: Reactor inner radius (m)
Bρ : Catalyst bulk density (kg/m3)
ijν : The stoichiometric coefficient of component i in the reaction
rj: The reaction rate of reaction j (kmol/kg s) Qi: Permeation flux (kmol/m2 s bar) Pit: Partial pressure of component i in the tube side (bar) Pis: Partial pressure of component i in the shell side (bar) i: propane, oxygen, propylene, water vapour and carbon oxides
The mechanism that is presented in section 2 is used for determining the reaction rate. Table 4 presents reaction rate constants of reaction j and adsorption constant of water vapour used in this mechanism.
PDF created with pdfFactory Pro trial version www.pdffactory.com
Table 4: Reaction rate constants of reaction j and adsorption constant of water vapour in different temperature
b) For the shell side:
)16()(2,isitit
si PPQrdL
dN−= π
Ni, s: molar flow rate of component i in the shell side Eq. (14) and amount of k0
e (Table 2) are used to calculate diffusion coefficient of the gas species in support layer and distributor layer. Tables 5 & 6 highlight amount of diffusion coefficient of gas species in support and distributor layers.
Modeling of Oxidative Dehydrogenation of Propane for Propylene Production in a Membrane Reactor
13
Assumptions for calculating total diffusion coefficient of gas species in asymmetric composite reactor are:
(1) Similarity of permeation in membrane and electrical current is used for the asymmetric composite membrane, since the support and the distributor layers are considered in form of serial resistances.
(2) By considering the support and the distributor layers in form of serial resistances:
i SiO i Al O i total(n ) (n ) (n )γ−= =2 2 3
(3) It is assumed that since just specimen presents in the reactor, therefore molecular diffusion is not considered. The mean free path of the diffusing gas species is much larger than the pores diameter of the support and the distributor layers, therefore just Knudsen mechanism is considered for gas permeation in composite membrane (Thomas et al. 2001).
Equations (12), (13) and (14) are used in order to calculate total diffusion coefficient of gas species. Equations (12), (13) and (14) are written in the form of Eq. (17) based on assumption (3) (Thomas et al. 2001).
)17()ln(
)(
)ln(
)(
)ln(
)( ,,,232
t
s
totaliKst
av
s
SiOiKsav
t
av
OAliKavt
rr
Dpp
rr
Dpp
rr
Dpp −=
−=
− −γ
Pt: tube side pressure (bar) Ps: shell side pressure (bar) rt: reactor inner radius (m) rav: summation of reactor inner radius with the thickness of the support layer rs: summation of reactor inner radius with thickness of the support and
distributor layers By extracting the amount of diffusion coefficient of gas species in the support layer from Table 5 and by extracting of its in the distributor layer from Table 6 and equally considering the first and the second part of Eq. (17), we can calculate the amount of the average pressure and then by considering the first and the third or the second and the third part of Eq. (17), we can calculate the amount of the total diffusion coefficient of gas species in asymmetric composite membrane. Permeation flux (Qi) of gas species is calculated by Eq. (18) (Reith et al. 2003).
)18( RTl
DP
JQtotal
iKii
,=∆
=
P∆ : Pressure difference along the asymmetric composite membrane
l: Total thickness of composite membrane R: Universal gas constant T: Temperature Di,k
total: Total diffusion coefficient of gas species in the form of Knudsen diffusion
PDF created with pdfFactory Pro trial version www.pdffactory.com
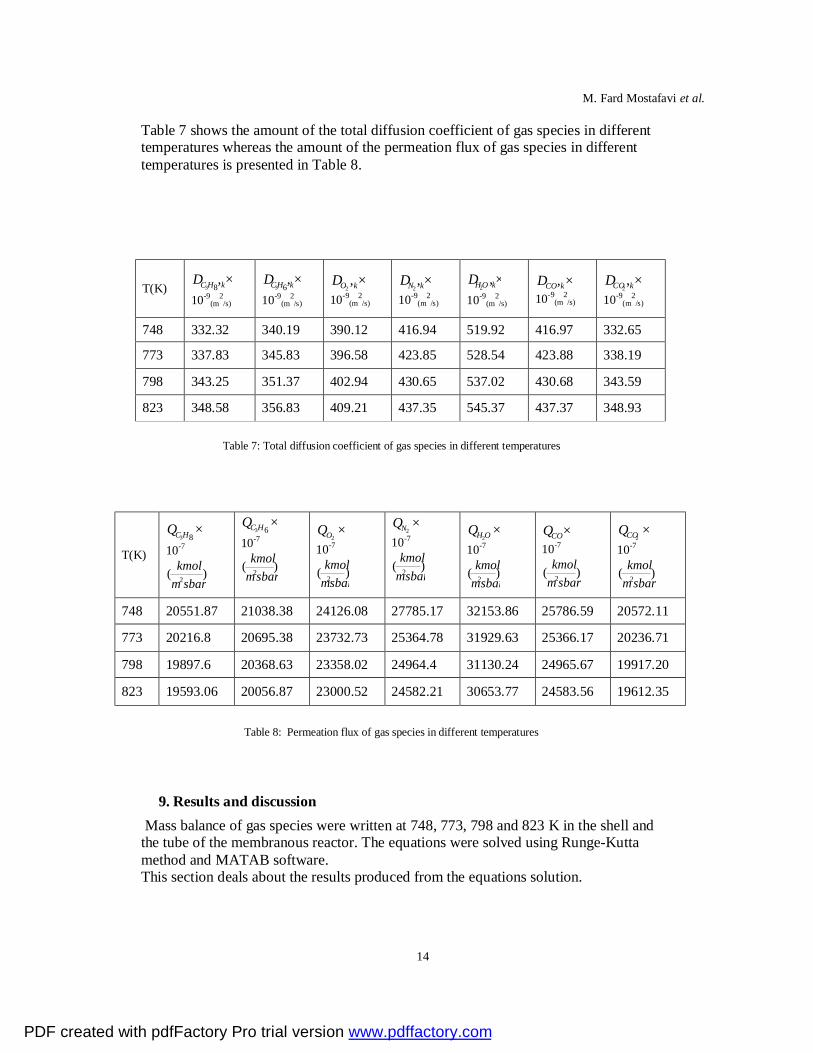
Table 7 shows the amount of the total diffusion coefficient of gas species in different temperatures whereas the amount of the permeation flux of gas species in different temperatures is presented in Table 8.
Table 8: Permeation flux of gas species in different temperatures
9. Results and discussion
Mass balance of gas species were written at 748, 773, 798 and 823 K in the shell and the tube of the membranous reactor. The equations were solved using Runge-Kutta method and MATAB software. This section deals about the results produced from the equations solution.
PDF created with pdfFactory Pro trial version www.pdffactory.com
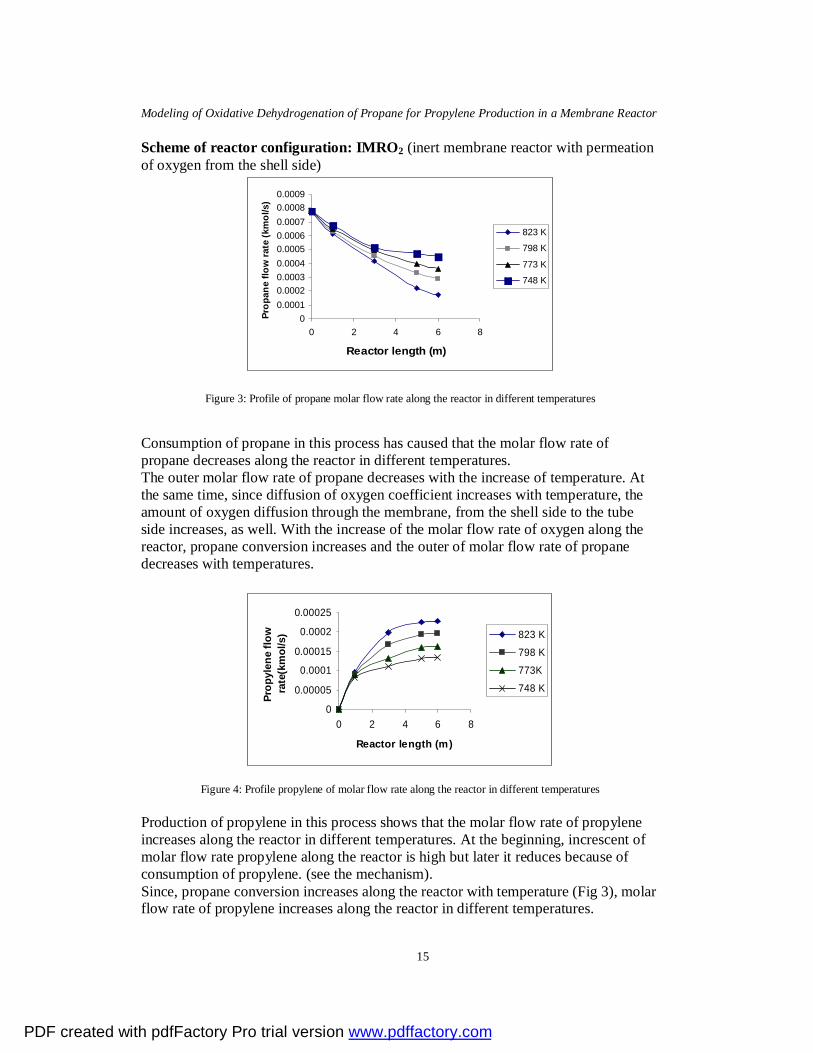
Figure 3: Profile of propane molar flow rate along the reactor in different temperatures
Consumption of propane in this process has caused that the molar flow rate of propane decreases along the reactor in different temperatures. The outer molar flow rate of propane decreases with the increase of temperature. At the same time, since diffusion of oxygen coefficient increases with temperature, the amount of oxygen diffusion through the membrane, from the shell side to the tube side increases, as well. With the increase of the molar flow rate of oxygen along the reactor, propane conversion increases and the outer of molar flow rate of propane decreases with temperatures.
0
0.00005
0.0001
0.00015
0.0002
0.00025
0 2 4 6 8
Reactor length (m)
Prop
ylen
e flo
w
rate
(km
ol/s
) 823 K
798 K
773K
748 K
Figure 4: Profile propylene of molar flow rate along the reactor in different temperatures Production of propylene in this process shows that the molar flow rate of propylene increases along the reactor in different temperatures. At the beginning, increscent of molar flow rate propylene along the reactor is high but later it reduces because of consumption of propylene. (see the mechanism). Since, propane conversion increases along the reactor with temperature (Fig 3), molar flow rate of propylene increases along the reactor in different temperatures.
PDF created with pdfFactory Pro trial version www.pdffactory.com
Figure 5: Profile of oxygen molar flow rate along the reactor in different temperatures At the beginning, the amount molar flow rate of oxygen increases along the reactor but later it is approximately constant because of oxygen consumption in this process. Increase in temperature results, an increase of oxygen diffusion coefficient and as such increscent of the rate of oxygen molecules motion. In the higher temperature, the oxygen molecules permeate with a large amount, from the shell side to the tube side.
0
0.0000005
0.000001
0.0000015
0.000002
0 2 4 6 8
Reactor length (m)
Nitr
ogen
flow
ra
te(k
mol
/s) 823 K
798 K773 K748 K
Figure 6: Profile of nitrogen molar flow rate along the reactor in different temperatures Diffusion coefficient of nitrogen is high which is used only for dilution of feed. Nitrogen molecules usually permeate from the tube side to the shell side (using partial pressure’s driving force). Temperature increase results increase of nitrogen diffusion coefficient and increscent of the rate of nitrogen molecules motion. In the higher temperature, the nitrogen molecules permeate with a large amount, from the tube side to the shell side.
PDF created with pdfFactory Pro trial version www.pdffactory.com
Modeling of Oxidative Dehydrogenation of Propane for Propylene Production in a Membrane Reactor
17
0
0.0001
0.0002
0.0003
0.0004
0.0005
0.0006
0.0007
0 2 4 6 8
Reactor length (m)
Wat
er v
apou
r flo
w ra
te (k
mol
/s)
748 K773 K798 K823 K
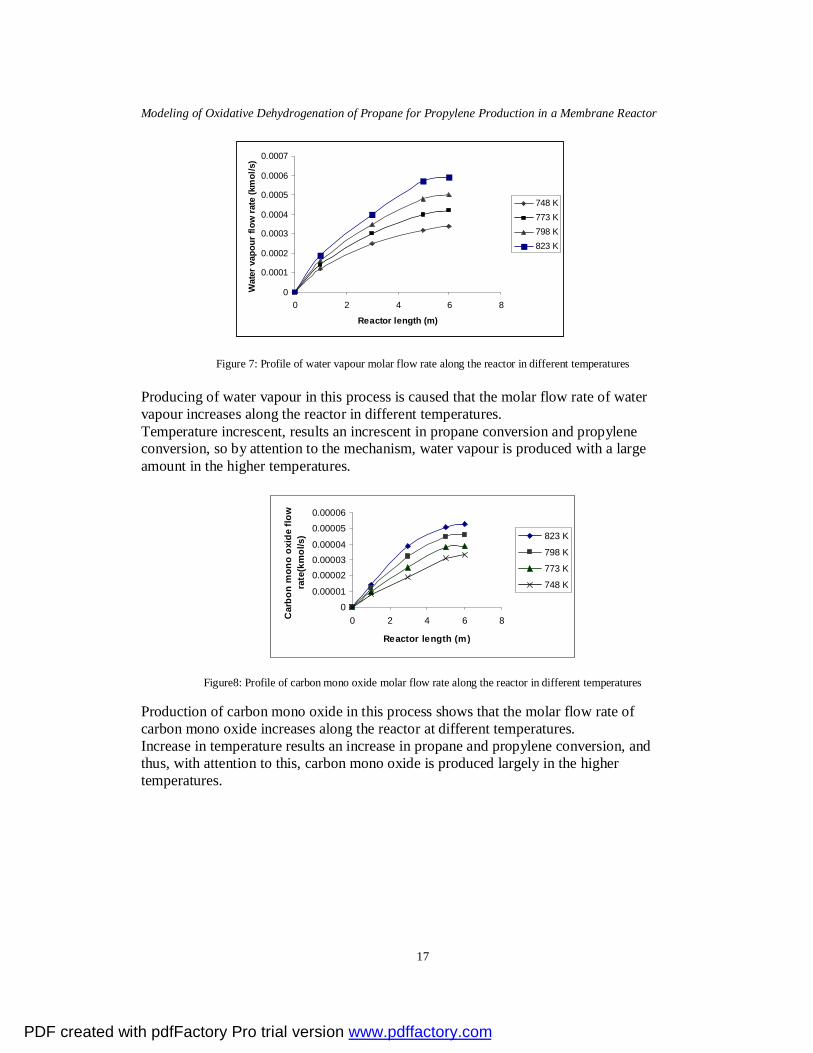
Figure 7: Profile of water vapour molar flow rate along the reactor in different temperatures Producing of water vapour in this process is caused that the molar flow rate of water vapour increases along the reactor in different temperatures. Temperature increscent, results an increscent in propane conversion and propylene conversion, so by attention to the mechanism, water vapour is produced with a large amount in the higher temperatures.
0
0.00001
0.000020.000030.00004
0.00005
0.00006
0 2 4 6 8
Reactor length (m)
Car
bon
mon
o ox
ide
flow
ra
te(k
mol
/s) 823 K
798 K
773 K
748 K
Figure8: Profile of carbon mono oxide molar flow rate along the reactor in different temperatures
Production of carbon mono oxide in this process shows that the molar flow rate of carbon mono oxide increases along the reactor at different temperatures. Increase in temperature results an increase in propane and propylene conversion, and thus, with attention to this, carbon mono oxide is produced largely in the higher temperatures.
PDF created with pdfFactory Pro trial version www.pdffactory.com
Figure 9: Profile of carbon dioxide molar flow rate along the reactor in different temperatures Producing of carbon dioxide in this process is caused that the molar flow rate of carbon dioxide increases along the reactor at different temperatures. Temperature increase result an increscent in propane and propylene conversion, and thus, carbon dioxide is produced with a large amount in the higher temperatures.
0
0.0000001
0.0000002
0.0000003
0.0000004
0.0000005
0 2 4 6 8
Reactor length (m)
Prop
ane
flow
rate
(km
ol/s)
823 K
798 K
773 K
748 K
Figure 10: Profile of propane molar flow rate along the shell side of the reactor in different temperatures
The amounts of molar flow rate of propane increases along the shell side of the reactor because:
(1) The amount of molar flow propane in the tube side is more than the shell side, so propane molecules permeate through the membrane from the tube to the shell side (using partial pressure’s driving force).
(2) Diffusion coefficient of propane in asymmetric composite membrane is approximately high.
Noticing the fluctuation, temperature does not make a considerable change in diffusion of propane in the shell side of the reactor. It seems that the utilization of partial pressure’s driving force is the predominant mechanism in diffusion of propane from the tube to the shell side rather the increscent of diffusion coefficient caused by the temperature increscent. Thus the fluctuations in temperature do not have remarkable effect in the amount of propane diffusion from the tube side to the shell of the reactor.
PDF created with pdfFactory Pro trial version www.pdffactory.com
Figure 11: Profile of propylene molar flow rate along the shell side of the reactor in different temperatures
The amounts of molar flow rate of propylene increases along the shell side of the reactor because:
(1) The amount of molar flow rate propylene in the tube side is more than its shell side, and thus propylene molecules permeate through the membrane from the tube side to the shell side (using partial pressure’s driving force).
(2) Diffusion coefficient of propylene in asymmetric composite membrane is approximately high.
Noticing that fluctuation of temperature do not make a considerable change in diffusion of propylene in the shell side of the reactor, it seems that the utilization of partial pressure’s driving force is the predominant mechanism in diffusion of propylene from the tube side to the shell side but not increscent of diffusion coefficient caused by the temperature increscent. So the fluctuation in temperature does not have a noticeable effect in the amount of propylene diffusion from the tube side to the shell of the reactor.
0.00138
0.0014
0.00142
0.00144
0.00146
0.00148
0.0015
0.00152
0 2 4 6 8
Reactor length(m)
Oxy
gen
flow
rat
e(km
ol/s
)
823 K798 K773 K748 K
Figure12: Profile of oxygen molar flow rate along the shell side of the reactor in different temperatures
The amounts of molar flow rate of oxygen decreases along the shell side of the reactor because:
PDF created with pdfFactory Pro trial version www.pdffactory.com
(1) The amount of molar flow rate oxygen in the shell side is more than its tube side, and thus oxygen molecules permeate through the membrane from the shell to the tube side (using partial pressure’s driving force).
(2) Diffusion coefficient of oxygen in asymmetric composite membrane is high. Temperature increase results, increase of oxygen diffusion coefficient and increscent of the rate of oxygen molecules motion. In the higher temperature, the oxygen molecules permeate with a large amount from the shell side to the tube side. So the amount of remained oxygen molar flow rate along the reactor shell side decreases with temperature increase.
00.0000002
0.00000040.0000006
0.00000080.000001
0.00000120.0000014
0.00000160.0000018
0 2 4 6 8
Reactor length (m)
Nitr
ogen
flow
rate
(km
ol/s
)
823 K798 K773 K748 K
Figure 13: Profile of nitrogen molar flow rate along the shell side of the reactor in different temperatures The amounts of molar flow rate of nitrogen increases along the shell side of the reactor. The reasons are:
(1) The amount of molar flow rate nitrogen in the tube side is more than its shell side, so nitrogen molecules permeate through the membrane from the tube side to the shell side (using partial pressure’s driving force)
(2) Diffusion coefficient of nitrogen in asymmetric composite membrane is high. Temperature increase results, increase of nitrogen diffusion coefficient and increase of the rate of nitrogen molecules motion. In the higher temperature, the nitrogen molecules permeate with a large amount from the tube side to the shell side.
PDF created with pdfFactory Pro trial version www.pdffactory.com
Modeling of Oxidative Dehydrogenation of Propane for Propylene Production in a Membrane Reactor
21
0
0.00000001
0.00000002
0.00000003
0.00000004
0.00000005
0 2 4 6 8
Reactor length(m)
Wat
er fl
ow r
ate(
kmol
/s)
823 K798 K773 K748 K
Figure 14: Profile water vapour of molar flow rate along the shell side of the reactor in different temperatures
The amounts of molar flow rate of water vapour increases along the shell side of the reactor. The reasons are:
(1) The amount of molar flow rate water vapour in the tube side is more than its shell side, so water vapour molecules permeate through the membrane from the tube side to the shell side (using partial pressure’s driving force)
(2) Diffusion coefficient of nitrogen in asymmetric composite membrane is approximately high. The fluctuation in temperature does not have a noticeable effect in the amount of water vapour diffusion from the tube side to the shell of the reactor.
02E-104E-106E-108E-10
0.0000000011.2E-09
0 5 10
Reactor length (m)
Car
bon
mon
o ox
ide
flow
rat
e(km
ol/s
)
823 K798 K773 K748 K
Figure15: Profile of carbon mono oxide molar flow rate along the shell side of the reactor in different temperatures
The amounts of molar flow rate of carbon mono oxide increases along the shell side of the reactor because:
(1) The amount of molar flow rate carbon mono oxide in the tube side is more than its shell side, so carbon mono oxide molecules permeate through the membrane from the tube side to the shell side (using partial pressure’s driving force)
PDF created with pdfFactory Pro trial version www.pdffactory.com
(2) Diffusion coefficient of carbon mono oxide in asymmetric composite membrane is approximately high. The fluctuation in temperature does not have a noticeable effect in the amount of carbon mono oxide diffusion from the tube side to the shell of the reactor.
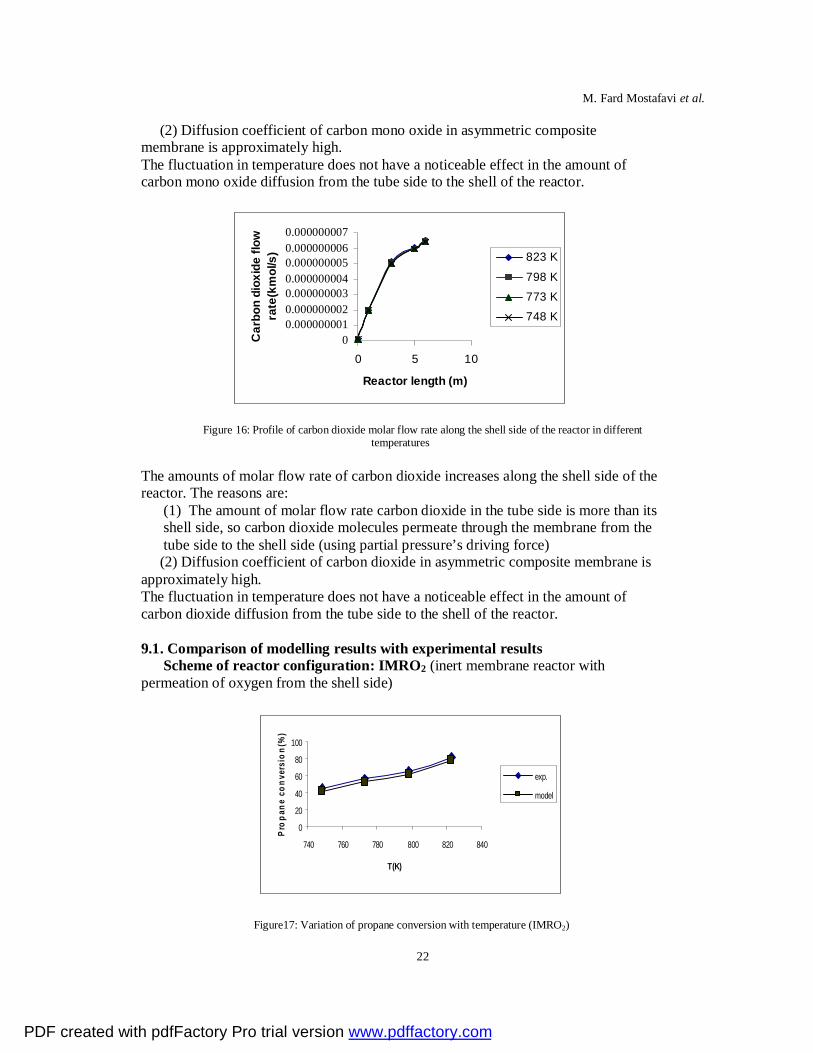
Figure 16: Profile of carbon dioxide molar flow rate along the shell side of the reactor in different temperatures
The amounts of molar flow rate of carbon dioxide increases along the shell side of the reactor. The reasons are:
(1) The amount of molar flow rate carbon dioxide in the tube side is more than its shell side, so carbon dioxide molecules permeate through the membrane from the tube side to the shell side (using partial pressure’s driving force)
(2) Diffusion coefficient of carbon dioxide in asymmetric composite membrane is approximately high. The fluctuation in temperature does not have a noticeable effect in the amount of carbon dioxide diffusion from the tube side to the shell of the reactor. 9.1. Comparison of modelling results with experimental results
Scheme of reactor configuration: IMRO2 (inert membrane reactor with permeation of oxygen from the shell side)
0
20
40
60
80
100
740 760 780 800 820 840
T(K)
Prop
ane
conv
ersi
on(%
)
exp.
model
Figure17: Variation of propane conversion with temperature (IMRO2)
PDF created with pdfFactory Pro trial version www.pdffactory.com
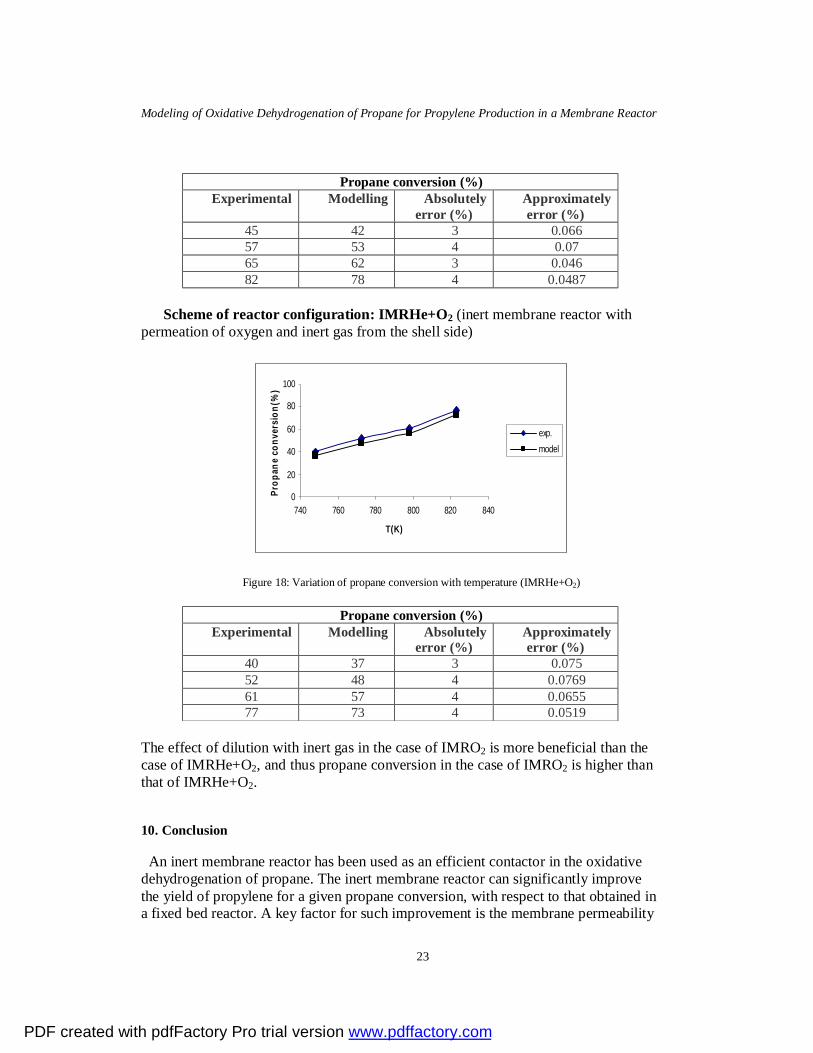
The effect of dilution with inert gas in the case of IMRO2 is more beneficial than the case of IMRHe+O2, and thus propane conversion in the case of IMRO2 is higher than that of IMRHe+O2.
10. Conclusion
An inert membrane reactor has been used as an efficient contactor in the oxidative dehydrogenation of propane. The inert membrane reactor can significantly improve the yield of propylene for a given propane conversion, with respect to that obtained in a fixed bed reactor. A key factor for such improvement is the membrane permeability
PDF created with pdfFactory Pro trial version www.pdffactory.com
that must be tailored to provide a distribution of oxygen along the reactor and a suitable value of the permeation flux. The composite silica/ −γ alumina membrane is used in this study as oxygen distributor. The membrane reactors have been recommended in order to improve yield of the desired product (propylene), control the temperature of the reactor and prevent from combustion of feed mixture.
References
Alfonso, M.J., Julbe, A., Farrusseng, D., Menendez, M. and Santamaria, J., (1999) Oxidative Dehydrogenation of Propane on V/Al2O3 Catalytic Membranes: Effect of the Type of Membrane and Reactant Feed Configuration, Chemical Engineering Science, 54, 1265- 1272.
Alfonso, M.J., Menendez, M. and Santamaria, J., (2000) Vanadium-Based Catalytic
Membrane Reactors for Oxidative Dehydrogenation of Propane, Catalysis Today, 56, 247- 252.
Al-Sherehy, F.A., Adris, A.M., Soliman, M.A. and Hughes, R., (1998) Avoidance of
Flammability and Temperature Runaway During Oxidative Dehydrogenation Using a Distributed Feed, Chemical Engineering Science, 53, 3965- 3976.
Burggraaf, A.J. and Cot, L., Fundamentals of Inorganic Membrane Science and
Technology, Elsevier, (1996). Contantinides, A. and Mostoufi, N., Numerical Methods for Chemical Engineers with MATLAB Applications, Prentice Hall, (2001). Hou, K., Hughes, R., Ramos, R., Menendez, M. and Santamaria, J., (2001) Using a Membrane Reactor for Oxidative Dehydrogenation of Propane, Chemical Engineering Science, 53, 57-67. Late, L. and Blekkan, E.A., (2002) Kinetics of the Oxidative Dehydrogenation of
Propane over a V/MgO Catalyst, Natural Gas Chemistry J, 11. Lee, D. and Ted oyama, S., (2002) Gas Permeation Characteristics of a Hydrogen
Selective Supported Silica Membrane", Membrane Science J, 210, 291-306. Ramos, R., Menendez, M. and Santamaria, J., (2000) Oxidative Dehydrogenation of
Propane in an Inert Membrane Reactor, Catalysis Today, 56, 239-245. Reith, T., Kuipers, J.A.M., Versteeg, G.F., Lefferts, L.L. and Kapteijn, F., Modelling
of Packed Bed membrane Reactors: Impact of Oxygen Distribution on Conversion and Selectivity in Partial Oxidation Systems, Thesis, Twente University, Netherlands, (2003).
PDF created with pdfFactory Pro trial version www.pdffactory.com
Modeling of Oxidative Dehydrogenation of Propane for Propylene Production in a Membrane Reactor
25
Thomas, S., Schafer, R., Caro, J. and Seidel-Morgenstern, A., (2001) Investigation of Mass Transfer through Inorganic Membranes with Several Layers, Catalysis Today, 67, 205-216.
Experimental Investigations of Inorganic Membrane Reactors: A Distributed Feed Approach for Partial Oxidation Reaction, Chemical Engineering Science, 51, 789-806.
Treybal, R.E., Mass Transfer Operation, McGraw Hill, (1968). Tsotsis, T.T., Catalytic membrane reactor, 44, (2002). Vadim, S., Nikoliy, G. and Skudin, V., (2005) Propane Dehydrogenation Using


![Maximizing propylene production via FCC technology · Maximizing propylene production via FCC technology ... metathesis or propane dehydrogenation [57, 76]. With the ethylene and](https://static.documents.pub/doc/80x56/6079e7d4f3a826341a66a1dd/maximizing-propylene-production-via-fcc-technology-maximizing-propylene-production.jpg)
![Simulation and Performance Analysis of Propylene · PDF fileon-purpose propylene technology; propane dehydrogenation, olefin metathesis, and methanol to propylene [2]-[4]. However,](https://static.documents.pub/doc/80x56/5a9fa6de7f8b9a89178d0123/simulation-and-performance-analysis-of-propylene-propylene-technology-propane.jpg)


![2015eprints.kfupm.edu.sa/139823/1/AFEES_THESIS_Dec_26_2015.pdfThesis Title : [Oxidative Dehydrogenation of Propane to Propylene Over VOx/CaO- Al2O3 in a Fluidized Bed ] Major Field](https://static.documents.pub/doc/80x56/6079e89e4e7fb7642b42d43e/thesis-title-oxidative-dehydrogenation-of-propane-to-propylene-over-voxcao-.jpg)


