TED Footprints API Version 1.3.x Copyright 2008. The Energy Detective. All Rights Reserved. Page 1 of 18 TED Footprints API Version 1.3.x Table of Contents Architectural Overview....................................................................................................... 2 Live Data (DASHBOARDDATA) ..................................................................................... 3 Historical Data (HISTORICALDATA) .............................................................................. 6 Load Profile ........................................................................................................................ 8 Load Profile Event Types (LOADPROFILEEVENTTYPE) ........................................ 8 Listing Load Profile Event Types ............................................................................... 8 Action DEL_EVENT: Deleting a Load Profile Event Type ...................................... 8 Action SAVE_EVENT: Adding/Editing a Load Profile Event Type ......................... 8 Action TOGGLE_EVENT: Manually marking an appliance as ON/OFF. .............. 10 Load Profile Data (LOADPROFILEDATA) ................................................................ 11 Exporting Database Data (DATAEXPORTREQUEST) .................................................. 15 Footprints Dashboard (DASH) ......................................................................................... 17
Transcript
TED Footprints API Version 1.3.x
Copyright 2008. The Energy Detective. All Rights Reserved. Page 1 of 18
TED Footprints API Version 1.3.x
Table of Contents
Architectural Overview....................................................................................................... 2 Live Data (DASHBOARDDATA) ..................................................................................... 3 Historical Data (HISTORICALDATA).............................................................................. 6 Load Profile ........................................................................................................................ 8 Load Profile Event Types (LOADPROFILEEVENTTYPE) ........................................ 8 Listing Load Profile Event Types ............................................................................... 8 Action DEL_EVENT: Deleting a Load Profile Event Type ...................................... 8 Action SAVE_EVENT: Adding/Editing a Load Profile Event Type......................... 8 Action TOGGLE_EVENT: Manually marking an appliance as ON/OFF. .............. 10
Load Profile Data (LOADPROFILEDATA)................................................................ 11 Exporting Database Data (DATAEXPORTREQUEST) .................................................. 15 Footprints Dashboard (DASH) ......................................................................................... 17
TED Footprints API Version 1.3.x
Copyright 2008. The Energy Detective. All Rights Reserved. Page 2 of 18
Architectural Overview
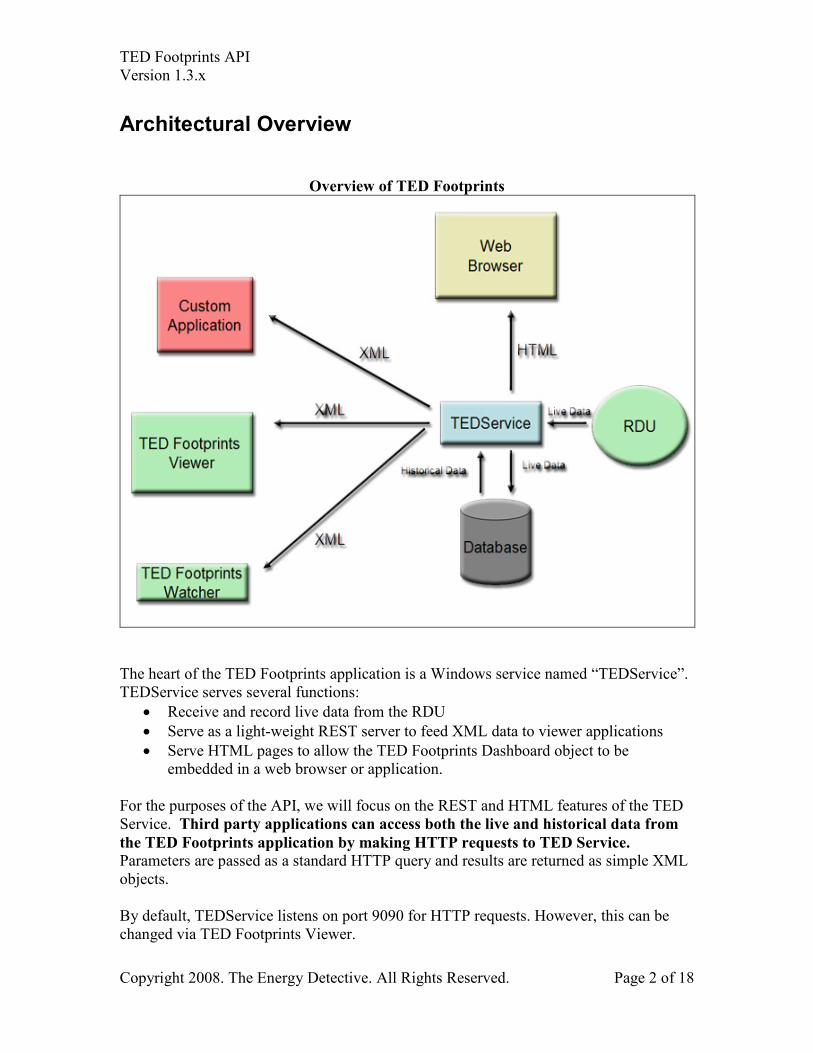
Overview of TED Footprints
The heart of the TED Footprints application is a Windows service named “TEDService”. TEDService serves several functions:
• Receive and record live data from the RDU
• Serve as a light-weight REST server to feed XML data to viewer applications
• Serve HTML pages to allow the TED Footprints Dashboard object to be embedded in a web browser or application.
For the purposes of the API, we will focus on the REST and HTML features of the TED Service. Third party applications can access both the live and historical data from
the TED Footprints application by making HTTP requests to TED Service. Parameters are passed as a standard HTTP query and results are returned as simple XML objects. By default, TEDService listens on port 9090 for HTTP requests. However, this can be changed via TED Footprints Viewer.
TED Footprints API Version 1.3.x
Copyright 2008. The Energy Detective. All Rights Reserved. Page 3 of 18
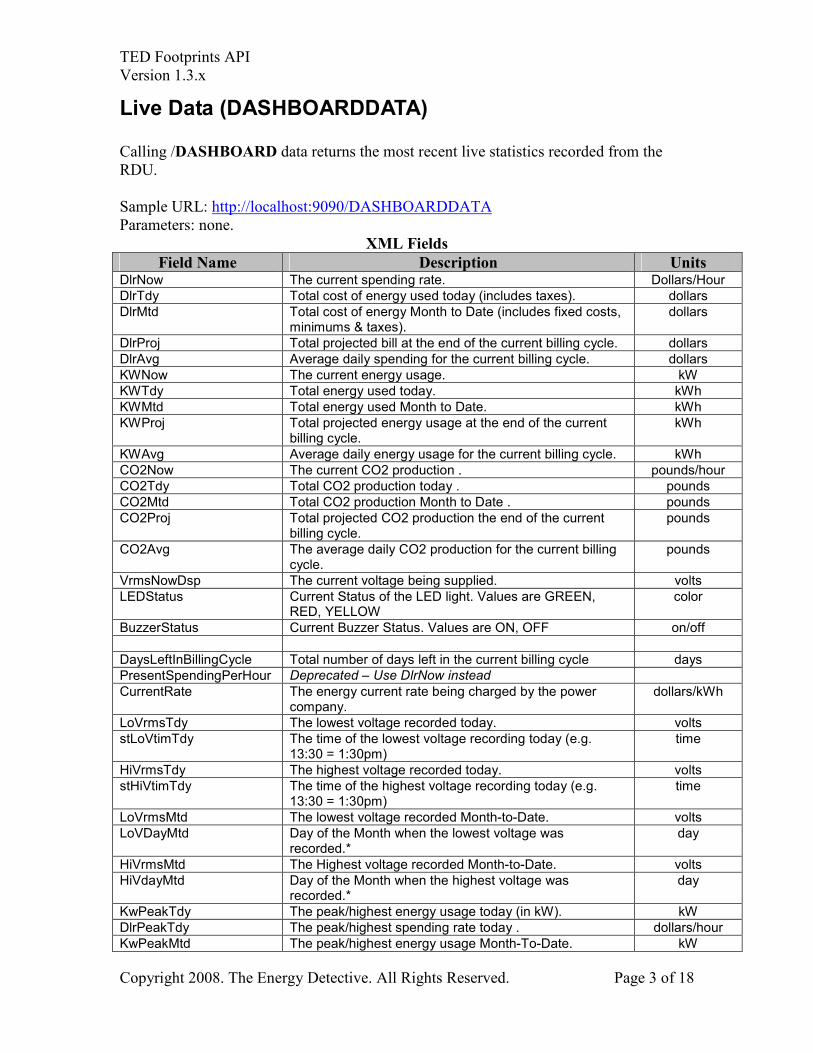
Live Data (DASHBOARDDATA) Calling /DASHBOARD data returns the most recent live statistics recorded from the RDU. Sample URL: http://localhost:9090/DASHBOARDDATA Parameters: none.
XML Fields
Field )ame Description Units DlrNow The current spending rate. Dollars/Hour
DlrTdy Total cost of energy used today (includes taxes). dollars
DlrMtd Total cost of energy Month to Date (includes fixed costs, minimums & taxes).
dollars
DlrProj Total projected bill at the end of the current billing cycle. dollars
DlrAvg Average daily spending for the current billing cycle. dollars
KWNow The current energy usage. kW
KWTdy Total energy used today. kWh
KWMtd Total energy used Month to Date. kWh
KWProj Total projected energy usage at the end of the current billing cycle.
kWh
KWAvg Average daily energy usage for the current billing cycle. kWh
CO2Now The current CO2 production . pounds/hour
CO2Tdy Total CO2 production today . pounds
CO2Mtd Total CO2 production Month to Date . pounds
CO2Proj Total projected CO2 production the end of the current billing cycle.
pounds
CO2Avg The average daily CO2 production for the current billing cycle.
pounds
VrmsNowDsp The current voltage being supplied. volts
LEDStatus Current Status of the LED light. Values are GREEN, RED, YELLOW
color
BuzzerStatus Current Buzzer Status. Values are ON, OFF on/off
DaysLeftInBillingCycle Total number of days left in the current billing cycle days
PresentSpendingPerHour Deprecated – Use DlrNow instead
CurrentRate The energy current rate being charged by the power company.
dollars/kWh
LoVrmsTdy The lowest voltage recorded today. volts
stLoVtimTdy The time of the lowest voltage recording today (e.g. 13:30 = 1:30pm)
time
HiVrmsTdy The highest voltage recorded today. volts
stHiVtimTdy The time of the highest voltage recording today (e.g. 13:30 = 1:30pm)
time
LoVrmsMtd The lowest voltage recorded Month-to-Date. volts
LoVDayMtd Day of the Month when the lowest voltage was recorded.*
day
HiVrmsMtd The Highest voltage recorded Month-to-Date. volts
HiVdayMtd Day of the Month when the highest voltage was recorded.*
day
KwPeakTdy The peak/highest energy usage today (in kW). kW
DlrPeakTdy The peak/highest spending rate today . dollars/hour
KwPeakMtd The peak/highest energy usage Month-To-Date. kW
TED Footprints API Version 1.3.x
Copyright 2008. The Energy Detective. All Rights Reserved. Page 4 of 18
DlrPeakMtd The peak/highest spending rate Month-To-Date. Dollars/hour
WattTdySum Total used today W/sec
KwhMtdCnt Deprecated – No longer used.
PastMonthlyData The total Dlr cost and kWh used for previous months as recorded by the RDU
PastMonthlyData/Month The month of the recording Month (1-12)
PastMonthlyData/Year The year of the recording Year
PastMonthlyData/KwH Total kWH used for the month kWh
PastMonthlyData/Dlr Total dollar spent for the month Dollars
IsDualMTU Indicator whether a second MTU is used True/False
MTU1WattsNow The current kWh reading from MTU1 kWh/hour
MTU2WattsNow The current kWh reading from MTU2 kWh/hour
MTU1CO2Now Current CO2 production based on readings from MTU1 pounds
MTU2CO2Now Current CO2 production based on readings from MTU2 pounds
MTU1DlrNow Current spending rate based on readings from MTU1 dollars/hour
MTU2DrlNow Current spending rate based on readings from MTU2 dollars/hour
MTU1VrmsNow Current voltage measured by MTU1 volts
MTU2VrmsNow Current voltage measured by MTU2 volts
* This is the raw day representation from the RDU. To calculate the actual day, use the following formula (replace <value> w/ HiVdayMtd or LoVdayMtd)
theDay = <value> MOD 32; theMonth = (<value>-(<value> MOD 32))/32;
Copyright 2008. The Energy Detective. All Rights Reserved. Page 6 of 18
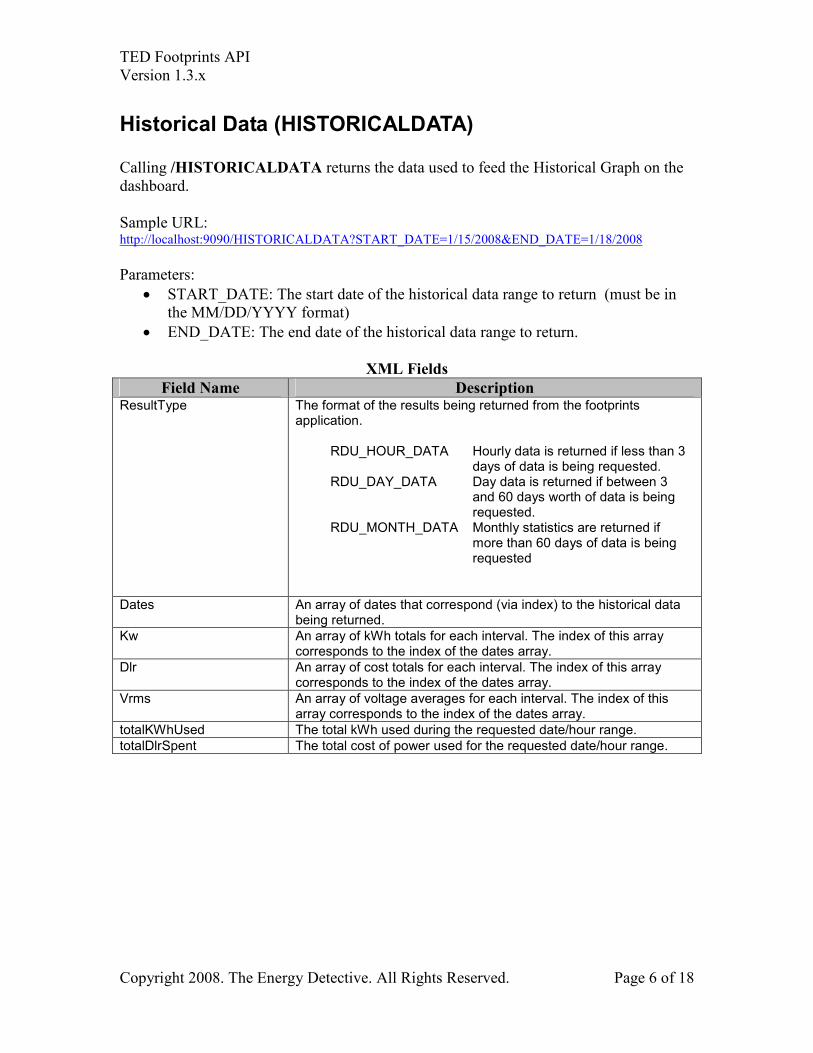
Historical Data (HISTORICALDATA) Calling /HISTORICALDATA returns the data used to feed the Historical Graph on the dashboard. Sample URL: http://localhost:9090/HISTORICALDATA?START_DATE=1/15/2008&END_DATE=1/18/2008 Parameters:
• START_DATE: The start date of the historical data range to return (must be in the MM/DD/YYYY format)
• END_DATE: The end date of the historical data range to return.
XML Fields
Field )ame Description ResultType The format of the results being returned from the footprints
application.
RDU_HOUR_DATA Hourly data is returned if less than 3 days of data is being requested.
RDU_DAY_DATA Day data is returned if between 3 and 60 days worth of data is being requested.
RDU_MONTH_DATA Monthly statistics are returned if more than 60 days of data is being requested
Dates An array of dates that correspond (via index) to the historical data being returned.
Kw An array of kWh totals for each interval. The index of this array corresponds to the index of the dates array.
Dlr An array of cost totals for each interval. The index of this array corresponds to the index of the dates array.
Vrms An array of voltage averages for each interval. The index of this array corresponds to the index of the dates array.
totalKWhUsed The total kWh used during the requested date/hour range.
totalDlrSpent The total cost of power used for the requested date/hour range.
TED Footprints API Version 1.3.x
Copyright 2008. The Energy Detective. All Rights Reserved. Page 7 of 18
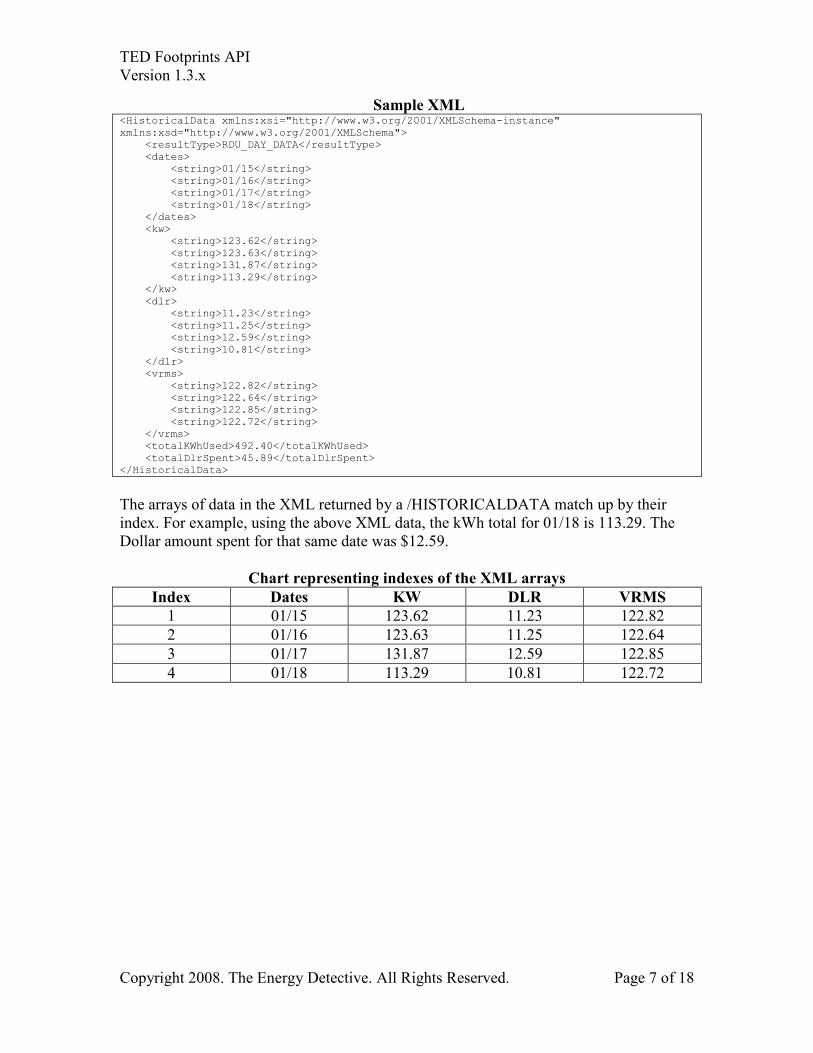
Sample XML <HistoricalData xmlns:xsi="http://www.w3.org/2001/XMLSchema-instance" xmlns:xsd="http://www.w3.org/2001/XMLSchema"> <resultType>RDU_DAY_DATA</resultType> <dates> <string>01/15</string> <string>01/16</string> <string>01/17</string> <string>01/18</string> </dates> <kw> <string>123.62</string> <string>123.63</string> <string>131.87</string> <string>113.29</string> </kw> <dlr> <string>11.23</string> <string>11.25</string> <string>12.59</string> <string>10.81</string> </dlr> <vrms> <string>122.82</string> <string>122.64</string> <string>122.85</string> <string>122.72</string> </vrms> <totalKWhUsed>492.40</totalKWhUsed> <totalDlrSpent>45.89</totalDlrSpent> </HistoricalData> The arrays of data in the XML returned by a /HISTORICALDATA match up by their index. For example, using the above XML data, the kWh total for 01/18 is 113.29. The Dollar amount spent for that same date was $12.59.
Chart representing indexes of the XML arrays
Index Dates KW DLR VRMS
1 01/15 123.62 11.23 122.82
2 01/16 123.63 11.25 122.64
3 01/17 131.87 12.59 122.85
4 01/18 113.29 10.81 122.72
TED Footprints API Version 1.3.x
Copyright 2008. The Energy Detective. All Rights Reserved. Page 8 of 18
Load Profile Load profile data can also be retrieved from the TED Footprints application. A Load Profile Event is used to determine when an appliance is turned on/off. This is done by monitoring the current kWh usage for pre-defined changes. For example, a hot water heater turning on might register a 4.6kW increase over a few seconds. This increase in kW usage is what is defined as a Load Profile Event. It is broken down into two parts:
• Load Profile Event Types – These are the individual appliances currently being monitored for Load Profile Events.
• Load Profile Data – This is the historical data indicating when a Load Profile Event occurs.
Load Profile Event Types (LOADPROFILEEVENTTYPE)
Listing Load Profile Event Types
Calling /LOADPROFILEEVE)TTYPE returns all of the appliances currently being monitored by the Footprints application. Sample URL: http://localhost:9090/LOADPROFILEEVENTTYPE Parameters: None
XML Fields
Field )ame Description LoadProfileEventType An array of 0 or more appliances currently being monitored.
Name The name of the appliance being monitored
KW1up The first increase in kW usage to signify that an appliance is turned on.
kW2up The second increase in KW usage to signify that an appliance is turned on. This is only used in multi-stage appliances like an HVAC.
KW3up The third increase in KW usage to signify that an appliance is turned on. This is only used in multi-stage appliances like an HVAC.
KW1down The first decrease in kW usage to signify that an appliance is turned off.
kW2down The second iderease in KW usage to signify that an appliance is turned on. This is only used in multi-stage appliances like an HVAC.
KW3down The third decrease in KW usage to signify that an appliance is turned on. This is only used in multi-stage appliances like an HVAC.
Variation The percent error that would be allowed to occur when monitoring
TED Footprints API Version 1.3.x
Copyright 2008. The Energy Detective. All Rights Reserved. Page 9 of 18
an event. For example , the the KW1up is 4.5 and the Variation is 10, then the Load Profile Event would be triggered by any increase in kW usage that falls within the range of 4.05kW and 4.95kW.
Status Whether the device is currently registered as ON/OFF within the TED Footprints Application.
Action DEL_EVENT: Deleting a Load Profile Event Type
To delete a load profile event type, you must specify the ACTION and NAME parameters as part of the HTTP Query string. Sample URL: http://localhost:9090/LOADPROFILEEVENTTYPE?ACTION=DEL_EVENT&NAME=HWH
Parameters:
• ACTION- Defines what action is to performed on the Load Profile Event Type. To delete a Load Profile Event Type, this should be “DEL_EVENT”
• NAME- The name of the appliance that is to be deleted.
Action SAVE_EVENT: Adding/Editing a Load Profile Event Type
To add a new Load Profile Event Type, or to change the values of a Load Provile Event type, you must specify the ACTION parameter as “SAVE_EVENT” as part of the HTTP Query String. Sample URL: http://localhost:9090/LOADPROFILEEVENTTYPE?ACTION=SAVE_EVENT&APPLIANCE_NAME=HWH&KW1UP=4.42&KW2UP=0&KW3UP=0&KW1DOWN=4.42&KW2DOWN=0&KW3DOWN=0&VARIATION=10
TED Footprints API Version 1.3.x
Copyright 2008. The Energy Detective. All Rights Reserved. Page 10 of 18
Parameters:
• ACTION- Defines what action is to performed on the Load Profile Event Type. To add or edit a Load Profile Event Type, this should be “SAVE_EVENT”
• APPLIANCE_NAME- The name of the appliance
• KW1UP - The first increase in kW usage to signify that an appliance is turned on.
• KW2UP - The second increase in KW usage to signify that an appliance is turned on. This is only used in multi-stage appliances like an HVAC. If the stage is not used, the value should be set to 0.
• KW3UP - The third increase in KW usage to signify that an appliance is turned on. This
is only used in multi-stage appliances like an HVAC. If the stage is not used, the value should be set to 0.
• KW1DOWN - The first decrease in kW usage to signify that an appliance is turned off.
• KW2DOWN - The second decrease in KW usage to signify that an appliance is turned on. This is only used in multi-stage appliances like an HVAC. If the stage is not used, the value should be set to 0.
• KW3DOWN - The third increase in KW usage to signify that an appliance is turned on. This is only used in multi-stage appliances like an HVAC. If the stage is not used, the value should be set to 0.
• VARIATION NOTE: The KWUP/Down values MUST balance out. So (KW1UP+KW2UP+KW3UP) must equal (KW1DOWN+KW2DOWN+KW3DOWN)
Action TOGGLE_EVENT: Manually marking an appliance as ON/OFF.
To manually toggle an appliance as ON/OFF for monitoring purposes within TED Footprints, the TOGGLE_EVE)T action is used. Sample URL: http://localhost:9090/LOADPROFILEEVENTTYPE?ACTION=TOGGLE_EVENT&APPLIANCE_NAME=HWH
Parameters:
• ACTION- Defines what action is to performed on the Load Profile Event Type. To toggle the ON/OFF status Load Profile Event Type, this should be “TOGGLE_EVENT”
• APPLIANCE_NAME- The name of the appliance
TED Footprints API Version 1.3.x
Copyright 2008. The Energy Detective. All Rights Reserved. Page 11 of 18
Load Profile Data (LOADPROFILEDATA)
A listing of daily Load Profile Events for a given appliance can be retrieved by making the /LOADPROFILEDATA request. Sample URL: http://localhost:9090/LOADPROFILEDATA?START_DATE=01/18/2008&EVENT_TYPE=HWH
Parameters:
• START_DATE- The start date of the load profile data range to return.
• END_DATE (optional) – The end date of the load profile data range to return.
• EVENT_TYPE- The name of a LOAD PROFILE EVENT TYPE If the END_DATE is not specified, than only data that occurred on the START_DATE will be returned.
XML Fields
Field )ame Description InitialKWUsed If the event started prior to the START_DATE, this is used to
indicate which stage the device currently is on.
HistoryEvents An array of individual events/stages that occurred during the specified date range.
EventTypeName The name of the appliance
EventDate Timestamp of the individual event
EventKWUsed Total kW used at the time the event occurs. NOTE: If kWUsed is “0” than the appliance is in the “off” state as the last KWDown stage has occurred.
KWHRate The rate being charged by the power company when the event occurs.
Cost The total dollars spent since the previous stage.
)OTE: It is possible for the KWHRate to change while a Load Profile Event is taking place. If this occurs, another History Event is logged showing the same kW usage as the previous event, but with a different rate specified as KWHRate.
Notice that the second HistoryEvent still has the same value for “EventKWUsed” but has a new KWH rate.
TED Footprints API Version 1.3.x
Copyright 2008. The Energy Detective. All Rights Reserved. Page 13 of 18
Settings Data
The current Settings data can be viewed or set using the /SETTINGSDATA method request. Note, these are settings for the TED Footprints application only, and is not a way to set the values on the RDU itself. Sample URL: http://localhost:9090/SETTINGSDATA )ote: To SET a setting value, specify the Setting name and value as a parameter on the HTTP Request string. For example, to change the Data Server Port, you would call: http://localhost:9090/SETTINGSDATA?DATASERVERPORT=8080 Each setting element contains a Name and Value pair. The Name is the name of the Setting element (used for database storage, this should ALWAYS be the same as the name of the XML element). The Value is the current value of the setting. Most of these settings are used for UI purposes on the TED Footprints viewer. These should not be changed. However, some of the other fields of interest are:
Setting )ame Description COMPORT Which COM Port is currently listening for the RDU
DATASERVERPORT The port of the HTTP server that is serving XML data requests
DEBUGLEVEL The current debug logging level of the application.
LASTREAD Timestamp of the last good reading from the RDU
HISTORYDAYSKEEP The total number of days that daily totals should be stored in the Footprints database
HISTORYHOURSKEEP The total number of hours that hourly totals should be stored in the Footprints database.
HISTORYMINUTESKEEP The total number of minutes that minute totals should be stored in the Footprints database.
HISTORYSECONDSKEEP The total number of second totals that should be stored in the Footprints database.
EVENTHISTORYDAYSKEEP Total number of days of Load Profile Event history that should be stored in the database.
Sample XML Data <?xml version="1.0" encoding="utf-8"?> <SettingsData xmlns:xsi="http://www.w3.org/2001/XMLSchema-instance" xmlns:xsd="http://www.w3.org/2001/XMLSchema"> <COMPort> <Name>COMPORT</Name> <Value>COM3</Value> </COMPort> <DataServerPort> <Name>DATASERVERPORT</Name> <Value>9090</Value> </DataServerPort> <CurrentVersion> <Name>VERSION</Name> <Value>1.0</Value>
TED Footprints API Version 1.3.x
Copyright 2008. The Energy Detective. All Rights Reserved. Page 14 of 18
Copyright 2008. The Energy Detective. All Rights Reserved. Page 15 of 18
Exporting Database Data (DATAEXPORTREQUEST) To export data directly from the database to a Comma Separated Value file (CSV), the /DATAEXPORTREQUEST method can be called. Sample URL: http://localhost:9090/DATAEXPORTREQUEST?TABLE_NAME=RDU_DAY_DATA&START_DATE=01/18/2008T00:00&END_DATE=01/19/2008T00:00 Parameters:
• TABLE_NAME- the name of the table whose data is being queried
• START_DATE- the start date for which table data is being returned.
• END_DATE – the end date range for which table data is being returned. The date format is MM/dd/yyyyThh:mm where
• MM is the month
• dd is the day of the month (1-31)
• yyyy is the 4 digit year
• hh is the hour (in 24-hour notation)
• mm is the minutes (0-59) For example, 4:30pm on January 19, 2008 would be: 1/19/2008T16:30 Sample URL: http://localhost:9090/DATAEXPORTREQUEST?TABLE_NAME=RDU_MONTH_DATA&START_DATE=1/19/2008T0:15&END_DATE=1/19/2008T17:45
Table )ames
Table )ame Description RDU_MONTH_DATA Table containing the monthly average recorded by the TED
Footprints application.
RDU_DAY_DATA Table containing the daily average recorded by the TED Footprints application.
RDU_HOUR_DATA Table containing the hourly average recorded by the TED Footprints application.
RDU_MINUTE_DATA Table containing the per-minute average recorded by the TED Footprints application.
RDU_SECOND_DATA Table containing the per-second average recorded by the TED Footprints application.
RDU_MONTH_DATA_1 Table containing the monthly average for MTU 1 recorded by the TED Footprints application.
RDU_DAY_DATA_1 Table containing the daily average for MTU 1 recorded by the TED Footprints application.
RDU_HOUR_DATA_1 Table containing the hourly average for MTU 1 recorded by the TED Footprints application.
RDU_MINUTE_DATA_1 Table containing the per-minute average for MTU 1 recorded by
TED Footprints API Version 1.3.x
Copyright 2008. The Energy Detective. All Rights Reserved. Page 16 of 18
the TED Footprints application.
RDU_SECOND_DATA_1 Table containing the per-second average for MTU 2 recorded by the TED Footprints application.
RDU_MONTH_DATA_2 Table containing the monthly average for MTU 2 recorded by the TED Footprints application.
RDU_DAY_DATA_2 Table containing the daily average for MTU 2 recorded by the TED Footprints application.
RDU_HOUR_DATA_2 Table containing the hourly average for MTU 2 recorded by the TED Footprints application.
RDU_MINUTE_DATA_2 Table containing the per-minute average for MTU 2 recorded by the TED Footprints application.
RDU_SECOND_DATA_2 Table containing the per-second average for MTU 2 recorded by the TED Footprints application.
The RDU_ tables all return the following fields: "TIMESTAMP","KW","DLR","VRMS"
• TIMESTAMP is the time and date when the average was calculated
• KW is the kWh calculation for that time frame
• DLR is the dollar/hour calculation for that time frame
• VRMS is the average voltage recorded during that time frame.
All date in these tables are stored as the average “per hour” recording during a given time interval. For example lets, say the following was recorded from the RDU_DAY_DATA table. "TIMESTAMP","KW","DLR","VRMS" "3/1/2008 12:00:00 AM","1.3665","0.1300001","123.2434" This means for the day of 3/1/2008 the average kWh used was 1.3665. If you wanted to calculate the total kW used for that given day, you would multiple 1.3655 * 24 (hours)= 32.772kW.
)OTE: Data is not logged during the DATAEXPORTREQUEST call. While most
of these calls are short, RDU_SECO)D_DATA may take a long time to return
(depending on the amount of data being stored in the database).
TED Footprints API Version 1.3.x
Copyright 2008. The Energy Detective. All Rights Reserved. Page 17 of 18
Footprints Dashboard (DASH) Sample URL: http://localhost:9090/DASH Parameters: none The graphics portion of the Footprints Viewer (i.e. the “Dashboard”) is a Flash 8 object that can be viewed directly from a web browser or embedded in any web page. Calling the “DASH” method on the Footprints server will return an HTML page that includes the dashboard object.
The flash object will expand to the height and width of the parent window, so adjusting these parameters will allow you to control the size of the object within the webpage.
Sample Web Page
Note: The TED Footprints application is only intended for use with a low number of simultaneous viewers (less than 5). Any more than that may impact the performance of
TED Footprints API Version 1.3.x
Copyright 2008. The Energy Detective. All Rights Reserved. Page 18 of 18
the Footprints application. If the object is to be embedded on a public high traffic site, it is recommended that the Flash 8 component of the application be moved to the web server itself and that a proxy is used between the Flash object and the Footprints application.
Example Proxy Script for DASHBOARD data #!/usr/bin/perl #File: DashboardData.pl #Description: Simple perl script to cache Dashboard data request calls so we don't overload the server #Date: 12/11/2007 #Version: 1.0 #Author: Pete Arvanitis ([email protected]) #Copyright 2007 The Energy Detective use LWP::UserAgent; use HTTP::Request::Common; use CGI; use File::Copy; my $ipaddress = "72.148.107.20"; my $port = "9090"; my $cacheDuration = 1; my $query = new CGI; my $unique = $query->param('unique'); print "Content-type: text/plain\n\n"; my $url = "http://" . $ipaddress . ":" . $port . "/DashboardData?unique=" . $unique; my $cacheFile = "cache/Dashboard.xml"; #See how long ago the file was modified $now = time(); $filestat = (stat($cacheFile))[9]; my $age = $now - $filestat; #if the file is older than the specified duration, grab a new one from the source if ($age > $cacheDuration){ #if the file is already locked by another process, just ignore this segment of code. if (open (XMLFILE, '>' . $cacheFile . ".cache")){ flock(XMLFILE, LOCK_EX); my $ua = LWP::UserAgent->new; my $response = $ua->simple_request(GET $url); if ($response->is_success) { print XMLFILE $response->content; } #close the file regardless close (XMLFILE); #don't bother to move the file if the call failed. if ($response->is_success) { move ($cacheFile . ".cache", $cacheFile); } } } #Output the cached Dashboard.xml file open (OUTFILE, $cacheFile); while (<OUTFILE>) { chomp; print "$_\n"; } close (OUTFILE); exit();