+ All Categories
Home > Documents > Temp Changes

Temp Changes

Date post: 06-Apr-2018
Category:
Upload: surya-teja-bulusu
View: 217 times
Download: 0 times
Share this document with a friend
148
 EFFECT OF SUPPORT CONDITIONS ON STEEL BEAMS EXPOSED OF FIRE By Jenny Seputro Supervisor Assoc. Professor Andrew H. Buchanan Associate supervisor Assoc. Professor Peter J. Moss A research project report presented as partial fulfilment of the requirements for the degree of Master of Engineering in Fire Engineering Department of Civil Engineering University of Canterbury Christchurch, New Zealand
Transcript

8/3/2019 Temp Changes

http://slidepdf.com/reader/full/temp-changes 1/148


EFFECT OF SUPPORT CONDITIONS ON STEEL

BEAMS EXPOSED OF FIRE

By

Jenny Seputro

Supervisor

Assoc. Professor Andrew H. Buchanan

Associate supervisor

Assoc. Professor Peter J. Moss

A research project report presented as partial fulfilment of the requirements for

the degree of Master of Engineering in Fire Engineering

Department of Civil Engineering

University of CanterburyChristchurch, New Zealand

8/3/2019 Temp Changes

http://slidepdf.com/reader/full/temp-changes 2/148

8/3/2019 Temp Changes

http://slidepdf.com/reader/full/temp-changes 3/148


Abstract

The performance of steel structures at elevated temperature is determined by many factors.

This report describes the analytical investigation of a single span steel beam using the non-

linear finite element program, SAFIR. Four support conditions and additional axial spring

were used to model structural elements with various level of axial and flexural restraint.

Different fires were applied and the effect of the applied load, number of fire-exposed sides

and location of the line of support were analysed in terms of the midspan deflection, bending

moment distribution and axial force in the axially restraint beams. It was found that beams

with axial restraint, especially those with rotational restraint are very sensitive to the stress-

strain relationship of the steel at elevated temperatures.

This research is intended to be a preliminary study leading to the detailed behaviour of 

complex steel frames such as those tested at Cardington. Some important aspects that could

not be included in this project need further investigation in future research.

8/3/2019 Temp Changes

http://slidepdf.com/reader/full/temp-changes 4/148

8/3/2019 Temp Changes

http://slidepdf.com/reader/full/temp-changes 5/148


Acknowledgements

First of all, I would like to gratefully thank a large number of people who have been

supporting me in many ways throughout the completion of this project:

Assoc. Professor Andy Buchanan, my supervisor who has guided me in my research and

provided endless helps all the way.

Assoc. Professor Peter Moss, my associate supervisor who has given me lots of ideas of what

to look for and explanations of what was going on, as well as proof reading this report.

Linus Lim, who has great understanding of structural behaviour and SAFIR program in

particular, for the guidance in using SAFIR program and in how to tackle the problems.

Richard Welsh, who has given me a lot of explanations on the structural behaviour.

Zisong Zhen, who has provided a lot of help with the figures in this report.

Dr. Charles Fleischmann and Mr. Michael Spearpoint, the other lecturers in Fire Engineering,

and all my other classmates, for making this year such a great and wonderful time.

My parents and grandma, who has financially and spiritually supported me and make my

study in Canterbury possible and enjoyable.

Other people, who in various ways have contributed in making this research and report

possible.

8/3/2019 Temp Changes

http://slidepdf.com/reader/full/temp-changes 6/148

8/3/2019 Temp Changes

http://slidepdf.com/reader/full/temp-changes 7/148


Contents 

LIST OF FIGURES.................................................................................................................................................i

LIST OF TABLES.................................................................................................................................................iv

NOMENCLATURE ............................................................................................................................................... v

1. INTRODUCTION.............................................................................................................................................. 1

1.1 GENERAL........................................................................................................................................................1

1.2 ABOUT THE PROJECT ......................................................................................................................................2

1.3 OBJECTIVES....................................................................................................................................................2

1.4 SCOPE AND ORGANISATION ............................................................................................................................3

2. LITERATURE SURVEY ..................................................................................................................................4

2.1 INTRODUCTION ............................................................................................................................................... 4

2.2 THERMAL PROPERTIES OF STEEL..................................................................................................................... 5

2.2.1 Thermal elongation................................................................................................................................5

2.2.2 Thermal conductivity .............................................................................................................................6 

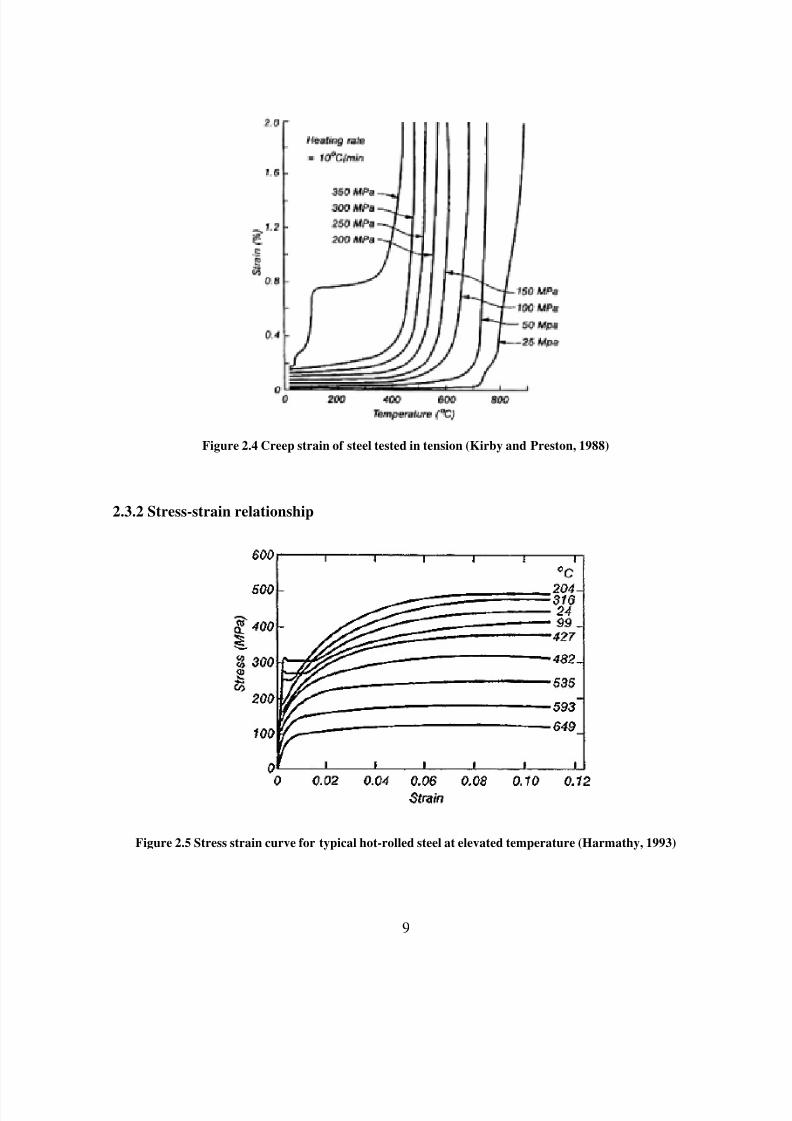
2.2.3 Specific heat...........................................................................................................................................7 

2.3 MECHANICAL PROPERTIES OF STEEL...............................................................................................................8

2.3.1 Components of strain............................................................................................................................. 8

2.3.2 Stress-strain relationship.......................................................................................................................9

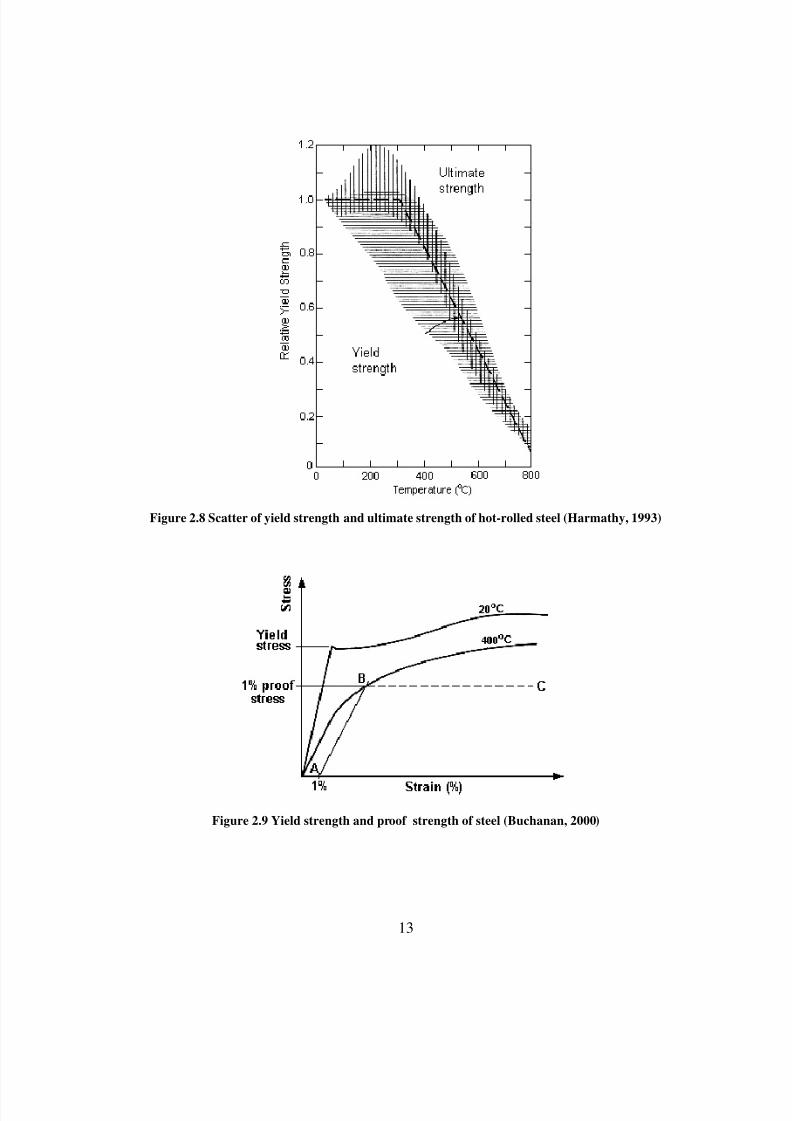
2.3.3 Ultimate and yield strengths ................................................................................................................ 11

2.3.4 Modulus of elasticity ............................................................................................................................15

2.4 STRUCTURAL STEEL DESIGN .........................................................................................................................17

2.4.1 Steel design at ambient condition ........................................................................................................ 17 

2.4.2 Steel design at elevated temperature....................................................................................................18

2.4.3 Design fires.......................................................................................................................................... 23

2.5 BEHAVIOUR OF REDUNDANT STRUCTURES IN FIRE........................................................................................ 27

2.5.1 Thermal expansion............................................................................................................................... 27 

2.5.2 Thermal buckling ................................................................................................................................. 29

2.5.3 Thermal bowing................................................................................................................................... 31

2.6 FIRE RESISTANCE..........................................................................................................................................32

2.6.1 Failure criteria.....................................................................................................................................33

2.6.2 Fire resistance rating........................................................................................................................... 34

8/3/2019 Temp Changes

http://slidepdf.com/reader/full/temp-changes 8/148


2.6.3 Methods of protection.......................................................................................................................... 36 

2.7 FIRE TESTS ................................................................................................................................................... 41

2.7.1 General................................................................................................................................................ 41

2.7.2 Cardington fire test.............................................................................................................................. 42

3. SAFIR PROGRAM.......................................................................................................................................... 45

3.1 GENERAL ..................................................................................................................................................... 45

3.2 ANALYSIS PROCEDURE................................................................................................................................. 46

3.2.1 Thermal analysis ................................................................................................................................. 47 

3.2.2 Structural analysis............................................................................................................................... 49

3.3 CAPABILITIES OF SAFIR.............................................................................................................................. 51

3.4 COMMON FEATURES IN ALL ANALYSES ........................................................................................................ 52

3.5 SIGN CONVENTIONS ..................................................................................................................................... 52

3.6 MATERIAL PROPERTIES ................................................................................................................................ 52

3.7 CONVERGENCE CRITERIA ............................................................................................................................. 53

4. METHODS OF ANALYSIS............................................................................................................................ 54

4.1 THE STEEL BEAM.......................................................................................................................................... 54

4.2 THERMAL ANALYSIS .................................................................................................................................... 56

4.2.1 Discretisation ...................................................................................................................................... 56 

4.2.2 Applied fires......................................................................................................................................... 58

4.3 STRUCTURAL ANALYSIS ............................................................................................................................... 61

4.3.1 Discretisation ...................................................................................................................................... 61

4.3.2 Loading................................................................................................................................................ 61

4.3.3 Supports............................................................................................................................................... 62

4.3.4 Introduction of springs ........................................................................................................................ 64

4.4 SUMMARY .................................................................................................................................................... 65

5. ANALYSIS OF RESULTS FOR FOUR SUPPORT CONDITIONS.......................................................... 66

5.1 DEFLECTION OF THE BEAMS ......................................................................................................................... 67

5.2 BEAM WITH PIN-ROLLER SUPPORTS .............................................................................................................. 70

5.3 BEAM WITH PIN-PIN SUPPORTS ..................................................................................................................... 74

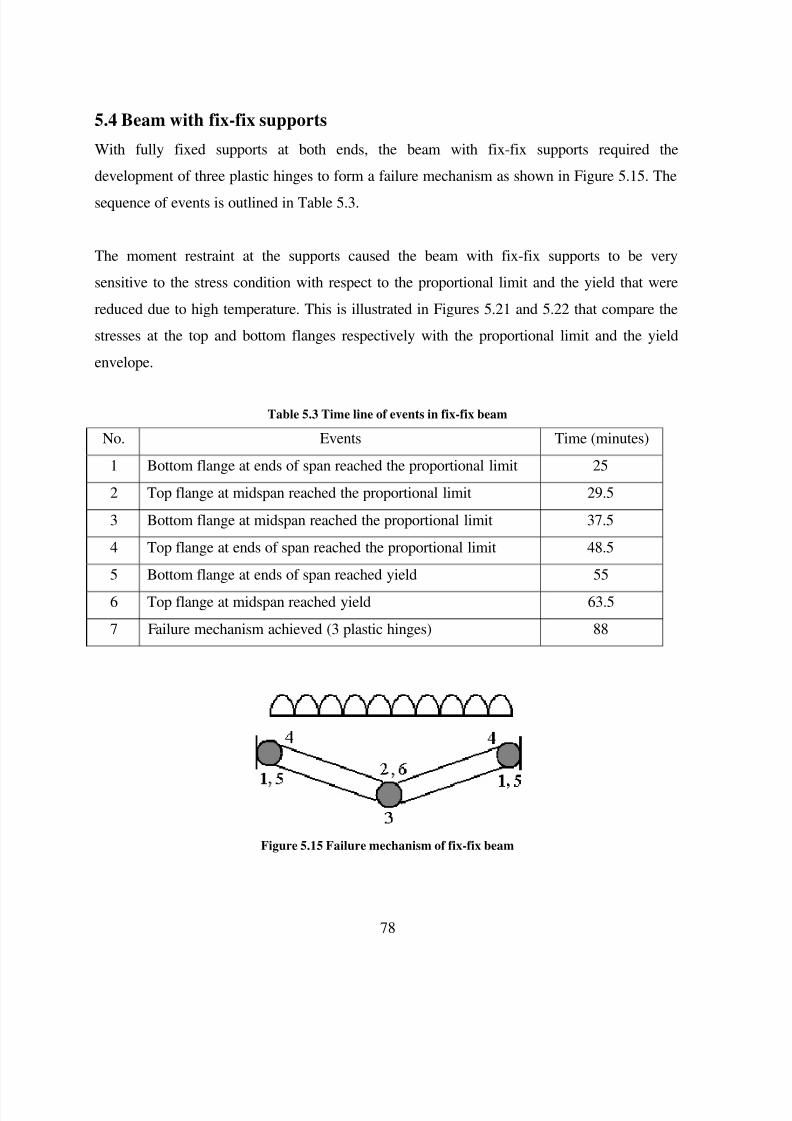
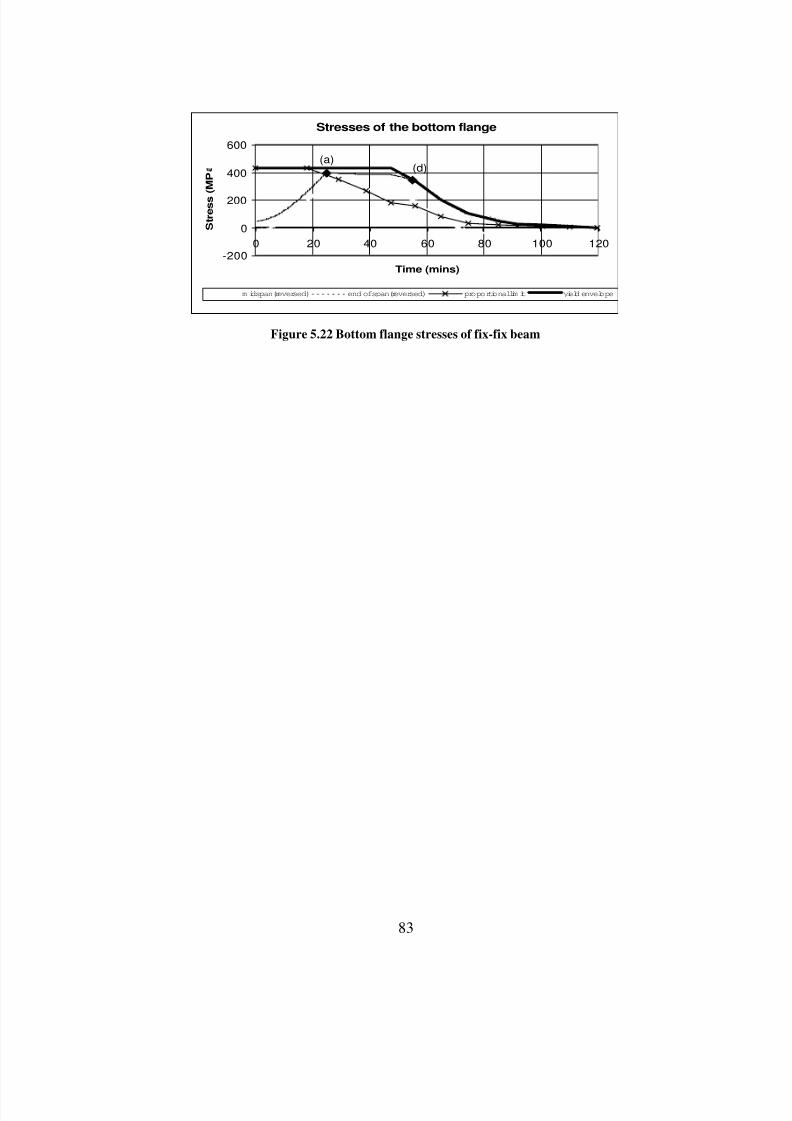
5.4 BEAM WITH FIX-FIX SUPPORTS ..................................................................................................................... 78

5.5 BEAM WITH FIX-SLIDE SUPPORTS ................................................................................................................. 84

5.6 COMPARISON WITH CRITICAL BUCKLING...................................................................................................... 88

5.7 CONCLUSIONS .............................................................................................................................................. 90

5.7.1 Simply supported beams...................................................................................................................... 90

8/3/2019 Temp Changes

http://slidepdf.com/reader/full/temp-changes 9/148

8/3/2019 Temp Changes

http://slidepdf.com/reader/full/temp-changes 10/148

8/3/2019 Temp Changes

http://slidepdf.com/reader/full/temp-changes 11/148

i

List of figures

Figure 2.1 Thermal elongation of steel as a function of temperature (EC3, 1995)_________________________ 5

Figure 2.2 Thermal conductivity of steel as a function of temperature (EC3, 1995) _______________________6 

Figure 2.3 Specific heat of steel as a function of temperature (EC3, 1995) ______________________________ 7 

Figure 2.4 Creep strain of steel tested in tension (Kirby and Preston, 1988) _____________________________ 9

Figure 2.5 Stress strain curve for typical hot-rolled steel at elevated temperature (Harmathy, 1993)__________ 9

Figure 2.6 Stress strain relationship of grade 460 steel at elevated temperature (EC3, 1995) ______________ 10

Figure 2.7 Stress-strain relationship for steel at elevated temperature (EC3, 1995) ______________________ 11

Figure 2.8 Scatter of yield strength and ultimate strength of hot-rolled steel (Harmathy, 1993) _____________ 13

Figure 2.9 Yield strength and proof strength of steel (Buchanan, 2000) _______________________________ 13

Figure 2.10 Reduction factors for stress-strain relationship of steel (EC3, 1995) ________________________ 14

Figure 2.11 Modulus of elasticity for 1 structural, 2 prestressing and 3 reinforcing steel (Harmathy, 1993) ___ 15

Figure 2.12 Relative value of the MOE compared with that of the yield strength (Buchanan, 2000)__________ 16 

Figure 2.13 Behaviour of beams with different support conditions (Buchanan, 2000)_____________________ 20

Figure 2.14 Moment redistribution at elevated temperature (Buchanan, 2000) _________________________ 21

Figure 2.15 Flexural enhancement by axial restraint (Buchanan, 2000) _______________________________ 22

Figure 2.16 Standard fire curves (Buchanan, 2000)_______________________________________________ 24

Figure 2.17 Eurocode reference decay rate (EC1, 1994) ___________________________________________ 25

Figure 2.18 Heat release rate for t-squared fire__________________________________________________ 26 

Figure 2.19 Fixed ended beam subjected to thermal expansion and bowing (Rotter and Usmani, 2000) ______ 31

Figure 2.20 Fire resistance furnace at New Zealand Building Research Association (Buchanan, 1994) ______ 32

Figure 2.21 Protected and unprotected steel temperatures exposed to a parametric fire (Buchanan, 2000)____ 36 

Figure 2.22 Light steel frame wall system (Buchanan, 2000) ________________________________________ 37 

Figure 2.23 Concrete encasement for steelwork protection (Buchanan, 2000) __________________________ 39

Figure 2.24 Concrete filled hollow steel section (Buchanan, 2000) ___________________________________ 39

Figure 2.25 Concrete filling between the flanges of I-section (Buchanan, 2000) _________________________ 40

Figure 2.26 General view of the structural frame at the Cardington test (British Steel, 1999) ______________ 43

Figure 3.1 Steps and files of the analyses (Franssen et al, 2000) ____________________________________ 46 

Figure 3.2 Diamond 2000 output for the thermal analysis __________________________________________ 48

Figure 3.3 Diamond 2000 output for the structural analysis________________________________________ 50Figure 4.1 Floor plan of the Telecom Building in Auckland (Clifton, 1999) ____________________________ 54

Figure 4.2 Discretisation of the steel beam cross section ___________________________________________ 57 

Figure 4.3 Linear heating rates_______________________________________________________________ 58

Figure 4.4 Standard ISO 834 fire _____________________________________________________________ 59

Figure 4.5 Realistic parametric fire ___________________________________________________________ 60

8/3/2019 Temp Changes

http://slidepdf.com/reader/full/temp-changes 12/148

ii

Figure 4.6 Discretisation of the beam for the structural analysis ____________________________________ 61

Figure 5.1 Midspan deflection of the beams throughout heating _____________________________________ 67 

Figure 5.2 Midspan deflection for all beams at early stage of the fire _________________________________ 68

Figure 5.2 Failure mechanism of pin-roller beam ________________________________________________ 70

Figure 5.3 Midspan deflection of pin-roller beam ________________________________________________ 71

Figure 5.4 Midspan moment of pin-roller beam__________________________________________________ 72

Figure 5.5 Top flange stresses of pin-roller beam ________________________________________________ 72

Figure 5.6 Bottom flange stresses of pin-roller beam______________________________________________ 72

Figure 5.7 Moment distribution along the pin-roller beam _________________________________________ 73

Figure 5.8 Failure mechanism of pin-pin beam __________________________________________________ 74

Figure 5.9 Midspan deflection of pin-pin beam __________________________________________________ 76 

Figure 5.10 Midspan moment of pin-pin beam___________________________________________________ 76 

Figure 5.11 Axial force of pin-pin beam________________________________________________________ 76 

Figure 5.12 Top flange stresses of pin-pin beam _________________________________________________ 77 

Figure 5.13 Bottom flange stresses of pin-pin beam_______________________________________________ 77 

Figure 5.14 Moment distribution along the pin-pin beam __________________________________________ 77 

Figure 5.15 Failure mechanism of fix-fix beam __________________________________________________ 78

Figure 5.16 Midspan deflection of fix-fix beam __________________________________________________ 81

Figure 5.17 Midspan moment of fix-fix beam____________________________________________________ 81

Figure 5.18 End moment of fix-fix beam________________________________________________________ 81

Figure 5.19 Moment distribution along the fix-fix beam ___________________________________________ 82

Figure 5.20 Axial force of fix-fix beam _________________________________________________________ 82

Figure 5.21 Top flange stresses of fix-fix beam __________________________________________________ 82

Figure 5.22 Bottom flange stresses of fix-fix beam ________________________________________________ 83

Figure 5.23 Failure mechanism of fix-slide beam ________________________________________________ 84

Figure 5.24 Midspan deflection of fix-slide beam_________________________________________________ 85

Figure 5.25 Midspan moment of fix-slide beam __________________________________________________ 86 

Figure 5.26 End moment of fix-slide beam ______________________________________________________ 86 

Figure 5.27 Moment distribution along the fix-slide beam__________________________________________ 86 

Figure 5.28 Top flange stresses of fix-slide beam_________________________________________________ 87 

Figure 5.29 Bottom flange stresses of fix-slide beam ______________________________________________ 87 Figure 5.30 Comparison between the axial load and the critical buckling load _________________________ 89

Figure 6.1 Midspan deflection with spring stiffness between 0 and 1 _________________________________ 92

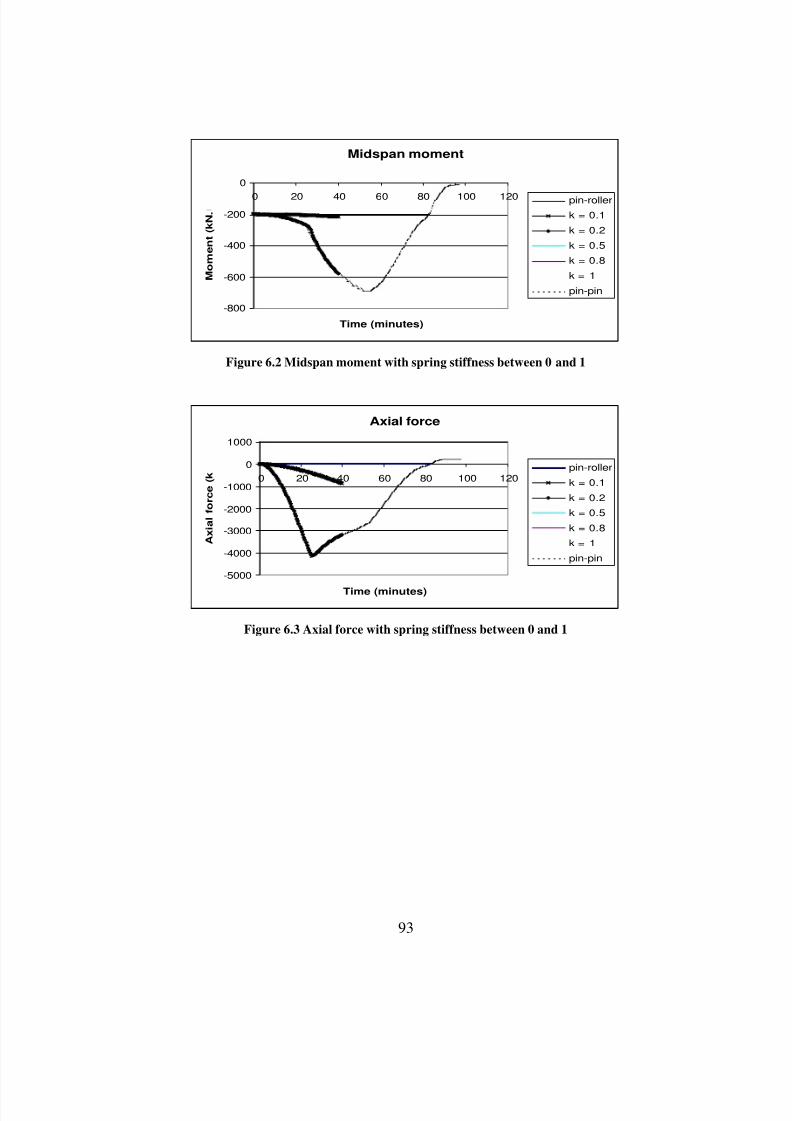
Figure 6.2 Midspan moment with spring stiffness between 0 and 1 ___________________________________ 93

Figure 6.3 Axial force with spring stiffness between 0 and 1 ________________________________________ 93

Figure 6.4 Midspan deflection with spring stiffness between 0 and 0.1 ________________________________ 94

8/3/2019 Temp Changes

http://slidepdf.com/reader/full/temp-changes 13/148

iii

Figure 6.5 Midspan moment with spring stiffness between 0 and 0.1__________________________________ 94

Figure 6.6 Axial force with spring stiffness between 0 and 0.1_______________________________________ 95

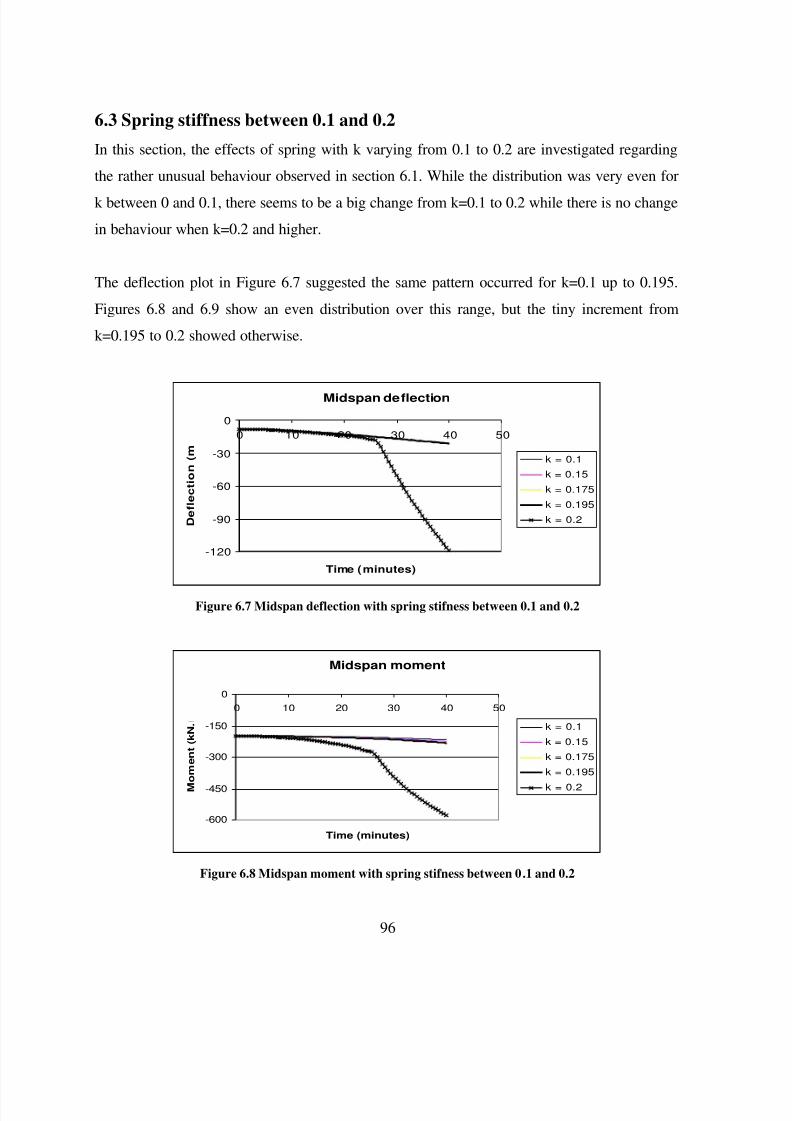
Figure 6.7 Midspan deflection with spring stifness between 0.1 and 0.2 _______________________________ 96 

Figure 6.8 Midspan moment with spring stifness between 0.1 and 0.2 _________________________________ 96 

Figure 6.9 Axial force with spring stiffness between 0.1 and 0.2 _____________________________________ 97 

Figure 7.1 Midspan deflection of pin-pin beam with respect to temperature ____________________________ 99

Figure 7.2 Midspan deflection of pin-pin beam under various linear heating rates_______________________ 99

Figure 7.3 Midspan moment of pin-pin beam under various linear heating rates ________________________ 99

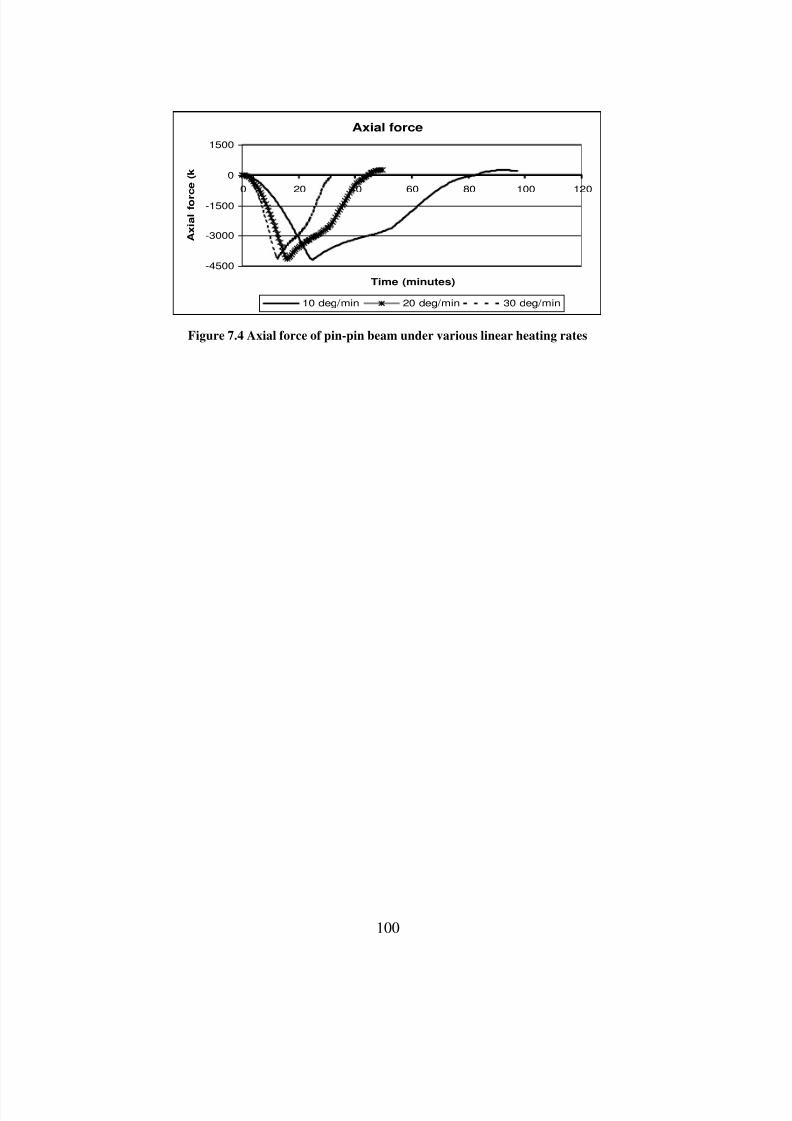
Figure 7.4 Axial force of pin-pin beam under various linear heating rates ____________________________ 100

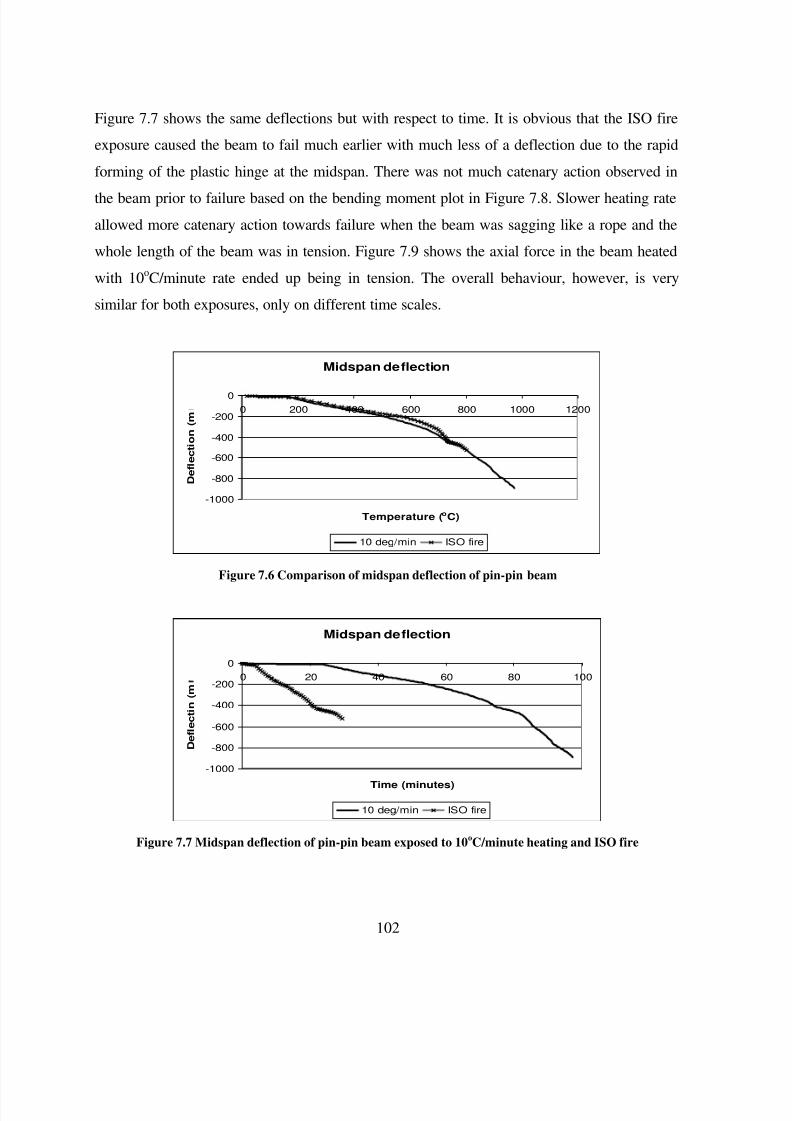
Figure 7.6 Comparison of midspan deflection of pin-pin beam _____________________________________ 102

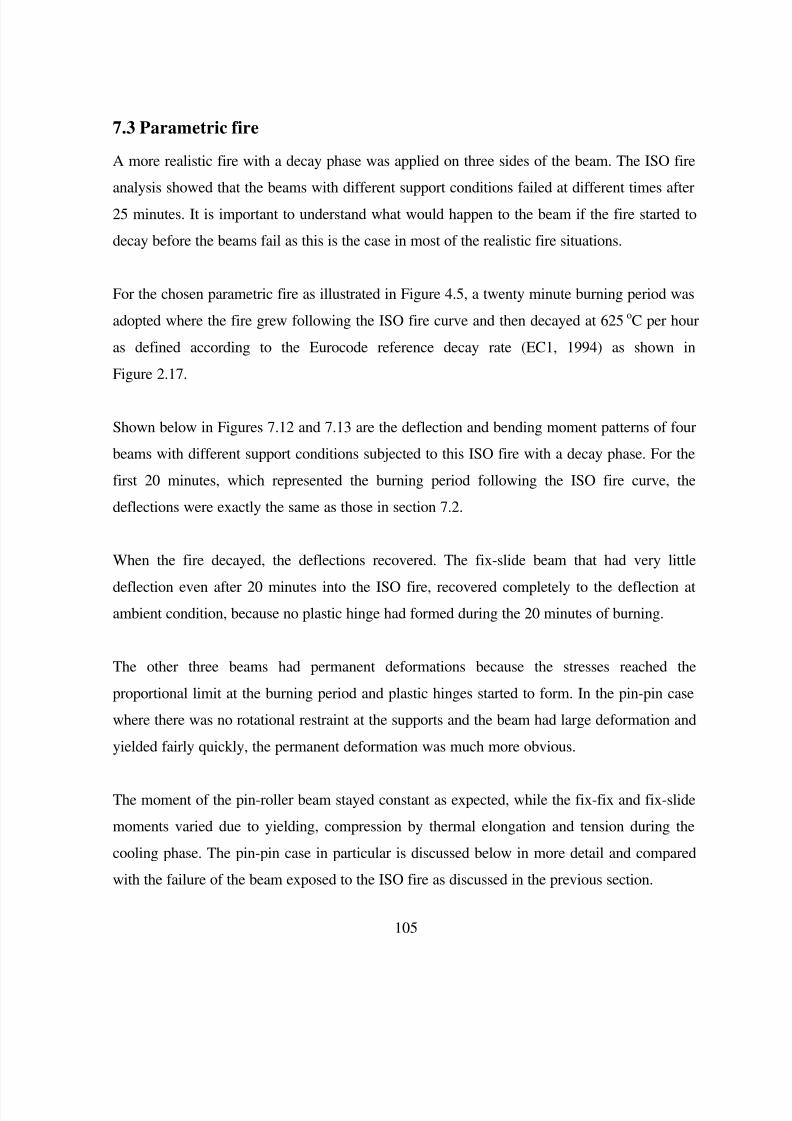
Figure 7.7 Midspan deflection of pin-pin beam exposed to 10oC/minute heating and ISO fire _____________102

Figure 7.8 Midspan moment of pin-pin beam exposed to 10oC/minute heating and ISO fire _______________ 103

Figure 7.9 Axial force of pin-pin beam exposed to 10oC/minute heating and ISO fire ____________________103

Figure 7.10 Top flange stresses of pin-pin beam exposed to ISO fire_________________________________ 104

Figure 7.11 Bottom flange stresses of pin-pin beam exposed to ISO fire ______________________________ 104

Figure 7.12 Midspan deflection of all beams subjected to a parametric fire ___________________________ 106 

Figure 7.13 Midspan moment of all beams subjected to a parametric fire_____________________________ 106 

Figure 7.14 Deflection of pin-pin beam subjected to ISO and Parametric fires_________________________ 107 

Figure 7.15 Midspan moment of pin-pin beam subjected to ISO and Parametric fires ___________________ 107 

Figure 7.16 Axial force of pin-pin beam subjected to ISO and Parametric fires ________________________ 108

Figure 7.17 Midspan deflection of all beams exposed to ISO fire on 3 and 4 sides ______________________ 109

Figure 7.18 Midspan moment of pin-pin beam heated on 3 and 4 sides_______________________________ 111

Figure 7.19 Midspan moment of fix-fix beam heated on 3 and 4 sides ________________________________ 111

Figure 7.20 Midspan moment of fix-slide beam heated on 3 and 4 sides ______________________________ 112

Figure 7.21 Axial force of pin-pin beams heated on 3 and 4 sides ___________________________________ 112

Figure 7.22 Axial force of fix-fix beams heated on 3 and 4 sides ____________________________________ 112

Figure 8.1 Midspan deflection of fix-fix beam under different loading________________________________ 114

Figure 8.2 Midspan moment of fix-fix beam under different loading _________________________________ 114

Figure 8.3 Endspan moment of fix-fix beam under different loading _________________________________ 114

Figure 8.4 Axial load of fix-fix beam under different loading_______________________________________ 115

Figure 9.1 Lines of thrust for several support conditions (Buchanan, 2000) ___________________________ 116 Figure 9.2 Midspan deflection of pin-pin beam with different lines of thrust ___________________________ 118

Figure 9.3 Midspan moment of pin-pin beam with different lines of thrust ____________________________118

Figure 9.4 Axial force of pin-pin beam with different lines of thrust _________________________________119

Figure 9.5 Top flange stresses of pin-pin beam supported ¼ down from mid height _____________________ 119

Figure 9.6 Bottom flange stresses of pin-pin beam supported ¼ down from mid height __________________120

8/3/2019 Temp Changes

http://slidepdf.com/reader/full/temp-changes 14/148

iv

List of tables

Table 2.1 Reduction factors for stress-strain relationship of steel at elevated temperature (EC3, 1995)_______14

Table 4.1 The steel beam profiles for the analyses (BHP catalogue)___________________________________54

Table 4.2 Summary of different analyses in the project ____________________________________________ 64

Table 5.1 Time line of events in pin-roller beam _________________________________________________ 69

Table 5.2 Time line of events in pin-pin beam ___________________________________________________ 73

Table 5.3 Time line of events in fix-fix beam _____________________________________________________77 

Table 5.4 Time line of events in fix-slide beam ___________________________________________________83

8/3/2019 Temp Changes

http://slidepdf.com/reader/full/temp-changes 15/148

v

Nomenclature

Ag : gross area of cross section (mm2)

As : tensile stress area of section (mm

2

)At : total area of compartment (m

2)

Av : area of opening (m2)

bf  : width of flange (mm)

cs : specific heat of steel (J/kg.K)

d : depth of section (mm)

d1 : depth between flanges (mm)

E : tangent modulus of steel (MPa)

ET : total energy content of fuel (MJ)

et : fuel load per total surface area (MJ/m2)

F : yield force (N)

Fref  : reference value of opening factor ( m )

Fv : opening factor ( m )

f y : yield stress (MPa)

G : nominal dead load (kN/m)

Hv : height of opening (m)

I : second moment of area of a cross section (mm4)

I : thermal intertia, k ρcs (W2s/m

4K

2)

Iref  : reference value of  skpc (Ws0.5 /m2K)

k : growth constant for t-squared fire (s  MW  )

k : relative stiffness of the spring to that of the beam

K : stiffness of member (N/m)

l : effective length of member (m)

L : span or member length (m)

M* : design bending moment (kN.m)

Mn : maximum calculated elastic moment capacity (kN.m)

8/3/2019 Temp Changes

http://slidepdf.com/reader/full/temp-changes 16/148

vi

Mp : maximum calculated plastic moment capacity (kN.m)

P : axial force (kN)

Pcr : critical buckling load (kN)

Q : nominal live load (kN/m)

r : radius of gyration (mm)

r1 : root radius (mm)

S : plastic section modulus (mm3)

Ts : temperature of steel (oC)

tf  : thickness of flange (mm)

tw : thickness of web (mm)

W : self weight (kN/m)w : uniformly distributed design load (kN/m)

Z : elastic section modulus of steel (mm3)

α : thermal expansion coefficient (oC

-1)

∆ : deflection (mm)

ε : strain

λs : thermal conductivity of steel (W/mK)

 νs : steel Poisson’s ratio

ρs : density of steel (kg/m3)

σy : yield strength of steel (MPa)

8/3/2019 Temp Changes

http://slidepdf.com/reader/full/temp-changes 17/148

1

1. Introduction

1.1 General

Structural steel has been widely used throughout the world. It is one of a designer’s bestoptions in view of its advantages over other materials. Steel is available in a range of discrete

size, and its ductile behaviour allows plastic deformation upon yielding, therefore avoiding

brittle failures. In reinforced concrete structures, steel enhances the concrete strength by

carrying the tensile forces. It is also commonly used to reinforce timber constructions.

In spite of its advantages, steel on its own is vulnerable in fire. Elevated temperatures in the

steel cause reduction in its strength and stiffness which eventually leads to failure due to

excessive deformations. This is crucial in steel in compared with concrete or timber members

as steel conducts heat very well and often comes in thin or slender elements.

In structural design, there are a few functional requirements such as those stated in Clause C4

of the New Zealand Approved Document (BIA, 1992):

“Buildings shall be constructed to maintain structural stability during fire to:

a. Allow people adequate time to evacuate safely,

b. Allow fire service personnel adequate time to undertake rescue and fire fighting

operations, and 

c. Avoid collapse and consequential damage to adjacent household units or other property.”

There are a lot of different methods for protecting structural steel to maintain its strength and

stability in fire, but little is known about the true behaviour of the steel members under various

support conditions and heating patterns. The recommended fire resistance to be applied to the

steel structures is usually determined based on furnace tests on single elements such as a beamor a column.

Contrary to popular belief, an unprotected steel element that is a part of a large complex

structure may have a sufficiently high level of fire resistance to perform well in fire. This is

8/3/2019 Temp Changes

http://slidepdf.com/reader/full/temp-changes 18/148

2

due to the ability of the overall structure to redistribute loads from the heated area to the cooler

neighbouring elements. The lack of understanding of the true behaviour of steel elements in

fire leads to inefficient and uneconomical design. To assess the overall performance of steel

frames, it is important to understand the detailed behaviour of a single beam with several

support conditions that represent various elements in a complex structure.

1.2 About the project

The new finite element program, SAFIR, has been made available as a powerful engineering

tool to model the behaviour of structures in fires. Using the SAFIR program, it is possible to

investigate the behaviour of steel beams with different support types.

The I-section beam used for this research was a BHP universal beam 610UB101 with yield

strength of 430 MPa and elastic modulus of 210 GPa. This is a fairly high strength steel and

the analysis results may not apply directly to structural beams which have lower strength and

are supported somewhat in between the ones investigated in this project. However, the main

purpose of this project is to understand the responses from different end conditions that will

lead into appropriate design to avoid catastrophic failures of structures during fire exposure.

1.3 Objectives

The primary objectives of this research are:

♣ To analyse and explain the detailed behaviour of steel beams at elevated temperatures

under different support conditions and heating rates.

♣ To provide preliminary study as a basis for future research on complex structural steel

frames.

8/3/2019 Temp Changes

http://slidepdf.com/reader/full/temp-changes 19/148

3

1.4 Scope and organisation

This report concentrates on structural steel beams, and those aspects of behaviour relevant to

design and fire protection. Several chapters investigate the behaviour of steel beams under

elevated temperature when restrained by different end conditions.

Chapter 2 summarises the relevant material from the available literature. Information on the

SAFIR program used, including its capabilities, common features and assumptions in the

analyses as well as the input and output files are laid out in chapter 3. Chapter 4 describes the

methods of analysis in this project. This includes the input data for SAFIR analyses such as

the beam parameters, applied fires, and various end restraints.

The base case results from SAFIR involving 4 support conditions are discussed in detail in

chapter 5. Variation from the base case including the introduction of springs at the ends of the

beams, different fires, loading, and locations of line of thrust, are discussed separately in

chapters 6-9 respectively.

Some of the problems encountered during the research project due to limitations of the SAFIR

program and other causes are summarised in chapter 10. Conclusions from the project are

outlined in chapter 11, while chapter 12 discusses recommendations that could be useful for

future research.

8/3/2019 Temp Changes

http://slidepdf.com/reader/full/temp-changes 20/148

4

2. Literature survey

2.1 Introduction

This chapter summarises the theoretical background for this research available in theliterature. The materials include the steel properties and the impact of fire that causes

deterioration of the steel properties. The information on the thermal and mechanical properties

of steel are extracted from the Eurocode3 (EC3, 1995).

Structures in general are designed to carry loads and survive the environmental conditions at

ambient temperatures. The fire protection will then be applied according to the functional

requirements of the buildings. There are several ways to protect structural steel elements with

a wide range of costs, which are introduced in section 2.6.3. Most of the materials in the

structural design and the fire resistance sections are summarised from the discussion by

Buchanan (2000).

Steel elements that are part of a more complex structure showed much better performance in

real fires. This is due to the redundancy of the structure allowing redistribution of the load to

stronger parts that are not much exposed to the heat. Section 2.5 outlines the behaviour of 

redundant structures in fire that was presented by Rotter et al. (1999) and the fire tests,

including the Cardington test, are introduced in section 2.7 in accordance with the publication

by the British Steel (1999).

The general features on the SAFIR program used in this research are laid out in chapter 3,

describing the analysis procedure, the program capabilities and the common assumptions in

the analyses.

8/3/2019 Temp Changes

http://slidepdf.com/reader/full/temp-changes 21/148

5

2.2 Thermal properties of steel

2.2.1 Thermal elongation

The thermal elongation of steel is determined by the Eurocode 3 formulae as a function of the

steel temperature and illustrated in Figure 2.1.

For 20oC ≤ Ts < 750

oC

4285 10416.2104.0102.1 /  −− ×−×+×=∆ ss T T ll [2.1]

For 750oC ≤ Ts < 860

oC

2101.1 /  −×=∆ ll [2.2]

For 860oC ≤ Ts < 1200oC

35 102.6102 /  −− ×−×=∆sT ll [2.3]

Thermal elongation of steel

0

5

10

15

20

0 200 400 600 800 1000 1200

Temperature (oC )

   E   l  o  n  g  a   t   i  o  n   (  x   1  -   3   )


Figure 2.1 Thermal elongation of steel as a function of temperature (EC3, 1995)

In simple calculation models, assuming the thermal elongation to have constant relationship

with the temperature of the steel, the elongation can be taken as:

)20(1014 /  6 −×=∆ −sT ll [2.4]

8/3/2019 Temp Changes

http://slidepdf.com/reader/full/temp-changes 22/148

6

2.2.2 Thermal conductivity

The variation of the thermal conductivity of steel can also be determined from the following

Eurocode formulae and is illustrated below:

For 20oC ≤ Ts < 800oC

ss T 21033.354 −×−=λ  [2.5]

For 800oC ≤ Ts < 1200

oC

3.27=sλ  [2.6]

Thermal conductivity of steel

0

15

30

45

60

0 200 400 600 800 1000 1200

Temperature (oC)

   C  o  n   d  u  c   t   i  v   i   t  y   (   W   /  m

   K


Figure 2.2 Thermal conductivity of steel as a function of temperature (EC3, 1995)

Thermal conductivity of steel with temperature greater than 1200oC is not defined in the

Eurocode 3 as most structural steel members can hardly survive such heat. The value of 27.3

W/mK is taken for T > 1200oC if such case needs to be considered as dealt with in the SAFIR

thermal analysis.

For simple calculation models that are independent of the temperature, the value of 45 W/mK

can be adopted.

8/3/2019 Temp Changes

http://slidepdf.com/reader/full/temp-changes 23/148

7

2.2.3 Specific heat

The specific heat of steel is defined and illustrated as follows:

For 20oC ≤ Ts < 600oC

3631 1022.21069.11073.74252

T T T c ss

−−− ×+×−×+= [2.7]

For 600oC ≤ Ts < 735

oC

s

sT 

c−

+=738

13002666 [2.8]

For 735oC ≤ Ts < 900oC

731

17820545−

+=s

sT 

c [2.9]

For 900oC ≤ Ts < 1200

oC

650=sc [2.10]

Figure 2.3 Specific heat of steel as a function of temperature (EC3, 1995)

Simple calculation models take the specific heat of steel as 600 J/kgK, independent of the

temperature of the steel. For temperature greater than 1200oC, the specific heat is taken as

650 J/kgK.

8/3/2019 Temp Changes

http://slidepdf.com/reader/full/temp-changes 24/148

8

2.3 Mechanical properties of steel

2.3.1 Components of strain

Strain is the measure of elongation of an element with respect to its original length. The

change in strain with temperature is defined as:

),,(),()( t T T T  cr th σ ε σ ε ε ε  σ  ++=∆ [2.11]

where ∆ε is the change in strain;

εth is the thermal strain;

εσ is the stress-related strain;

εcr is the creep strain.

The thermal strain is the elongation of the material due to heat, and is commonly referred to as

thermal expansion as described by Rotter (1999) and is summarised in section 2.5.1. It is a

very important aspect especially in larger structures with the elements restrained by the

adjacent members.

The stress-related strain is obtained from steady state tests at certain temperatures or derived

from transient test results. More of the stress-strain relationship is discussed in the next

section.

Creep strain is not a problem at ambient condition but becomes very crucial at temperatures

above 400oC. Kirby and Preston (1988) gives the creep strain of steel with different strength

subjected to 10oC/minute heating rate tested in tension as shown in Figure 2.4.

8/3/2019 Temp Changes

http://slidepdf.com/reader/full/temp-changes 25/148

8/3/2019 Temp Changes

http://slidepdf.com/reader/full/temp-changes 26/148

10

The typical stress-strain curve for common hot-rolled steel at high temperature is given by

Harmathy (1993) and shown in Figure 2.5. It shows that the yield strength plateau becomes

less obvious with the rise of temperature and eventually disappears. The yield stress increases

at the start of heating and gradually decreases with temperature.

The Eurocode 3 suggests similar charts for the stress strain relationship with temperature for

various steel grades as adopted by the SAFIR program. Figure 2.6 shows a stress-strain chart

for grade 460 steel, not including strain hardening.

Figure 2.6 Stress strain relationship of grade 460 steel at elevated temperature (EC3, 1995)

8/3/2019 Temp Changes

http://slidepdf.com/reader/full/temp-changes 27/148

11

2.3.3 Ultimate and yield strengths

The generalised stress-strain relationship is described in the Eurocode 3 and is shown in

Figure 2.7. It is used to obtain the strength and deformation properties of steel to determine the

resistance to tension, compression, moment or shear. This holds for heating rates between

2-50oC/min.

An alternative approach for temperatures below 400oC is to extend the stress-strain

relationship by strain hardening provided that the restraints are adequate to prevent buckling.

Figure 2.7 Stress-strain relationship for steel at elevated temperature (EC3, 1995)

where f p,Τ is the proportional limit;

f y,Τ is the effective yield strength;

Ea,Τ is the slope of the linear elastic range;

εp,Τ  is the strain at the proportional limit;

εy,Τ is the yield strain;

εt,Τ is the limiting strain for yield strength;

εu,Τ is the ultimate strain.

8/3/2019 Temp Changes

http://slidepdf.com/reader/full/temp-changes 28/148

12

The Eurocode 3 assumes that at ambient temperature, the stress-strain relationship is bilinear

and the proportional limit f p, which is the end point of the linear-elastic portion of the stress-

strain curve, is equal to the yield strength, f y. It also assumes no strain hardening. The first

yield moment My can be obtained from:

My = f p Z [2.12]

where Z is the elastic section modulus.

At elevated temperature, the stress-strain relationship becomes linear elliptical. The initial

elastic portion is linear up to the proportional limit and becomes non-linear in the trend of an

ellipse up to the yield strength, f y. Thereafter it becomes a plateau. The plastic moment Mp canbe obtained from:

Mp = f y S [2.13]

where S is the plastic section modulus.

As shown by Harmathy (1993) in Figure 2.5 the decreased yield strength at elevated

temperature is not clearly defined. Various researches suggest different values and the scatter

in published results is shown in Figure 2.8. The dotted straight lines are the recommended

design values by the Institution of Structural Engineers (ISE, 1978).

The use of the 1% proof strength is recommended by Kirby and Preston (1988) as the effective

yield strength as defined and illustrated by Buchanan (2000) in Figure 2.9. It was chosen

based on Figure 2.4 that shows a runaway situation once the strain exceeds 1%. However, the

level of proof strain and the steel temperature are adjustable for particular conditions and

requirements.

The reduction factors relative to the appropriate value at ambient condition for the stress-strain

relationship of steel are defined by the Eurocode 3 as functions of temperature and are

tabulated in Table 2.1 and illustrated in Figure 2.10. Linear interpolation is acceptable for

intermediate steel temperatures.

8/3/2019 Temp Changes

http://slidepdf.com/reader/full/temp-changes 29/148

13

Figure 2.8 Scatter of yield strength and ultimate strength of hot-rolled steel (Harmathy, 1993)

Figure 2.9 Yield strength and proof strength of steel (Buchanan, 2000)

8/3/2019 Temp Changes

http://slidepdf.com/reader/full/temp-changes 30/148

14

Table 2.1 Reduction factors for stress-strain relationship of steel at elevated temperature

(EC3, 1995)

Steel

temperature Reduction factor Reduction factor Reduction fator

(relative to fy) (relative to fy) (relative to Ea)

Ts for effective yield strength for proportional limit for the slope of the

linear elastic range

ky,T = fy,T / fy kp,T = fp,T / fy kE,T = Es,T / Es

20oC 1.000 1.000 1.000

100oC 1.000 1.000 1.000

200oC 1.000 0.807 0.900

300oC 1.000 0.613 0.800

400oC 1.000 0.420 0.700

500oC 0.780 0.360 0.600

600oC 0.470 0.180 0.310

700oC 0.230 0.075 0.130

800oC 0.110 0.050 0.090

900oC 0.060 0.0375 0.0675

1000oC 0.040 0.0250 0.0450

1100oC 0.020 0.0125 0.0225

1200oC 0.000 0.0000 0.0000

Reduction factors at temperature T relative to the value of fy or Es at 20oC


Figure 2.10 Reduction factors for stress-strain relationship of steel (EC3, 1995)

8/3/2019 Temp Changes

http://slidepdf.com/reader/full/temp-changes 31/148

15

2.3.4 Modulus of elasticity

As the temperature increases, the modulus of elasticity of the steel decreases as shown below

for different types of construction. The curves labelled 1, 2 and 3 are for structural steel,

prestressing steel and reinforcing steel respectively as summarised by Harmathy (1993). It can

be seen that with an increase in temperature, structural steel tends to maintain its elasticity

more than reinforcing or prestressing steel by a considerable amount, especially at higher

temperatures.

Figure 2.11 Modulus of elasticity for 1 structural, 2 prestressing and 3 reinforcing steel (Harmathy, 1993)

8/3/2019 Temp Changes

http://slidepdf.com/reader/full/temp-changes 32/148

16

The reduction in the modulus of elasticity is crucial in buckling calculations. The Australian

Code AS 4100 and the New Zealand Standard NZS 3404 give the equation for the ratio of the

modulus of elasticity at elevated temperature to that at ambient condition as follows:

KE,T = 1.0 + T / [2000 ln (T/1100)] for 0 < T 600oC

= 690 (1-T/1000) / (T-53.5) for 600oC T 1000oC [2.14]

Figure 2.12 illustrates the ratio of the modulus of elasticity at temperatures up to 1200oC

compared with the ratio for the reduction in the yield strength.

Figure 2.12 Relative value of the MOE compared with that of the yield strength (Buchanan, 2000)

8/3/2019 Temp Changes

http://slidepdf.com/reader/full/temp-changes 33/148

17

2.4 Structural steel design

2.4.1 Steel design at ambient condition

This section is to briefly review structural design in the cold conditions where thermal effects

are not taken into consideration. Design at normal temperature ensures that the structure is

able to resist the applied loading by nominating certain sizes for the members that have

sufficient strength and stiffness. The loads applied depend on the functional requirements and

the geographical location of the building.

The functional requirements determine the dead loads, which are always present such as the

self weight of the structures and permanent fixtures, and the live loads which may vary from

time to time such as the weight of people and non-permanent goods. Depending on the

location of the building, snow load, wind load and seismic load may need to be considered.

Buchanan (2000) describes some design formats that are commonly used in construction. The

traditional working stress or allowable stress design compares the permissible safe stresses

under long term condition with the expected loading in service. Modern design considers the

ultimate strength,  which is comparing the most likely characteristic load  with thecharacteristic strength, which is the strength of the weakest likely material under short term

condition. This design is also known as the limit state design. It considers the serviceability

limit state which is associated with the structure being usable for service, and the ultimate

limit state which is only concerned about the collapse of the building.

In the ultimate strength design, a strength reduction factor Φ is used for the design capacity as

a safety factor. Steel is observed to have the same tension and compression properties and

behaves elastically up to a certain yield point and in a very ductile manner thereafter. Gorenc

et al. (1996) provides a complete steel design at ambient temperatures for different members

exposed to bending, tension or compression stresses as well as the connection design.

8/3/2019 Temp Changes

http://slidepdf.com/reader/full/temp-changes 34/148

18

2.4.2 Steel design at elevated temperature

There are a few modifications to be considered when designing structures for fire conditions

although the concepts are similar to those for the ambient condition. Most of the material

properties change with temperature, the strength is reduced upon heating and thermal

expansion may induce internal forces that lead to structural failure with various mechanisms

depending on the type of supports, connections and structural arrangements.

Instability failure also needs to be considered even though the structure still has adequate

strength. The applied loads for fire design are less due to very low probability of the event

occurring when the structure is fully loaded at its maximum capacity, therefore a smaller

safety factor is acceptable.

The actual load at a given time as a proportion of the load that would cause collapse of the

structure is often referred to as the load ratio. Most constructions have a load ratio of 0.5 or

less. Smaller load ratio means greater fire resistance as the reduction of strength of any

member will not necessarily cause collapse of the structure.

Failure mechanisms

The failure of a beam is reached when its strength is exceeded at one or more particular points

termed plastic hinges, depending on they way it is supported. Figure 2.13 is the illustration by

Buchanan (2000), showing the bending moment, deflected shape and the failure mechanism

for different end conditions.

The development of plastic hinges shows ductile behaviour as energy is dissipated at these

points. It allows the growth of deflection without sudden collapse of the structure. A simplysupported beam fails when one plastic hinge is formed at midspan, while a continuous beam

with moment resisting connections fails when three plastic hinges are developed, one at

midspan and one at each support.

8/3/2019 Temp Changes

http://slidepdf.com/reader/full/temp-changes 35/148

19

An end span beam can be thought of as a beam with continuous support at one end and simply

supported at the other end, in which case two plastic hinges are required to form a failure

mechanism, one at the continuous end and one at midspan.

8/3/2019 Temp Changes

http://slidepdf.com/reader/full/temp-changes 36/148

20

Figure 2.13 Behaviour of beams with different support conditions (Buchanan, 2000)

8/3/2019 Temp Changes

http://slidepdf.com/reader/full/temp-changes 37/148

21

Moment redistribution

Moment redistribution is one of the significant phenomena occurring in a heated continuous

beam that is very beneficial in terms of sustaining the section capacity to carry the imposed

loading. In Figure 2.14, the solid line shows the bending moment of the beam under uniformly

distributed loading at ambient condition. The M*fire line is the bending moment of the same

beam under fire conditions with reduced load as discussed earlier.

Figure 2.14 Moment redistribution at elevated temperature (Buchanan, 2000)

Rcold is the flexural strength of the section that decreases upon heating due to reduction of 

section capacity. In sections as shown in Figure 2.14, the top fibre has higher strength than the

bottom fibre. Moment redistribution allows decrease in the midspan moment and it is

compensated by the increase in the moment at the ends of the span denoted by the curve

M*fire,red. Therefore the beam would not fail at midspan due to the lack of flexural strength.

8/3/2019 Temp Changes

http://slidepdf.com/reader/full/temp-changes 38/148

22

The effect of axial restraint 

When a beam with rigid end supports is heated, the thermal expansion induces some axial load

along the beam due to the axial restraint provided by the supports. This axial restraint is found

to be very useful especially in reinforced, prestressed or composite slabs where it compensates

the loss of steel strength due to high temperature.

Figure 2.15 shows the axial force T develops in a beam that is axially restrained but is free to

rotate, which in this report is termed ‘pin-pin’ condition. The eccentricity e is the distance

from the line of action of the thermal thrust to the centroid of the compression block near the

top of the beam in reinforced concrete member, or to the centroid of the top flange in I-section

steel assuming only the top flange is in compression. This eccentricity enhances the momentcapacity as:

Rf = Mf + T.e [2.15]

where Rf is the total flexural resistance;

Mf is the moment capacity in fire;

T is the axial thrust in the beam;

e is the eccentricity.

Figure 2.15 Flexural enhancement by axial restraint (Buchanan, 2000)

8/3/2019 Temp Changes

http://slidepdf.com/reader/full/temp-changes 39/148

23

2.4.3 Design fires

Information below is the summarised description of the available design fires commonly used

in fire tests and computer modelling as laid out by Buchanan (1994, 2000). The design fire is

one of the main assumptions in the design and one of the required inputs in almost all fire

growth computer analyses. It is usually specified as a heat release rate which varies over time

for specific fuel burning in the open air. Some standard fires such as ISO fire and Eurocode

parametric fire are defined by temperature varying over time.

ISO fire

The ISO834 is the international standard of time-temperature curve, which is defined by:

oT t T  ++= )18(log345 10 [2.16]

where t is the time in minutes and To is the ambient temperature in degree Celsius.

This curve is very similar to the one from ASTM119, which is approximated by:

o

t T t eT  ++−= − 41.170]1[750 )79553.3( [2.17]

where t is the time in hours.

Figure 2.16 shows the similarity between these two curves as well as the comparison with the

Eurocode design fires (EC1, 1994) for hydrocarbon and structural members outside a burning

compartment, which are defined by Equations 2.18 and 2.19 respectively.

o

t t T eeT  +−−= −− )675.0325.01(1080 )5.2()167.0( [2.18]

o

t t T eeT  +−−= −− )8.3()32.0( 313.0687.01(660 [2.19]

where t is the time in minutes for both cases.

8/3/2019 Temp Changes

http://slidepdf.com/reader/full/temp-changes 40/148

24

Comparison of standard fire curves

0

300

600

900

1200

0 50 100 150 200

Time (minutes)

   T  e  m  p  e  r  a

   t  u  r  e   (  o   C   )

ISO 834 ASTM E119 Hydrocarbon fire External fire


Figure 2.16 Standard fire curves (Buchanan, 2000)

Eurocode parametric fireThe parametric fire curves as defined in EC1 (1994) allow different combinations of fuel load,

ventilation factor and wall lining material to be incorporated. The temperature is specified as:

)472.0204.0324.01(1325*** 197.12.0 t t t 

eeeT  −−− −−−= [2.20]

where t* is the fictitious time in hours defined by:

t* = Γ t [2.21]

with t being the time in hours and

2

2

) / )((

) / (

ref s

ref v

 I ck 

F F 

ρ =Γ  [2.22]

The opening factor Fv is given by:

t vvv  A H  AF   / = [2.23]

where Av is the area of the opening;

Hv is the height of the opening;

At is the total area of the compartment;

Fref and Iref are the reference values for opening factor and thermal inertia respectively.

The opening factor gives the amount of ventilation with respect to the size of the

compartment. This determines how hot the temperature inside the compartment can become.

8/3/2019 Temp Changes

http://slidepdf.com/reader/full/temp-changes 41/148

25

Higher opening factor results in hotter temperature but shorter burning time. Thermal inertia

indicates how fast energy is emitted or absorbed through a surface. The values of 0.04 for

typical small windows and 1160 for typical concrete insulation are adopted for F ref  and Iref  

respectively in the Eurocode standard. For a special case for Γ = 1, i.e. when Fv = Fref  and

sck ρ  = Iref , the Eurocode curve (Equation 2.20) is a very good approximation to the standard

ISO 834 fire up to 1300oC.

The duration of the burning period is governed by the amount of fuel available in the

compartment and is defined in the Eurocode as:

td = 0.00013 et / Fv [2.24]

= 0.00013 E / (Av v H  ) [2.25]

where et is the fuel load per total surface area (MJ/m2);

E is the total energy content in the fuel (MJ).

The reference decay rate from the Eurocode parametric fire suggests that for a burning period

up to 30 minutes, the decay rate be taken as 625oC per hour. Longer burning time results in

proportionally slower decay up to 120 minutes with 250oC per hour rate and stays constant

thereafter as illustrated in Figure 2.17.

Eurocode reference decay rate

0

200

400

600

800

0 30 60 90 120 150

Duration of the burning period (minutes)

   D  e

  c  a  y  r  a   t  e   (  o   C   /   h  o  u  r   )


Figure 2.17 Eurocode reference decay rate (EC1, 1994)

8/3/2019 Temp Changes

http://slidepdf.com/reader/full/temp-changes 42/148

26

T-squared fire

A common way of expressing the rate of heat release during the growth period is by defining

it as proportional to the time squared up to a certain peak, which depends on the available fuel

and ventilation. It then either levels off to indicate constant burning or starts to decay. The

decay period is only important when assessing the structural stability. When life safety is the

only priority, this phase is normally ignored.

Buchanan (2000) described this parabolic curve as a burning object with constant heat release

rate such that the fire is spreading in a circular pattern with a constant radial flame spread. The

heat release rate for t-squared fire is defined by:

2

) / ( k t Q = [2.26]

where Q is the heat release rate (MW);

t is the time (s);

k is the growth constant (s  MW  ).

Heat release rate for t-squared fire

0

50

100

150

200

0 10 20 30 40 50 60

Time (mins)

   H   R   R

   (   M

slow medium fast ultra-fast


Figure 2.18 Heat release rate for t-squared fire

The value of the growth constant, k is 600, 300, 150 and 75 for slow, medium, fast and ultra-

fast fire growth respectively. This value represents the time required for the fire to grow to 1

Megawatt. Typical wooden furniture falls into the medium category and light wooden material

such as plywood is considered fast. An ultra-fast fire is usually found in upholstered furniture

with plastic foam.

8/3/2019 Temp Changes

http://slidepdf.com/reader/full/temp-changes 43/148

27

2.5 Behaviour of redundant structures in fire

This section is a summary of the findings from the investigation by Rotter et al. (1999) on the

performance of redundant structures subjected to local fires. Similar results based on a

research by Rotter and Usmani (2000) also describe some phenomena that occur in the

structures under thermal effects.

The majority of theories and rules of the structural strength under fire assume an isolated

structure, which is not affected by conditions of the surrounding elements. However, real

structures consist of a large number of members and are usually highly redundant.

Redundancies in the structure offer several alternative load paths, which allow redistribution

of loads to relatively stiffer parts. Such interactions within complex structures in fires providea reserve member capacity and the structures may survive the fire with no severe damage.

On the other hand, disproportionate collapse as described by Buchanan (2000) is the opposite

situation where one element failure causes a major collapse of the structure. To avoid such

failure, the design should incorporate redundant load paths and provision of some structural

toughness.

2.5.1 Thermal expansion

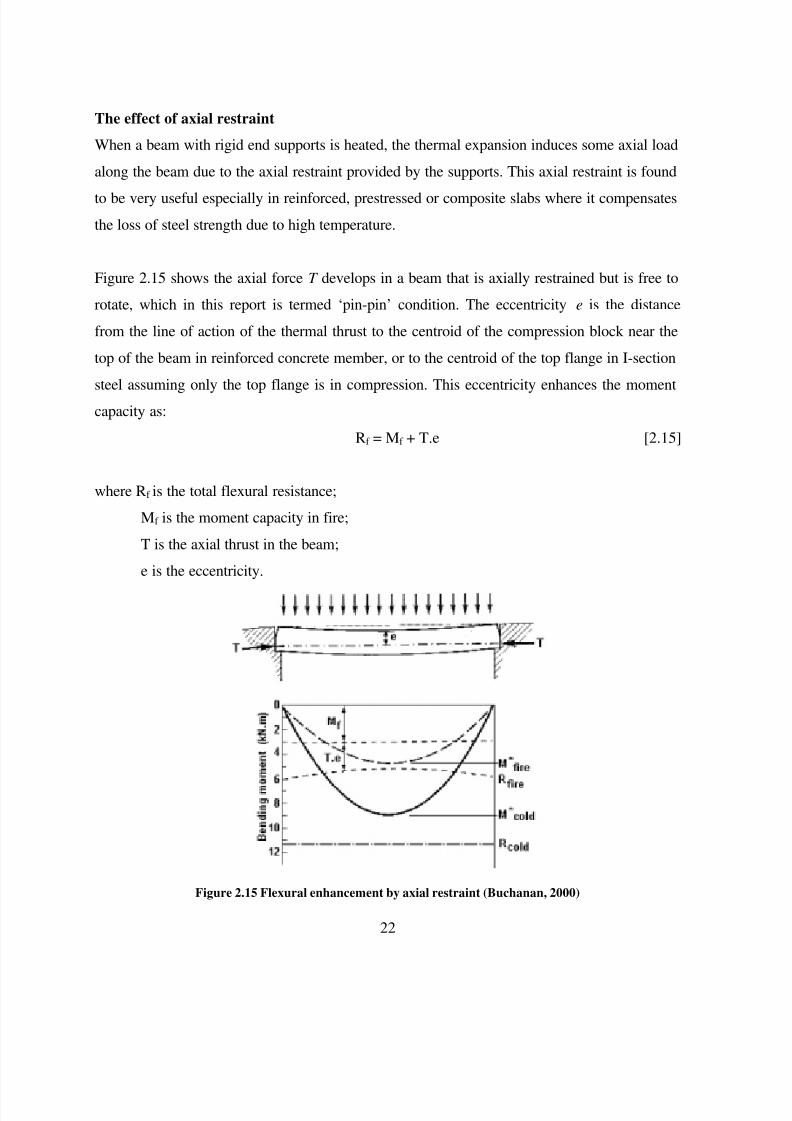
Thermal expansion is a very important phenomenon that occurs in heated elements. Beams

and slabs are structural members that are designed to carry loads by bending and shear. For

slabs and beams which are fully or partially restrained axially, the expansion due to heating

can cause high axial force on the surrounding structures. This force can either be an advantage

or disadvantage for the structural performance.

Rotter et al. (1999) showed the temperature rise required for a fully restrained beam to yield

(∆Ty) could be calculated by the equation:

α 

σ 

 E Ty

 y=∆ [2.27]

8/3/2019 Temp Changes

http://slidepdf.com/reader/full/temp-changes 44/148

28

where σy is the yield strength of the steel, E is the elastic modulus and α is the thermal

expansion coefficient. This indicates that temperature rise of only 102oC and 142

oC are all that

is required to yield 250 and 350 grade steel respectively, ignoring any material degradation.

This low temperature proves that high stress is most likely developed in real fires even though

the axial restraint is only partial.

In fire conditions, the total strain of redundant structures is the sum of the thermal and

mechanical strains. The mechanical strain governs the elastic or plastic stress in the structure

while the total strain governs the deformed shape. When the beam is unrestrained and there is

no external loading, the total strain is equal to the thermal strain which governs the deflection.

By contrast, for a fully restrained beam with no external load, the thermal and mechanicalstrains cancel out and the thermal stress and plastification are due to the mechanical strain.

In most real cases, there is a complex interaction of thermal expansion, restraint, and the

applied loading. Extensive plastification results from combined mechanical strains, which far

exceed the yield values. Extensive plastic straining occurs on highly restrained beams even

though the deflection may be quite small as it depends only on the total strains. Where less

restraint exists, larger deflection may develop but the plastic straining will not be too severe

and hence reserve the stiffness properties of the material.

8/3/2019 Temp Changes

http://slidepdf.com/reader/full/temp-changes 45/148

29

2.5.2 Thermal buckling

When a structural member, particularly a column, is subjected to an increasing axial load, it

will reach a point where the member is no longer able to resist the applied load and fails

instantly. This phenomenon is known as member buckling or column buckling.

The compressive stress developed in the heated, elastic, axially restrained beam may reach the

critical buckling load which is defined by the Euler formula as:

22

2

2

)(l

r  EA

l

 EI Pcr  π 

π == [2.28]

where E is the elastic modulus which changes with temperature, r is the radius of gyration and

l is the effective length of the beam which depends on the restraint conditions. The critical

temperature to cause buckling for slenderness of common slabs and beams can be as low as

100 or 200oC, which is very easily reached in real fires.

The axial force in a restrained heated beam is given by:

P = E.A.α.L.∆T [2.29]

where L is the length of the beam. Buckling will occur when P is greater than Pcr.

Therefore the temperature rise to cause buckling in an axially restrained beam could be

obtained as follows:

 L

lr T cr 

α 

π  22 ) / (=∆ [2.30]

However, it is practically impossible to have a perfectly rigid supports, therefore a beam can

only have partial restraint which can be modelled by a linear translational spring of certain

stiffness. The critical buckling temperature increment assuming no change in the elasticmodulus E can be expressed as:

)1()( 22

kL

 EA

l

r T cr 

+=∆α 

π [2.31]

8/3/2019 Temp Changes

http://slidepdf.com/reader/full/temp-changes 46/148

30

where k  is the relative stiffness of the spring and L is the length of the beam. Rotter et al.

(1999) suggested that buckling and post-buckling phenomena can be observed in beams at

moderate fire temperature about 300oC, which is very typical in real fires, moreover as the

axial stiffness of the member L

 EA is reduced due to reduction in the elastic modulus E .

As described by Rotter et al. (1999), the axial force induced in the beam under fire condition is

merely due to the thermal expansion. Upon buckling, the deflection of the beam increases

rapidly and axial shortening is observed through member curvature. There is little alteration in

the axial force at post-buckling zone as the greater deflection absorbs the thermal expansion.

In this case, buckling can be beneficial for the structure as the limitation in the axial force

reduces damage in the adjacent members.

Buckling can also be localised at certain area in a structural member. When a fully fixed beam

is subjected to elevated temperature, there will be three plastic hinges form, one at the

midspan and one at each end. High compressive stress will be induced at the bottom flange of 

the ends of the span and the top flange of the midspan, causing these areas to buckle due to

bending, known as local buckling. This was observed in the Cardington test, as explained by

the British Steel (1999), at the connections between the beams and columns.

8/3/2019 Temp Changes

http://slidepdf.com/reader/full/temp-changes 47/148

31

2.5.3 Thermal bowing

Most simple design calculations for fire condition assume the temperature in the members is

uniform, which may roughly be the case for small members of unprotected steel. However,

more complicated members, depending on the section shape and the material properties may

have temperatures that are far from uniform. For constructions with high thermal insulation,

such as concrete slabs or walls, the temperature of the fire exposed side can be very different

from that of the cool unexposed side causing high thermal gradient across the section. The

hotter surface will expand much more than the cooler one and induce bending in the member,

which is known as thermal bowing.

Figure 2.19 shows a beam that is translationally and rotationally fixed at both ends, subjected

to temperature rise and uniform thermal gradient. The internal stresses along the cross section

of the beam are also shown. The axial restraint causes a uniform compressive stress and the

thermal gradient causes a uniform moment.

Figure 2.19 Fixed ended beam subjected to thermal expansion and bowing (Rotter and Usmani, 2000)

It can be seen that the bottom of the beam is subjected to very high compressive stress while

the top fibre is in either tension or compression. This phenomena were found in the

Cardington test (refer to section 2.7.2) where local buckling occurred in the lower flange at the

ends of the beam as a result of large flexural rotation.

8/3/2019 Temp Changes

http://slidepdf.com/reader/full/temp-changes 48/148

32

2.6 Fire resistance

Fire resistance is a measure of the ability of a building element to resist a fire. It is usually

obtained from standard fire tests as being the time it can maintain certain criteria as discussed

in the next section. The fire resistance of an element depends on several factors such as the fire

severity, geometry, support condition and the material of the element. Full scale tests are

required in many countries to establish the appropriate fire resistance, as smaller tests may not

be able to assess potential problems due to deflections, shrinkage, connections or cracks.

Figure 2.20 Fire resistance furnace at New Zealand Building Research Association (Buchanan, 1994)

8/3/2019 Temp Changes

http://slidepdf.com/reader/full/temp-changes 49/148

33

However, full scale tests are very expensive and therefore only considered when necessary.

This leads to the development of new calculation methods and computer programs to predict

the behaviour of large structures based on the results of full scale fire tests.

There are a few standards that are commonly used for fire resistance tests. ISO 834 (ISO

1975) is used by many countries and some national standards are based on this. Similar

standards are used by most European countries, while the British use the BS 476 standard (BSI

1987). The United States use ASTM E119 (ASTM 1988a) which was first published in 1918,

while the Canadian standard (ULC 1989) is based on this.

2.6.1 Failure criteria

Building elements that are assigned a fire resistance rating should meet the corresponding

failure criteria as follow:

Stability

The stability of an element is the ability to carry the applied load for the duration of the test

without collapse. Limited deflection or rate of deflection can be assigned to prevent the actual

failure that would damage the furnace.

Integrity

Integrity indicates the ability of the structure to contain the fire, smoke and hot gasses. The

specimen tested must not develop cracks or fissures that would allow penetration of fire

products.

InsulationAn insulation criterion ensures that the temperature on the cold side of the specimen is not too

hot to start ignition. An average increase of 140oC and maximum increase of 180

oC at a single

point are usually adopted as conservative measures.

8/3/2019 Temp Changes

http://slidepdf.com/reader/full/temp-changes 50/148

34

2.6.2 Fire resistance rating

Based on the furnace test or some other approval systems, a building element is granted a fire

resistance rating to indicate its resistance level. The fire resistance rating is usually expressed

in terms of stability/integration/insulation. A typical load bearing wall with 60/60/60 rating

means that it is expected to have one hour rating for each criterion. A non-load bearing glazed

panel may have -/30/- rating, which means it only has 30 minutes rating for integration.

While full scale tests tend to be very expensive and are infeasible in some cases, expert

opinions on whether an assembly will pass a certain test based on observation of similar

successful tests have become more common in listing the fire resistance ratings. The ratings

obtained from the tests, expert opinions or calculations are listed in various documents in three

main categories as laid out by Buchanan (2000) as follow:

Generic ratings

This category mostly applies to typical material regardless of the manufacturers or detailed

specifications. It is very conservative and can be used anywhere, but it has some limitations as

it only assumes exposure to the standard fire and it does not take into account the material

quality and the arrangement of the structure. An example of this rating is that a certain

thickness of concrete is required to protect a steel element, regardless of the quality of the

concrete and whether or not reinforcement is present.

Proprietary ratings

Proprietary ratings depend on particular manufacturers of proprietary products. Accompanied

by an approved specification on the material and construction methods, it usually approves the

assembly rather than the material. It is also based on the standard fire exposure and the level of 

loads is not considered, but it is more accurate than the generic listings as it sometimes include

reference to the size and shape of the members.

8/3/2019 Temp Changes

http://slidepdf.com/reader/full/temp-changes 51/148

35

Calculation methods

Calculation methods have become more common in predicting the structural behaviour as it is

much more feasible especially when different fire scenarios are considered. These methods

should be based on full scale tests or similar assemblies to maintain accuracy. Descriptions on

many of these methods are provided by Buchanan (2000).

8/3/2019 Temp Changes

http://slidepdf.com/reader/full/temp-changes 52/148

36

2.6.3 Methods of protection

Steel is vulnerable in fire. Complex structures may survive fires due to redistribution of load to

surrounding cooler parts, but local failure can also be disastrous to the whole structure.

Buchanan (2000) describes how protected steel has considerably lower temperature and

slower heating rate than unprotected steel, even though it takes a longer time for protected

steel to cool down.

Figure 2.21 Protected and unprotected steel temperatures exposed to a parametric fire (Buchanan, 2000)

The top curve in Figure 2.21 is the parametric fire temperature, followed closely by the

temperature of the unprotected steel. The bottom two curves show the temperatures of steel

protected with 15 and 50 mm thick insulating material.

Several passive protections have been widely used to protect steel elements and avoid rapid

increase in the steel temperature. Some of these methods are outlined below.

8/3/2019 Temp Changes

http://slidepdf.com/reader/full/temp-changes 53/148

37

Board system

The board protection system is commonly used as the wall lining material in light steel

framing constructions as shown in Figure 2.22. Most boards are made of calcium silicate or

gypsum plaster.

Figure 2.22 Light steel frame wall system (Buchanan, 2000)

Calcium silicate is only produced in a few countries and therefore is more expensive in some

places. As inert material, the board is designed to remain in place with no damage throughout

heating. As for the gypsum board, its performance is enhanced by water of crystallisation,which is driven off during heating. This dehydration process gives time delay at about 100oC

but the strength of the board after exposure is very significantly reduced as it turns into

powdery form held together by the reinforcing fibre glass and other additives.

The board system is mostly used for clearly visible structures such as columns for aesthetic

reasons. Proprietary information on wallboard is available from the manufacturer and there is

a range of different thicknesses to suit particular applications.

8/3/2019 Temp Changes

http://slidepdf.com/reader/full/temp-changes 54/148

38

Spray-on system

A spray-on system is normally the cheapest protection of steel members. It is made of cement-

based material held together with some kind of glass or cellulosic fibrous reinforcing. Spray-

on protection is usually applied to beams or other steel members that are not very visible as it

is not suitable for decorative purposes.

Other disadvantages of this system are that the process is messy and the soft product may

require protection if placed in vulnerable locations. The ‘stickability’ of the material to remain

in place during fire exposure has to be approved.

Intumescent paintThis special material looks like a normal paint but it swells up into a thick charry mass upon

heating. Even though it is more expensive than board and spray-on system, it does not take

much space and can be applied quickly.

Many layers of coating can be applied to obtain the required thickness. Intumescent paint is

often used on door frames and the inside of fitting penetrations to provide fire and smoke

barrier in the event of fire.

Concrete encasement

The traditional method of steel protection is the poured concrete encasement as shown in

Figure 2.23. This system provides excellent protection against corrosion. Some reinforcing

steel can be provided in the concrete to hold it in place during fire and it can also be specially

designed for composite action of the three materials.

This construction is bulky, expensive and also time consuming. It is a common system used in

Japan but not widely used elsewhere.

8/3/2019 Temp Changes

http://slidepdf.com/reader/full/temp-changes 55/148

39

Figure 2.23 Concrete encasement for steelwork protection (Buchanan, 2000)

Concrete filling

In contrast with the concrete encasement method, this system protects hollow steel sections by

filling concrete in the inside as illustrated in Figure 2.24. The concrete can reduce the steel

temperature due to its high heat sink, and/or act as part of the structure by carrying some of the

load when the steel is heated.

Figure 2.24 Concrete filled hollow steel section (Buchanan, 2000)

8/3/2019 Temp Changes

http://slidepdf.com/reader/full/temp-changes 56/148

40

This type of protection avoids the bulky exterior concrete and the steel can provide excellent

confinement to the concrete during ambient conditions or under seismic loading. Vent holes

are essential to prevent the steel from exploding due to excessive steam pressure from the

concrete upon heating.

I-section members can be protected this way by placing concrete between the flanges as

shown in Figure 2.25 with reinforcing steel to hold the concrete in place.

Figure 2.25 Concrete filling between the flanges of I-section (Buchanan, 2000)

Water filling

This method is expensive and only used for special structures. The hollow steel section is

filled with water to effectively prevent rapid heating. A plumbing system is required as well as

additives in the water to prevent freezing at ambient conditions and corrosion of the steel. It is

necessary to ensure that there is no excessive pressure when the water is heated.

8/3/2019 Temp Changes

http://slidepdf.com/reader/full/temp-changes 57/148

41

2.7 Fire tests

2.7.1 General

A publication by the British Steel (1999) introduces steel framed buildings research projects in

general as summarised below. Many European countries have undertaken a number of fire

resistance tests on steel members. The findings have led to development of new composite

floor system and advance in fabrication technology of fire protecting steel frames which

reduce the cost significantly.

The British Steel program tried to find the true inherent fire resistance in the steel framed

building in order to fully utilise the structural contribution in severe fires. A number of testswith natural fires and realistic environments have been developed to replace the gas fired

furnace of a single floor beam as investigations following real fires and analytical models have

proven that complete structures perform better in fire than single elements as expected.

With various locations of fire within the structure, different structural restraint and load levels

can also be investigated. The common commercial constructions have been tested instead of 

the idealised conditions to consider the realistic scenarios in both loading and compartment

design and layout.

In Australia, the biggest steel maker BHP has also been carrying out research on steel framed

buildings for several years. A set of four tests was conducted regarding the 41-storey building

on William Street in Melbourne. The tests concluded that there is no protection required to the

steel beams or the soffit of the composite slab and the existing light hazard sprinkler system

was adequate to provide the required 120 minutes fire resistance (British steel, 1999).

Another example of the fire tests undertaken by BHP is one on Collins Street (British steel,

1999). The objective was to collect data from combustion of furniture in a typical office. The

tests showed that the non-fire-rated suspended ceiling was beneficial as it provided an

effective fire barrier to protect the steel beams, as most of it remained in place during the fire.

8/3/2019 Temp Changes

http://slidepdf.com/reader/full/temp-changes 58/148

42

The use of unprotected steel was justified as the temperature of the beams and the external

columns were sufficiently low.

2.7.2 Cardington fire test

The Cardington test was undertaken by the Building Research Establishment at the Cardington

laboratory at Bedfordshire, UK. Six major tests were carried out between January 1995 and

July 1996 including restrained beam, plane frame, corners, and large compartments. Most of 

the information on this section was obtained from British Steel (1999) and a paper by Rotter et

al. (1999) on the Cardington test and the results.

The Cardington test was a full scale fire test on a realistic 8-storey steel framed building as

shown in Figure 2.26. It was designed to model the typical modern office in a city centre

according to the British Standard, BS 5950 and the Eurocodes, EC3 and EC4. The building

had a concrete slab supported on composite steel-concrete beams and steel columns (Sanad et

al., 1999).

The primary objective was to obtain data that can aid the understanding of the interactions

between different structural mechanisms, which leads to determination of the overall

behaviour of composite steel frames in fire. The test was also intended to demonstrate the

large scale structure behaviour in fire based on UK building regulations which required such

building to have 90 minutes fire resistance.

With this knowledge, it is possible to design steel framed buildings in a more rational design

methodology with known inherent degree of fire resistance. If the resistance is not enough to

withstand the fire risk, additional means of protection or other active measures such assprinkler systems should be incorporated in the design.

8/3/2019 Temp Changes

http://slidepdf.com/reader/full/temp-changes 59/148

43

Figure 2.26 General view of the structural frame at the Cardington test (British Steel, 1999)

The restrained beam test was carried out using a 305UB40 heated over the middle eight metres

out of its nine metre length in order to keep the connection as close to ambient temperature as

possible. With 3-10oC / minute heating rate, the beam was heated on its three sides up to 800-

900oC through the section profile. It was noticed that runaway deflection did not occur even

though the steel strength had reduced to less than 10% of its yield strength at ambient

conditions.

Local buckling occurred at both ends of the beam. The lower flange was distorted as it

expanded against the column web. Thermal contraction during cooling generated very high

tensile forces, which caused fracture at the end-plate connection at both ends. This fracture

8/3/2019 Temp Changes

http://slidepdf.com/reader/full/temp-changes 60/148

44

occurred over a period of time rather than instantaneously. The other side of the plate retained

its integrity and was able to provide shear capacity to the beam.

An important observation from the Cardington tests was that redistribution of load clearly

exists, as it was the reason why composite steel frames have higher fire resistance than

individual members even though the floor beam was unprotected. Interactions with the cool

surrounding structures are extremely beneficial to the heated members. The maximum steel

temperature at the Cardington test exceeded 1100oC and no sign of structural collapse was

observed.

A large displacement numerical model was developed in a project funded by the Departmentof the Environment, Transport, and Regions (DETR) in UK through the PIT scheme, led by

the University of Edinburgh in collaboration with the British Steel, Imperial college, SCI and

BRE (Rotter et al., 1999). The overall objective was to develop analytical tools to adequately

model the structural behaviour of composite steel frames in fire.

The redistribution of load was observed using this model based on the data from the

Cardington test that was used to validate this model. The computer program SAFIR is a

similar modelling tool, which will be discussed further in chapter 3.

As explained by Sanad et al. (1999), the accuracy of the analytical models can be measured by

comparing the analysis results with those obtained from the tests. However, there are some

parameters from the numerical tool that can not be measured in a fire test. If this information

is inseparable from those that are comparable and agree with the test results, the overall

behaviour is most likely to be reasonably accurate.

8/3/2019 Temp Changes

http://slidepdf.com/reader/full/temp-changes 61/148

45

3. SAFIR program

3.1 General

There are several computer packages available to model structural behaviour in fires. Thissection gives an overall description of SAFIR, the new program used for the analyses in this

project. The information was extracted from the SAFIR98 user manual (Franssen et al., 2000)

and the material from the SAFIR seminar given by Franssen at University of Canterbury

(Franssen, 2000). More details of the thermal and structural analysis procedures regarding this

research are discussed later in chapter 4.

SAFIR98 is a special purpose computer program for structural analysis under ambient and

elevated temperature conditions. It was developed by Jean-Marc Franssen at University of 

Liege, Belgium, as the second generation of the structural fire codes after CEFICOSS program

(Computer Engineering of the Fire design of Composite and Steel Structures), which was also

developed in Liege.

Based on the Finite Element Method, SAFIR is able to model the temperature and structural

behaviour of one, two, and three dimensional structures under user defined fires through

discretisation of the structure, solution, and time. The built-in fire curves in the program are

ISO 834, ASTME119 or ULC S-101. SAFIR is capable of modelling beam, shell,

and truss elements. The stress-strain behaviour is incorporated in the element idealisations,

calculation procedures, and various material models. A linear-elliptic relationship is generally

adopted for steel stress-strain material laws while a non-linear relationship is adopted for

concrete.

The analysis, as described by Nwosu et al. (1999) consists of setting up the following matrixequation to solve a large number of simultaneous equations to provide the correct solution.

{ F } = [ K ] { U }

where F is the generalised loads or forces in the structure, K is the stiffness matrix and U is the

generalised displacement of the structure.

8/3/2019 Temp Changes

http://slidepdf.com/reader/full/temp-changes 62/148

46

3.2 Analysis procedure

There are two major steps in analysing structures at elevated temperature using the SAFIR

program, the thermal analysis and the structural or mechanical analysis. The input files for the

earlier version SAFIR98a consist of *.DAT and *.STR files for both analyses. These are

ASCII files which are either created using a text editor or automatically generated by SAFIR

wizard for the thermal analysis as explained in the next section.

The input data file with a *.DAT extension contains the calculation strategy, applied loads, the

*.STR file name, and the time discretisation. Information contained in the *.STR file includes

the structural parameters such as the node coordinates, the type of finite elements used and the

material properties.

For the structural analysis, the *.STR file also specifies the name of the *.TEM file which is

created during the thermal analysis for a particular cross section and applied fire. Changing

this *.TEM file name allows the user to analyse the same structural elements with various

cross section properties and different heating. Figure 3.1 shows the schematic representation

of the steps and files incorporated in the analysis of a frame consisting of beams and columns.

Figure 3.1 Steps and files of the analyses (Franssen et al, 2000)

8/3/2019 Temp Changes

http://slidepdf.com/reader/full/temp-changes 63/148

47

The newer version SAFIR 2001 only requires one input .IN file. This version has currently

been released with shell element analysis and some new features for an improved concrete

model to allow for the opening and closing of cracks in concrete. Five user defined thermal

materials are also included in the program.

As there are no apparent advantages of SAFIR 2001 on steel analysis over SAFIR98a, the

older version is used in this research. The results of both thermal and structural analyses can

be viewed graphically using the DIAMOND 2000 post-processor written by Franssen.

3.2.1 Thermal analysis

In the thermal analysis, a cross section specified by the user is subjected to fire and the

temperature development across the section is recorded at each time step. It requires the

section to be discretised into a finite element mesh where the temperature is calculated at each

node. A fine mesh is suitable for materials with a fast heating rate or high thermal gradient,

while a coarser mesh can be used for materials with a slower heating rate. Different materials

with temperature dependant properties can be assigned to different elements allowing a

combination of materials in a section such as in reinforced concrete or other composite

sections.

The input files can be manually written or automatically generated by a pre-processor. The

SAFIR pre-processor Wizard98 by Franssen is a user interface program to define the cross

section material properties and discretisation, the applied fires and protections for the thermal

analysis. However, Wizard98a is limited to model only I-sections, either HE, IPE, American

or a user defined sections. The pre-processor v0.9 by Mason (2000) is also able to create the

required input files, and this pre-processor also allows other profiles apart from I-section to bemodelled.

The output files for the thermal analysis are *.OUT, *.LOG, and either *.TEM or *.TND. The

*.OUT file contains the inputs and the temperature history at each node for each time print

8/3/2019 Temp Changes

http://slidepdf.com/reader/full/temp-changes 64/148

48

defined. It is also a good place to look at when encountering problems in the analysis as it

describes what is missing in the input files or what has caused the termination of the analysis.

The *.TEM file records the temperature of the elements averaged from the surrounding nodes

at each time step which is used as the input in the structural analysis.

The *.LOG file for the thermal analysis does not contain anything and therefore is not of any

use in the analysis. The post-processor Diamond 2000 is able to show the graphical

representation of the output *.OUT file. An example of the thermal analysis result is shown

below.

Figure 3.2 Diamond 2000 output for the thermal analysis

8/3/2019 Temp Changes

http://slidepdf.com/reader/full/temp-changes 65/148

49

3.2.2 Structural analysis

After the temperature along the cross section has been defined, the whole structure can be

analysed based on the temperature history recorded in the *.TEM file. The structure is

discretised into beam, truss or solid elements based on plastic analysis theory. For each time

step, the program finds equilibrium between the internal forces and external load by an

iterative process by evaluating the stiffness matrix and solving the equations based on the

Newton-Raphson method.

Each iteration establishes the displacement at each node, bending moment and axial force at

each integration point and all stresses, strains and tangent modulus of each fibre at each

integration point. The integration point is described later in section 4.3.1. The program

terminates if the convergence criteria is not fulfilled as discussed in section 3.7.

The structural analysis also requires the input *.DAT and *.STR files which have to be created

by the user. Similar to the thermal analysis, two output files, *.OUT and *.LOG are produced

from the structural analysis. The *.OUT file contains all the output information including

deflection at each node along the structure, bending moment and axial force. The fibre stresses

at each longitudinal integration point can be recorded in this *.OUT file if required by the

user. The *. LOG file stores the duration of the runs and the loads. It has no significant role in

the analysis.

Illustrated below is an example of DIAMOND 2000 representation of the output from the

structural analysis, showing the bending moment distribution along the beam with fix-fix end

conditions.

8/3/2019 Temp Changes

http://slidepdf.com/reader/full/temp-changes 66/148

50

Figure 3.3 Diamond 2000 output for the structural analysis

For beam elements as is used in this research, there are several assumptions incorporated in

the analysis as set out by Kodur et al. (1999) as follows:

1. A plane section remains plane under bending.

2. As per Bernoulli hypothesis, shear energy is not considered.

3. The plastic strain is not affected by an increase in temperature.

4. Residual stresses are considered by means of initial and constant strains.

5. The non-linear part of the strain is averaged on the length of the elements to avoid locking.

6. In case of strain unloading, material behaviour is elastic with the modulus of elasticity

equal to Young’s modulus at the origin of the stress-strain curve.

7. Non uniform torsion is taken into account.8. Plastification is only considered in the longitudinal direction of the member.

8/3/2019 Temp Changes

http://slidepdf.com/reader/full/temp-changes 67/148

51

3.3 Capabilities of SAFIR

Concerning the thermal analysis, SAFIR is capable of analysing both two and three-

dimensional structures. Plane sections are discretised by triangular and quadrilateral elements

which virtually represent all cross sectional shapes. Three dimensional structures are

discretised by prismatic and non-prismatic solid elements, which virtually represent all

structural shapes.

Analyses of elements with different materials are possible as well as those with different fire

temperatures and cooling down phases. Variations of material properties with temperature,

including moisture evaporation are incorporated. Thermal performance of steel, reinforced

concrete, and composite steel-concrete sections can be analysed, as well as other materialswith known physical properties at elevated temperatures.

In the structural analysis, SAFIR is also able to analyse plane sections, two and three-

dimensional structures, and also prestressed members. Structures are discretised by truss,

beam, solid, or shell elements where large displacements can be incorporated in the truss,

beam, and shell elements. The effects of thermal strains and thermal restraint are taken into

account as well as material properties that are non-linearly temperature dependent. Unloading

of material is parallel to the elastic loading branch. Local failure of a member does not lead to

overall structural failure, which is handled by an arc length technique. This technique is only

applied on large structures to prevent the whole program from crashing due to a small element

failure.

Nodal coordinates are introduced in either the Cartesian or cylindrical system. Imposed

degrees of freedom can be introduced thus allowing external supports to be inclined at an

angle to the global axes. Residual stresses and initial strains can also be accounted for.

8/3/2019 Temp Changes

http://slidepdf.com/reader/full/temp-changes 68/148

52

3.4 Common features in all analyses

For all SAFIR analyses, there are some common computational features involved as follows:

1. Internal re-numbering of the system equations, which is transparent to users, can be

performed by the program in order to optimise the matrix bandwidth to reduce the

computer storage and calculation time.

2. Imposing the same temperature or displacement at two different nodes can be done using

master-slave relations.

3. Thermal and mechanical properties of steel and concrete according to Eurocode 2, 3, and 4

are embedded in the code and can be used directly.

4. Graphic pre-processing capabilities can be handled by the SAFIR wizard98 or the pre-

processor v0.9, and the post-processing by DIAMOND 2000.

3.5 Sign conventions

The global and local axes defining a structure use the Cartesian coordinate system. Deflection

and applied loads are positive in the direction of the positive Cartesian coordinates. Positive

deflection indicates that the beam is hogging while negative deflection indicates that the beam

is sagging. The moment and rotation are positive in the counter-clockwise direction, while the

stresses and the axial force, which is the sum of all stresses, are positive in tension.

3.6 Material properties

Various material properties are incorporated in the SAFIR program for different analyses. For

simulations under ambient temperatures only, the valid materials may have elastic, bilinear or

Ramberg-Osgood properties. For elevated temperatures, Eurocode steel materials are provided

for structural steel, reinforcing and prestressing steel. The Eurocode and Schneider’s models

are used for calcareous and siliceous concrete. Valid materials such as Insulation, C Gypsum,

and X Gypsum can be used for non-load bearing structures.

The stress-strain relations of steel and concrete are non-linear and temperature dependent.

Materials in heated structures are subjected to initial strains (εi), thermal effects (εth) and stress

8/3/2019 Temp Changes

http://slidepdf.com/reader/full/temp-changes 69/148

53

related effects (εσ). The stresses are the difference between the total strain (εtotal), which are

obtained from the nodal displacements, and the initial and thermal strains.

3.7 Convergence criteria

To obtain the correct solution, SAFIR uses an iterative procedure of convergence at each time

increment. Solutions are obtained at each integration point along the discretised elements

which are also specified by the user. The precision specified in the data file, which is a small

value dependent on the type of the structure analysed, must be reached in order to fulfil the

convergence requirement.

When the program fails to converge to a solution due to physical or numerical instability, the

time increment will be halved and the process repeated. The program is terminated if 

convergence is not reached after the time increment reaches a certain value or when the final

run time is reached, both defined by the user, whichever occurs first. The program cannot be

terminated by specifying a limiting deflection criterion.

8/3/2019 Temp Changes

http://slidepdf.com/reader/full/temp-changes 70/148

54

4. Methods of Analysis

4.1 The steel beam

The analyses are based on investigations of a single span steel beam supported at both ends.The beam is part of a structural steel frame building similar to that of the Telecom building in

Auckland, and was chosen because it has similar properties to the one used in the Cardington

steel frame tests (Clifton, 1999).

Figure 4.1 Floor plan of the Telecom Building in Auckland (Clifton, 1999)

A span of 8m instead of 8.2m was chosen for simplicity. It is a universal I-beam, 610UB101

with the dimensions and properties laid out in Table 4.1 (BHP catalogue). At ambient

conditions, the yield strength and the elastic modulus of the steel are 430 MPa and 210 GPa

respectively, with a Poisson’s ratio, νs of 0.3.

This high strength steel may not represent most real steel structures. However, for the purpose

of this report, which is to investigate the beam behaviour at elevated temperatures, stronger

steel will provide longer exposure time before approaching failure, thus allowing better

observation on the sequence of events that are happening in the beam.

8/3/2019 Temp Changes

http://slidepdf.com/reader/full/temp-changes 71/148

55

Table 4.1 The steel beam profiles for the analyses (BHP catalogue)

Type 610UB101

Weight, W 101 kg/m

Depth, D 602 mm

Flange width, bf  228 mm

Flange thickness, tf  14.8 mm

Web thickness, tw 10.6 mm

Root radius, R 14.0 mm

Depth between flanges, d1 572 mm

Gross cross sectional area, Ag 13000 mm2 

Second moment of area, Ixx 761 x 106

mm4


Plastic section modulus, S 2900 x 103

mm3 

8/3/2019 Temp Changes

http://slidepdf.com/reader/full/temp-changes 72/148

56

4.2 Thermal analysis

4.2.1 Discretisation

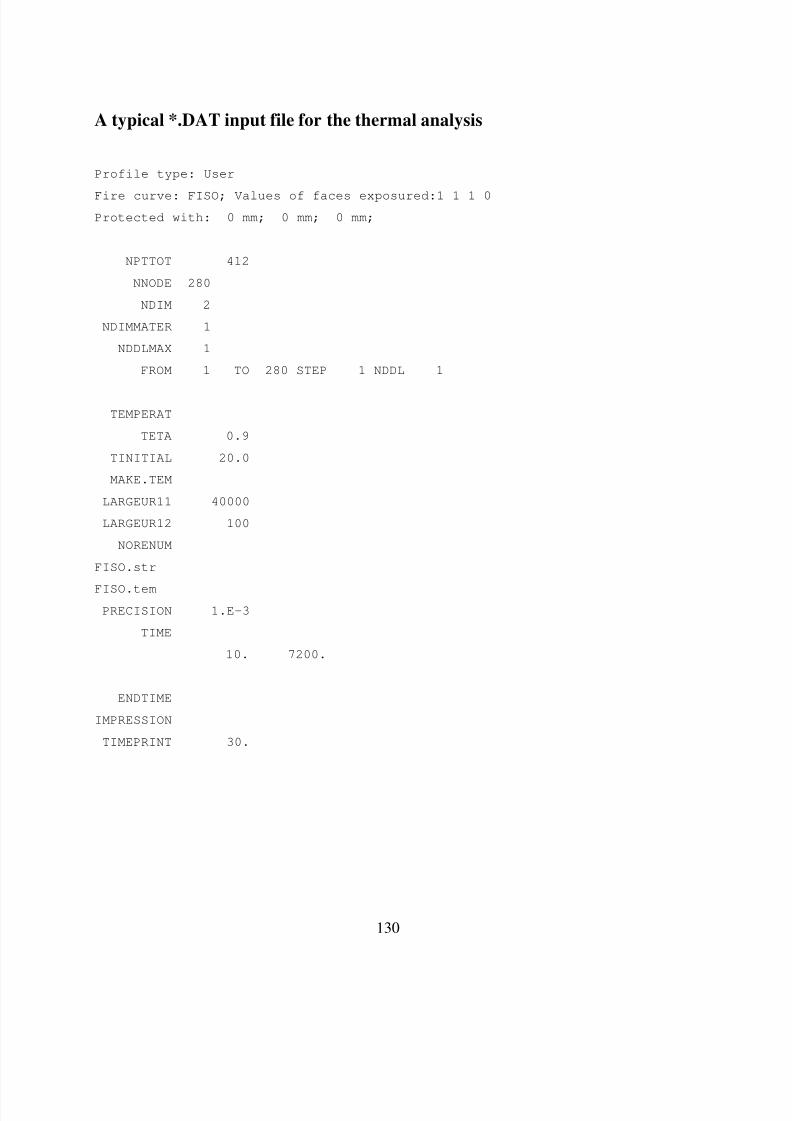
The modelling of thermal response by the SAFIR program requires the cross section to be

discretised into small finite elements. This was done using the SAFIR pre-processor wizard98.

This pre-processor automatically generates an efficient numbering system to minimise the

amount of required memory and the CPU time for calculation, and to ensure the precision of 

the solution.

The web and the flanges of the steel beam were divided into rectangular elements with coarser

mesh on the web due to the almost uniform temperature in the web throughout heating. The

roots between the flanges and the web were modelled as triangular finite elements. The

temperature was defined at every node and varied linearly in between.

SAFIR computing time can be reduced by modelling only half of the cross section, of large

complex sections. This simplifies some analyses but is only possible when the structure has

symmetrical geometry, including the supports and initial imperfections, loading, and thermal

conditions, and when a non-symmetric failure mode is not expected. Modelling half of symmetrical structures can be done by ensuring the displacements and rotations perpendicular

to the plan of symmetry are fixed while the displacements in the plan of symmetry are free.

The beam for this particular research, however, was discretised as a whole due to its simple

cross section, as shown in Figure 4.2. The overall mesh consisted of 280 nodes and 206

elements. The applied fires are described in the next section.

For the thermal analysis, time steps of 10 seconds were used throughout the heating. A five

seconds time step was applied for the first hour of the structural analysis followed by 10

seconds step up to the end of the runs. Ten seconds is a typical value used in steel section

analyses. A small time step is necessary if the element size is small, the elements possess high

8/3/2019 Temp Changes

http://slidepdf.com/reader/full/temp-changes 73/148

57

thermal conductivity, the solution varies quickly, or when the thermal properties have steep

variations such as found in gypsum sections. Numerical failures are likely to occur if the time

step used is too long or when the time range in the temperature file is shorter than that in the

structural file.

Figure 4.2 Discretisation of the steel beam cross section

8/3/2019 Temp Changes

http://slidepdf.com/reader/full/temp-changes 74/148

58

4.2.2 Applied fires

Different fires and heating rates are used to compare the behaviour of the steel beam under any

given condition. The fire was applied to beams having four different support conditions and

the behaviour of these beams were compared as described in later chapters.

The incipient phase of the fire was ignored in all cases as is normally assumed in most fire

tests. Apart from the built-in fires such as the ISO fire, the temperature function has to be

input into the SAFIR program using a separate *.fct file. It was also assumed that the fire only

affect the one beam, meaning the other spans or other parts of the frame were at the ambient

conditions. Overall heating in the whole frame structure leads to great complication and was

outside the scope of this project.

Linear heating rates

A linear heating rate of 10oC per minute was used as the base case to analyse the detailed

behaviour of differently restrained beams heated on three sides. Faster heating rates of 20 and

30oC per minute were then used to observe any differences in behaviour from the base case.

The fire was only applied on three sides of the beam as the top part would be protected by aconcrete slab.

Linear rates of heating

0

1000

2000

3000

4000

0 30 60 90 120

Time (minutes)

   T

  e  m  p  e  r  a   t  u  r  e   (  o

10 deg / min

20 deg / min

30 deg / min


Figure 4.3 Linear heating rates

8/3/2019 Temp Changes

http://slidepdf.com/reader/full/temp-changes 75/148

59

Standard ISO fire

The deflections, bending moments, and axial forces from the base case were also compared

with those from the analysis when an ISO fire is applied. It is important to investigate ISO fire

exposure for comparison, as most fire tests use this standard fire.

ISO 834 fire

0

400

800

1200

0 20 40 60 80 100

Time (minutes)

   T  e  m  p  e  r  a   t  u  r  e   (  o


Figure 4.4 Standard ISO 834 fire

Parametric fire

Using the types of fire described above, the beams are heated up to failure. However, in reality

the fire may start to decay before the structural beams fail. The behaviour of the steel beams

will then change accordingly. A realistic parametric fire was also applied to investigate these

phenomena.

The fire is the special case when Γ = 1 (refer to section 2.4.3) and Equation 2.20 represents the

ISO fire curve during the burning period at the beginning of the fire. The burning period was

taken as 20 minutes which will be verified later in more detail in section 7.3. This represents a

fire in a typical compartment 5m x 5 m x 2.5m high with a window of 2m high and 1.4m wide,

and a fuel load of 410MJ/m2

floor area. It then decays linearly back to the ambient condition.

8/3/2019 Temp Changes

http://slidepdf.com/reader/full/temp-changes 76/148

60

Parametric fire

0

200

400

600

800

1000

0 20 40 60 80 100

Time (minutes)

   T  e  m  p  e  r  a   t  u

  r  e   (  o


Figure 4.5 Realistic parametric fire

The fire was only applied on three sides of the beam as the top part will be protected by the

concrete slab. Exposure on four sides of the beam was investigated using the standard ISO fire

to observe any similarities and differences from the three-sided case. This is discussed in

chapter 7.4.

8/3/2019 Temp Changes

http://slidepdf.com/reader/full/temp-changes 77/148

61

4.3 Structural analysis

4.3.1 Discretisation

The 8 metre beam was discretised into 10 beam elements. The elements were joined together

by nodes with 3 degrees of freedom, 2 translational and 1 rotational. An additional node was

placed in the middle of each element to avoid the beam being too stiff and therefore improve

the element performance. This node only had 1 degree of freedom as it could only rotate and

was assumed not to carry any load. Therefore, for the structural analysis, the beam was

divided into 20 elements with 41 nodes.

Some integration points, also known as Gaussian points, were introduced at each element atsome distance from each node. All calculations were done at these points. For the project, two

integration points were used at 21% of the element length from each node as illustrated in

Figure 4.6. The values of the bending moment and axial force at various locations along the

beam can be obtained from these points. The deflection, however, was calculated at each node.

Figure 4.6 Discretisation of the beam for the structural analysis

4.3.2 Loading

The actual loading of the steel beam of the Telecom building includes the self weight of the

beam, the concrete slab, the secondary beams, and the live load. However as the purpose of 

the analyses is to investigate the responses of the steel beam alone, an arbitrary load of 

25kN/m was taken as the base case. In reality, the beam is able to take higher load than the

one modelled as it has some composite action with the concrete slab and the cooler

surrounding structures, which is not taken into account in the analysis. The model assumes

8/3/2019 Temp Changes

http://slidepdf.com/reader/full/temp-changes 78/148

62

that the loading applied to the beam is sitting on top of the beam with no load transferring

means of connection, therefore ignoring any composite behaviour that may occur.

4.3.3 Supports

Four different support conditions were modelled in the analyses.

Pin-roller supports

Pin-roller support is a simply supported beam, which means the member forces can be solved

using equilibrium alone. At the pin end of this support, the beam is restrained both axially and

vertically, while at the roller support, it is free to move axially. There is no bending moment

induced at both supports as they are free to rotate. The ideal pin-roller beam is unrealistic.

However, it is important to understand the behaviour of a pin-roller beam as the extreme case

where there is very little axial restraint provided to the beam.

Pin-pin supports

With pins at both ends, the whole beam is axially restrained. Both supports are free to rotate

and possess zero moment. An example of this type of supports is the bolted connection

between steel elements.

8/3/2019 Temp Changes

http://slidepdf.com/reader/full/temp-changes 79/148

63

Fix-fix supports

Fix supports indicate that the beam is fully restrained, vertically, axially and rotationally.

There is bending moment induced at the supports. This is the case where steel elements are

connected by welds or other similar types of very rigid connections.

Fix-slide supports

For this case, one end of the beam is fixed while the other end is free to move axially, but

restrained both vertically and rotationally. There is also bending moment developed at both of 

the supports.

8/3/2019 Temp Changes

http://slidepdf.com/reader/full/temp-changes 80/148

64

4.3.4 Introduction of springs

Ideal simply supported beams on pins and rollers are very rare in reality. Even though not

fully pinned, there is usually some kind of stiffness that makes the structure more restrained

than being simply on rollers. A spring was introduced into the analysis in order to model the

stiffness induced at the roller support.

The spring is modelled as a one-metre long steel truss member with a single degree of freedom

in contrast with the steel beam that possesses three degrees of freedom. In the discussion that

follows, the spring stiffness will be denoted by k , the relative stiffness of the spring to that of 

the steel beam. When k is zero, the beam is simply supported, while if k is equal to infinity,

the beam is fully pinned.

The axial stiffness of the beam defined as

 L

 EAK = is 336.5 kN/m. Taking 0.01m2 as the

constant area of the spring, the elastic modulus of the spring is obtained for each value of  k  

desired. Elastic material properties are assigned for the spring as it is not to yield prior to the

failure of the beam.

8/3/2019 Temp Changes

http://slidepdf.com/reader/full/temp-changes 81/148

65

4.4 Summary

Shown below in Table 4.2 is a summary of different combinations of fire exposure, the

support condition and the number of fire-exposed sides used in the analyses undertaken for

this research project.

Table 4.2 Summary of different analyses in the project

Fire Exposed sides Pin-roller Pin-pin Fix-fix Fix-slide Spring

3 ♣ϒ  ♣ϒ⊗  ♣ϒ  ♣ϒ  ♣ 10oC / 

minute 4

3 ♣  ♣  ♣  ♣ 20oC / 

minute 4

3 ♣  ♣  ♣  ♣ 30oC / 

minute 4

3 ♣  ♣  ♣  ♣ ISO

fire 4 ♣  ♣  ♣  ♣ 

3 ♣  ♣  ♣  ♣ Parametric

fire 4

Legend:

♣ : Investigated in the project

 ϒ : Various applied loadings were investigated

⊗ : Various lines of thrust were investigated

8/3/2019 Temp Changes

http://slidepdf.com/reader/full/temp-changes 82/148

66

5. Analysis of Results for Four Support Conditions

This section describes the general observations of the heated beam characteristics including

deflections, bending moments, and axial forces under different support conditions and failuremechanisms. The deflection in general is discussed in section 5.1, while sections 5.2 to 5.5

discuss the behaviour of the beams with different support types.

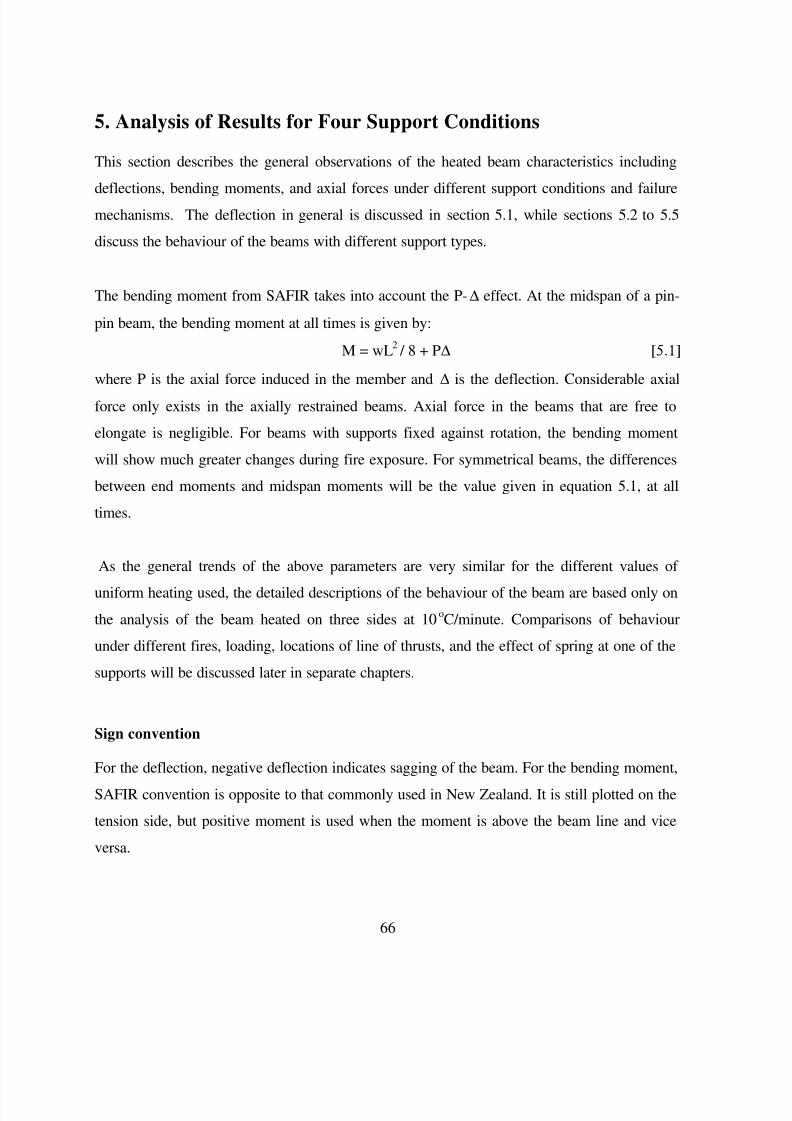
The bending moment from SAFIR takes into account the P-∆ effect. At the midspan of a pin-

pin beam, the bending moment at all times is given by:

M = wL2 / 8 + P∆ [5.1]

where P is the axial force induced in the member and ∆ is the deflection. Considerable axial

force only exists in the axially restrained beams. Axial force in the beams that are free to

elongate is negligible. For beams with supports fixed against rotation, the bending moment

will show much greater changes during fire exposure. For symmetrical beams, the differences

between end moments and midspan moments will be the value given in equation 5.1, at all

times.

As the general trends of the above parameters are very similar for the different values of 

uniform heating used, the detailed descriptions of the behaviour of the beam are based only on

the analysis of the beam heated on three sides at 10oC/minute. Comparisons of behaviour

under different fires, loading, locations of line of thrusts, and the effect of spring at one of the

supports will be discussed later in separate chapters.

Sign convention

For the deflection, negative deflection indicates sagging of the beam. For the bending moment,

SAFIR convention is opposite to that commonly used in New Zealand. It is still plotted on the

tension side, but positive moment is used when the moment is above the beam line and vice

versa.

8/3/2019 Temp Changes

http://slidepdf.com/reader/full/temp-changes 83/148

67

The sign convention adopted in New Zealand is that “negative moment” indicates a hogging

moment where there is tension at the topside of the beam, and “positive moment” indicates a

sagging moment where tension is on the bottom side of the beam. This convention is adopted

in the report apart from the graphs that show the SAFIR convention. For the axial force, it is

negative when the beam is in compression.

5.1 Deflection of the beams

Deflection criterion is important when assessing failure of the structure. Rapidly increasing

deflection indicates imminent collapse. In many severe fires, there will be very large

deflections but no collapse, in which case the deflected members can be repaired or replaced

after the fire.

Figure 5.1 illustrates the comparison of midspan deflections of beams with four different types

of support condition with regards to the steel temperature at the mid height of the web, which

was considered to be the hottest place in the cross section.

Midspan deflection throughout heating

-1000

-800

-600

-400

-200

0

0 200 400 600 800 1000

Temperature (oC)

   D  e   f   l  e  c   t   i  o  n   (  m

pin-roller pin-pin fix-fix fix-slide


Figure 5.1 Midspan deflection of the beams throughout heating

8/3/2019 Temp Changes

http://slidepdf.com/reader/full/temp-changes 84/148

68

Deflection at early stage of the fire

Midspan deflection

-40

-30

-20

-10

0

0 100 200 300 400 500 600

Temperature (oC)

   D  e   f   l  e  c   t   i  o  n   (  m

pin-roller pin-pin fix-fix fix-slide


Figure 5.2 Midspan deflection for all beams at early stage of the fire

Figure 5.2 illustrates the same curves as Figure 5.1, considering only the deflection up to

40mm and steel temperature up to 600oC. It can be seen that the simply supported beams,

both with pin-roller and pin-pin end conditions had slightly more deflection at the midspan to

start with, as they were free to rotate at the supports. On the other hand, the beams with

moment resisting supports are restrained from rotation at the ends and therefore produced less

deflection at normal conditions.

As the heating progressed, the pin-roller supported beam had constant increase in deflection,

while the pin-pin supported beam had slightly more deflection up to approximately 170oC

when something happened and the deflection increased dramatically. The beam with fix-slide

supports maintained the minimum deflection at the early stage of the fire while the beam with

fix-fix end conditions behaved like the one with fix-slide supports up to about 170oC and then

underwent rapid deformation. This behaviour is described in more detail below.

8/3/2019 Temp Changes

http://slidepdf.com/reader/full/temp-changes 85/148

69

Pin-roller

In the pin-roller condition, the beam was free to elongate. There was no effect of thermal

expansion and the deflection was purely due to the loading. Upon heating, Figure 5.1 shows

that the beam slowly deflects up to approximately 700oC. At this point, the beam had lost most

of its strength and the deflection pulled the roller support slightly closer to the pin support.

When the beam lost its stiffness, runaway failure started to occur. Failure occurred at 83

minutes after the beginning of the fire.

Pin-pin

The beam with pin-pin supports was not free to expand upon heating. The heat caused the

beam to try to elongate and since it was restrained against thermal expansion, it started bowing

down at an early stage of the fire, i.e. at about 200oC. It had a much larger displacement than

the pin-roller supported beam and eventually failed after 97.5 minutes of exposure.

Fix-fix

Similar to the pin-pin end conditions, the fix-fix supports also provided axial restraint to the

beam. However, as the supports were not free to rotate, only slight deflection was observed up

to about 400o

C, while thereafter the deflection became more apparent even though it did notdeflect as far as the beam with the pin-pin supports. This beam failed at 88 minutes.

Fix-slide

Fix-slide supports allowed the beam to undergo thermal expansion. The beam hardly deflected

throughout the heating because both ends were not free to rotate, in contrast with the pin-roller

supported beam. The very slight deflection was followed by runaway failure at 90.5 minutes

due to yielding of both the top and bottom flanges at midspan following the yielding of those

at ends of the span shortly before, as explained in detail in section 5.5.

8/3/2019 Temp Changes

http://slidepdf.com/reader/full/temp-changes 86/148

70

5.2 Beam with pin-roller supports

This beam failed when one plastic hinge was formed at the midspan as illustrated in Figure

5.2. As the beam was free to expand, the bending moment along the beam was only due to the

imposed load and there was no axial force induced.

The moment distribution was constant throughout the heating as shown in Figure 5.7. There

was zero moment at the ends as the beam was free to rotate at its supports, and wL2 / 8 at the

midspan (Figure 5.4), with w being the uniformly distributed load and L being the span length

of the beam. The sequence of events throughout the fire exposure is summarised in Table 5.1.

Table 5.1 Time line of events in pin-roller beam

No. Events Time (minutes)

1 Bottom flange at midspan reached the proportional limit 64

2 Top flange at midspan reached the proportional limit 70

3 Bottom flange at midspan reached yield 81.5

4 Top flange at midspan reached yield 83

5 Failure mechanism achieved (1 plastic hinge) 83

Figure 5.2 Failure mechanism of pin-roller beam

8/3/2019 Temp Changes

http://slidepdf.com/reader/full/temp-changes 87/148

71

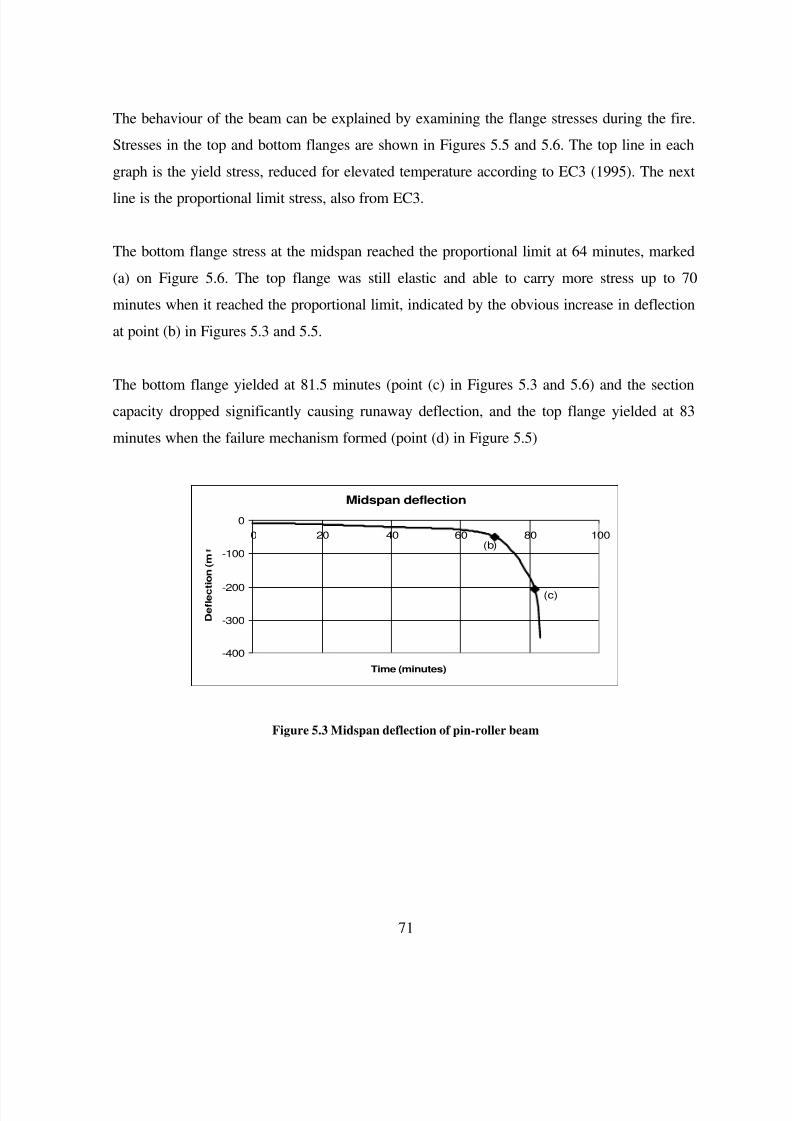
The behaviour of the beam can be explained by examining the flange stresses during the fire.

Stresses in the top and bottom flanges are shown in Figures 5.5 and 5.6. The top line in each

graph is the yield stress, reduced for elevated temperature according to EC3 (1995). The next

line is the proportional limit stress, also from EC3.

The bottom flange stress at the midspan reached the proportional limit at 64 minutes, marked

(a) on Figure 5.6. The top flange was still elastic and able to carry more stress up to 70

minutes when it reached the proportional limit, indicated by the obvious increase in deflection

at point (b) in Figures 5.3 and 5.5.

The bottom flange yielded at 81.5 minutes (point (c) in Figures 5.3 and 5.6) and the sectioncapacity dropped significantly causing runaway deflection, and the top flange yielded at 83

minutes when the failure mechanism formed (point (d) in Figure 5.5)

Midspan deflection

(c)

(b)

-400

-300

-200

-100

0

0 20 40 60 80 100

Time (minutes)

   D  e   f   l  e  c   t   i  o  n   (  m


Figure 5.3 Midspan deflection of pin-roller beam

8/3/2019 Temp Changes

http://slidepdf.com/reader/full/temp-changes 88/148

72

Midspan moment

-250

-200

-150

-100

-50

0

0 20 40 60 80 100

Time (minutes)

   M  o  m  e  n   t   (   k   N

 .


Figure 5.4 Midspan moment of pin-roller beam

Stresses of the top flange

(d)(b)

-200

0

200

400

600

0 20 40 60 80 100 120

Time (mins)

   S   t  r  e  s  s   (   M   P

midspan (reversed) end of span prop limit yield env


Figure 5.5 Top flange stresses of pin-roller beam

Stresses of the bottom flange

(a) (c)

0

200

400

600

0 20 40 60 80 100 120

Time (mins)

   S   t  r  e  s  s   (   M   P

midspan end of span prop limit yield env


Figure 5.6 Bottom flange stresses of pin-roller beam

8/3/2019 Temp Changes

http://slidepdf.com/reader/full/temp-changes 89/148

73

Moment distribution

-250

-200

-150

-100

-50

0

0 5 10 15 20

Element

   M  o  m  e  n   t   (   k   N .

0.5 min 20 mins 60 mins 83 mins (failure)


Figure 5.7 Moment distribution along the pin-roller beam

8/3/2019 Temp Changes

http://slidepdf.com/reader/full/temp-changes 90/148

74

5.3 Beam with pin-pin supports

Unlike the straightforward behaviour of the simply supported beam with pin-roller end

conditions, the behaviour of the beam supported by pins at both ends was found to be more

complicated due to the interactions of the subsequent events as listed in Table 5.2. The

behaviour of pin-pin beam was more sensitive to reduction in the elastic and yield limit as

shown Figures 5.12 and 5.13, due to the axial restraint as explained below.

Table 5.2 Time line of events in pin-pin beam

No. Events Time (minutes)

1 Top flange at midspan reached the proportional limit 25

2 Bottom flange at ends of span reached the proportional limit 453 Top flange at ends of span reached the proportional limit 49.5

4 Top flange at midspan reached yield 53

5 Bottom flange at midspan reached the proportional limit 53.5

6 Bottom flange at midspan reached yield 74

7 Failure mechanism achieved (1 plastic hinge) 97.5

Figure 5.8 Failure mechanism of pin-pin beam

Axial force was induced in the beam due to thermal elongation since it was axially restrained.

This force increased due to thermal expansion until the beam started to deflect considerably as

the top flange reached the proportional limit at 25 minutes, very close to the yield envelope.

8/3/2019 Temp Changes

http://slidepdf.com/reader/full/temp-changes 91/148

75

This caused alteration in the stresses at the bottom flange and at the supports. The beam also

started to lose its stiffness as the modulus of elasticity was reduced by elevated temperature,

which caused a larger deflection. This yielding and lack of stiffness allowed some reduction in

the axial load. However, the bending moment, which was governed by the P-∆ effect, kept on

increasing as the increase in deflection was greater than the reduction in the axial force. This is

marked as point (a) in Figures 5.9 - 5.12.

The bottom flange and the top flange of the endspan reached the proportional limit at 45

minutes and 49.5 minutes respectively, marked by point (b) and (c) in Figures 5.13 and 5.12.

There was no obvious change in the deflection, bending moment or axial force due to these as

the beam supports did not resist moment and therefore the beam still maintained its strength.

At 53 minutes, the top flange at the midspan yielded, followed by the bottom flange stress at

the midspan reaching the proportional limit 30 seconds later. Marked by point (d) in Figures

5.10 - 5.13, the midspan moment started decreasing as the first plastic hinge began to form and

the decrease in axial load was greater than the increase in deflection. Seventy four minutes

after the start of the fire, indicated by point (e) in Figures 5.9 and 5.13, the bottom flange

yielded and the plastic deformation caused larger deflections.

Figure 5.14 illustrates changes in the bending moment along the beam throughout the

exposure. There was no moment at the supports that were not rotationally restrained. The

midspan moment started with WL2

/ 8 as for simply supported beam and kept increasing at the

start, then decreased when the top flange yielded, all due to the P-∆ effect (Equation 5.1). The

increase and decrease of the moment was governed by the change in either the deflection or

the axial force, or both.

When both top and bottom flanges have yielded, the beam did not carry much moment as most

of the load was transferred to the supports by catenary action when everywhere along the

beam was in tension.

8/3/2019 Temp Changes

http://slidepdf.com/reader/full/temp-changes 92/148

76

Midspan deflection

(e)

(a)

-1000

-800

-600

-400

-200

0

0 20 40 60 80 100

Time (minutes)

   D  e   f   l  e  c   t   i  o  n   (  m


Figure 5.9 Midspan deflection of pin-pin beam

Midspan moment

(d)

(a)

-800

-600

-400

-200

0

0 20 40 60 80 100

Time (minutes)

   M  o  m  e  n   t   (   k   N .


Figure 5.10 Midspan moment of pin-pin beam

Axial force

(d)

(a)

-6000

-4000

-2000

0

2000

0 20 40 60 80 100

Time (minutes)

   A  x   i  a   l

   f  o  r  c  e   (   k


Figure 5.11 Axial force of pin-pin beam

8/3/2019 Temp Changes

http://slidepdf.com/reader/full/temp-changes 93/148

77

Stresses of the top flange

(a)

(c)

(d)

-200

0

200

400

600

0 20 40 60 80 100 120

Time (mins)

   S   t  r  e  s  s   (   M   P

midspan (reversed) end of span (reversed) prop limit yield env


Figure 5.12 Top flange stresses of pin-pin beam

Stresses of the bottom flange

(e)

(b)

(d)

-400

-200

0

200

400

600

0 20 40 60 80 100 120

Time (mins)

   S   t  r  e  s  s   (   M   P

midspan end of span (reversed) prop limit yield env


Figure 5.13 Bottom flange stresses of pin-pin beam

Moment distribution

-800

-600

-400

-200

0

0 5 10 15 20

Element

   M  o  m

  e  n   t   (   k   N .

0.5 min

20 mins

30 mins

40 mins

60 mins

75 mins

97.5 mins

(failure)


Figure 5.14 Moment distribution along the pin-pin beam

8/3/2019 Temp Changes

http://slidepdf.com/reader/full/temp-changes 94/148

78

5.4 Beam with fix-fix supports

With fully fixed supports at both ends, the beam with fix-fix supports required the

development of three plastic hinges to form a failure mechanism as shown in Figure 5.15. The

sequence of events is outlined in Table 5.3.

The moment restraint at the supports caused the beam with fix-fix supports to be very

sensitive to the stress condition with respect to the proportional limit and the yield that were

reduced due to high temperature. This is illustrated in Figures 5.21 and 5.22 that compare the

stresses at the top and bottom flanges respectively with the proportional limit and the yield

envelope.

Table 5.3 Time line of events in fix-fix beam

No. Events Time (minutes)

1 Bottom flange at ends of span reached the proportional limit 25

2 Top flange at midspan reached the proportional limit 29.5

3 Bottom flange at midspan reached the proportional limit 37.5

4 Top flange at ends of span reached the proportional limit 48.5

5 Bottom flange at ends of span reached yield 55

6 Top flange at midspan reached yield 63.5

7 Failure mechanism achieved (3 plastic hinges) 88

Figure 5.15 Failure mechanism of fix-fix beam

8/3/2019 Temp Changes

http://slidepdf.com/reader/full/temp-changes 95/148

79

Prior to the fire under the given loading, the moments at the midspan and at the ends of the

span were wL2 / 24 and wL2 / 12 respectively as expected from a static analysis. The beam

hardly deflected at the beginning of the fire. Thermal expansion caused development of a

compressive axial force and the differential temperature caused a change in the bending

moments.

High compressive force caused the bottom flange at the ends of the span to reach the

proportional limit at 25 minutes, the beam had more obvious deflection thereafter and the

bending moment decreased, marked as point (a) in Figures 5.16 – 5.18, 5.20 and 5.22. As a

result, the midspan moment also dropped as it was affected by the compression in the bottom

flange.

The neutral axis now shifted up. The web did not carry much of the stresses as it was so thin

and heated up very quickly. Most of the stresses would be carried by the flanges which had

much bigger thermal mass. Soon the top flange at midspan reached the proportional limit at

29.5 minutes (point (b) in Figure 5.21). The midspan moment grew rather constantly at this

point and moment redistribution caused the end moment to compensate for the strength

reduction at the midspan indicated by point (b) in Figures 5.17 and 5.18.

When the plastic hinges started to form, the axial force started to drop (point (b) in Figure

5.20) and the deflection continued to increase. The bottom flange at midspan reached the

proportional limit at 37.5 minutes but caused no obvious change in the overall behaviour of 

the beam.

However, when the top flange at the ends of the span reached the proportional limit at 48.5

minutes, the axial load dropped even more and the midspan moment showed a sudden increase

as the midspan was carrying more of the load (point (c) in Figure 5.17 and 5.21). The P-∆ 

effect was governed by the deflection as the deflection was increasing even though the axial

load was reducing (point (c) in Figures 5.16 and 5.20). The pattern observed in the bending

8/3/2019 Temp Changes

http://slidepdf.com/reader/full/temp-changes 96/148

80

moment plots showed that moment redistribution between the midspan and ends of the span

occurred to prevent collapse as long as possible.

The bottom flange at the endspan was the first to yield at 55 minutes after the beginning of the

fire, shown in Figure 5.22 as point (d), which slightly altered the endspan moment (point (d) in

Figure 5.18). The midspan moment kept on increasing up to 63.5 minutes when the top flange

at midspan yielded, indicated as point (e) in Figures 5.17 and 5.21. There was not much

strength left in the beam at this stage as three plastic hinges were already developed and the

axial force was approaching zero. Unlike the pin-pin case where catenary effect caused the

beam to hang in tension, this beam experienced loss of stiffness and strength earlier and failed

at 88 minutes.

There was no exact explanation on the moment alterations observed at about 80 minutes apart

from that some moment redistribution occurred. It can be seen that the behaviour of the fix-fix

beam was very sensitive to the proportional limit and the yield limit of the material.

The moment distribution throughout heating along the beam as illustrated in Figure 5.19

shows that the end moment was always a hogging moment, while the midspan moment was

always a sagging moment, except for a brief period about 20 minutes into the fire. The beam

started with WL2

/ 12 at the supports and WL2

/ 24 at the midspan as the beam had moment

resisting supports, and was changing upon fire exposure due to the P-∆ effect and thermal

bowing.

At failure when three plastic hinges have developed and the axial force is almost zero, the

midspan moment was equal to the end moment of wL2

/ 16 as both had the same flexural

capacity, with no more contribution from the P-∆ effect.

8/3/2019 Temp Changes

http://slidepdf.com/reader/full/temp-changes 97/148

81

Midspan deflection

(c)

(a)

-300

-200

-100

0

0 20 40 60 80 100

Time (minutes)

   D  e   f   l  e  c   t   i  o  n   (  m


Figure 5.16 Midspan deflection of fix-fix beam

Midspan moment

(e)

(c)(b)

(a)

-300

-200

-100

0

100

0 20 40 60 80 100

Time (minutes)

   M  o  m  e  n   t   (   k   N .


Figure 5.17 Midspan moment of fix-fix beam

End moment

(d)

(b)

(a)

0

100

200

300

0 20 40 60 80 100

Time (minutes)

   M  o  m  e  n   t   (   k   N .


Figure 5.18 End moment of fix-fix beam

8/3/2019 Temp Changes

http://slidepdf.com/reader/full/temp-changes 98/148

82

Moment distribution

-300

-200

-100

0

100

200

300

0 5 10 15 20

Element

   M  o  m  e  n   t   (   k   N .

0.5 min 20 mins 30 mins 60 mins 88 mins (failure)


Figure 5.19 Moment distribution along the fix-fix beam

Axial force

(c)(b)

(a)

-6000

-4000

-2000

0

0 20 40 60 80 100

Time (minutes)

   A  x   i  a   l   f  o  r  c  e   (   k


Figure 5.20 Axial force of fix-fix beam

Stresses of the top flange

(e)(b)

(c)

-200

0

200

400

600

0 20 40 60 80 100 120

Time (mins)

   S   t  r  e  s  s   (   M   P

m idspan (reversed) end of span (reversed) proportional lim it yield envelope


Figure 5.21 Top flange stresses of fix-fix beam

8/3/2019 Temp Changes

http://slidepdf.com/reader/full/temp-changes 99/148

83

Stresses of the bottom flange

(d)(a)

-200

0

200

400

600

0 20 40 60 80 100 120

Time (mins)

   S   t  r  e  s  s

   (   M   P

m idspan(reversed) end of span(reversed) proportional lim it yield envelope


Figure 5.22 Bottom flange stresses of fix-fix beam

8/3/2019 Temp Changes

http://slidepdf.com/reader/full/temp-changes 100/148

84

5.5 Beam with fix-slide supports

The beam with fix-slide supports needed three plastic hinges to form a failure mechanism. The

beam was free to elongate and therefore there was no axial force induced as a result of thermal

expansion as found in the pin-pin and fix-fix cases. For the first hour of fire exposure the beam

behaved elastically with minimum deflection. Thereafter a sequence of events as mentioned

below occurred consecutively.

Table 5.4 Time line of events in fix-slide beam

No. Events Time (minutes)

1 Top flange at ends of span reached the proportional limit 66

2 Bottom flange at ends of span reached the proportional limit 693 Bottom flange at midspan reached the proportional limit 77

4 Top flange at midspan reached the proportional limit 84

5 Bottom flange at ends of span reached yield 85

6 Top flange at ends of span reached yield 89

7 Top flange at midspan reached yield 90

8 Bottom flange at midspan reached yield 90

9 Failure mechanism achieved (3 plastic hinges) 90.5

Figure 5.23 Failure mechanism of fix-slide beam

8/3/2019 Temp Changes

http://slidepdf.com/reader/full/temp-changes 101/148

85

Figure 5.27 shows the evolution of the bending moment diagram throughout heating. It can be

seen that the overall shape of the bending moment was unchanged. The negative moment at

the ends of the beam increased during the first 40 minutes due to thermal bowing. The thermal

bowing then decreased as the temperature gradient decreased, causing the end moments to

drop. The midspan moment changed accordingly, because the sum of midspan and end

moments at any given time must be equal to wL2 / 8 for any beams without axial forces. At the

time of failure, the midspan and end moments were equal to wL2 / 16 as plastic hinges formed.

At 66 minutes, the top flange at the endspan reached the proportional limit, followed shortly

three minutes later by the bottom flange, marked as points (a) and (b) in Figures 5.28 and 5.29

respectively. By this time the deflection started to be noticeable. The bottom flange and thetop flange at the midspan reached the proportional limit at 77 and 84 minutes respectively

(points (c) and (d) in Figures 5.29 and 5.28).

The bottom flange at the ends of the span yielded at 85 minutes of exposure (point (e) in

figure 5.29) and the top flange at 89 minutes (point (f) in Figure 5.28). The elastic modulus of 

the beam had reduced significantly and when the top and bottom flanges at the midspan

yielded at the same time at 90 minutes (point (g) in Figures 5.28 and 5.29), runaway deflection

occurred failing the beam 30 seconds later.

Midspan deflection

-200

-150

-100

-50

0

0 20 40 60 80 100

Time (minutes)

   D  e   f   l  e  c   t   i  o  n   (  m


Figure 5.24 Midspan deflection of fix-slide beam

8/3/2019 Temp Changes

http://slidepdf.com/reader/full/temp-changes 102/148

86

Midspan moment

-200

-100

0

100

200

0 20 40 60 80 100

Time (minutes)

   M  o  m  e  n   t   (   k   N

 .


Figure 5.25 Midspan moment of fix-slide beam

End moment

0

100

200

300

400

0 20 40 60 80 100

Time (minutes)

   M  o  m  e  n   t   (   k   N .

 Figure 5.26 End moment of fix-slide beam

Moment distribution

-200

0

200

400

0 5 10 15 20

Element

   M  o  m  e  n   t   (   k   N .

0.5 mins 20 mins 40 mins 60 mins 90.5 mins (failure)


Figure 5.27 Moment distribution along the fix-slide beam

8/3/2019 Temp Changes

http://slidepdf.com/reader/full/temp-changes 103/148

87

Stresses of the top flange

(d) (g)

(f)(a)

-200

0

200

400

600

0 20 40 60 80 100 120

Time (mins)

   S   t  r  e  s  s   (   M   P

midspan(reversed) end of span propor tional limit y ield envelope


Figure 5.28 Top flange stresses of fix-slide beam

Stresses of the bottom flange

(c) (g)

(e)(b)

-200

0

200

400

600

0 20 40 60 80 100 120

Time (mins)

   S   t  r  e  s  s   (   M   P

midspan end of span ( reversed) propor tional limit y ield envelope

 Figure 5.29 Bottom flange stresses of fix-slide beam

8/3/2019 Temp Changes

http://slidepdf.com/reader/full/temp-changes 104/148

88

5.6 Comparison with critical buckling

The failure mechanism of beams that are sufficiently compact is usually by the forming of 

plastic hinges at the critical locations. On the other hand, slender beams will buckle under the

axial stress before the material reaches its yield stress as explained by Rotter and Usmani

(2000). This phenomenon is observed in cases where the beam is axially restrained against

thermal expansion such as the beam with the pin-pin end conditions, allowing the

development of high compressive force which the beam fails to sustain.

The Cardington test results showed that local buckling had occurred in nearly all of the tests.

As described in the report published by the British steel (1999), most of the buckling occurred

around the area of the connection between beams and columns.

The SAFIR analyses were two dimensional, therefore the beam was assumed to be laterally

restrained and the beam buckling was only possible about the strong axis. Local buckling is

not an issue, as it is not modelled in the beam element analysis in SAFIR. It is only taken into

account in a shell element analysis.

The axial force on the pin-pin and fix-fix beam experienced some alteration during the fire

exposure due to subsequent events, and the investigation on whether or not buckling was one

of the causes was considered necessary.

Using the Euler formula (Equation 2.28) with reduction in modulus of elasticity

(Equation 2.14), the critical buckling load was obtained with respect to time showing the

reduction in the beam capacity.

Figure 5.30 shows the comparison between the axial force induced in the pin-pin beam from

the SAFIR analysis and the critical buckling load from the Euler formula. The upper curves

are the axial force induced in the pin-pin and fix-fix beams obtained from the SAFIR output,

with the negative sign indicating compression. The bottom line is the critical buckling load. It

8/3/2019 Temp Changes

http://slidepdf.com/reader/full/temp-changes 105/148

89

is obvious that the axial force induced was nowhere near the critical buckling load until the

end of the analysis and therefore member buckling did not occur in the beams analysed. This

is a separate item to local flange buckling which may have occurred in the plastic hinge

regions, due to large plastic rotations.

Critical buckling check

-30000

-20000

-10000

0

10000

0 20 40 60 80 100

Time (minutes)

   P  c  r   (   k

Axial force (pin-pin) Axial force (fix -fix ) Critical buck ling load


Figure 5.30 Comparison between the axial load and the critical buckling load

8/3/2019 Temp Changes

http://slidepdf.com/reader/full/temp-changes 106/148

90

5.7 Conclusions

Based on the above analyses, some important aspects can be concluded regarding the

behaviour of beams with four different support conditions under a given loading and fire

exposure.

5.7.1 Simply supported beams

Simply supported beams are not restrained against rotation at the supports. At ambient

conditions, the applied loading causes larger initial deflection compared with the moment

resisted beams due to this end rotation. Elevated temperature causes the beam to lose its

stiffness and elasticity resulting in the forming of one plastic hinge at the midspan and failure

mechanism occurs.

Pin-roller beam

The ideal pin-roller beam is unrealistic. Real structural members have axial restraint to some

degree. Upon heating, pin-roller beam is free to elongate and there is no axial force induced in

the beam due to thermal expansion. The bending moment along the beam stays constant, being

only due to the static load. Deflection of a pin-roller beam gradually increases due to the loss

of strength in the steel. When the plastic hinge has developed, the beam has lost most of its

strength and the deflection greatly increased, pulling the roller support closer to the pin

support, known as the runaway failure. Compared with the other three beams with different

supports investigated, a pin-roller beam fails the earliest.

Pin-pin beam

The axial restraint in the pin-pin beam prevents the beam from expanding. Thermal expansion

causes large axial force along the beam resulting in greater deflection. The forming of the

plastic hinge at the midspan causes reduction in the axial load as the deflection increases.

Approaching failure, when the loss of stiffness overwhelms the beam performance, the load is

supported by the catenary action as the whole beam is in tension.

8/3/2019 Temp Changes

http://slidepdf.com/reader/full/temp-changes 107/148

91

5.7.2 Moment resisting supported beams

A beam with moment resisting supports is not free to rotate at its ends. As a result, it has less

initial deformation due to the applied loading. The forming of the plastic hinge at the midspan

alone will not cause failure to beams with this type of supports. Additional plastic hinges at

the ends of the span are required to form a failure mechanism.

Fix-fix beam

This beam is fully fixed at both ends. Thermal loading induces a great amount of axial force

within the beam. This high compressive force soon brings the ends of the span to yield, the

axial force slowly reduces and the deflection starts increasing. The behaviour of the fix-fix

beam is found to be very sensitive to the stresses reaching the proportional limit or the yield

stress.

Greater deflection eventually forms a plastic hinge at the midspan, which reduce the axial

force considerably with increasing deflection. Fix-fix beam fails earlier than the pin-pin beam

without as much deflection.

Fix-slide beam

In a fix-slide beam, thermal expansion has no significant effect, as the beam is free to expand.

This fact, together with the moment resisting supports result in a minimum deflection for a

considerable period of time into the fire. The moments at both midspan and ends of the span

increase due to thermal bowing and then decrease as there is no more thermal gradient along

the cross section at later time when the section temperature is roughly uniform.

As there is no P-∆ effect in a fix-slide beam, the shape of the bending moment is constant

throughout the fire exposure. Three plastic hinges form due to reduction in the steel strength

leading to runaway failure shortly after the failure of the fix-fix beam.

8/3/2019 Temp Changes

http://slidepdf.com/reader/full/temp-changes 108/148

92

6. Effect of a spring at the support

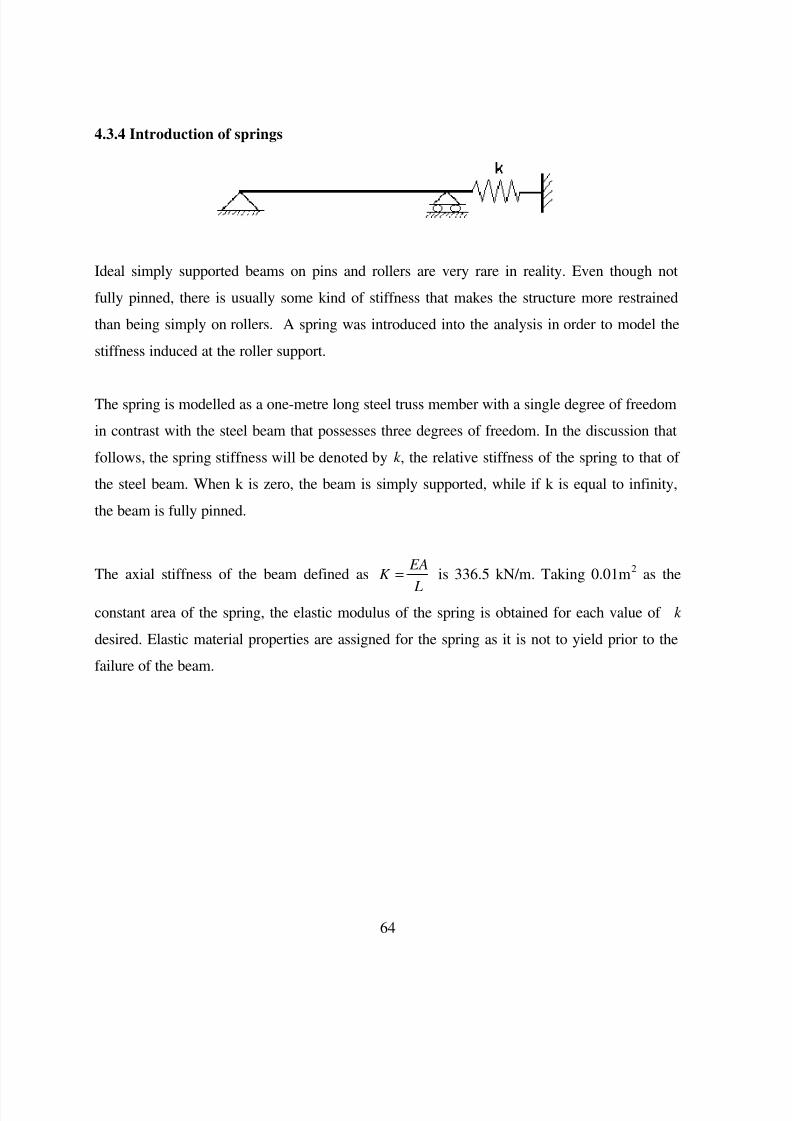
As mentioned earlier in section 4.3.4, the pin-roller and pin-pin supports are not common in

real structures. Most of the members in steel frames are joined with some degree of axialrestraint. A spring was introduced at one of the supports to model this situation, with the

stiffness of the spring, k being a fraction of the stiffness of the steel beam. That means when

k=1, the restraint provided from the spring to the beam is the same as if another beam with the

same stiffness is placed right next to it.

6.1 Spring stiffness between 0 and 1

This section compares the beam behaviour when the spring introduced has stiffnesses between

0, which is equal to pin-roller condition, and 1, as if another beam with same stiffness is

present. The results are set out in Figures 6.1 to 6.3.

Using the stiffness range from 0 to 1, it is observed that for k=0.1, the behaviour of the beam

was very similar to the early stage of the pin-roller condition. A big jump was obvious in all

graphs presented in that when k=0.2 or higher, the reactions in the beam were almost exactly

the same as in the pin-pin condition. However, when a spring was introduced, the beams failed

at about 40 minutes irrespective of the value of k. This was considered to be a numerical

problem in SAFIR analysis, rather than physical failure.

Midspan deflection

-1000

-800

-600

-400

-200

0

0 20 40 60 80 100

Time (minutes)

   D  e   f   l  e  c   t   i  o  n   (  m

pin-roller

k = 0.1

k = 0.2

k = 0.5

k = 0.8

k = 1

pin-pin


Figure 6.1 Midspan deflection with spring stiffness between 0 and 1

8/3/2019 Temp Changes

http://slidepdf.com/reader/full/temp-changes 109/148

93

Midspan moment

-800

-600

-400

-200

0

0 20 40 60 80 100 120

Time (minutes)

   M  o  m  e  n   t   (   k   N .

pin-roller

k = 0.1

k = 0.2

k = 0.5

k = 0.8

k = 1

pin-pin


Figure 6.2 Midspan moment with spring stiffness between 0 and 1

Axial force

-5000

-4000

-3000

-2000

-1000

0

1000

0 20 40 60 80 100 120

Time (minutes)

   A  x   i  a   l   f  o  r  c  e   (   k

pin-roller

k = 0.1

k = 0.2

k = 0.5

k = 0.8

k = 1

pin-pin


Figure 6.3 Axial force with spring stiffness between 0 and 1

8/3/2019 Temp Changes

http://slidepdf.com/reader/full/temp-changes 110/148

94

6.2 Spring stiffness between 0 and 0.1

Considering only axial stiffness values between k=0 and k=0.1, it can be seen that beams with

various k values within this range have the same deflection pattern as the pin-roller support

case although those with an axial spring fail sooner as discussed in the previous section.

The bending moment and the axial force however showed very even changes in proportion

with the changes in k over this range, which was expected and self-explanatory.

Midspan deflection

-400

-300

-200

-100

00 20 40 60 80 100

Time (minutes)

   D  e   f   l  e  c   t   i  o  n   (  m pin-roller

k = 0.01

k = 0.02

k = 0.05

k = 0.08


Figure 6.4 Midspan deflection with spring stiffness between 0 and 0.1

Midspan moment

-220

-215

-210

-205

-200

-195

0 10 20 30 40 50

Time (minutes)

   M  o  m  e  n   t   (   k   N . pin-roller

k = 0.01

k = 0.02

k = 0.05

k = 0.08

k = 0.1


Figure 6.5 Midspan moment with spring stiffness between 0 and 0.1

8/3/2019 Temp Changes

http://slidepdf.com/reader/full/temp-changes 111/148

95

Axial force

-1000

-800

-600

-400

-200

0

200

0 10 20 30 40 50

Time (minutes)

   A  x   i  a   l   f  o  r  c  e

   (   k pin-roller

k = 0.01

k = 0.02

k = 0.05

k = 0.08

k = 0.1


Figure 6.6 Axial force with spring stiffness between 0 and 0.1

8/3/2019 Temp Changes

http://slidepdf.com/reader/full/temp-changes 112/148

96

6.3 Spring stiffness between 0.1 and 0.2

In this section, the effects of spring with k varying from 0.1 to 0.2 are investigated regarding

the rather unusual behaviour observed in section 6.1. While the distribution was very even for

k between 0 and 0.1, there seems to be a big change from k=0.1 to 0.2 while there is no change

in behaviour when k=0.2 and higher.

The deflection plot in Figure 6.7 suggested the same pattern occurred for k=0.1 up to 0.195.

Figures 6.8 and 6.9 show an even distribution over this range, but the tiny increment from

k=0.195 to 0.2 showed otherwise.

Midspan deflection

-120

-90

-60

-30

0

0 10 20 30 40 50

Time (minutes)

   D  e   f   l  e  c   t   i  o  n   (  m k = 0.1

k = 0.15

k = 0.175

k = 0.195

k = 0.2

 Figure 6.7 Midspan deflection with spring stifness between 0.1 and 0.2

Midspan moment

-600

-450

-300

-150

0

0 10 20 30 40 50

Time (minutes)

   M

  o  m  e  n   t   (   k   N . k = 0.1

k = 0.15

k = 0.175

k = 0.195

k = 0.2


Figure 6.8 Midspan moment with spring stifness between 0.1 and 0.2

8/3/2019 Temp Changes

http://slidepdf.com/reader/full/temp-changes 113/148

97

Axial force

-5000

-4000

-3000

-2000

-1000

0

1000

0 10 20 30 40 50

Time (minutes)

   A  x   i  a   l   f  o  r  c  e

   (   k k = 0.1

k = 0.15

k = 0.175

k = 0.195

k = 0.2


Figure 6.9 Axial force with spring stiffness between 0.1 and 0.2

The stress check proved the top flange has not yielded at time of failure and the bottom flangestress was nowhere near the proportional limit. The big jump at a stiffness of 0.2 is rather

unexplainable and may well be due to compounding numerical error in the stiffness matrix.

Welsh (2001) has also encountered similar problem for certain arrangements of the structure.

The program was seen to terminate when both top and bottom stresses reach the proportional

limit at the same time.

8/3/2019 Temp Changes

http://slidepdf.com/reader/full/temp-changes 114/148

98

7. Comparison between different applied fires

7.1 Linear heating rates

Analyses of the beam responses using faster heating rates showed that the behaviour pattern of the four support conditions is very similar. The pin-pin case was chosen to illustrate the

comparison.

It is observed in Figure 7.1 that the behaviour trend was very much the same for the 10, 20,

and 30oC/minute heating rates with respect to temperature, taking the midspan deflection as an

example. This shows that no matter how fast a beam is heated, it will fail at the same

temperature when it loses its strength.

In respect to time, however, faster heating failed the beam sooner, as expected. Figures 7.2 to

7.4 illustrate the development of the deflection, bending moment, and axial force for the three

different heating rates, with each one showing similar trends.

A faster heating rate caused higher thermal gradient along the cross section of the beam. This

caused the beam to fail not only faster but also without as great a deflection. A slower rate

allowed the temperature in the beam to be more uniform and hence better development of 

plastic hinges.

When the beam experienced plastic deformation, greater deflection but lower moment was

found. Figure 7.4 shows that for 10 and 20oC/minute heating, the beam was in tension at time

of failure, while the 30oC per minute heating failed the beam when it was still in compression,

as a result of the plastic hinge not becoming fully developed.

8/3/2019 Temp Changes

http://slidepdf.com/reader/full/temp-changes 115/148

99

Midspan deflection

-1000

-800

-600

-400

-200

0

0 200 400 600 800 1000

Temperature (oC)

   D  e   f   l  e  c   t   i  o  n   (  m

10 deg/min 20 deg/min 30 deg/min


Figure 7.1 Midspan deflection of pin-pin beam with respect to temperature

Midspan deflection

-1000

-800

-600

-400

-200

0

0 20 40 60 80 100 120

Time (minutes)

   D  e   f   l  e  c   t   i  o  n   (  m

10 deg/min 20 deg/min 30 deg/min

 Figure 7.2 Midspan deflection of pin-pin beam under various linear heating rates

Midspan moment

-800

-600

-400

-200

0

0 20 40 60 80 100 120

Time (minutes)

   M  o  m  e  n   t   (   k   N .

10 deg/min 20 deg/min 30 deg/min


Figure 7.3 Midspan moment of pin-pin beam under various linear heating rates

8/3/2019 Temp Changes

http://slidepdf.com/reader/full/temp-changes 116/148

100

Axial force

-4500

-3000

-1500

0

1500

0 20 40 60 80 100 120

Time (minutes)

   A  x   i  a   l   f  o  r  c  e   (   k

10 deg/min 20 deg/min 30 deg/min


Figure 7.4 Axial force of pin-pin beam under various linear heating rates

8/3/2019 Temp Changes

http://slidepdf.com/reader/full/temp-changes 117/148

101

7.2 ISO fire

The observation on the ISO fire exposure illustrated in Figure 7.5 shows very similar

deflection patterns as the exposure to the 10oC/minute heating rate (refer to Figure 5.1). The

beams in both cases were heated on three sides. From these two figures, it is shown that steel

beams fail in a certain temperature range roughly around 800-900oC regardless of the type of 

the supports and the duration of the fire.

The ISO fire exposed beams, however, failed at slightly lower temperatures than those

exposed to the slower 10oC/minute heating rate due to  high thermal loading creating high

thermal gradient and thermal bowing in the cross section.

The fix-slide beam lasted the longest as it could expand and form three plastic hinges in

contrast with the pin-pin beam which soon developed large deflection and quickly lost its

stiffness due to the rapid heating and failed on the forming of one plastic hinge.

Midspan deflection

-600

-400

-200

0

0 200 400 600 800 1000

Temperature (oC)

   D  e   f   l  e  c   t   i  o  n   (

  m

Pin-roller (3) Pin-pin (3) Fix-fix (3) Fix-slide (3)


Figure 7.5 Midspan deflection of beams exposed to ISO fire

For the discussion in this section, the behaviour patterns of the pin-pin beam exposed to the

ISO fire are compared to the ones exposed to the 10oC/minute heating rate. Figure 7.6 shows

the deflection patterns with respect to temperature that are very close for both fires. The ISO

fire exposed beam, however, failed sooner with less deflection due to high thermal gradient as

explained above.

8/3/2019 Temp Changes

http://slidepdf.com/reader/full/temp-changes 118/148

8/3/2019 Temp Changes

http://slidepdf.com/reader/full/temp-changes 119/148

103

Midspan moment

-800

-600

-400

-200

0

0 20 40 60 80 100 120

Time (minutes)

   M  o  m  e  n   t   (   k   N .

10 deg/min ISO fire


Figure 7.8 Midspan moment of pin-pin beam exposed to 10oC/minute heating and ISO fire

Axial force

-4500

-3000

-1500

0

1500

0 20 40 60 80 100 120

Time (mins)

   A  x   i  a   l   f  o  r  c  e   (   k

10 deg/min ISO fire


Figure 7.9 Axial force of pin-pin beam exposed to 10oC/minute heating and ISO fire

Figures 7.10 and 7.11 show the stresses at the midspan of the pin-pin beam exposed to the

standard ISO fire. It can be seen that at roughly the first five minutes into the fire, the stress at

the top flange had reached the proportional limit, very close to the yield envelope. Upon

yielding it followed the yield line up to failure at about half an hour of exposure.

The bottom flange was in compression at the start of the fire and changed into tension when

the top flange reached the proportional limit. The trend for the bottom flange stress was not

very much affected by the proportional limit. The bottom flange yielded at about 20 minutes

and then followed the yield envelope to failure.

8/3/2019 Temp Changes

http://slidepdf.com/reader/full/temp-changes 120/148

104

Top flange stresses of pin-pin beam

0

100

200

300

400

500

0 10 20 30 40 50Time (minutes)

   S   t  r  e  s  s

   (   M   P

midspan (reversed) prop. limit yield env


Figure 7.10 Top flange stresses of pin-pin beam exposed to ISO fire

Bottom flange stresses of pin-pin beam

-200

0

200

400

600

0 10 20 30 40 50

Time (minutes)

   S   t  r  e  s  s   (   M   P

midspan prop. limit yield env

 Figure 7.11 Bottom flange stresses of pin-pin beam exposed to ISO fire

8/3/2019 Temp Changes

http://slidepdf.com/reader/full/temp-changes 121/148

105

7.3 Parametric fire

A more realistic fire with a decay phase was applied on three sides of the beam. The ISO fire

analysis showed that the beams with different support conditions failed at different times after

25 minutes. It is important to understand what would happen to the beam if the fire started to

decay before the beams fail as this is the case in most of the realistic fire situations.

For the chosen parametric fire as illustrated in Figure 4.5, a twenty minute burning period was

adopted where the fire grew following the ISO fire curve and then decayed at 625oC per hour

as defined according to the Eurocode reference decay rate (EC1, 1994) as shown in

Figure 2.17.

Shown below in Figures 7.12 and 7.13 are the deflection and bending moment patterns of four

beams with different support conditions subjected to this ISO fire with a decay phase. For the

first 20 minutes, which represented the burning period following the ISO fire curve, the

deflections were exactly the same as those in section 7.2.

When the fire decayed, the deflections recovered. The fix-slide beam that had very little

deflection even after 20 minutes into the ISO fire, recovered completely to the deflection at

ambient condition, because no plastic hinge had formed during the 20 minutes of burning.

The other three beams had permanent deformations because the stresses reached the

proportional limit at the burning period and plastic hinges started to form. In the pin-pin case

where there was no rotational restraint at the supports and the beam had large deformation and

yielded fairly quickly, the permanent deformation was much more obvious.

The moment of the pin-roller beam stayed constant as expected, while the fix-fix and fix-slide

moments varied due to yielding, compression by thermal elongation and tension during the

cooling phase. The pin-pin case in particular is discussed below in more detail and compared

with the failure of the beam exposed to the ISO fire as discussed in the previous section.

8/3/2019 Temp Changes

http://slidepdf.com/reader/full/temp-changes 122/148

106

Midspan deflection

-500

-400

-300

-200

-100

0

0 20 40 60 80 100 120

Time (minutes)

   D  e   f   l  e  c   t   i  o

  n   (

pin-roller pin-pin fix-fix fix-slide


Figure 7.12 Midspan deflection of all beams subjected to a parametric fire

Midspan moment

-800

-400

0

400

800

0 20 40 60 80 100 120

Time (minutes)

   M  o  m  e  n   t   (   k

pin-roller pin-pin fix-fix fix-slide

 Figure 7.13 Midspan moment of all beams subjected to a parametric fire

It can be seen from Figure 7.14 that after 20 minutes when the fire temperature started to

reduce, the beam deflection recovered to a certain permanent deformation. Figures 7.15 and

7.16 show bending moment diagram and the axial force. The analysis was terminated at 120

minutes, as what happened thereafter was not a matter of interest.

At the start of the cooling phase, the axial force stayed constant for a period of time, as there

was no increase in temperature in the beam, therefore limiting the thermal expansion effect.

This plateau indicated the thermal lag experienced by the steel beam. The cooling process in

the beam did not occur straight away as the fire decayed. The P-∆ action was governed by the

axial force causing the bending moment to stay constant up to about 40 minutes.

8/3/2019 Temp Changes

http://slidepdf.com/reader/full/temp-changes 123/148

107

Upon cooling, the thermal expansion recovered and the beam was now in tension as it pulled

back in due to shrinkage (Figure 7.16). This tension force was very large and it could be a big

problem for the connections. This issue was discussed by Rotter et al. (1999) that plastification

of the steel beam leads to very high tensile stresses that may cause rupture damage to the

connections after cooling. The connections have to be strong in tension, or very ductile to

avoid this failure, which is opposite to the common assumption that connection would be in

compression due to thermal expansion.

The bending moment at the cooling phase followed the trend of the axial force resulting in

very high hogging moment, shown in Figure 7.15.

Deflection of pin-pin beam

-600

-400

-200

0

0 20 40 60 80 100 120

Time (minutes)

   D  e   f   l  e  c   t   i  o  n   (  m

ISO fire Parametric fire


Figure 7.14 Deflection of pin-pin beam subjected to ISO and Parametric fires

Midspan moment of pin-pin beam

-800

-400

0

400

800

0 20 40 60 80 100 120

Time (minutes)

   M  o  m

  e  n   t   (   k   N .

ISO fire Parametric fire


Figure 7.15 Midspan moment of pin-pin beam subjected to ISO and Parametric fires

8/3/2019 Temp Changes

http://slidepdf.com/reader/full/temp-changes 124/148

108

Axial force of pin-pin beam

-6000

-3000

0

3000

6000

0 20 40 60 80 100 120

Time (minutes)

   A  x   i  a   l   f  o  r  c  e   (

ISO fire Parametric fire


Figure 7.16 Axial force of pin-pin beam subjected to ISO and Parametric fires

8/3/2019 Temp Changes

http://slidepdf.com/reader/full/temp-changes 125/148

109

7.4 Three and four sided heating

Using the exposure to the standard ISO fire, the behaviour of the same beams heated on four

sides was compared to those heated on the three sides. Four sided heating provides more

uniform temperature across the beam cross section in contrast with the three sided heating

where there is thermal gradient across the cross section causing thermal bowing as the top

flange will be relatively cooler than the rest of the section.

In real construction, a concrete slab is commonly attached to the steel beam, either simply

supported or composite. Composite steel beam and concrete slab is one example of extreme

three sided heating as concrete has very high heat sink, which keeps the top flange of the steel

beam relatively cool and thus generates a high thermal gradient in the steel beam (Welsh,2001).

In Figure 7.17, the midspan deflections of the beams with four different types of support

condition were plotted, showing the comparison between the three and four sided heating. The

patterns of the deflection evolution are very similar for the three and four sided heating for

each case. The beams with pin-pin and fix-fix supports show a very similar trend in both

cases. On the other hand, the pin-roller and fix-slide beams show earlier failure for the four

sided heating.

Midspan deflection

Fix-fixFix-slide

Pin-rollerPin-pin

-600

-400

-200

0

0 10 20 30 40 50

Time (mins)

   D  e   f   l  e  c   t   i  o  n   (

Pin-roller (3) Pin-pin (3) Fix-fix (3) Fix-s lide (3)

Pin-roller (4) Pin-pin (4) Fix-fix (4) Fix-s lide (4)


Figure 7.17 Midspan deflection of all beams exposed to ISO fire on 3 and 4 sides

8/3/2019 Temp Changes

http://slidepdf.com/reader/full/temp-changes 126/148

110

For the beam with pin-roller supports, four sided heating caused less deflection at the start due

to uniform heating and no thermal bowing, but at a later stage it caused larger deflections and

earlier failure due to higher average temperature in the section. There is no certain

explanation on the fact that this beam had much larger deflection at failure compared with the

three sided case, most likely it was merely a computational effect.

For the pin-pin and fix-fix beams, there were only slight differences for three and four sided

exposure due to the presence of axial restraint. There is no thermal bowing in the four sided

case because of more uniform temperature along the cross section.

The bending moment of the pin-roller beam stayed constant regardless of the number of the

fire exposed sides. The bending moment of the pin-pin beams are shown in Figure 7.18. Prior

to yielding of the midspan, the trend of the bending moment was the same for both cases.

Thereafter the four sided moment decreased more rapidly due to rapid reduction in the axial

force illustrated in Figure 7.21. Higher average temperature in the cross section caused the

section to lose its strength and stiffness faster.

In the fix-fix case, the four sided beam had much more uniform moment throughout the

exposure as shown in figure 7.19. Given roughly the same amount of axial compression

(Figure 7.22), the absence of thermal bowing effect led to the same elongation rate between

the top and bottom flanges. The three sided one, on the other hand, experienced a series of 

moment alterations mainly due to the thermal gradient inducing high stresses. The moment

changed rapidly upon yielding of the flanges as fix-fix beam was very sensitive to the stresses

reaching the proportional limit.

From the deflection point of view, both the fix-slide beams behaved almost the same way,

only the four sided beam failed sooner at about the same amount of deflection. The bending

moment of the fix-slide beams shown in Figure 7.20 were very interesting to compare. The

three sided beam developed large hogging moment due to thermal bowing as discussed in

8/3/2019 Temp Changes

http://slidepdf.com/reader/full/temp-changes 127/148

111

section 5.5 that disappeared when the temperature in the beam was roughly uniform. The four

sided beam had constant moment due to the absence of thermal bowing effect. The moment

altered slightly towards failure to obtain moment balance between the midspan and the ends of 

the span of wL2 / 16, which was the value reached by the three sided beam at failure.

Midspan moment of pin-pin beam

-800

-600

-400

-200

0

0 10 20 30 40 50

Time (mins)

   M  o  m  e  n   t   (   k

Pin-pin (3) Pin-pin (4)


Figure 7.18 Midspan moment of pin-pin beam heated on 3 and 4 sides

Midspan moment of fix-fix beam

-400

-300

-200

-100

0

100

0 10 20 30 40 50

Time (mins)

   M  o  m  e  n   t   (   k

fix-fix (3) Fix-fix (4)


Figure 7.19 Midspan moment of fix-fix beam heated on 3 and 4 sides

8/3/2019 Temp Changes

http://slidepdf.com/reader/full/temp-changes 128/148

112

Midspan moment of fix-slide beam

-200

0

200

400

0 10 20 30 40 50

Time (mins)

   M  o  m  e  n   t

   (   k

Fix-slide (3) Fix-slide (4)


Figure 7.20 Midspan moment of fix-slide beam heated on 3 and 4 sides

Axial force of pin-pin beam

-5000

-3000

-1000

1000

0 10 20 30 40 50

Time (mins)

   A  x   i  a   l   f  o  r  c  e

Pin-pin (3) Pin-pin (4)

 Figure 7.21 Axial force of pin-pin beams heated on 3 and 4 sides

Axial force of fix-fix beam

-5000

-4000

-3000

-2000

-1000

0

0 10 20 30 40 50

Time (mins)

   A  x   i  a   l   f  o  r  c  e

fix-fix (3) fix-fix (4)


Figure 7.22 Axial force of fix-fix beams heated on 3 and 4 sides

8/3/2019 Temp Changes

http://slidepdf.com/reader/full/temp-changes 129/148

113

8. Comparison of different applied loads

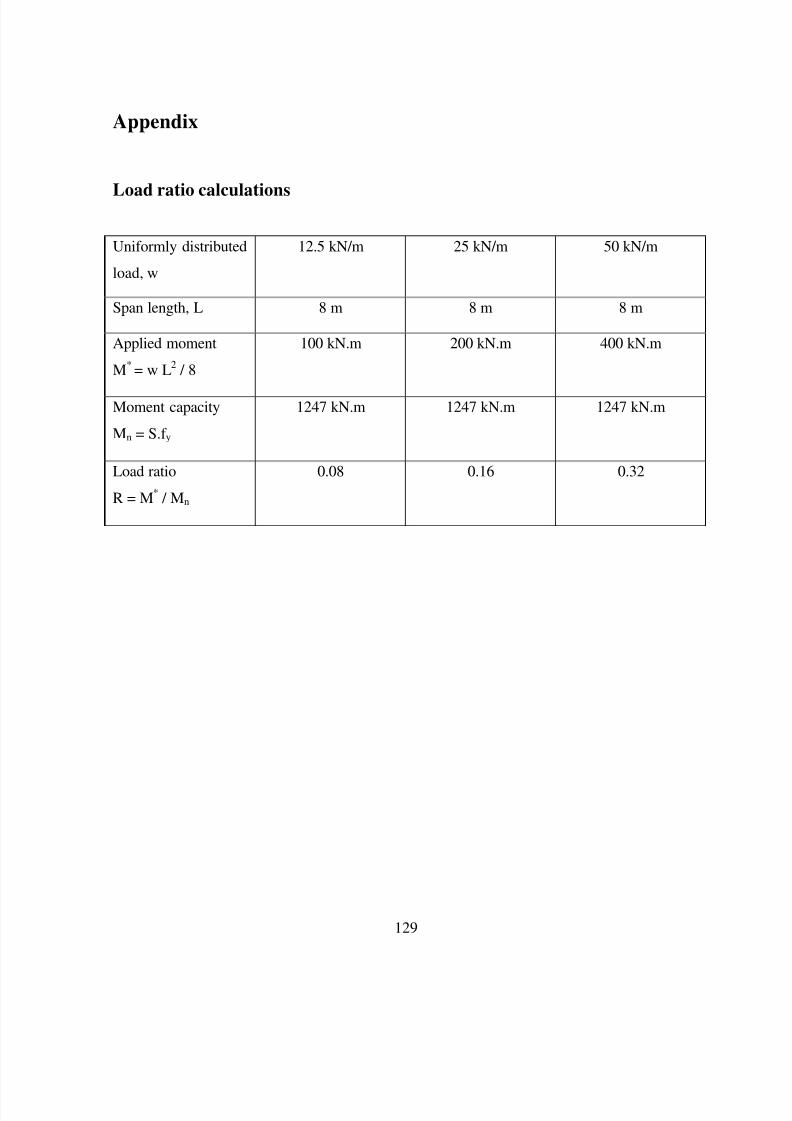
The loading used as the base case for all the analyses above is the uniformly distributed load

of 25 kN/m. In this chapter, the behaviour of the same beams with uniform loads of 12.5 and50 kN/m are compared with that of the base case. The load ratios at cold condition are 0.08,

0.16 and 0.32 for 12.5, 25 and 50 kN/m applied loading respectively with the detailed

calculation shown in the appendix. These ratios are low and the beams are expected to have

high fire resistance capacity.

SAFIR analyses showed that when the load was halved or doubled, the trends of the

deflections, moments, and the axial forces stayed the same as expected. The beam with the

heavier load had greater deflections, especially towards failure, greater bending moments, both

positive and negative, and greater axial load. It failed earlier as opposed to the one with the

lighter load that failed later.

The case of the fix-fix beam are shown below in Figures 8.1 – 8.4 for comparison. The other

beams with different support conditions had very similar behaviour, with the trends illustrated

and discussed in chapter 5.

Greater deflection and bending moments on the beam with heavier loading were expected and

very much self-explanatory. The axial force was induced in the beam due to thermal

expansion as the beam was restrained, and therefore had nothing to do with the amount of 

loading on the beam. This applied up to the point where the first plastic hinge started to form,

and from here on, the beam with heavier load would lose its stiffness faster and consequently

had more rapid reduction in the axial force.

8/3/2019 Temp Changes

http://slidepdf.com/reader/full/temp-changes 130/148

114

Midspan deflection

-300

-200

-100

0

0 20 40 60 80 100

Time (minutes)

   D  e   f   l  e  c   t   i  o  n   (  m

12.5 kN/m 25 kN/m 50 kN/m


Figure 8.1 Midspan deflection of fix-fix beam under different loading

Midspan moment

-400

-200

0

200

0 20 40 60 80 100

Time (minutes)

   M  o  m  e  n   t   (   k   N .

12.5 kN/m 25 kN/m 50 kN/m


Figure 8.2 Midspan moment of fix-fix beam under different loading

Endspan moment

0

100

200

300

400

0 20 40 60 80 100

Time (minutes)

   M  o  m  e  n   t   (   k   N .

12.5 kN/m 25 kN/m 50 kN/m


Figure 8.3 Endspan moment of fix-fix beam under different loading

8/3/2019 Temp Changes

http://slidepdf.com/reader/full/temp-changes 131/148

115

Axial force

-6000

-4000

-2000

0

0 20 40 60 80 100

Time (minutes)

   A  x   i  a   l   f  o  r  c  e   (   k

12.5 kN/m 25 kN/m 50 kN/m


Figure 8.4 Axial load of fix-fix beam under different loading

8/3/2019 Temp Changes

http://slidepdf.com/reader/full/temp-changes 132/148

116

9. Comparison of various line of thrust locations

All the above analyses discussed in chapter 5–8 considered that the steel beams were

supported at the mid height of the section. However, different elements may have differentlocation of supports, depending on how they are supported as described by Buchanan (2000)

and illustrated in Figure 9.1.

Figure 9.1 Lines of thrust for several support conditions (Buchanan, 2000)

The SAFIR pre-processor assumes the line of thrust to be at the mid height of the section by

default. In this chapter the effect of the variation in the line of support is investigated. The

same beams with four different end conditions subjected to linear heating of 10oC/minute were

supported at a quarter up and a quarter down from the mid depth of the section. Typical results

are illustrated in Figures 9.2 – 9.4, and the results were compared with the base case.

The analyses showed that the beams with pin-roller and fix-slide support conditions had

exactly the same behaviour regardless of where they were supported because there was no

axial force induced in the beams. Some variations were found in the pin-pin and fix-fix

supported beams.

8/3/2019 Temp Changes

http://slidepdf.com/reader/full/temp-changes 133/148

117

When the supports of a beam are fully fixed and the beam is loaded, there are several actions

interacting within the beam. There is bending moment due to the applied loading to start with,

and thermal expansion causes additional moment due to P-∆ effect. Fix-fix supports allow the

beam to re-adjust its line of thrust to balance the internal forces. Fixing a certain line of thrust

in fact only adds the complication in the internal actions and the behaviour of the beam

becomes very difficult to analyse.

The effect of the line of thrust location on a fix-fix beam needs to be investigated further

considering different components of the bending moment. This involves a broad range of 

analyses and could not be included in this project mainly due to the time constraint.

The deflection pattern, bending moment and axial force comparisons for the pin-pin beam are

shown in Figures 9.2 – 9.4. The bottom curve in each graph shows the base case where the

line of thrust was at the neutral axis of the section as discussed in section 5.3.

When the beam was supported at a quarter up the mid height of the section, some of the

moment due to bending and axial compression cancelled each other out resulting in the

deflection, bending moment and axial force being not as large as those of the base case. The

axial force, as shown in Figure 9.4, started in tension due to the bending induced by the load.

This beam had more deformation only at the earlier time into the fire as a result of less

restraint at the bottom flange when subjected to thermal elongation.

Supported at a quarter down the mid height of the section, the beam showed different

behaviour from the earlier cases. The thermal elongation caused the shift in bending moment

to a hogging moment due to the P-∆ effect, because the line of thrust was below the neutral

axis. The P-∆ effect governed the moment as soon as the deflection increased.

The thermal elongation and the axial restraint caused very large axial compression at the

bottom flange. The stress of the bottom flange reached the proportional limit earlier and

8/3/2019 Temp Changes

http://slidepdf.com/reader/full/temp-changes 134/148

118

lessened the axial force. The hogging moment, however, kept increasing and the beam was

hogging up.

Upon yielding at the midspan, the axial force dropped even more causing the sagging moment

to increase and the deflection recovered. The early loss of strength caused the beam to fail

earlier in compared with the beam supported at the mid height or a quarter up the mid height

of the cross section.

Midspan deflection

-1000

-750

-500

-250

0

250

0 20 40 60 80 100

Time (mins)

   D  e   f   l  e  c   t   i  o  n   (

up 1/4 0 down 1/4


Figure 9.2 Midspan deflection of pin-pin beam with different lines of thrust

Midspan moment

-800

-600

-400

-200

0

200

0 20 40 60 80 100

Time (minutes)

   M  o  m  e  n   t   (   k

up 1/4 0 down 1/4  

Figure 9.3 Midspan moment of pin-pin beam with different lines of thrust

8/3/2019 Temp Changes

http://slidepdf.com/reader/full/temp-changes 135/148

119

Midspan axial force

-4500

-3000

-1500

0

1500

0 20 40 60 80 100

Time (mins)

   A  x   i  a   l   f  o  r  c  e

up 1/4 0 down 1/4


Figure 9.4 Axial force of pin-pin beam with different lines of thrust

Figures 9.5 and 9.6 show the stresses at the top and bottom flanges respectively for the abovecase. The bottom flange reached the proportional limit at 25 minutes and it never actually

reached yield, but decreased parallel to the yield envelope. The top flange did not reach the

proportional limit until 75 minutes and it nearly yielded when the analysis was terminated at

80 minutes, which was most likely due to some numerical instability in the program.

Top stresses of pin-pin beam

-200

0

200

400

600

0 20 40 60 80 100

midspan (reversed) prop. limit yield env


Figure 9.5 Top flange stresses of pin-pin beam supported ¼ down from mid height

8/3/2019 Temp Changes

http://slidepdf.com/reader/full/temp-changes 136/148

120

Bottom stresses of pin-pin beam

-200

0

200

400

600

0 20 40 60 80 100

midspan (reversed) prop. limit yield env


Figure 9.6 Bottom flange stresses of pin-pin beam supported ¼ down from mid height

8/3/2019 Temp Changes

http://slidepdf.com/reader/full/temp-changes 137/148

121

10. Problems

A few problems were encountered during the analyses using the SAFIR program:

1. The recorded output such as moments, axial forces, or stresses are on the integrationpoints, which in case of coarser discretisation may not give the exact properties at a

particular point of interest.

2. Diamond 2000 is unable to display the fibre stresses from the *.OUT file, therefore

Microsoft Excel spreadsheet was used to extract the required information.

3. Discontinuity was found in the spring model with stiffness of 20% of the beam stiffness

that may be due to some numerical error in the stiffness matrix in the program. This

requires further investigations in future research.

4. Premature terminations were encountered in some of the analyses that may be caused by

some instability in the stiffness matrix.

5. The effect of the line of support locations, especially for the fix-fix beam, could not be

thoroughly explained due to the complex behaviour and further analyses are needed to

verify the detailed behaviour.

6. Some results showed great complications as so many actions were interacting and the

trend behaviour of the beam became rather difficult to accurately analyse.

8/3/2019 Temp Changes

http://slidepdf.com/reader/full/temp-changes 138/148

122

11. Conclusions and recommendations

The behaviour of a steel beam at elevated temperatures was found to be complex and very

difficult to analyse accurately. Using the finite element program SAFIR, an unprotected steelbeam was exposed to simulated fire conditions, with a number of parameters being varied:

♣ Pin-roller, pin-pin, fix-fix and fix-slide support conditions.

♣ A spring introduced at the roller end of the pin-roller beam to model an intermediate case

between pin-roller and pin-pin beams.

♣ Various applied fires including linear heating rates of 10, 20 and 30oC / minute, the

standard ISO fire and a parametric fire which is the ISO fire with a decay phase.

♣ Three and four sided heating.

♣ Applied loading of 12.5, 25 and 50 kN/m.

♣ Different locations of line of thrust, at mid height, at a quarter up and down the mid

height.

11.1 General behaviour

The beam supported by pin-roller has no axial restraint, and therefore is not effected by the P-

∆ action. The behaviour of this beam is predictable and runaway failure occurs when oneplastic hinge is formed at the midspan. Pin-roller beam fails the earliest compared with the

other supports.

The fix-slide beam also has no axial restraint and hence has no P-∆ effect. However, it has

more complex behaviour because of the progressive formation of plastic hinges. The

behaviour is sensitive to the reduction in proportional limit stress and yield stress of steel at

elevated temperatures.

The pin-pin and fix-fix beams are axially restrained and axial force is induced along the beams

due to thermal expansion. There is a complex interaction between the axial force, deflection

and bending moment, all of which change during fire exposure. This behaviour could not be

8/3/2019 Temp Changes

http://slidepdf.com/reader/full/temp-changes 139/148

123

predicted without a program like SAFIR. The times at which flange stresses reach the

proportional limit have a significant effect on the sequence of these events during the fire. In

fire conditions, the pin-pin beam shows very ductile behaviour and survives the longest in

comparison with the other types of support. However, the pin-pin beam undergoes very large

deformations which may be unacceptable.

11.2 Effect of spring

When a spring is introduced, the beam becomes an intermediate case between the pin-roller

and pin-pin beams. The behaviour of a beam with relative spring stiffness of 20% or less is

somewhere in between that of the pin-roller and pin-pin beams.

Analysis of beam with axial spring restraint was difficult for two reasons, the SAFIR program

was consistently terminated after 40 minutes, and the behaviour of very soft springs was

similar to the pin-roller condition, while the behaviour of stiffer springs was similar to the pin-

pin condition. There was a very sudden transition between the two behaviours at k=0.195.

Further investigation is required to explain such discontinuity and other significant effect of 

the additional spring.

11.3 Effect of different applied fires

When a steel beam is exposed to a hotter fire, it behaves in a similar way but fails earlier, as

expected. Faster heating on three sided exposure also causes a higher thermal gradient across

the section and the resulting thermal bowing produces a very high compressive force

especially on the bottom flange.

If the fire decays before the beam fails, the deformation and the steel strength will recover.

Permanent deformation occurs when part of the beam has been strained beyond its elastic

limit. The cooling phase causes shortening in the beam, which can be dangerous in the pin-pin

and fix-fix cases as it may cause tensile rupture of the end connections. It is recommended that

8/3/2019 Temp Changes

http://slidepdf.com/reader/full/temp-changes 140/148

124

the design of steel connections for fire condition, especially those providing axial restraint, be

sufficiently ductile to resist this large tension force.

11.4 Effect of different applied loads

At ambient conditions, there is no obvious physical difference when the load on the beam is

changed except larger deflections. The bending moment is proportional to the load, and the

load does not affect the thermal elongation of the beam. A beam with high loads tends to fail

faster than with light loads due to higher stresses, as expected.

11.5 Effect of the line of thrust locationThe change in the line of thrust location only affect beams with axial restraint, where P-∆ 

effects are induced in the beam. For the pin-pin beam, an increase in support height causes less

deflection, moment and axial force in the beam as the effect of the thermal elongation is

cancelled out by the bending stresses. A lower support height causes increased axial

compression stress in the bottom flange, as the effect of thermal expansion is enhanced by the

stresses due to the loading. This beam fails earlier because of the very high stresses in the

bottom flange.

8/3/2019 Temp Changes

http://slidepdf.com/reader/full/temp-changes 141/148

125

12. Recommendations for future research

It is recommended that the following aspects be taken into account in the future research:

1. The analyses of multi-span beams and frame structures.2. Three dimensional analysis of the beams.

3. Various location of fire within the structure allowing investigation of neighbouring cooler

elements.

4. More realistic fires taking account of different fuel loads and ventilation.

5. Intermediate cases between pin-pin and fix-fix support conditions by introducing some

rotational springs.

6. Further investigation on the variation of the line of thrust locations, including the

possibility of self-adjustment due to the elevated temperature, to explain the problems

encountered in this project.

7. Comparisons with analyses of composite structures, observing the enhanced behaviour due

to the composite actions.

8. Comparisons between the computer analysis and laboratory test results to validate the

computer modelling.

9. Investigation of the validity of the current steel design based on the analysis results.

8/3/2019 Temp Changes

http://slidepdf.com/reader/full/temp-changes 142/148

126

13. References

BHP Co. Pty Ltd. Hot Rolled and Structural Steel Products

. 98 ed. Australia.

British Steel Plc. (1999) The Behaviour of Multi-storey Steel Framed Buildings in Fire.

Swinden Technology Centre, South Yorkshire, United Kingdom.

Buchanan, A.H.(2000) Structural Design for Fire Safety. School of Engineering, University of 

Canterbury, Christchurch, New Zealand.

Buchanan, A.H.(Ed) (1994). Fire Engineering Design Guide. Centre for Advanced

Engineering, University of Canterbury, Christchurch, New Zealand.

Building Industry Authority (1992). New Zealand Building Code Handbook and Approved 

 Documents. Building Industry Authority, Wellington, New Zealand.

Clifton, C. (1999) Key Aspects of the Behaviour of a Multi-storey Steel Framed Building

Subject to Fully Developed Natural Fires. HERA Steel Design and Construction

 Bulletin, No. 48, 3-13 pp.

EC1 (1994). Eurocode 1:  Basis of Design and Design Actions on Structures. ENV 1991-2-2

Part 2-2: Actions on Structures Exposed to Fire. European Committee for

Standardization, Brussels.

EC3 (1995). Eurocode 3:   Design of steel structures. ENV 1993 Part 1-2: General rules –

structural fire design. European Committee for Standardization, Brussels.

Franssen, J.M. (2000) SAFIR Seminar Notes. University of Canterbury, Christchurch, New

Zealand.

8/3/2019 Temp Changes

http://slidepdf.com/reader/full/temp-changes 143/148

8/3/2019 Temp Changes

http://slidepdf.com/reader/full/temp-changes 144/148

128

Rotter, J.M., Sanad, A.M., Usmani, A.S., Gillie, M. (1999). Structural Performance of 

Redundant Structures under Local Fires.   Interflam ’99, Proceedings of the Eighth

 International Conference (Scotland, 29th June-1st July 1999), p.1069-1080.

Rotter, J.M., Usmani, A.S.(2000). Fundamental Principles of Structural Behaviour Under

Thermal Effects. First International Workshop on Structures in Fire (Copenhagen –

 June) (as Report TM2).

Sanad, A.M., Rotter, J.M., Usmani, A.S., O’Connor, M.A. (1999) Finite Element Modelling of 

Fire Tests on the Cardington Composite Building.   Interflam ’99, Proceedings of the

 Eighth International Conference, p.1045-1056.

Welsh, R.D. (2001) 2-D Analysis of Composite Steel-Concrete Beams in Fire. Fire

Engineering Research Report. School of Engineering, University of Canterbury,

Christchurch, New Zealand.

8/3/2019 Temp Changes

http://slidepdf.com/reader/full/temp-changes 145/148

129

Appendix

Load ratio calculations

Uniformly distributed

load, w

12.5 kN/m 25 kN/m 50 kN/m

Span length, L 8 m 8 m 8 m

Applied moment

M* = w L2 / 8

100 kN.m 200 kN.m 400 kN.m

Moment capacity

Mn = S.f y 

1247 kN.m 1247 kN.m 1247 kN.m

Load ratio

R = M*

/ Mn 

0.08 0.16 0.32

8/3/2019 Temp Changes

http://slidepdf.com/reader/full/temp-changes 146/148

130

A typical *.DAT input file for the thermal analysis 

Profile type: User

Fire curve: FISO; Values of faces exposured:1 1 1 0

Protected with: 0 mm; 0 mm; 0 mm;

NPTTOT 412

NNODE 280

NDIM 2

NDIMMATER 1

NDDLMAX 1

FROM 1 TO 280 STEP 1 NDDL 1

TEMPERAT

TETA 0.9

TINITIAL 20.0

MAKE.TEM

LARGEUR11 40000

LARGEUR12 100

NORENUM

FISO.str

FISO.tem

PRECISION 1.E-3

TIME

10. 7200.

ENDTIME

IMPRESSION

TIMEPRINT 30.

8/3/2019 Temp Changes

http://slidepdf.com/reader/full/temp-changes 147/148

131

A typical *.DAT file for the structural analysis 

Profile type: 610UB101

Fire curve: 10deg.fct; Values of faces exposured:1 1 1 0

Protected with: 0 mm; 0 mm; 0 mm;

NPTTOT 8240

NNODE 41

NDIM 2

NDIMMATER 1

NDDLMAX 3

FROM 1 TO 41 STEP 2 NDDL 3

FROM 2 TO 40 STEP 2 NDDL 1

STATIC

NLOAD 1

OBLIQUE 0

COMEBACK 1.

NARCLENGTH .02

LARGEUR11 426

LARGEUR12 10

NORENUM

pinpin10.str

PRECISION 1.E-3LOADS

FUNCTION F1

DISTRBEAM 1 . -25E3

DISTRBEAM 20 . -25E3 1

TIME

5. 3600.

10. 7200.

ENDTIME

LARGEDISPL

EPSTH

IMPRESSION

TIMEPRINT 30.

PRINTMN

PRINTREACT

8/3/2019 Temp Changes

http://slidepdf.com/reader/full/temp-changes 148/148

A typical *.STR file for the structural analysis

Profile type: 610UB101

NMAT 1

ELEMENTS

BEAM 20 1

NG 2

NFIBER 206

NODES

NODE 1 0.00000 0.00000

NODE 41 8.00000 0.00000 1

FIXATIONS

BLOCK 1 F0 F0

BLOCK 41 F0 F0

NODOFBEAM

10.tem

TRANSLATE 1 1


Recommended