AC 2011-1392: TEMPERATURE ALARM LABORATORY DESIGN PROJECT FOR A CIRCUIT ANALYSIS COURSE IN A GENERAL ENGINEERING CURRICULUM Loren Limberis, East Carolina University Dr. Limberis joined the Engineering faculty at ECU in August 2006. He earned his B.S. in electrical engineering and Ph.D. in bioengineering from the University of Utah. Dr. Limberis taught for several years as an Assistant Professor at The College of New Jersey and was a research analyst with Southwest Research Institute prior to his academic career. His research interests focus on designing techniques to utilize nature’s highly complex and sophisticated biological systems to develop biohybrid devices for use in biotechnology applications. Jason Yao, East Carolina University Dr. Jianchu (Jason) Yao joined the Department of Engineering at East Carolina University as an Assistant Professor in August, 2005. He received a B.S. and M.S. degrees in electrical engineering from Shaanxi university of Science and Technology, China, in 1992 and 1995, respectively, and the Ph.D. degree in elec- trical engineering from Kansas State University in 2005. His research interests include wearable medical devices, telehealthcare, bioinstrumentation, control systems, and biosignal processing. His educational research interests are laboratory/project-driven learning and integration of research into undergraduate education. Dr. Yao is a member of the American Society of Engineering Education and a senior member of Institute of Electrical and Electronics Engineers. c American Society for Engineering Education, 2011 Page 22.1420.1
Transcript
AC 2011-1392: TEMPERATURE ALARM LABORATORY DESIGN PROJECTFOR A CIRCUIT ANALYSIS COURSE IN A GENERAL ENGINEERINGCURRICULUM
Loren Limberis, East Carolina University
Dr. Limberis joined the Engineering faculty at ECU in August 2006. He earned his B.S. in electricalengineering and Ph.D. in bioengineering from the University of Utah. Dr. Limberis taught for severalyears as an Assistant Professor at The College of New Jersey and was a research analyst with SouthwestResearch Institute prior to his academic career. His research interests focus on designing techniques toutilize nature’s highly complex and sophisticated biological systems to develop biohybrid devices for usein biotechnology applications.
Jason Yao, East Carolina University
Dr. Jianchu (Jason) Yao joined the Department of Engineering at East Carolina University as an AssistantProfessor in August, 2005. He received a B.S. and M.S. degrees in electrical engineering from Shaanxiuniversity of Science and Technology, China, in 1992 and 1995, respectively, and the Ph.D. degree in elec-trical engineering from Kansas State University in 2005. His research interests include wearable medicaldevices, telehealthcare, bioinstrumentation, control systems, and biosignal processing. His educationalresearch interests are laboratory/project-driven learning and integration of research into undergraduateeducation. Dr. Yao is a member of the American Society of Engineering Education and a senior memberof Institute of Electrical and Electronics Engineers.
Temperature Alarm Laboratory Design Project for a Circuit
Analysis Course in a General Engineering Curriculum
Abstract
We have developed and delivered an integrated multi-week operational amplifier-based
laboratory design project as a means to enrich our students with an electrical engineering design
experience within our general engineering program. The design project is presented in a circuit
analysis course, which is only one of two electrical engineering-based core courses in our
program, the other being a combined instrumentation and control systems course. Our goals are
to support the outcomes of the program with sufficient coverage of electrical engineering topics
within these two courses and to ensure the success of our students as well-rounded engineers by
covering key topical design areas. This design project is one of the critical components in
achieving these goals.
The students are assigned to design a temperature alarm system that measures air temperature
and provides an alert when the temperature exceeds certain upper and lower limits. The multi-
week format is used to integrate successive stages of the instrumentation system into digestible
design tasks. This helps the students hone their design skills by focusing on one aspect of the
entire system design and making appropriate connections on how each stage impacts the
behavior of their entire system. Each stage of the system focuses on different applications of
operational amplifiers. The first design stage is the development of an operational amplifier-
based Wheatstone bridge circuit consisting of a resistive network that contains a thermistor as the
sensor. The second design stage is the linearization of the thermistor-based Wheatstone bridge
circuit. Since the resistance of a thermistor is an exponential function of temperature the
students are required to design the resistive network of their amplified bridge circuit to meet
specific linearization requirements. The students develop and use their own MATLAB models
to test their circuit designs and characterize the responses with respect to temperature. The third
design stage is the development of a circuit that compares the output voltage of the amplification
thermistor circuit with voltages representing specific temperature upper and lower limits. The
fourth stage is the design of an alarm circuit that alerts the operator with LEDs when the
measured temperature is out of range. The design loop is then closed by integrating, testing, and
characterizing the entire alarm system followed by a formal report describing the work of the
project. Our assessment of how this laboratory experience impacts the students’ ability to meet
the course objectives and the program outcomes is based on: 1) How well the students
communicate specific design aspects in the formal report; 2) How well they communicate their
linearization methods using MATLAB; 3) A survey on how well the students believe they are
meeting the course objectives associated with the laboratory project; and, 4) the successful
completion of embedded questions in quizzes the final exam associated with the design project.
Introduction
The general engineering program at East Carolina University was started in 2004 to help support
the need of broadly-skilled, general engineers for the regional industries and business located
among the small towns of eastern North Carolina. The philosophy of the general engineering
program, which is structured to fulfill this need and to enhance sustained growth in regional
Page 22.1420.2
economic development, is best presented by Kauffmann et. al.1: “Instead of traditional
engineering disciplines, these operations require engineering generalists with a strong theoretical
background, broad knowledge in a range of areas, and specific skills in problem solving to give
them a sound but flexible base for managing and implementing technology change and
operations.” The mission of East Carolina University’s Department of Engineering is “to
provide a theory-based, application-oriented general engineering education that serves as a basis
for career success and lifelong learning. Our graduates demonstrate the engineering and
scientific knowledge to analyze, design, improve and evaluate integrated technology-based
systems.”2 To help support the objectives of the general engineering program, a common core of
courses that develops the fundamental engineering skills was developed and implemented. This
core curriculum is used as the foundation for four concentrations that build specialized
knowledge in growth areas within the region: industrial and systems engineering, bioprocess
engineering, biomedical engineering, and mechanical engineering.
Within the core curriculum, we have developed and implemented a two course series of
electrical engineering based courses. The first course is a general circuit analysis course taken
first semester junior year, which is designed to expose students with fundamental electrical
engineering concepts and circuit analysis methods at a system-level.3 The second course in the
series, taken in the second semester junior year, is a combined instrumentation and control
systems course and provides a systems view of instrumentation and control theory and methods.4
Within both electrical courses we strive to relate course topics to practical applications and
emphasize development of hands-on skills with laboratory exercises and project design. These
courses are also designed to support the outcomes of our general engineering program, provide
sufficient coverage of key electrical engineering topics and background for advanced study in the
different concentrations, and to ensure the success of our students as well-rounded engineers.
One of the responsibilities of our core curriculum is to provide meaningful design opportunities
for our students so they may experience engineering design associated with the different core
engineering disciplines. We have developed and delivered an integrated multi-week operational
amplifier-based laboratory design project within the circuit analysis course to address these
responsibilities. The project incorporates the following Learning Objectives: 1) to strengthen
skills in using mathematical knowledge to solve engineering problems; 2) to strengthen skills in
designing experiments; 3) to strengthen skills in conducting experiments; 4) to apply and
improve MATLAB programming skills; 5) develop skills in analyzing, designing, and applying
operational amplifier-based circuits; and 6) develop skills for building prototype circuits on
breadboards. It is anticipated that these objectives will enable the students to gain an experience
of an electrical engineering design environment while also teaching them important skills and
abilities that will further their overall training in the core general engineering curriculum.
Laboratory Development
We chose to focus this laboratory design project on the step-wise design and development of an
operational amplifier-based instrumentation/temperature alarm system. An operational
amplifier-based design was selected because of the versatility of these circuit elements and the
applicability to electric engineering circuit design. This project exposes the students to different
applications of operational amplifiers within the same system and learning how to integrate these
Page 22.1420.3
systems. Our rationale for developing a multi-week format was to provide straightforward design
objectives so that the students could focus their efforts on a single design objective each week
with the combination of each week’s objectives leading to the final system design. The
anticipated outcome upon completion of the multi-week project would be that students would
have developed a better understanding and appreciation of the incredibly useful operational
amplifier and the purpose of each step in the design of an overall system. Furthermore, by
including a sensing element within the system, in this case a thermistor, and including an
instrumentation theme, we have initiated integration between the circuit analysis course and the
subsequent instrumentation and controls course. Our intent is to assist the students in making
meaningful connections between the two courses and to help the students better understand the
applications in electrical engineering based design.
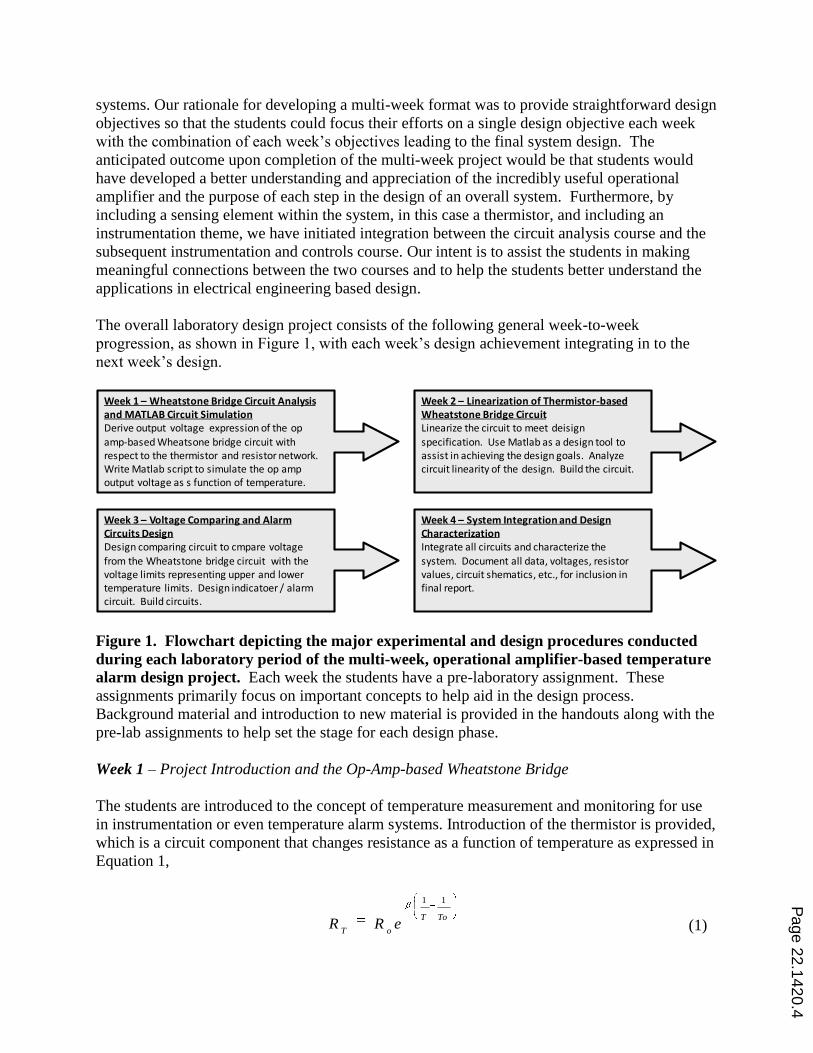
The overall laboratory design project consists of the following general week-to-week
progression, as shown in Figure 1, with each week’s design achievement integrating in to the
next week’s design.
Week 1 – Wheatstone Bridge Circuit Analysis and MATLAB Circuit SimulationDerive output voltage expression of the op amp-based Wheatsone bridge circuit with respect to the thermistor and resistor network. Write Matlab script to simulate the op amp output voltage as s function of temperature.
Week 2 – Linearization of Thermistor-based Wheatstone Bridge CircuitLinearize the circuit to meet deisignspecification. Use Matlab as a design tool to assist in achieving the design goals. Analyze circuit linearity of the design. Build the circuit.
Week 3 – Voltage Comparing and Alarm Circuits DesignDesign comparing circuit to cmpare voltage
from the Wheatstone bridge circuit with the voltage limits representing upper and lower temperature limits. Design indicatoer / alarm circuit. Build circuits.
Week 4 – System Integration and Design CharacterizationIntegrate all circuits and characterize the
system. Document all data, voltages, resistor values, circuit shematics, etc., for inclusion in final report.
Figure 1. Flowchart depicting the major experimental and design procedures conducted
during each laboratory period of the multi-week, operational amplifier-based temperature
alarm design project. Each week the students have a pre-laboratory assignment. These
assignments primarily focus on important concepts to help aid in the design process.
Background material and introduction to new material is provided in the handouts along with the
pre-lab assignments to help set the stage for each design phase.
Week 1 – Project Introduction and the Op-Amp-based Wheatstone Bridge
The students are introduced to the concept of temperature measurement and monitoring for use
in instrumentation or even temperature alarm systems. Introduction of the thermistor is provided,
which is a circuit component that changes resistance as a function of temperature as expressed in
Equation 1,
ToT
oTeRR
11
(1)
Page 22.1420.4
where: T = temperature in Kelvin (K)
To = is a reference temperature (typically 298 K)
= constant (based on the material properties of the thermistor)
Ro = resistance value of RT when T = To (in this project, Ro = 10 k at T = 298K)
These passive elements are small, rugged, inexpensive, and can be manufactured for various
tolerances, temperature ranges, and resistance ranges. We chose to include thermistors in the
project since the students will eventually encounter in their careers a system that uses
thermistors. Although there are many other ways to measure temperature, using the variety of
thermal sensitive components, thermistor-based devices are fairly common. Another reason we
chose to expose the students to thermistors is that they are non-linear devices. The resistance
response with respect to temperature is exponential in nature, as illustrated in Equation 1. One of
the goals of this project is to design a circuit using operational amplifiers to linearize the voltage
response as a function of temperature.
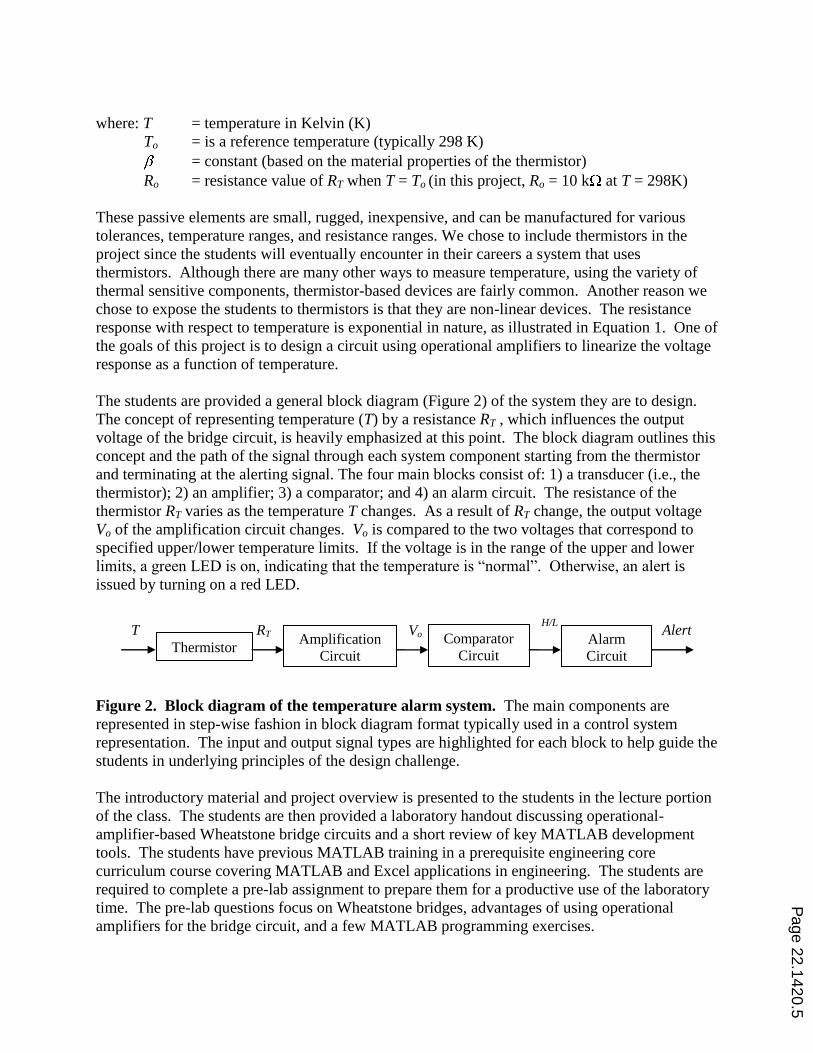
The students are provided a general block diagram (Figure 2) of the system they are to design.
The concept of representing temperature (T) by a resistance RT , which influences the output
voltage of the bridge circuit, is heavily emphasized at this point. The block diagram outlines this
concept and the path of the signal through each system component starting from the thermistor
and terminating at the alerting signal. The four main blocks consist of: 1) a transducer (i.e., the
thermistor); 2) an amplifier; 3) a comparator; and 4) an alarm circuit. The resistance of the
thermistor RT varies as the temperature T changes. As a result of RT change, the output voltage
Vo of the amplification circuit changes. Vo is compared to the two voltages that correspond to
specified upper/lower temperature limits. If the voltage is in the range of the upper and lower
limits, a green LED is on, indicating that the temperature is “normal”. Otherwise, an alert is
issued by turning on a red LED.
Thermistor Amplification
Circuit
Comparator
Circuit Alarm
Circuit
RT Alert Vo T H/L
Figure 2. Block diagram of the temperature alarm system. The main components are
represented in step-wise fashion in block diagram format typically used in a control system
representation. The input and output signal types are highlighted for each block to help guide the
students in underlying principles of the design challenge.
The introductory material and project overview is presented to the students in the lecture portion
of the class. The students are then provided a laboratory handout discussing operational-
amplifier-based Wheatstone bridge circuits and a short review of key MATLAB development
tools. The students have previous MATLAB training in a prerequisite engineering core
curriculum course covering MATLAB and Excel applications in engineering. The students are
required to complete a pre-lab assignment to prepare them for a productive use of the laboratory
time. The pre-lab questions focus on Wheatstone bridges, advantages of using operational
amplifiers for the bridge circuit, and a few MATLAB programming exercises.
Page 22.1420.5
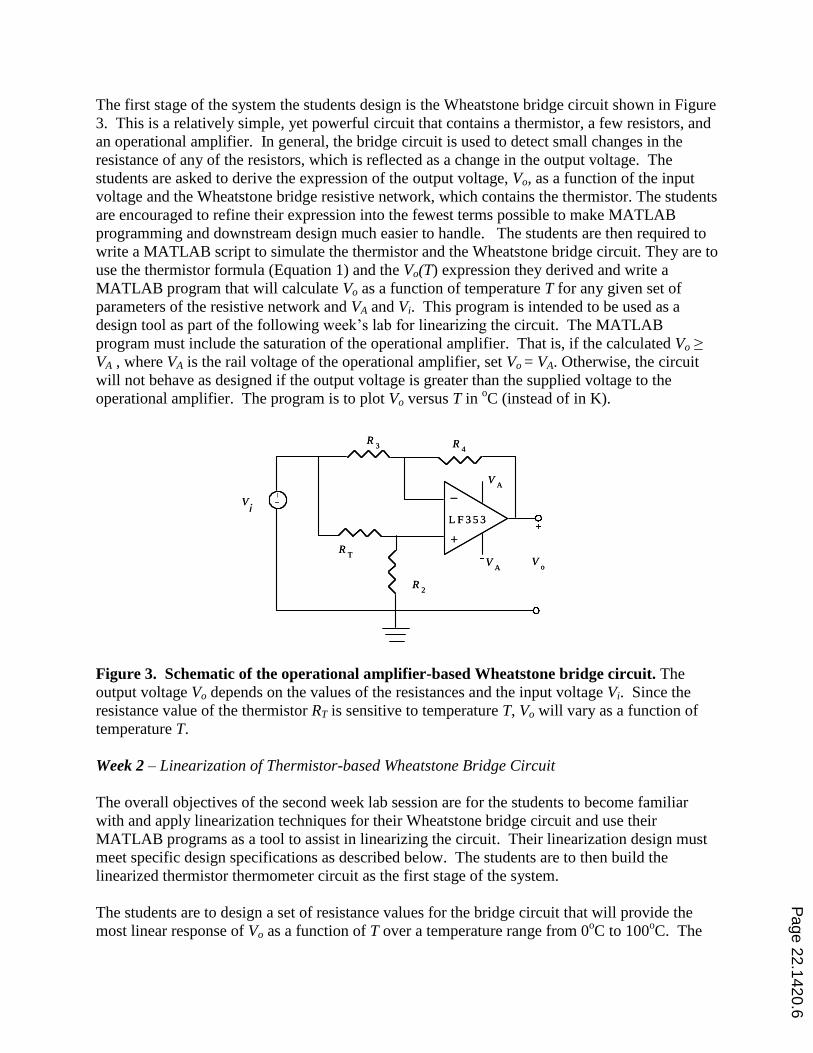
The first stage of the system the students design is the Wheatstone bridge circuit shown in Figure
3. This is a relatively simple, yet powerful circuit that contains a thermistor, a few resistors, and
an operational amplifier. In general, the bridge circuit is used to detect small changes in the
resistance of any of the resistors, which is reflected as a change in the output voltage. The
students are asked to derive the expression of the output voltage, Vo, as a function of the input
voltage and the Wheatstone bridge resistive network, which contains the thermistor. The students
are encouraged to refine their expression into the fewest terms possible to make MATLAB
programming and downstream design much easier to handle. The students are then required to
write a MATLAB script to simulate the thermistor and the Wheatstone bridge circuit. They are to
use the thermistor formula (Equation 1) and the Vo(T) expression they derived and write a
MATLAB program that will calculate Vo as a function of temperature T for any given set of
parameters of the resistive network and VA and Vi. This program is intended to be used as a
design tool as part of the following week’s lab for linearizing the circuit. The MATLAB
program must include the saturation of the operational amplifier. That is, if the calculated Vo ≥
VA , where VA is the rail voltage of the operational amplifier, set Vo = VA. Otherwise, the circuit
will not behave as designed if the output voltage is greater than the supplied voltage to the
operational amplifier. The program is to plot Vo versus T in oC (instead of in K).
Figure 3. Schematic of the operational amplifier-based Wheatstone bridge circuit. The
output voltage Vo depends on the values of the resistances and the input voltage Vi. Since the
resistance value of the thermistor RT is sensitive to temperature T, Vo will vary as a function of
temperature T.
Week 2 – Linearization of Thermistor-based Wheatstone Bridge Circuit
The overall objectives of the second week lab session are for the students to become familiar
with and apply linearization techniques for their Wheatstone bridge circuit and use their
MATLAB programs as a tool to assist in linearizing the circuit. Their linearization design must
meet specific design specifications as described below. The students are to then build the
linearized thermistor thermometer circuit as the first stage of the system.
The students are to design a set of resistance values for the bridge circuit that will provide the
most linear response of Vo as a function of T over a temperature range from 0oC to 100
oC. The
+
_
R4
Vo
R3
R2
RT
VA
L F 3 5 3
VA
VA
+
_
R4
Vo
R3
R2
RT
VA
L F 3 5 3
VA
VA
i
Page 22.1420.6
students are reminded that resistors are manufactured to provide a fairly wide range of resistance
values, but nonetheless only exist in a relative handful of values. The students are provided a
table in their handout (Table I) of available resistors for their use. This limitation is intended to
emphasize the realistic availability of resistors for prototype circuit work and to apply the simple
rules of combining resistors in series and parallel to achieve a desired resistance value.
Table I. Resistors available in the lab for student use. 10 15 47 100 150 270 330 470 510 680 820 1 k
1.2 k 2 k 3 k 3.3 k 4.3 k 5.6 k 6.8 k 10 k 12 k 15 k 20 k 33 k
47 k 51 k 100k 200k 330k 510k 1.0M 2.0M 5.1M 10 M
Some guidance is offered to the students to help them understand a few basic techniques of
linearizing circuits. By providing the design specification of a linearized circuit between the
temperatures of 0oC and 100
oC, it is much easier for the students to understand the importance of
design constraints and to help guide them through the design process. The students are asked to
consider the linearization of the circuit by calculating values of R2, R3, and R4 so that the
following two conditions are satisfied:
0)0( CVo
o (2)
)100(2
1)50( CVCV
o
o
o
o
(3)
These two conditions are used to essentially anchor the output voltage Vo at the origin (the zero
point of voltage and temperature) when T = 0oC, at the middle of a straight line at half the
maximum voltage value, which is half of the temperature range of 100oC at 50
oC, and at the
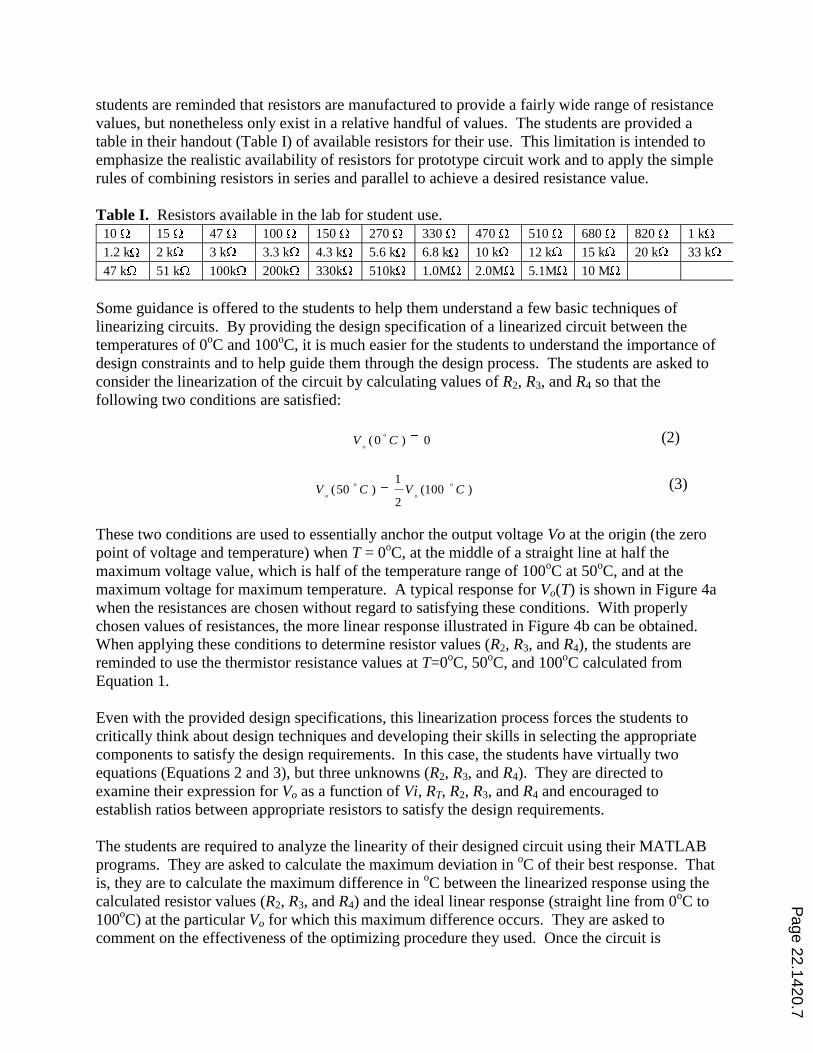
maximum voltage for maximum temperature. A typical response for Vo(T) is shown in Figure 4a
when the resistances are chosen without regard to satisfying these conditions. With properly
chosen values of resistances, the more linear response illustrated in Figure 4b can be obtained.
When applying these conditions to determine resistor values (R2, R3, and R4), the students are
reminded to use the thermistor resistance values at T=0oC, 50
oC, and 100
oC calculated from
Equation 1.
Even with the provided design specifications, this linearization process forces the students to
critically think about design techniques and developing their skills in selecting the appropriate
components to satisfy the design requirements. In this case, the students have virtually two
equations (Equations 2 and 3), but three unknowns (R2, R3, and R4). They are directed to
examine their expression for Vo as a function of Vi, RT, R2, R3, and R4 and encouraged to
establish ratios between appropriate resistors to satisfy the design requirements.
The students are required to analyze the linearity of their designed circuit using their MATLAB
programs. They are asked to calculate the maximum deviation in oC of their best response. That
is, they are to calculate the maximum difference in oC between the linearized response using the
calculated resistor values (R2, R3, and R4) and the ideal linear response (straight line from 0oC to
100oC) at the particular Vo for which this maximum difference occurs. They are asked to
comment on the effectiveness of the optimizing procedure they used. Once the circuit is
Page 22.1420.7
Figure 4. Output voltage Vo response of the thermistor circuit. (a) Typical response of Vo
versus T for the circuit in Figure 3 when no linearization procedure is used. (b) Typical response
when the linearization procedure is used.
designed and meets the design requirements, the students are required to construct the circuit on
a breadboard. They are instructed to use ±12 V to power the operational amplifier and to search
online for LF353 pin layout of the chip.
Week 3– Voltage Comparing Circuit and Alarm Circuit Design
The overall objectives of the third week lab session are determine the voltages corresponding to
the upper (50oC )and lower (25
oC) temperature limits, design a comparing circuit to compare the
voltage from the Wheatstone bridge circuit (Vo) with the voltage limits, and design an indicator/
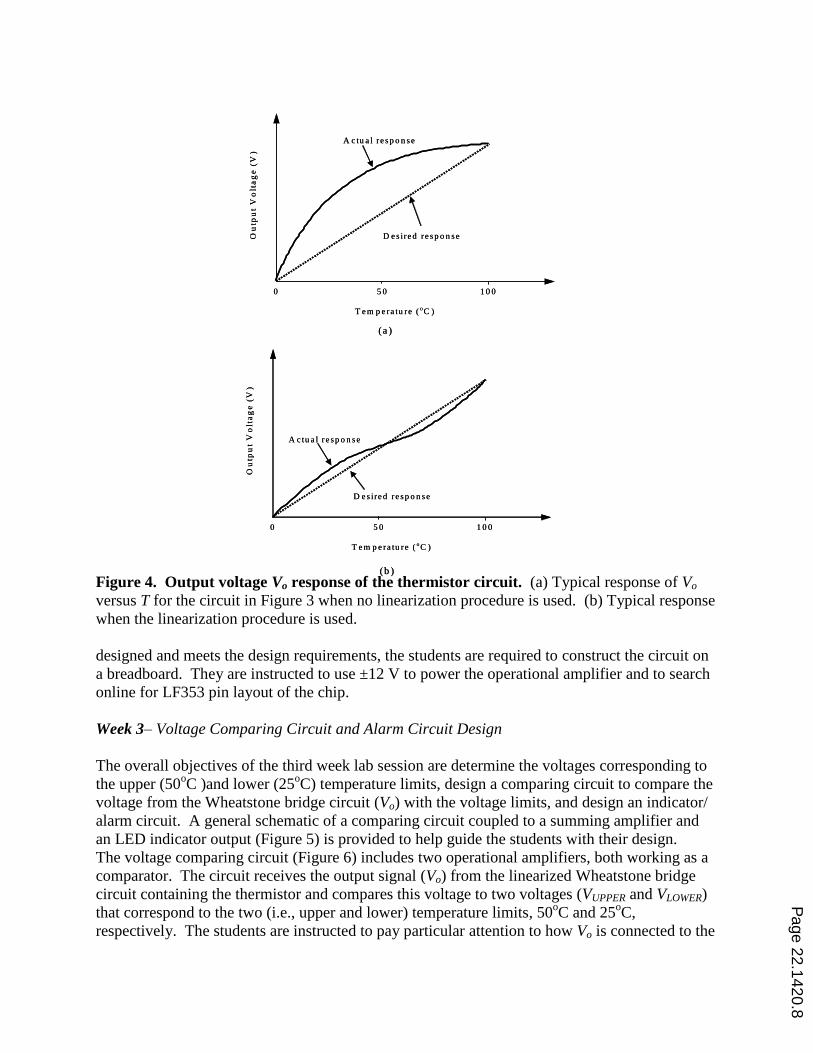
alarm circuit. A general schematic of a comparing circuit coupled to a summing amplifier and
an LED indicator output (Figure 5) is provided to help guide the students with their design.
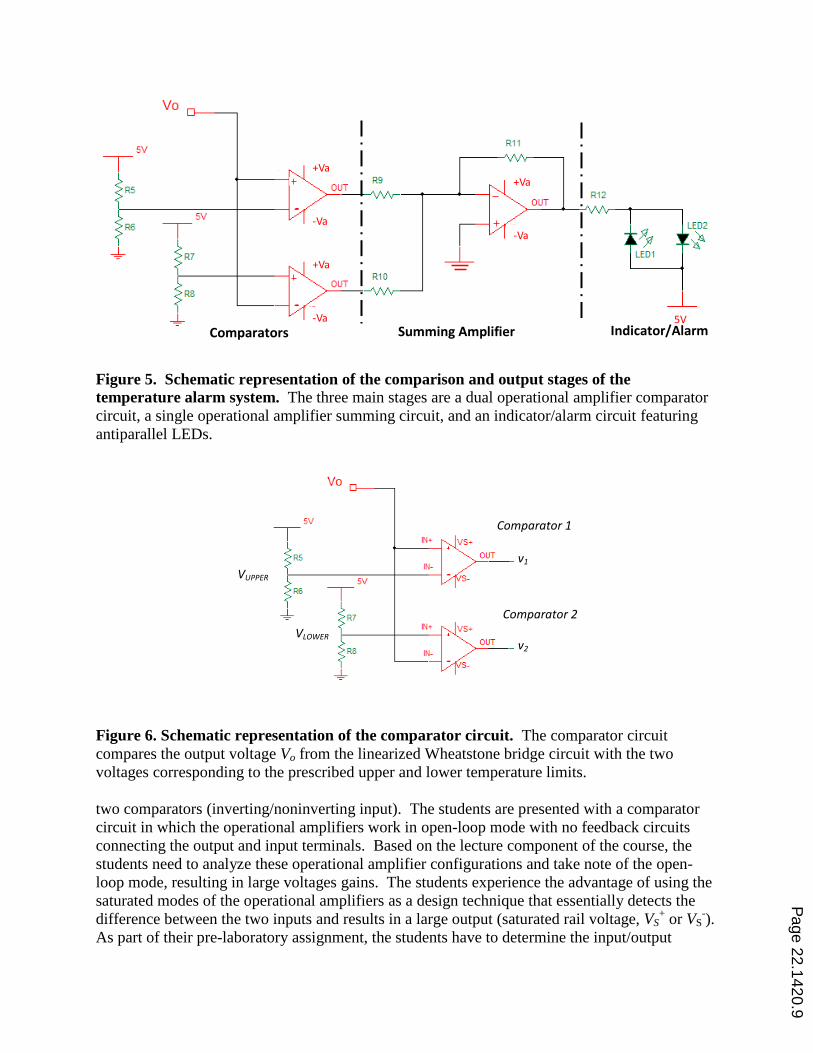
The voltage comparing circuit (Figure 6) includes two operational amplifiers, both working as a
comparator. The circuit receives the output signal (Vo) from the linearized Wheatstone bridge
circuit containing the thermistor and compares this voltage to two voltages (VUPPER and VLOWER)
that correspond to the two (i.e., upper and lower) temperature limits, 50oC and 25
oC,
respectively. The students are instructed to pay particular attention to how Vo is connected to the
T e m p e ra tu re ( o C )
Ou
tpu
t V
olt
ag
e (
V)
0 5 0 1 0 0
A c tu a l r e s p o n s e
D e s ire d r e s p o n s e
T e m p e ra tu re ( o C )
Ou
tpu
t V
olt
ag
e (
V)
0 5 0 1 0 0
A c tu a l r e s p o n s e
D e s ire d r e s p o n s e
(a )
(b )
T e m p e ra tu re ( o C )
Ou
tpu
t V
olt
ag
e (
V)
0 5 0 1 0 0
A c tu a l r e s p o n s e
D e s ire d r e s p o n s e
T e m p e ra tu re ( o C )
Ou
tpu
t V
olt
ag
e (
V)
0 5 0 1 0 0
A c tu a l r e s p o n s e
D e s ire d r e s p o n s e
(a )
(b )
Page 22.1420.8
5V
+Va
-Va
+Va
-Va
+Va
-Va
Figure 5. Schematic representation of the comparison and output stages of the
temperature alarm system. The three main stages are a dual operational amplifier comparator
circuit, a single operational amplifier summing circuit, and an indicator/alarm circuit featuring
antiparallel LEDs.
Figure 6. Schematic representation of the comparator circuit. The comparator circuit
compares the output voltage Vo from the linearized Wheatstone bridge circuit with the two
voltages corresponding to the prescribed upper and lower temperature limits.
two comparators (inverting/noninverting input). The students are presented with a comparator
circuit in which the operational amplifiers work in open-loop mode with no feedback circuits
connecting the output and input terminals. Based on the lecture component of the course, the
students need to analyze these operational amplifier configurations and take note of the open-
loop mode, resulting in large voltages gains. The students experience the advantage of using the
saturated modes of the operational amplifiers as a design technique that essentially detects the
difference between the two inputs and results in a large output (saturated rail voltage, VS+ or VS
-).
As part of their pre-laboratory assignment, the students have to determine the input/output
Comparators Summing Amplifier Indicator/Alarm
VUPPER
VLOWER
Comparator 1
Comparator 2
v1
v2
Page 22.1420.9
relationships of the comparator components and complete a table representing the output voltage
conditions corresponding to the upper and lower temperature conditions. From these
calculations, students design the voltage dividers, R5 and R6 as well as R7 and R8 to deliver the
appropriate VUPPER and VLOWER values, respectively, to the corresponding operational amplifier
inputs.
The indicator/alarm circuit receives the outputs of the comparator, determines, and indicates the
status of the temperature (Normal or Out of Range) with two LEDs (light emitting diodes) that
emit green and red light. Specifically, the students are asked to design the alarm circuit to work
in the following manner: when the temperature is within the range of the upper and lower limits
(between 50oC and 25
oC), a green LED is turned on; alternatively, when the temperature is out of
the defined range, a red LED is turned on to issue an alert. This circuit is presented to the
students in two parts: a summing amplifier (Figure 7) and the LED circuits (Figure 8).
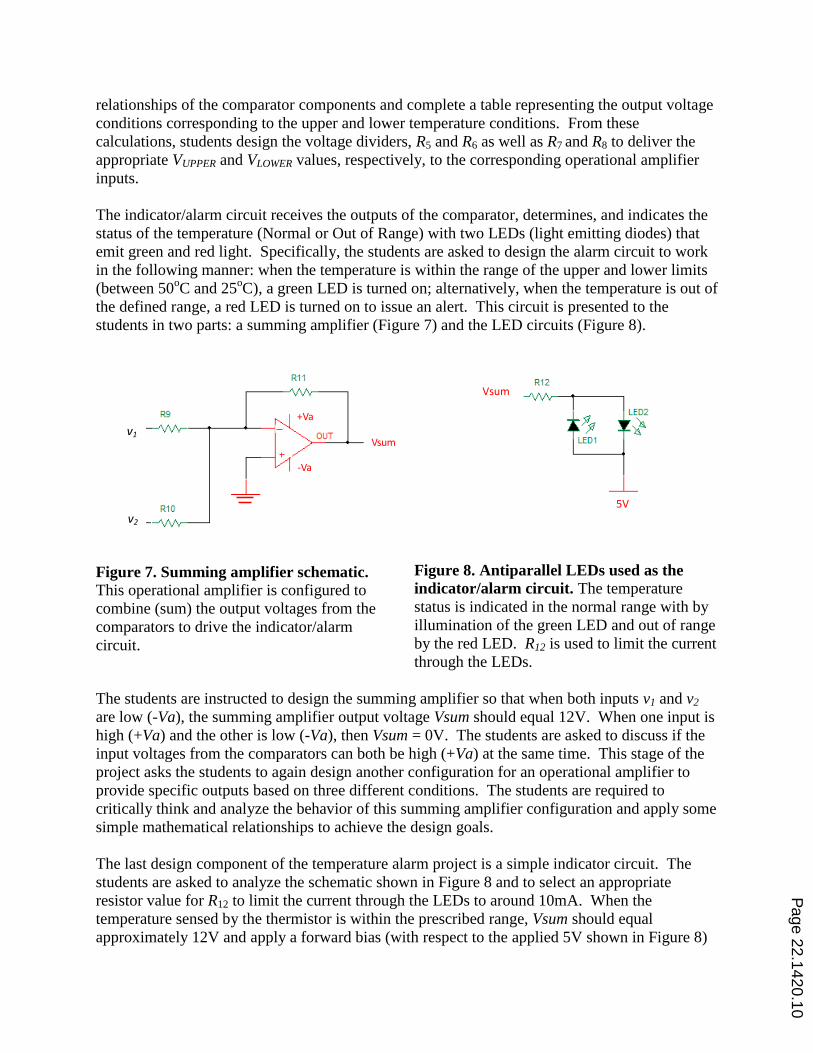
Figure 7. Summing amplifier schematic.
This operational amplifier is configured to
combine (sum) the output voltages from the
comparators to drive the indicator/alarm
circuit.
Figure 8. Antiparallel LEDs used as the
indicator/alarm circuit. The temperature
status is indicated in the normal range with by
illumination of the green LED and out of range
by the red LED. R12 is used to limit the current
through the LEDs.
The students are instructed to design the summing amplifier so that when both inputs v1 and v2
are low (-Va), the summing amplifier output voltage Vsum should equal 12V. When one input is
high (+Va) and the other is low (-Va), then Vsum = 0V. The students are asked to discuss if the
input voltages from the comparators can both be high (+Va) at the same time. This stage of the
project asks the students to again design another configuration for an operational amplifier to
provide specific outputs based on three different conditions. The students are required to
critically think and analyze the behavior of this summing amplifier configuration and apply some
simple mathematical relationships to achieve the design goals.
The last design component of the temperature alarm project is a simple indicator circuit. The
students are asked to analyze the schematic shown in Figure 8 and to select an appropriate
resistor value for R12 to limit the current through the LEDs to around 10mA. When the
temperature sensed by the thermistor is within the prescribed range, Vsum should equal
approximately 12V and apply a forward bias (with respect to the applied 5V shown in Figure 8)
Vsum
5V
v1
v2
+Va
-Va
Vsum
Page 22.1420.10
to the green LED for illumination. Conversely, when the sensed temperature is out of range,
Vsum should equal approximately 0V and apply a forward bias to the red LED.
Week 4 – System Integration and Design Characterization
The last laboratory session is provided for the students to integrate all of the stages of their
system and to characterize the operation and behavior of their temperature alarm device. Up to
this point, the students should already have been integrating each stage in the previous two
weeks to ensure proper step-wise operation of their designs. We found that the students
consistently encounter problems with their assembled circuits and have to troubleshoot. This in
itself is an invaluable learning, albeit frustrating, experience for students as they have to design
and conduct their own experiments to determine the source(s) of the problem(s). The instructors
and laboratory assistants provide limited prompting to help guide the students in solving their
own circuit problems.
Once the students successfully design, assemble, and demonstrate their temperature alarm
system they are required to characterize their design. We ask students to investigate and describe
the details and functionality of their designed system. They are expected to investigate all of the
specifications of their design and the prototype model they built in the lab. These specifications
and information should be in enough detail that would be needed for inclusion in a pre-marketing
presentation to “company administration” that discusses the detailed operational functions of
their system. For example, the students are expected to measure and discuss the linearity of their
circuit, determine the actual temperatures the system uses to indicate in-range or out-of-range
temperatures, and what voltages are used to switch the LEDs, for example. This is an open-
ended characterization exercise. The students design their own characterization procedures and
measure their own data.
Student Assignments
The central focus of pre-laboratory assignments and the final project report is to engage the
students in the laboratory experience. Our intent is to guide the students in preparing for each
laboratory session and impress upon them the significance of each subcomponent and the
contribution to the entire system. The pre-laboratory assignments are geared to prepare the
students for each laboratory session by learning the applicable new material and completing
preparatory work for designing and conducting their experiments in the lab. To encourage
students to continue their development of technical writing skills, students are required to submit
the compilation of their design work and characterization of their temperature alarm system.
Assessment of their work is based on the merit of their experimental and engineering designs,
presentation of results, and overall presentation of the work. The students are also asked to
reflect on their experiences and what they learned from the project.
Learning Outcomes and Assessment
To assess the effectiveness of this laboratory design project in teaching students the aspects of
electrical engineering design using operational amplifiers, a series of summative assessment
tools were used. The first is an evaluation of how well the students are able to communicate their
Page 22.1420.11
designs in a formal report. The second is how well the students communicate their linearization
methods using MATLAB. The third is a student survey consisting of a series of self-assessment
questions that ask students to rank their confidence in their ability to successfully complete the
design project. The fourth is an overall look at how well the students performed at answering
operational amplifier-based questions on weekly quizzes and the final exam.
Comparing and Alarm Circuits Design (ABET Outcome c)
Within the formal report, the students were instructed to communicate their design of the
comparing and alarm circuits. They were required to explain the operation of the circuits,
provide schematic diagrams, and clearly present their design and calculations that meet the
provided specifications. Table II shows the results of the following rubric used to assess student
design work within the formal design project report:
4 (Superior): The student designs successful comparing and alarm circuits that meet the
design specifications, clearly articulates the operation of the circuits, provides complete
and comprehensive schematics, clearly presents design solutions and calculations for the
circuits, and demonstrates an understanding of the three stages of the system.
3 (Satisfactory): The student designs successful comparing and alarm circuits that meet
most of the design specifications, describes the operation of the circuits, provides correct
schematics, presents most of the design solutions and calculations, and demonstrates a
reasonable understanding of the three stages of the system.
2 (Below Expectation): the students designs a partially successful comparing and alarm
circuit system, describes in some detail the operation of the circuits, provides partial
schematics, presents some of the design solutions and calculations, and demonstrates
some understanding of the three stages of the system.
1 (No Progress Shown): The student is unable to design the comparing and alarm circuits
and discuss the operation of the circuits with enough detail to demonstrate an
understanding of the project.
Table II. Assessment outcome results for the comparing and alarm circuits design.
4 = Student demonstrates superior achievement of the outcome 12
3 = Student demonstrates satisfactory achievement of the outcome 13
2 = The student’s achievement of this outcome falls below expectations 6
1 = The student shows no significant achievement toward this outcome 1
Average Rating 3.125
% of Samples Rated 3 or 4 78%
Page 22.1420.12
Linearization Using MATLAB (ABET Outcome k)
Within the formal report, the students were instructed to communicate their linearization
methods using MATLAB with specific requirements included in their code. These requirements
included the file name, brief description of the code, course number, project name, author, and
date. Each function block or line of code must have descriptive comments explaining the block’s
or line’s function in enough detail that a peer not familiar with the project could understand the
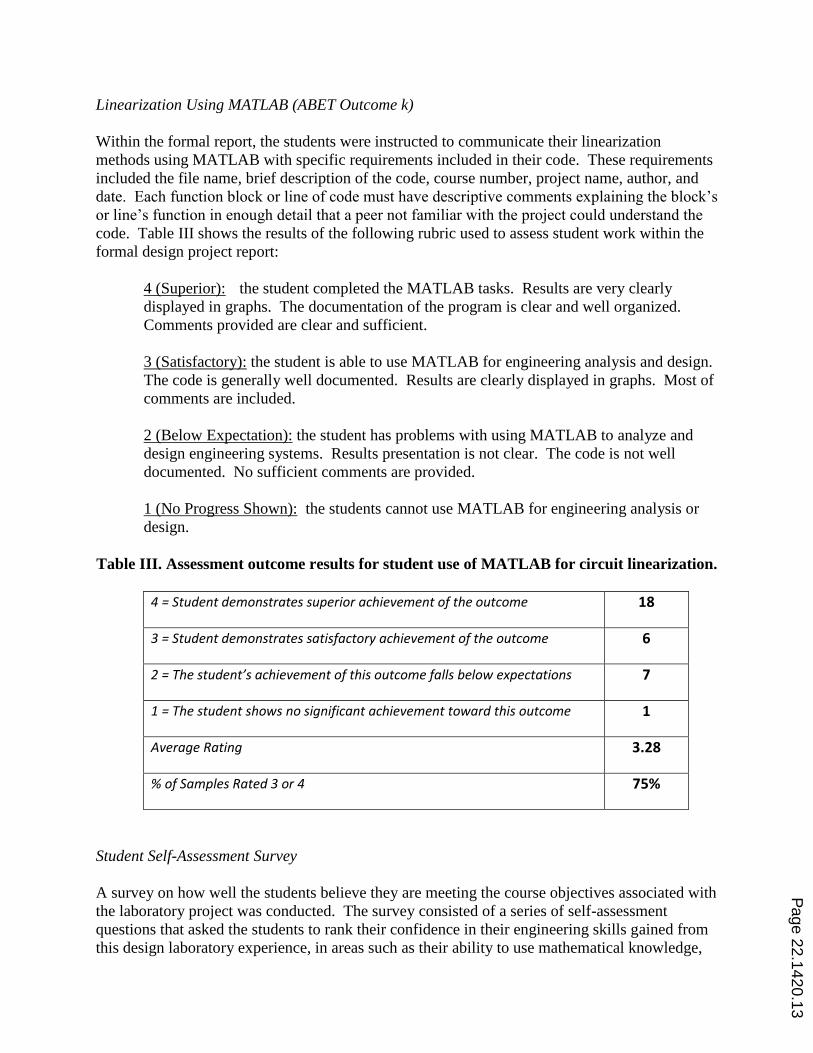
code. Table III shows the results of the following rubric used to assess student work within the
formal design project report:
4 (Superior): the student completed the MATLAB tasks. Results are very clearly
displayed in graphs. The documentation of the program is clear and well organized.
Comments provided are clear and sufficient.
3 (Satisfactory): the student is able to use MATLAB for engineering analysis and design.
The code is generally well documented. Results are clearly displayed in graphs. Most of
comments are included.
2 (Below Expectation): the student has problems with using MATLAB to analyze and
design engineering systems. Results presentation is not clear. The code is not well
documented. No sufficient comments are provided.
1 (No Progress Shown): the students cannot use MATLAB for engineering analysis or
design.
Table III. Assessment outcome results for student use of MATLAB for circuit linearization.
4 = Student demonstrates superior achievement of the outcome 18
3 = Student demonstrates satisfactory achievement of the outcome 6
2 = The student’s achievement of this outcome falls below expectations 7
1 = The student shows no significant achievement toward this outcome 1
Average Rating 3.28
% of Samples Rated 3 or 4 75%
Student Self-Assessment Survey
A survey on how well the students believe they are meeting the course objectives associated with
the laboratory project was conducted. The survey consisted of a series of self-assessment
questions that asked the students to rank their confidence in their engineering skills gained from
this design laboratory experience, in areas such as their ability to use mathematical knowledge,
Page 22.1420.13
design experiments, conduct experiments, use MATLAB, analyze operational amplifier circuits,
and to design operation amplifier-based circuits. A Likert scale survey (5-Strongly agree; 4-
Agree; 3-Neutral; 2-Disagree; and 1-Strongly disagree) was conducted to collect the students’
opinions. The survey was conducted immediately following the final exam for the course. Table
IV shows the results of the following survey questions:
1. The temperature alarm design project improved my ability to use mathematical
knowledge to solve engineering problems.
2. The temperature alarm design project improved my ability to design experiments.
3. The temperature alarm design project improved my ability to conduct experiments.
4. The temperature alarm design project improved my MATLAB programming skills.
5. After the temperature alarm design project, I am able to analyze op-amp circuits.
6. After the temperature alarm design project, I am able to design op-amp circuits.
7. After the temperature alarm design project, I understand different applications of op-
amps.
8. After the temperature alarm design project, I am able to build circuits on breadboards.
9. Finishing the temperature alarm design project gave me a sense of accomplishment.
10. The temperature alarm design project was fun and motivated me to learn.
Table IV. Temperature Alarm Project Self-Assessment Student Survey Results
Question Strongly
disagree
Disagree Neutral Agree Strongly
agree
% Rated 4
or Higher
1 0 0 5 15 9 82.7
2 0 2 1 16 10 89.6
3 0 0 5 14 10 82.7
4 1 1 8 15 4 65.5
5 0 0 3 19 7 89.6
6 0 0 4 16 9 86.2
7 0 1 2 20 6 89.6
8 0 0 0 14 15 100
9 0 1 1 9 18 93.1
10 0 2 2 14 11 86.2
Weekly Quiz and Final Exam Operational Amplifier Questions
As part of the grading structure for the course, 12 quizzes (10-12 minutes each) and a final exam
were administered. The two lowest scores of the twelve quizzes were dropped and not counted
toward the final grade. Each quiz was worth 50 points and amounted to 4% of the final course
grade. For the quizzes, the students were allowed one 3” x 5” card containing hand-written notes
and equations only, no examples or worked problems. For the final exam the students were
allowed two 8.5” x 11” sheets of paper for hand-written notes and equations only, no examples
or worked problems. Two of the twelve quizzes focused exclusively on operational amplifiers.
The final exam contained two questions on operational amplifiers counting for 4.5% of the final
course grade.
Page 22.1420.14
The first question in the sixth quiz of the semester asked the students to analyze a non-inverting
operational amplifier and calculate the output voltage across a load resistor and the current
through the resistor. The second problem asked the students to design a simple operational
amplifier circuit that provides a voltage gain of 151. The average score was 77% (38.5/50) (n =
25) and a standard deviation of 10.6 for the 50 point total.
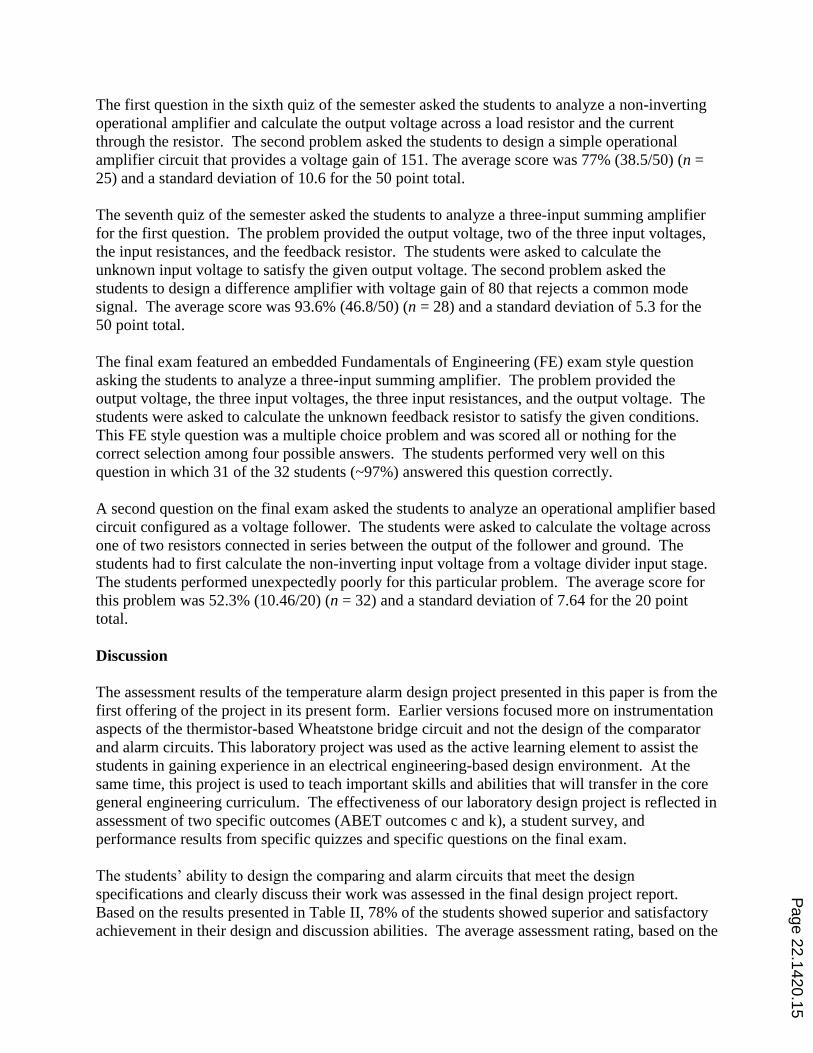
The seventh quiz of the semester asked the students to analyze a three-input summing amplifier
for the first question. The problem provided the output voltage, two of the three input voltages,
the input resistances, and the feedback resistor. The students were asked to calculate the
unknown input voltage to satisfy the given output voltage. The second problem asked the
students to design a difference amplifier with voltage gain of 80 that rejects a common mode
signal. The average score was 93.6% (46.8/50) (n = 28) and a standard deviation of 5.3 for the
50 point total.
The final exam featured an embedded Fundamentals of Engineering (FE) exam style question
asking the students to analyze a three-input summing amplifier. The problem provided the
output voltage, the three input voltages, the three input resistances, and the output voltage. The
students were asked to calculate the unknown feedback resistor to satisfy the given conditions.
This FE style question was a multiple choice problem and was scored all or nothing for the
correct selection among four possible answers. The students performed very well on this
question in which 31 of the 32 students (~97%) answered this question correctly.
A second question on the final exam asked the students to analyze an operational amplifier based
circuit configured as a voltage follower. The students were asked to calculate the voltage across
one of two resistors connected in series between the output of the follower and ground. The
students had to first calculate the non-inverting input voltage from a voltage divider input stage.
The students performed unexpectedly poorly for this particular problem. The average score for
this problem was 52.3% (10.46/20) (n = 32) and a standard deviation of 7.64 for the 20 point
total.
Discussion
The assessment results of the temperature alarm design project presented in this paper is from the
first offering of the project in its present form. Earlier versions focused more on instrumentation
aspects of the thermistor-based Wheatstone bridge circuit and not the design of the comparator
and alarm circuits. This laboratory project was used as the active learning element to assist the
students in gaining experience in an electrical engineering-based design environment. At the
same time, this project is used to teach important skills and abilities that will transfer in the core
general engineering curriculum. The effectiveness of our laboratory design project is reflected in
assessment of two specific outcomes (ABET outcomes c and k), a student survey, and
performance results from specific quizzes and specific questions on the final exam.
The students’ ability to design the comparing and alarm circuits that meet the design
specifications and clearly discuss their work was assessed in the final design project report.
Based on the results presented in Table II, 78% of the students showed superior and satisfactory
achievement in their design and discussion abilities. The average assessment rating, based on the
Page 22.1420.15
provided rubric, was 3.125 with 78% of the students scoring a 3 or 4. Our standard for reporting
that the students are achieving the outcomes of the project is 75%. These results indicate the
students are achieving this particular outcome. This may be interpreted as a positive indicator
that our design series project approach to teaching electrical engineering-based design is
successful. We are pleased with the 78% achievement of this outcome, but this is just above our
standard for reporting. We will increase the emphasis in the report requirements and present the
importance of clear and articulate design and presentation of design work in the laboratory
reports. Our goal is to see more students demonstrate superior achievement for this outcome in
subsequent offerings of the course.
The students’ ability to apply MATLAB as part of the design process to model, linearize, and
analyze an operational amplifier-based Wheatstone bridge circuit was assessed in the final design
project report. Based on the results presented in Table II, 75% of the students showed superior
and satisfactory achievement in their ability to program MATLAB and use their M-files to model
and linearize their circuits and generate appropriate, descriptive plots. The average assessment
rating, based on the provided rubric, was 3.28 with 75% of the students scoring a 3 or 4. As with
all our assessment in the engineering department, our standard for reporting that the students are
achieving the outcomes of the project is 75%. These results indicate the students are achieving
this particular outcome. We are pleased with these results, but despite stressing the importance
of clearly organized and thoroughly-commented MATLAB scripts, we would like to have a
higher percentage of outcome achievement. We plan to increase the emphasis in the laboratory
report requirements with additional exercises the students must perform using their MATLAB
code and additional engineering design analysis from the increased use.
Based on the self-reporting of students on the project survey (Table III), this laboratory series is
effective in several important areas, all of which are important aspects of general engineering-
based design, such as using math to solve engineering problems, designing experiments,
conducting experiments, programming skills, and op-amp circuit analysis, design, and
application. The survey results (29 responses from 32 enrolled students) demonstrate that, out of
those students who responded, most of them expressed they achieved the laboratory objectives
and are confident with their abilities. With the exception of the MATLAB question, the students
responded with a 4 or 5 at a rate of 82.7% or higher for each question. Notably, the students
reported with high confidence (100% agree and strongly agree responses) in their ability to build
circuits on breadboards. This confidence can be transferred to other engineering subdisciplines
in applying hands-on techniques to solving engineering problems. The students also reported
that the project gave them a sense of accomplishment (93.1% agree and strongly agree) and that
the project motivated them to learn (86.2% agree and strongly agree). This is an indication that
this laboratory experience had a positive impact on the students’ ability to learn by motivation
and accomplishment. On a puzzling note, the students expressed with relatively low confidence
that the design project improved their MATLAB programming skills (65.5% agree and strongly
agree). Some students indicated on the survey form, when asked what they liked least about the
project, that MATLAB programming was the least enjoyable part of the project. However,
based on the outcome assessment for the use of MATLAB in the linearization design, the
students showed they achieved this outcome (75% scoring a 3 or 4 from the given rubric).
Perhaps we asked the wrong question. We are thinking of changing the question to something
along the lines of the use of MATLAB has increased my engineering design skills.
Page 22.1420.16
Student performance on solving operational amplifier-based questions on quizzes and the final
exam was fairly strong. The students scored averages of 77% and 93.6% on two quizzes
exclusively covering operational amplifiers. These two quizzes were taken a few weeks before
the start of the laboratory-based temperature alarm design project. This indicates the students
were fairly strong in operational amplifier analysis and intermediate design prior to starting the
project. After the project was completed in the lab, the students encountered two more
operational amplifier analysis problems on the final exam. On one FE style multiple choice
question, which was scored as either correct or incorrect, asking the students to analyze a
summing amplifier, 31 of the 32 students answered the question correctly. This is strong
indicator the students have maintained, if not improved, their ability to work with summing
amplifier circuits. On a separate question featuring two voltage divider networks separated by a
voltage follower operational amplifier configuration, the student average was only 52.3%. This
is a fairly disappointing result, but students mostly lost points solving the two separate voltage
dividers, the bulk of the points for the problem, as there is not much to analyze in a voltage
follower configuration.
The overall assessment results indicate the temperature alarm design project had a positive
impact in student learning and motivation. The students are achieving specific course outcomes,
performing well on quizzes and tests, and express confidence in their abilities to apply
themselves as engineers. Throughout the four-week laboratory series, students gain valuable
exposure to many fundamental design techniques and hands-on experience with electrical
engineering bench top instrumentation. With each successive lab session, students discover new
challenges in designing their circuits, building their designs, experimentation, troubleshooting,
and characterization. This serves as a means to keep students engaged and interested in the
laboratory and helps them develop their engineering design skills by bridging connections
between the fundamental course work and the laboratory design experience.
Conclusions
Overall, the 4-week temperature alarm laboratory design project series described in this paper
represents a successful approach to laboratory training of undergraduates engineering students in
a general engineering degree program. The laboratory activities and the design experience
influenced the students’ confidence in many skill areas that are key to being successful
engineers. The project provided the students with hands-on experience in electrical engineering
techniques using laboratory bench equipment, prototype circuit boards, and the frustrating but
extremely beneficial experience of circuit troubleshooting. This laboratory series has become an
integral design-based component of the general engineering core curriculum at East Carolina
University. Although there is still a great deal of improvement we would like accomplish in this
series, the experience demonstrated the positive impact on student learning and the development
of additional engineering design and communication skills.
Acknowledgments
The authors would like to thank our laboratory supervisor Bruce Peterson for all his dedicated
support in the laboratories and helping the instructors deliver meaningful laboratory experiences
Page 22.1420.17
for our students. We would like to also thank our laboratory teaching assistant Chris Cone for
his dedication and enthusiasm in the laboratory in helping the students with all aspects of this
project.
References
1. Kauffmann, P., Rogers, R., and Lunsford, P., “A Case Study: Development of a Practice Oriented Engineering
Program with Implications for Regional Economic Development,” Proceedings of the 2004 ASEE Annual
Conference and Exposition, Salt Lake City, 2004.
2. East Carolina University. "Homepage of the Department of Engineering," Available: www.ecu.edu/cs-
tecs/engineering/Mission-and-Objectives.cfm
3. Yao, J., Limberis, L., and Kauffmann, P., “An Electrical Systems Course in a General Engineering Program,”
Proceedings of the 2007 ASEE Annual Conference and Exposition, Honolulu, 2007.
4. Yao, J. and Limberis, L., “A Project-Driven Approach to Teaching Controls in a General Engineering
Program,” Proceedings of the 2008 ASEE Annual Conference and Exposition, Pittsburgh, 2008.