Subject Wireless Power Transmission – an Overview Society IARU-R1 Country: Region 1 Committee: C4 and C7 Paper number: VIE19 C7-005 Author: Don Beattie Wireless Power Transmission – an Overview Introduction This paper is written to update the EMC group at the Vienna interim meeting on the latest status of discussions on WPT and the potential for harmful interference to the radio spectrum from this technology. Background IARU engaged with discussions in CEPT and ITU on WPT in 2017. This was probably too late, and since then we have been fighting to gain control of the debate. IARU prepared a study of WPT-EV and the potential impact on radiocommunications services (Annex A) and submitted it to both CEPT SE24 (which is the relevant committee studying the topic) and to ITU WP1A and WP1B (again, the relevant committees). In CEPT the IARU input has been carried forward in the recently- published ECC Report 289 (available at https://www.ecodocdb.dk/document/8214 ). Inputs from other radio users expressing concern about spurious emissions from WPT-EV come from the broadcasting service (EBU and BBC), the land mobile service (France) and the EAS technology (article surveillance) Report 289 sets out the protection requirements for these radio services but it stops short of proposing any regulatory action. This therefore is the next challenge – to seek to bridge the divide between WPT manufacturers and the radiocommunications services. Following on to the work on WPT-EV in SE24, there is further work to complete on generic WPT (eg phone charging, power tools, kitchen devices and cookers). As a part of this manufacturers have offered projections on the installed density of these devices, which allows modelling of the minimum interference field strength to be expected in an urban/suburban environment populated with WPT devices at the projected density. This then allows IARU to make further input modelling these emissions and the draft paper to go to CEPT for April is attached as
Transcript
Subject Wireless Power Transmission – an Overview
Society IARU-R1 Country: Region 1
Committee: C4 and C7 Paper number: VIE19 C7-005
Author: Don Beattie
Wireless Power Transmission – an Overview
Introduction
This paper is written to update the EMC group at the Vienna interim meeting on the latest status of discussions on WPT and the potential for harmful interference to the radio spectrum from this tech-nology.
Background
IARU engaged with discussions in CEPT and ITU on WPT in 2017. This was probably too late, and since then we have been fighting to gain control of the debate. IARU prepared a study of WPT-EV and the potential impact on radiocommunications services (Annex A) and submitted it to both CEPT SE24 (which is the relevant committee studying the topic) and to ITU WP1A and WP1B (again, the relevant committees).
In CEPT the IARU input has been carried forward in the recently-published ECC Report 289 (available at https://www.ecodocdb.dk/document/8214 ). Inputs from other radio users expressing concern about spurious emissions from WPT-EV come from the broadcasting service (EBU and BBC), the land mobile service (France) and the EAS technology (article surveillance)Report 289 sets out the protection requirements for these radio services but it stops short of pro-posing any regulatory action. This therefore is the next challenge – to seek to bridge the divide between WPT manufacturers and the radiocommunications services.
Following on to the work on WPT-EV in SE24, there is further work to complete on generic WPT (eg phone charging, power tools, kitchen devices and cookers). As a part of this manufacturers have offered projections on the installed density of these devices, which allows modelling of the minimum interference field strength to be expected in an urban/suburban environment populated with WPT devices at the projected density.
This then allows IARU to make further input modelling these emissions and the draft paper to go to CEPT for April is attached as Annex B.
A similar pattern has evolved in ITU, which IARU made the same input (Annex A). However, discus-sions on spurious emissions in ITU are now planned to be in a separate Report, to be discussed in May 2019. Nonetheless the IARU study already is included in the draft Report on emissions generally (including the fundamental operating frequency).
The Next Steps
The involvement of administrations in the work on spurious emission standards has been very low so far. It is clearly necessary to engage with them on this topic on a country-by-country basis At Vienna, we will discuss the work to date, and consider how best to apply pressure nationally across Region 1 – particularly in Europe.
This document sets out an analysis of the impact of WPT-EV systems on radio communications in the amateur service. Prime consideration is given to systems operating in the 79-90 kHz range. Data for the analysis is drawn from published information about the amateur service, WPT(EV) systems and from existing reports and studies in CEPT, ITU and CISPR/CENELEC.
2 Background
The amateur service is a radio service defined in the ITU Radio Regulations (RR 1.56). There are some 3 million licensed amateur radio operators around the world. ITU Radio Regulations set out the fre-quencies allocated to the amateur service. Although allocations vary slightly between ITU Regions and in individual countries, the following table provides a general overview of current allocations up to 1GHz. There are also numerous allocations above 1 GHz.
Frequency range Allocation status135.7 - 137.8 kHz Secondary allocation472.0 - 479.0 kHz Secondary allocation1,800 -2,000 kHz Part primary, part secondary3,500-4,000 kHz Primary allocation5,351.5-5,366.5 kHz
ANNEX A: UNWANTED EMISSIONS IN THE SPURIOUS DOMAIN FROM WIRELESS POWER TRANSFER FOR ELECTRIC VEHICLES ON FREQUENCIES ALLOCATED TO THE AMATEUR SER-VICE
TABLE 1: GLOBAL ALLOCATIONS TO THE AMATEUR SERVICE BELOW 1GHZ IN THE ITU RADIO REGULATIONS AND UNDER RR 4.4. NOTE THAT THERE ARE A NUMBER OF NATIONAL AND REGIONAL VARIATIONS TO THIS TABLE IN SOME FREQUENCY RANGES.
The characteristics of stations operating in the amateur service are set out in ITU-R M.1732 [1] – “Characteristics of systems operating in the amateur and amateur-satellite services for use in sharing studies”. The amateur service is essentially a low-power service which relies on having a low back-ground noise level for its effective operation.
Because there are no minimum signal levels associated with amateur service communications, then to properly assess the service’s susceptibility to harmful interference it is necessary to examine the actual pattern of communication in the service. The amateur service Reverse Beacon Network 1 provides a real-time database of amateur A1A mode signals automatically monitored at several hun-dred receiving stations around the world and globally aggregated. To arrive at some indication of the typical signal to noise ratio of communication in the amateur service, the data from these monitor-ing stations over an extended period has been analysed.
The chart below shows the distribution of A1A signal levels in the amateur service drawn from 528,280 data points.
FIGURE 1: DISTRIBUTION OF TYPICAL S/N RATIO IN AMATEUR SERVICE COMMUNICATIONS
Should the above data be presented in the same bandwidth as the ITU-R P.372-13 [2] measure-ments, this would result in a 13 dB worsening of the above signal to noise ratios. This chart shows convincingly that any significant raising of the background noise level will have a very significant impact on amateur service communications, as the majority of communication is currently relatively close to the noise level.
The above signal to noise ratios are relative to the background noise levels and for this purpose, the man-made background noise levels defined in ITU-R P.372-13 are relevant as a reference point. Al-though there has been some increase above these levels in the “city” noise, recent reports submit-ted to ITU (eg [3]) have suggested that the residential and rural levels are still representative of the real world. In terms of quiet rural, there is some evidence that the levels have risen somewhat, be-lieved to be due to the cumulative effect of millions of low power digital devices (eg switch-mode power supplies, LED lighting system power units, solar PV systems and PLT/BPL installations) creating broadband emissions propagated by ionospheric reflection [4]
1 http://www.reversebeacon.net/
One aspect of the need for a low noise environment in the amateur service is that users of the ama-teur services are called upon to provide disaster relief communications – often at low signal levels. In many countries, amateur radio is seen as a valuable back-up service in case of breakdown or over-load of normal communications systems. Governments rely on this capability at times of emergency. Amateur service HF and VHF allocations are used for this purpose. The word “amateur” can be mis-leading, as stations in the amateur service are also involved in fundamental ionospheric and propagation research. It is self-evident that any significant degradation of the background noise level will adversely impact the service’s capability in all these areas. Precedents have been set to recog-nise the need for protection of amateur service frequencies in standards and limits relating to Power Line Telecommunications [6], DSL services [7] and Gfast [8]. It is worthy of note that the level of ad-ditional protection enshrined in, for example, the PLT limits in CISPR are of the same order as are proposed in this paper.
3 The location of WPT-EV installations
WPT-EV systems (operating in the 79-90 kHz range) are planned for the home environment, in do-mestic garages, as well as parking lots and public service areas. Therefore domestic WPT-EV installa-tions can be expected to be close to living accommodation. Figure 2 represents a schematic repres-entation of a typical WPT-EV domestic installation co-sited with an installation in the amateur ser-vice. It will be noted that it is entirely feasible (indeed likely in many cases) that the antenna for the amateur service installation is within 10m of the WPT installation.
Figure 2 – schematic of a typical dwelling house location in the UK
4 Levels of emissions in the spurious domain
The present ITU limits for emissions in the spurious domain from short range devices are defined in ITU-R SM.329-12 [5]. These limits do not, of themselves, claim to provide adequate protection from harmful interference, but there is evidence that they are being taken as a planning basis by some developers of WPT systems. Nonetheless, taking these limits as a basis for system performance al-lows an assessment to be made of the gap between proper protection of stations in the amateur service and WPT-EV emissions, should these be at the limit set out in SM.329-12. Figure 3 below shows the levels from SM.329-13 and P.372-12. It will be seen that there is a very significant gap between these levels.
Spurious emissions at the SM.329-12 level will exceed the noise level by 40-50 dB, which would clearly have a very harmful effect on radio services operating at low signal to noise ratios. The basis for the data in this graph is set out in Annex 2.
Figure 3: Graphical representation of ITU_R SM.329-12 emissions limits compared with background noise levels in ITU-R P.372-13
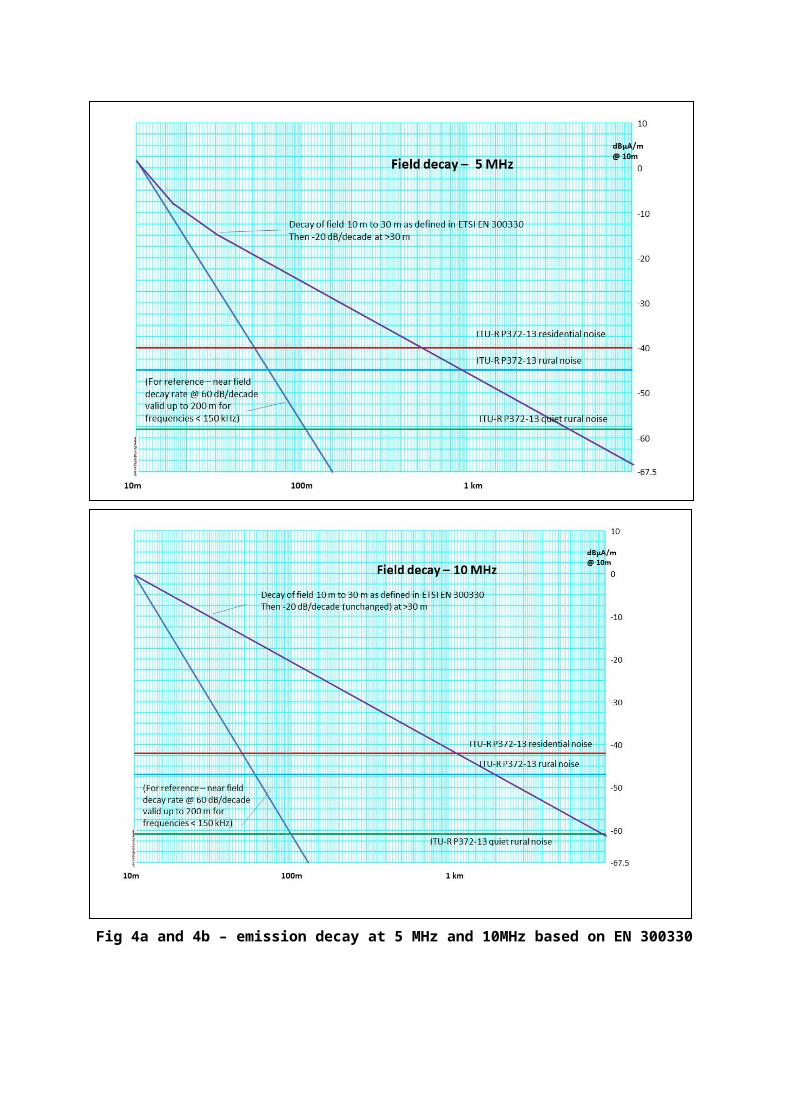
Furthermore, the characteristics of the emissions from inductive devices is being defined in, inter alia, the draft Harmonised Standard ETSI SM 300330 [11]. Although previous modelling has often assumed a “near-field” decay rate of 60 dB/distance decade, the ETSI document shows that decay rates of the emissions depend on frequency. Appendix I of EN 300330 sets out the relevant decay rates for adjustments of measuring distance from 10m to 30m and combining this with other data on near-field to far-field transition distances allows an assessment to be made of the emissions from a WPT-Electric Vehicle systems with emissions (measured at 10m) at the limit of ITU-R SM-329.Using this data, the plots on the next page (figures 4a and 4b) show the projected emission field at 5 MHz and 10MHz arising from harmonics of the WPT system which are at the SM-329 limit when measured at 10m.
It will be seen that at 5MHz, the emissions exceed the rural background noise at distances of up to 250m from the WPT installation and at 10 MHz this distance increases to 1.5 km. This gives added weight to the argument that spurious emissions measured at 10m need to be very significantly be-low the limits in ITU-R SM 329-12 to prevent harmful interference to radio services.
Given the planned density of WPT-Electric Vehicle systems, there will be a widespread and serious impact on radio communications operating in the vicinity should spurious emissions, measured at 10m be at the limits set in ITU-R SM329-12 (which broadly corresponds to the limits of CEPT ERC Rec 74-01).
Fig 4a and 4b – emission decay at 5 MHz and 10MHz based on EN 300330
5 An appropriate level of protection
For small-signal services, there are established precedents for limiting the increase of background noise to 0.5 dB [9]. This provides a reasonable level of protection.
ITU-R SM.329-12 currently sets the limits for spurious emissions as:
Short range devices operating below 30 MHz:29 – 10 log( f (kHz)/9) dB(μA/m) at 10 m for 9 kHz < f < 10 MHz–1 dB(μA/m) at 10 m for 10 MHz < f < 30 MHz–36 dBm for 30 MHz ≤ except frequencies below < 1 GHz–54 dBm for ƒ within the bands 47-74 MHz, 87.5-118 MHz, 174-230 MHz, 470-862 MHz–30 dBm for 1 GHz ≤ f < (see recommends 2.5)
Taking this with reference to the residential and rural lines of ITU-R P.372-13, and assuming that WPT(EV) emissions are unstable in frequency or are not all exactly on a common frequency and/or with levels of phase or sideband broadband noise, then this gives a maximum permissible spurious emission of approximately:
-21.5 -10 log( f (kHz)/9) dBμA/m for 9kHz < f < 10MHz and-52 dBμA/m for 10MHz < f < 30MHz
- when measured in 10kHz bandwidth and at 10m distance.
Similar degrees of improvement are also needed at f > 30 MHz
If WPT(EV) is a highly stable pure sinusoidal signal, with broadband noise no higher than the above, then the amateur service signals are more tolerant to some level of interference from the sinusoidal emission. In such a case then harmonics of the pure sinusoid could reasonably be permitted to ex-ceed the above level by some 20 dB.
6 Measuring existing systems
A study of some of the data submitted on measurements of existing WPT systems shows that meas-urements of the background noise level in some reports on emissions from WPT(EV) systems appear to be seriously technically flawed, as a result of using measuring equipment that simply lacks the sensitivity to measure the true background noise level.
For background noise measurements between 3-30 MHz as a rule of thumb a minimum system sens-itivity of -158dBm/Hz is needed to perform a meaningful measurement. Noise in the measuring sys-tem (particularly the active antenna) presents a false impression of the true background noise levels. In particular the studies included in the current ITU-R PDNR for WRC Agenda Item 9.1.6, present an inaccurate picture of the true noise levels through use of inappropriate measuring equipment Annex 3 seeks to summarise these issues.
Great care is therefore needed, when seeking to measure the background noise levels at a test site, to ensure that appropriate antennas and test receivers are used for the levels of emissions anticip-ated. Tests so far have often failed to properly reflect the full dynamic range of the spectrum in question.
It is very likely that, given the protection requirements necessary to prevent harmful interference to radio services from WPT, new test methods and procedures will be needed to be specified.
6 Summary
Preservation of the utility of the radio spectrum must be a prime objective in the introduction of new technologies; this is enshrined in Articles 15.12 and 15.13 of the Radio Regulations [10]. WPT for Electric Vehicles will cause significant and widespread damage to the radio spectrum unless ap-propriate standards and limits are established which are significantly more stringent than those ex-isting at present. This study shows that existing limits fail to provide adequate protection and that a tightening of these limits is an essential element of the introduction of WPT (EV) technology. Without this, co-existence of radio communications services and WPT-Electric Vehicle systems in the same environment is not viable.
ANNEX 1: LIST OF REFERENCES
[1] ITU-R M.1732-2 - Characteristics of systems operating in the amateur and amateur-satellite ser-vices for use in sharing studies
[2] ITU-R P.372-13 – Radio Noise (09/2016)[3] ITU-R R12-WP3L-0094: Study on the present condition of man-made noise derived from
the SG 3 radio noise databank (27 August 2014)[4] ITU-R R15-WP5B-C-0411 Working document towards A Preliminary Draft New Report
ITU-R M.[HF NOISE AT SEA][5] ITU-R SM.329-12 Unwanted emissions in the spurious domain (09/2012)[6] EN 50561-1:2013 Power line communication apparatus used in low-voltage installations. Radio
disturbance characteristics. Limits and methods of measurement. Apparatus for in-home use[7] ITU-T G.993.2 Amendment 2 (03/2016) Very high speed digital subscriber line transceivers 2
(VDSL2), (Section 7.2.1.2 Egress Control); https://www.itu.int/rec/T-REC-G.993.2 [8] ITU-T G.9700 Amendment 2 (06/2017) Fast access to subscriber terminals (G.fast) - Power spec-
tral density specification (Section 6.5 Notching of specific frequency bands)https://www.itu.int/rec/T-REC-G.9700-201706-I!Amd2/en
[9] ITU-R SM.2158 Impact of power line telecommunication systems on radiocommunicationsystems operating below 80 MHz
[10] Radio Regulations:15.12 § 8 Administrations shall take all practicable and necessary steps to ensure that the opera-tion of electrical apparatus or installations of any kind, including power and telecommunication distribution networks, but excluding equipment used for industrial, scientific and medical applic-ations, does not cause harmful interference to a radiocommunication service and, in particular, to a radionavigation or any other safety service operating in accordance with the provisions of these Regulations.
15.13 § 9 Administrations shall take all practicable and necessary steps to ensure that radiation from equipment used for industrial, scientific and medical applications is minimal and that, out-side the bands designated for use by this equipment, radiation from such equipment is at a level that does not cause harmful interference to a radiocommunication service and, in particular, to a radionavigation or any other safety service operating in accordance with the provisions of these Regulations.
[11] EN300330 Short Range Devices (SRD); Radio equipment in the frequency range 9 kHz to 25 MHz and inductive loop systems in the frequency range 9 kHz to 30 MHz; Harmonised Standard (draft) covering the essential requirements of article 3.2 of the Directive 2014/53/EU
Annex 2 – data sources for Figure 3 and 4a/4b(a) ITU-R SM.329-12 Unwanted Emissions in the Spurious Domain
Table 3 – Short range devices – limits stated as:29 – 10 log( f (kHz)/9) dB(μA/m) at 10 m for 9 kHz < f < 10 MHz–1 dB(μA/m) at 10 m for 10 MHz < f < 30 MHz–36 dBm for 30 MHz ≤ except frequencies below < 1 GHz–54 dBm for within the bands 47-74 MHz,87.5 118 MHz, 174-230 MHz, 470-862 MHz–30 dBm for 1 GHz ≤ f < (see recommends 2.5)All in 10 kHz bandwidth, measured at 10m distance
This computes to:Freq Limit per Table 3
kHz dbμA/m100 18.51,000 8.510,000 -1.5
(b) ITU-R P.372-13 – Radio Noise
Background NoiseFor a vertical monopole: En = Fa + 20 log fMHz + B – 95.5 dBμV/m or En = Fa + 20 log fMHz + B – 95.5 - 51.5 dBμA/m*Reference bandwidth (b) = 10 kHz and where B=10 log(bHz)* Converted at the impedance of free space
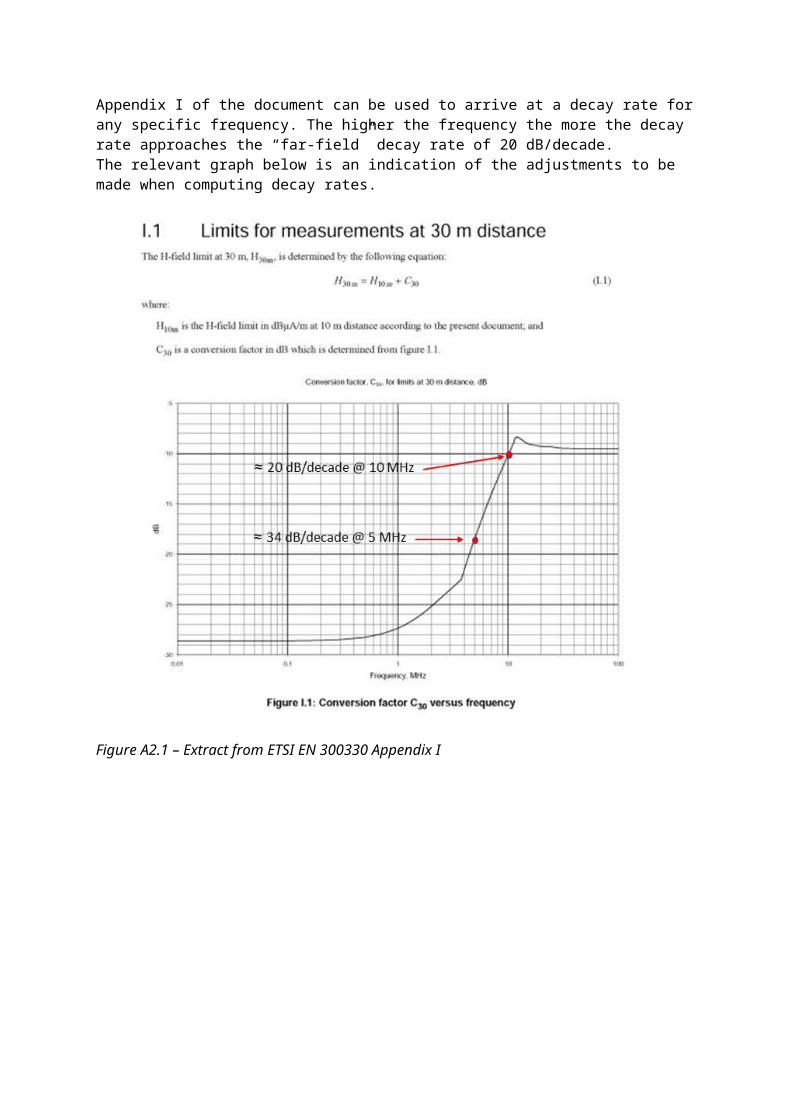
The rate of decay of the field of spurious emissions has been computed from the draft EN 300330 European Harmonised Standard. This standard defines the correction factors to be used when meas-urement of emissions from inductive “short range devices” is done at a distance other than that specified in standards. The graphs in Appendix I of the document can be used to arrive at a decay rate for any specific frequency. The higher the frequency the more the decay rate approaches the “far-field” decay rate of 20 dB/decade.The relevant graph below is an indication of the adjustments to be made when computing decay rates.
Figure A2.1 – Extract from ETSI EN 300330 Appendix I
Annex 3
Measurement methodologies for emissions from WPT(EV) systems
H-field radiated emissions may be measured using an active measuring loop antenna according to EN55016, sections 4.3.2 and 4.4.2 (see Ref. 1).It should be noted that for an untuned electrically-screened active loop antenna, the measuring sys-tem noise floor will generally be determined by the noise of the pre-amplifier in the active antenna. This measuring system noise is generally substantially higher than the man-made noise or natural atmospheric noise at all ITU-R P.372-13 environmental categories, i.e. City, Residential, Rural and Quiet Rural.
A note in EN55016 Section 4.4.2 states that tuned electrically balanced loop antennas may be used to make measurements of magnetic field strengths lower than with untuned electrically-screened loop antennas where the noise level is approximately 25 dB higher.The use of a measuring system with a relatively high measuring system noise floor has two con-sequences:
The measuring system is not representative of some radio communication systems that are to be protected by EMC standards.
The true background man-made or atmospheric noise level cannot be measured as it is sub-stantially lower than the measuring system noise floor.
The measuring system noise floor for various measuring antennas compared with ITU-R .P372-13 median man-made noise levels is shown in Figure 3 below. All field strengths are either average or RMS in 9 kHz bandwidth.
Curve 'A' shows the smallest detectable field strength (average) for a Rohde and Schwarz HFH2-Z2 active loop antenna. This is derived from the typical values given on the manufacturer's data sheet.Curve 'B' shows the smallest detectable field strength (RMS) for a Schaffner-Chase HLA6120 active loop antenna. This is derived from measurements made in a shielded enclosure.Curve 'C' shows the noise floor (RMS) of a custom version of the Schaffner-Chase HLA6120 that is 30 cm diameter instead of the standard 60 cm diameter type. This antenna was used by Ofcom for WPT tests and its use results in a measuring system noise floor that is 8 - 9 dB higher than the stand-ard 60 cm antenna.
Curve 'D' shows the field strength sensitivity for 0 dB SNR for the Rohde and Schwarz HM525 loop. This antenna has five switched ranges A - F. It is designed for laboratory use and would require a suitable non-conductive cover for outdoor use. The curve is derived from the typical values given on the manufacturer's data sheet, using the most sensitive range at each frequency.Curve 'E' shows the measured noise floor (average) of a set of tuned loops type AY3920. These allow a measuring system noise floor, equivalent to 0 dB(V/m) or lower, to be achieved from 1 MHz to 30 MHz.
Figure 3: Measuring system noise floor for various measuring antennas compared with ITU-R P.372-13 noise levels
References[1] EN 55016-1-4:2010+A1:2012
Specification for radio disturbance and immunity measuring apparatus and methods.Part 1-4: Radio disturbance and immunity measuring apparatus — Antennas and test sites for radi-ated disturbance measurements
ECCElectronic Communications Committee
CE
PT
SE24
Doc. SE24(19)XX
SE24 #97
Ankara, Turkey, 8-10 April 2019
Date issued: [enter date]
Source: [enter source]
Subject: [enter subject]Group membership required to read? (Y/N)
Summary:
Following the publication of ECC Report 289 and other work in SE24, this document provides more informa-tion about modelled spurious emission levels from WPT systems. It is provided as an input to SE24 to sup-port further work on defining and publishing appropriate spurious emission limits for WPT
Proposal:
invites Group to consider the emission levels modelled in this document and develop proposals for spurious emission limits for WPT in conjunction with SE21 and SRD/MG as appropriate.
Background:
ECC Report 289 and documents submitted to the WI60 Rapporteur’s group provide valuable information on the projected density of WPT systems (both EV and generic). This enables modelling to be undertaken of the spurious emission levels to be expected from such systems, given that projected density of deployment. It provides the basis for defining the probability of spurious emissions being at or above specific levels. This work is described in this document and is submitted for consideration as part of the process of developing appropriate spurious emission limits to properly protect radio communications services.
N
Emission fields in the spurious domain from WPT systems
1 Introduction
This document sets out an analysis of the emissions in the spurious domain from WPT systems, con-sidered as point source radiators, deployed on a grid. The grid points are based on the projected density of deployment in suburban environments of both WPT-EV and other WPT SRD systems and the results are submitted as an input to consideration of matters of compatibility between WPT sys -tems and radiocommunications services.
The data supplied so far on WPT spurious emissions suggest that they will be both of high duty cycle and rich in harmonic content, potentially adversely impacting the whole LF, MF and HF radio spec -trum. This is a serious strategic issue for the future of radio communications. The LF and HF radio spectrum is the only part of the radio spectrum capable of supporting global point-to-point commu -nication without the need for intermediate infrastructure, and as such represents a strategic asset in the event of failure or destruction infrastructure communications links supporting other means of global communication. Extreme care is needed before sanctioning a rise in background noise level of the magnitude suggested by the current projected WPT emission limits.
This document is structured in two sections, the first relating to WPT-EV and the second relating to generic WPT SRDs.
2 WPT for electric vehicles
ECC Report 289 Annex 5 sets out the findings in the “Stille” study of projected WPT-EV deployment.
The basis for the installed density statistics is an assumption of 28m electric vehicles in 2025 with a 1.7% take-up of WPT, and 71m vehicles in 2030 with a 2.3% take-up. This leads to installed densities in urban environments of 17 and 64 units / km2 respectively. In rural areas, the relevant densities are 0.7 and 2.5 units / km2.
To translate this to a physical installed density a linear distribution of these units on a grid. This gives a grid of 242m spacing in 2025 and 125m spacing in 2030 in urban areas. Figure 1 overleaf thus shows the deployment of the WPT systems in 2030. These grid spacings can then be developed to ascertain distances from each point source for assessing emission levels.
Figure 1: Average installation density of WPT-EV systems in 20302
There are two distances for consideration:a) The half-way point between two point sources (Emission point A). Self evidently this is 121m
in 2025 and 62.5m in 2030. At this point, the victim receiver is subject to emissions of equal strength from two WPT systems (and lower emissions from others).
b) The furthest distance that a victim receiver can statistically be located – which is 171m in 2025 and 88m in 2030 - is simply determined through Pythagoras (Emission point B). At these points the victim receiver is subject to emissions at equal strength from the four near-est systems.
The rate at which emissions decay from the emission level measured at 10m distance, depends on frequency. EN 300330 sets out the conversion factor by frequency for conversion from 10m distance to 30m. Decay rates approach far field rates (20dB/distance decade) at distances > λ/2π. So at 30m separation, for frequencies above 1.6 MHz the emissions decay at 20 log (d1/d2) from that point.
For the purposes of developing a “heat map”, this document considers five frequencies for model -ling: 900 kHz, 1.6 MHz, 1.8 MHz, 5 MHz and 10 MHz.
Table 1 below sets out the emission levels at various distance, compared with the level of emissions at 10m distance. This allows the model to be applied to any emission specified at 10m distance. The table uses the installed density and separation distances relevant to 2030.
Table 1 – emission levels relative to those at 10mSee text for basis of calculation.
This table therefore defines the minimum interference level from a grid of WPT installations each operating with the same level of spurious emissions. Whatever emission level is defined at 10m measurement distance, the minimum emission field strength anywhere (ie 100% probability of im-pact) is defined by the figure at 88.4m distance. The probability of being impacted at the 62.5m emission level or above is given by the relative areas of the four 62.5m circles, compared to the total area, or 62.52 x 4 x π / 2502 x 100% or 78.5%
2 Project Stille – see ECC Report 289 Annex 5
3 Using EN300330 Annex I for 10 to 30m conversion
18
This data has been built in to a spread sheet which presents emissions for these five frequencies at 10, 30, 62.5 and 88m spacing from the source for a given level of emission specified at 10m.
The file is embedded here:
3 Generic WPT
A working document submitted to SE24 sets out a summary of the current limits which are assumed to apply to generic SRD inductive WPT devices, together with use data and projected deployment density. Table 2 overleaf summarises a few examples of devices that are expected to be deployed, with power levels and installation density.
19
Device type ex-amples
Frequency range Power Operating duration (hrs/day)
Installed density (units / km2)
Mobile phone char-ger
90 kHz – 13.567 MHz
1W<P ≤ 5W 8 5,000
Tablets/notebooks etc
90 kHz – 13.567 MHz
5W < P < 31.5W 8 5,000
Power tools etc 90 – 205 kHz P < 200W 8 Up to 6,700
Kitchen appliances 20-79 kHz P < 2.4kW 2.5 1/household
Table 2 Projected installed densities of various non-EV inductive SRD WPT devices (Data taken from spreadsheet presented to SE24 WI60 group by WPT developers)
All the above devices are stated as currently being subject to the spurious emission limits in ERC Rec 74-01.
For the purposes of creating a “heat map” for this sub-set of WPT devices, we will assume an in-stalled density of 5,000/km2. This suggests a grid of 14m spacing. Using the same approach as in section (2) above, we can see the maximum distance from a device becomes 10m (14/2 x √2)This coincidentally results in each radio receiver in the area being subjected to emissions at the level set out in ERC 74-01. For 78.5% of them, which are within the 7m radius, the emissions are 9.3 dB above that level (60 x log10 (10/7))
4 The impact of the spurious emissions
Radiocommunications services protection ratios are set out in ITU-R F.240 (Signal-to-interference protection ratios for various classes of emission in the fixed service below about 30 MHz). Most HF radiocommunication services rely on operating with a relatively modest signal-to-noise ratio, imply-ing that the received signal is as little as 10-15 dB above the background noise for effective commu -nication. Figure 2 overleaf shows the wide gap between current ERC 74-01 limits and the back-ground noise level. It will be seen, for example, at 5 MHz, the ERC 74-01 limit is some 35dB above the residential background noise level and, self-evidently significantly above the signal level in typ -ical point-to-point radiocommunications services.
20
Figure 2 ERC 74-01, ITU-R SM.329-12 and CISPR 11 compared to ITU-R P.372-13 noise levels
The data earlier in this document has been developed on the basis that WPT devices use the full scope offered by ERC 74-01 in terms of spurious emission limits. A number of factors make the nature of spurious emissions from WPT systems particularly harmful to radiocommunications ser-vices. Some of these are:
- A number of WPT systems adjust their operating frequency to achieve optimum coupling to the device being charged. Many WPT systems use a relatively low operating frequency (in the order of 80 kHz – 150 kHz). This means that the higher order harmonics of the operating frequency can lie anywhere in the HF spectrum. Assuming a retuning range of just 500 Hz at the operating frequency, Table 3 below shows the occurrence of harmonics at around 2 MHz
Table 3: Harmonics from WPT systems operating in the 85-90 kHz range with 500Hz tuning range
21
It will be seen that there is overlap between the nth harmonic and the n+1th, meaning that no frequency is immune to spurious emissions. This pattern continues at higher frequencies in the radio spectrum. It can only be avoided if WPT adopts a single tightly controlled operat-ing frequency
- WPT systems are high duty cycle, meaning the interference from such systems cannot be treated as “transient” or short term.
- As shown in this document WPT systems are projected for high density deployment, mean-ing that proximity to a radio received is assured
Taken together, these factors can have a serious and irreversible impact on radio communications services and the radio spectrum should WPT systems be permitted to adopt ERC 74-01 as their spuri -ous emission limit.
SummaryThis document has assessed the minimum levels of spurious emissions interference that can be ex -pected from WPT systems, operating within the limits of ERC 74-01 with the projected deployment densities.
These levels clearly represent a serious threat to existing radiocommunications services. An appropriate next step would be to undertake studies on the actual spurious emission perform-ance of the WPT devices concerned, and from that to determine what appropriate and practicable levels of spurious emission limits should be defined for high density, high duty cycle inductive SRDs, both WPT-EV and generic WPT.