1 10 steps to developing a dashboard of key metrics BY E. BRADLEY TISDALE Reporng key metrics can make the difference between an overwhelming amount of data and clear, concise mes- sages to the CFO’s various audiences— messages that enable them to manage change in their instuons. Brad Tis- dale, chief financial officer of Reformed Theological Seminary, presents 10 steps to developing an effecve dashboard— or flash report—and shares different formats that have proven successful with senior execuves, board members, and academic officers. As CFOs, we have available to us a wealth of data that can be overwhelming even to the most sophiscated of board members and senior administrators. But presented in a new, strategic way through a dashboard or flash report, this data can become precisely the tool that our various audiences need to be successful in their roles. At some point, you just need to dive in and start reporng in this new way, whether or not your report is completely perfect, or even beauful. We have access to the data, and we have a responsibility to communicate it in an effecve manner. Ten steps can get you started: 1. Define your audience. A new flash report provides an opportunity to reach out to each constu- ency in a way that is meaningful to them. Focus on the reader’s perspecve by asking yourself, What is my board or finance commiee con- cerned with? Where does the president want to take the school? What does the dean like to talk about? Now, how do I best report to each of these groups? 2. Start with what you have. Aggregate the reports you are already generang to assess the data available, such as monthly reports (e.g., depart- mental statements, giſt/tuion reports, internal financials, investment reports, etc.) or annual re- ports (e.g., audited financial statements, IRS Form 990, total credit-hour report, scholarship report, enrollment reports, professor course lists, etc.). 3. Group vital informaon into key categories. What do you want to highlight from the income state- ment or balance sheet? Decide if you want to compare actual to budget or to prior years’ actual results. How can you measure your success in
Transcript
1
10 steps to developing a dashboard of key metricsBy E. BradlEy TisdalE
Reporting key metrics can make the difference between an overwhelming amount of data and clear, concise mes-sages to the CFO’s various audiences—messages that enable them to manage change in their institutions. Brad Tis-dale, chief financial officer of Reformed Theological Seminary, presents 10 steps to developing an effective dashboard—or flash report—and shares different formats that have proven successful with senior executives, board members, and academic officers.
As CFOs, we have available to us a wealth of data that can be overwhelming even to the most sophisticated of board members and senior administrators. But presented in a new, strategic way through a dashboard or flash report, this data can become precisely the tool that our various audiences need to be successful in their roles. At some point, you just need to dive in and start reporting in this new way, whether or not your report is completely perfect, or even beautiful. We have access to the data, and we have a responsibility to communicate it in an effective manner. Ten steps can get you started:
1. Define your audience. A new flash report provides an opportunity to reach out to each constitu-ency in a way that is meaningful to them. Focus on the reader’s perspective by asking yourself, What is my board or finance committee con-cerned with? Where does the president want to take the school? What does the dean like to talk about? Now, how do I best report to each of these groups?
2. Start with what you have. Aggregate the reports you are already generating to assess the data
available, such as monthly reports (e.g., depart-mental statements, gift/tuition reports, internal financials, investment reports, etc.) or annual re-ports (e.g., audited financial statements, IRS Form 990, total credit-hour report, scholarship report, enrollment reports, professor course lists, etc.).
3. Group vital information into key categories. What do you want to highlight from the income state-ment or balance sheet? Decide if you want to compare actual to budget or to prior years’ actual results. How can you measure your success in
2
meeting the mission (e.g., number of graduates, placement rate, professor course loads, average class sizes, percentage of MDivs to total enroll-ment, average scholarship per student etc.)? How can you measure internal operational efficiency (e.g., part- to full-time employee ratio, cost per credit hour, percent of adjunct usage, etc.)? This step is a key opportunity for the CFO to direct the conversation where we want and where we feel it is needed to manage change in the organization.
4. Keep it simple. Remember your audience. You are reporting not only to the top administrators but also to board members and other administrators who might be scattered across multiple locations. Don’t overwhelm. Boil the dashboard down to a good mix of 10 or 12 key performance indicators and prioritize them for presentation. But don’t bypass reporting on the vital, basic information in order to show a new fancy ratio. Try to keep the dashboard to one page.
5. Be flexible. Mix metrics if they speak to the same issue. If your school is tuition driven, then it makes sense to weight the dashboard in that direction, so for example, reporting fall head count, scholarship percentages, and student accounts receivable will spark conversation on a few different levels. Re-serve the right to change certain data points from report to report if they don’t seem to add value or generate any interest.
6. Personalize the data. Ask, What information does [the president, the board, the dean, and so forth] need to know to be successful? What do I want them to know? Put yourself in their shoes and pull together data that would be meaningful to them.
7. Make the timing appropriate to the audience. De-termine the best timing and frequency for sharing metrics with various audiences (e.g., campus presi-dents or department managers monthly, chancellor or president quarterly). Consider a targeted report-ing for the executive committee or board three times a year that focuses on enrollment and tuition in the fall, annual giving in the winter, and key an-
nual metrics in the summer after the fiscal year end.
8. Use graphics to reinforce your message. Color code changes from year to year. Use graphs or pie charts to tell the story, which will reduce the need to decipher a bunch of numbers on the paper. Color code up/down arrows to indicate positive/negative change. The use of Sparklines in Excel can also help to present trends visually without taking up a lot of space.
9. Collaborate with others. Identify key conversa-tion partners with whom you can discuss the big picture of what’s happening in your institution. This will bring out new ideas on which to start reporting. Coordinate your reporting with others, such as the development office, to make sure the numbers are consistent and accurate.
10. Put it out there. You have to start somewhere. Your flash report can be your microphone, and you already have enough information to pull one together . . . even if it’s not perfect or presents sensitive issues. Understanding that it can adapt over time . . . just do it!
E. Bradley Tisdale is chief financial officer of Reformed Theological Seminary. This article is adapted from his presentation at the Financial Officers and Technology Professionals Conference sponsored by the Association of Theological Schools in San Antonio, Texas, in November 2014.
THE FOLLOWING PAGES SHOW SAMPLES OF (1) A BOARD FLASH REPORT,
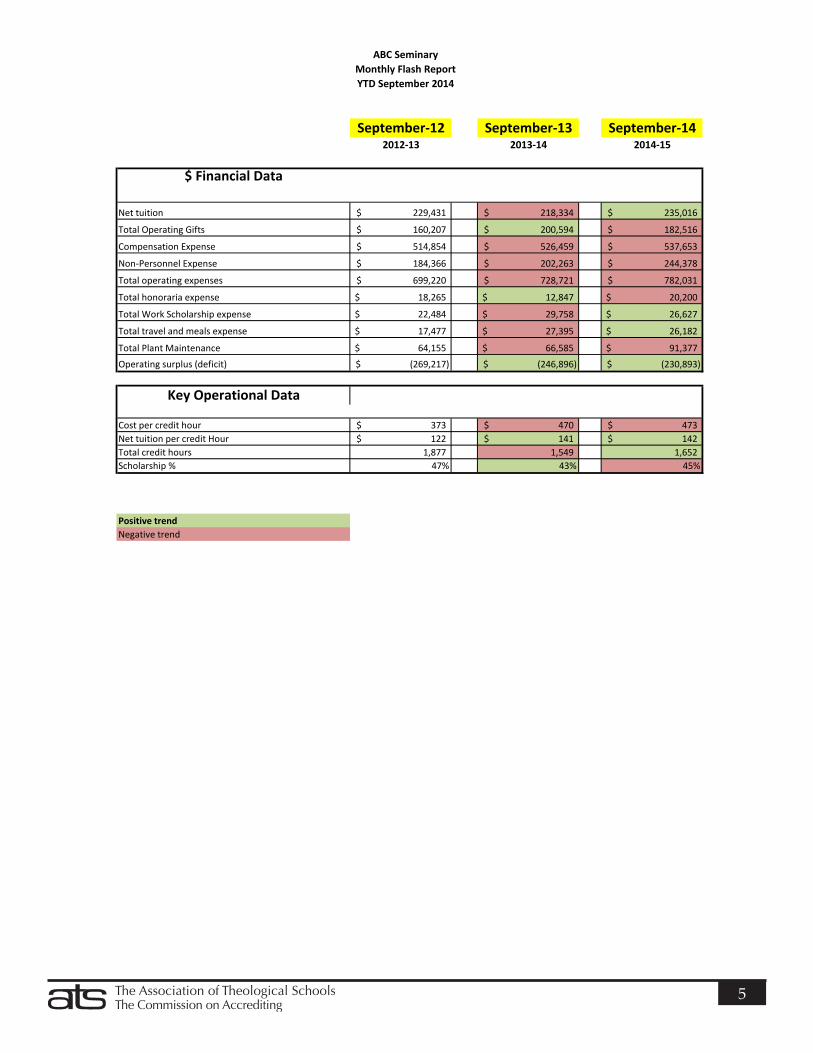
(2) AN OPERATIONAL FLASH REPORT, AND (3) A SIMPLE MONTHLY FLASH REPORT.
3
CONFIDENTIAL
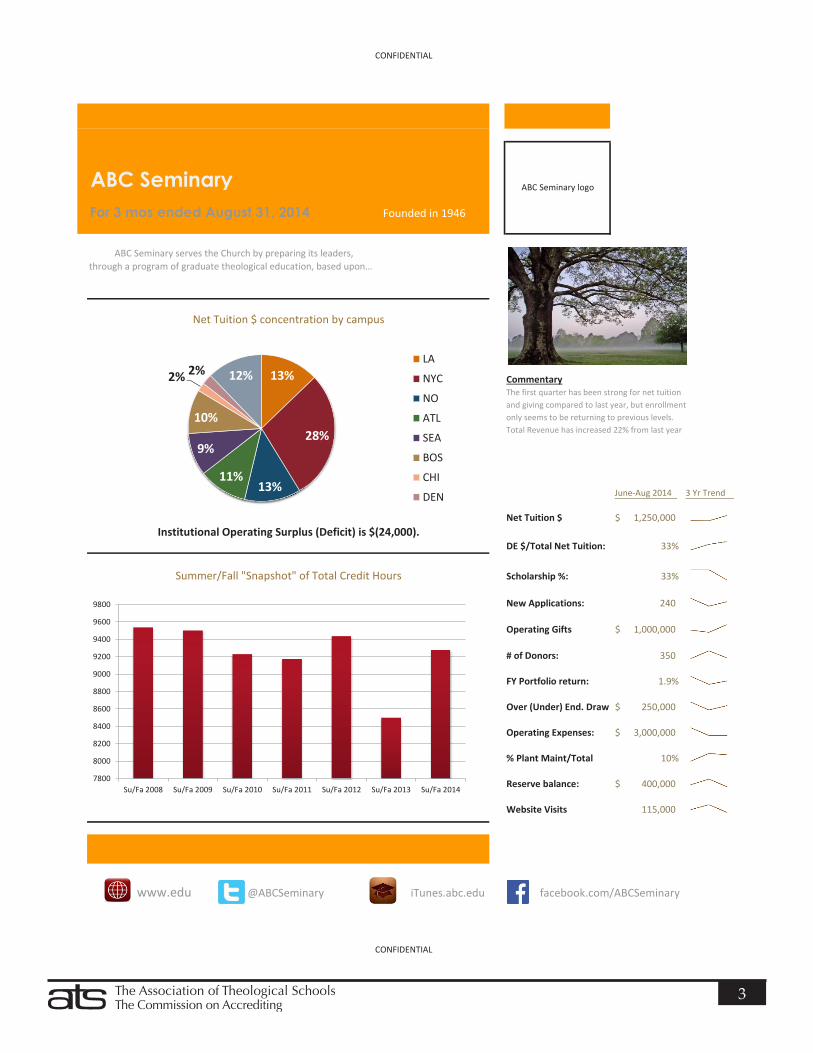
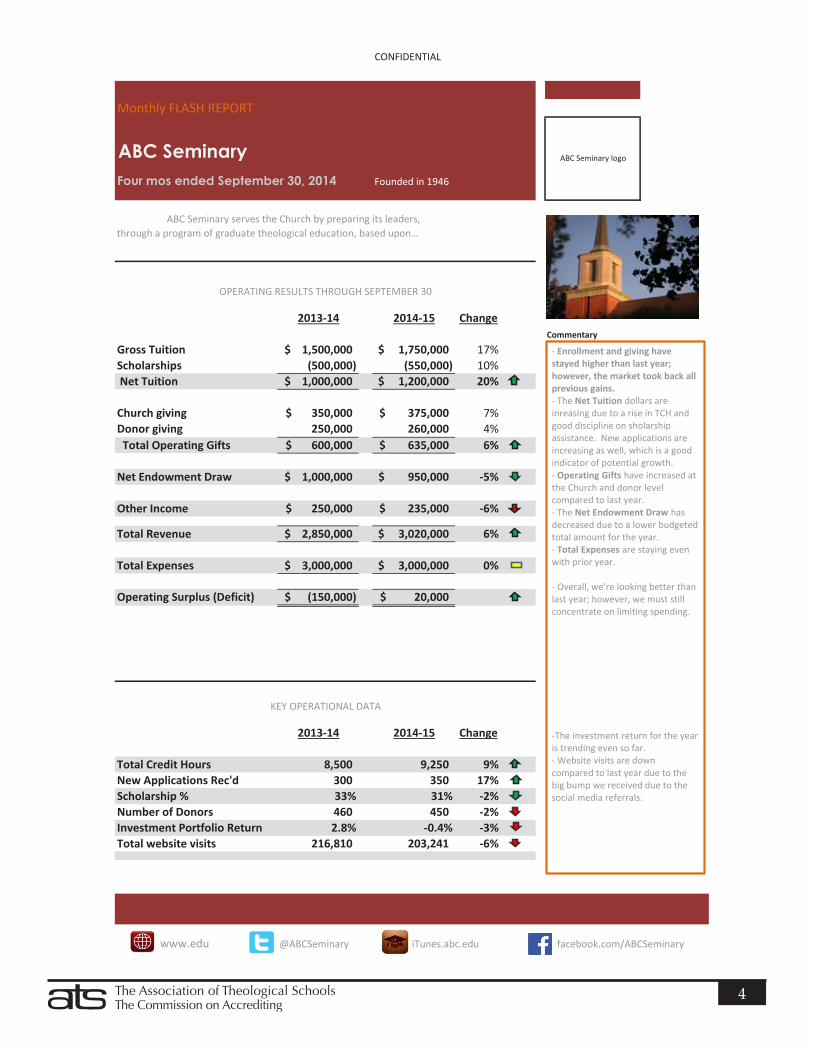
ABC SeminaryFor 3 mos ended August 31, 2014 Founded in 1946
ABC Seminary serves the Church by preparing its leaders,through a program of graduate theological education, based upon…
CommentaryThe first quarter has been strong for net tuitionand giving compared to last year, but enrollmentonly seems to be returning to previous levels. Total Revenue has increased 22% from last year
- Enrollment and giving have stayed higher than last year; however, the market took back all previous gains. - The Net Tuition dollars are inreasing due to a rise in TCH and good discipline on sholarship assistance. New applications are increasing as well, which is a good indicator of potential growth. - Operating Gifts have increased at the Church and donor level compared to last year. - The Net Endowment Draw has decreased due to a lower budgeted total amount for the year. - Total Expenses are staying even with prior year. - Overall, we're looking better than last year; however, we must still concentrate on limiting spending. -The investment return for the year is trending even so far. - Website visits are down compared to last year due to the big bump we received due to the social media referrals.
5
ABC SeminaryMonthly Flash ReportYTD September 2014