30
1/26/2016 1 KEY FINANCIAL METRICS & DASHBOARD REPORTING FOR HIGHER EDUCATION INSTITUTIONS Adam Smith Director [email protected] Jim Creeden Partner [email protected] January 26, 2016
1/26/2016
1
KEY FINANCIAL METRICS & DASHBOARD REPORTING FOR HIGHER EDUCATION INSTITUTIONS
Adam SmithDirector
Jim CreedenPartner
January 26, 2016
1/26/2016
2
• Participate in entire webinar• Answer polls when they are provided• If you are viewing this webinar in a group
Complete group attendance form with• Title & date of live webinar• Your company name• Your printed name, signature & email address
All group attendance sheets must be submitted to [email protected] within 24 hours of live webinar Answer polls when they are provided
• If all eligibility requirements are met, each participant will be emailed their CPE certificates within 15 business days of live webinar
TO RECEIVE CPE CREDIT
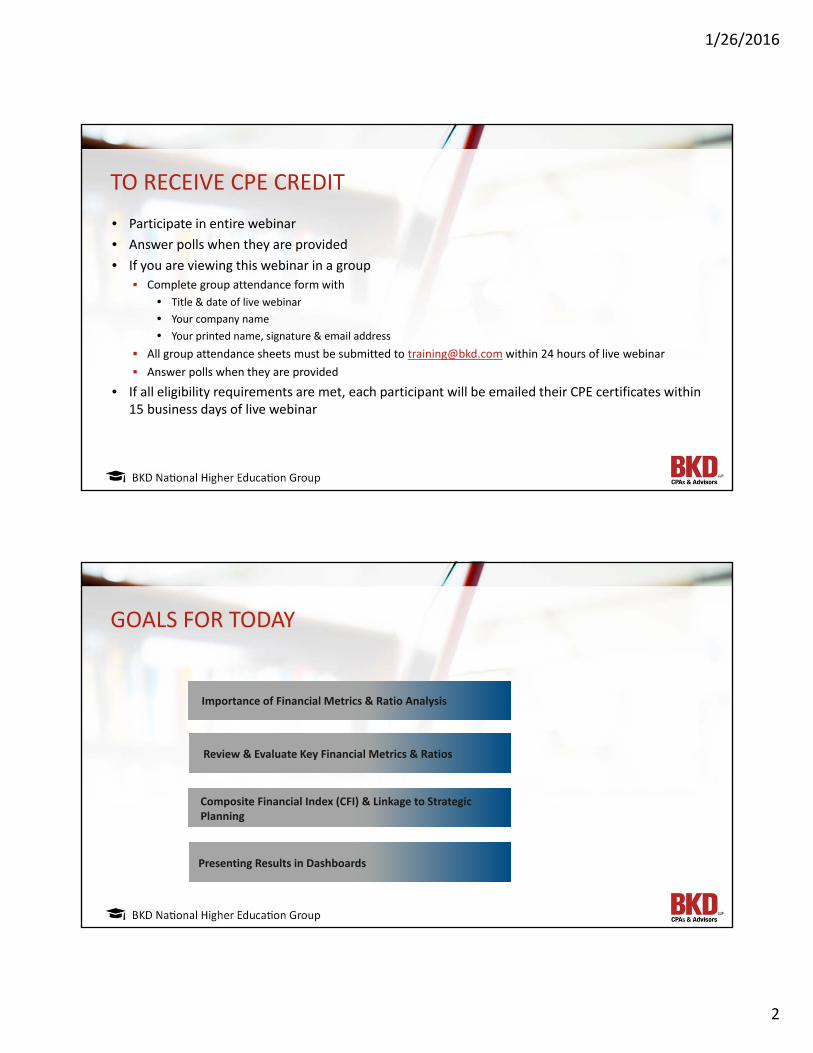
Importance of Financial Metrics & Ratio Analysis
Review & Evaluate Key Financial Metrics & Ratios
Presenting Results in Dashboards
Composite Financial Index (CFI) & Linkage to Strategic Planning
GOALS FOR TODAY
1/26/2016
3
• Why important? Recent economic factors & industry pressures Transparency Accountability
• Identification of financial risks• Method of communication to stakeholders• Risk with peer comparisons Apples vs. oranges?
FINANCIAL METRIC & RATIO ANALYSIS
• Four broad factors in assessing ratings Market profile Operating performance Wealth & liquidity Leverage
• Self-assessment & benchmarking
MOODY’S & S&P RATING CONSIDERATIONS
1/26/2016
4
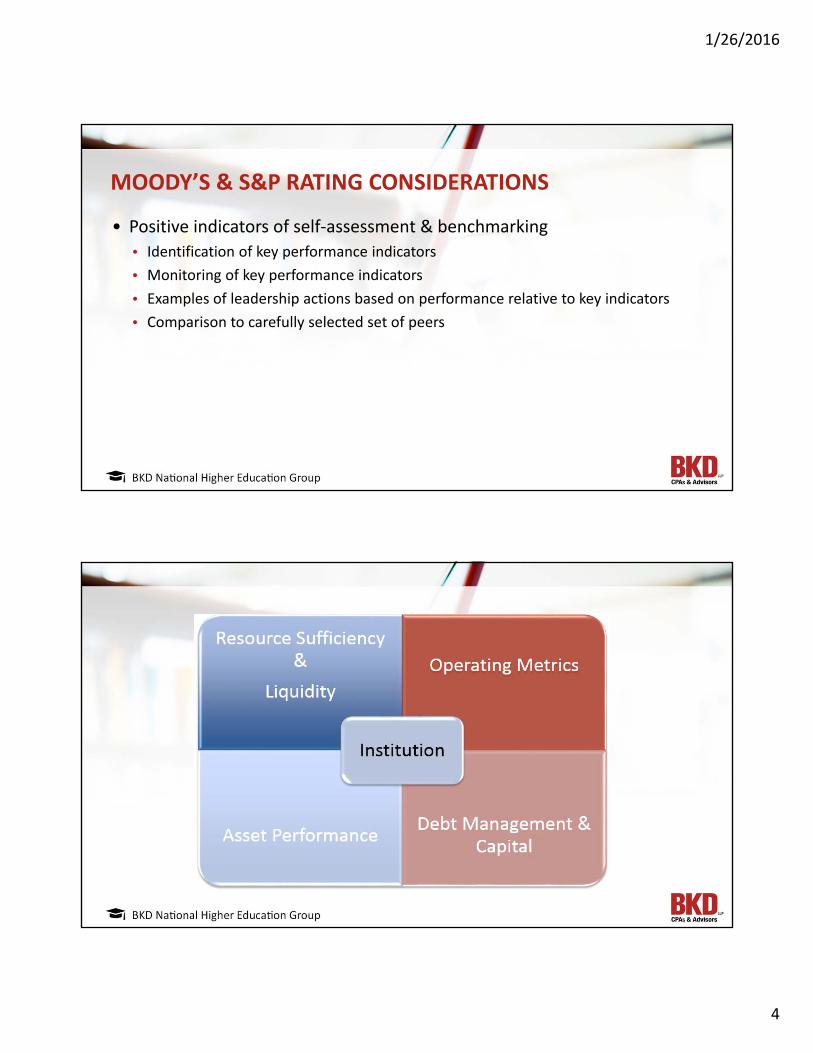
• Positive indicators of self-assessment & benchmarking• Identification of key performance indicators• Monitoring of key performance indicators• Examples of leadership actions based on performance relative to key indicators• Comparison to carefully selected set of peers
MOODY’S & S&P RATING CONSIDERATIONS
1/26/2016
5
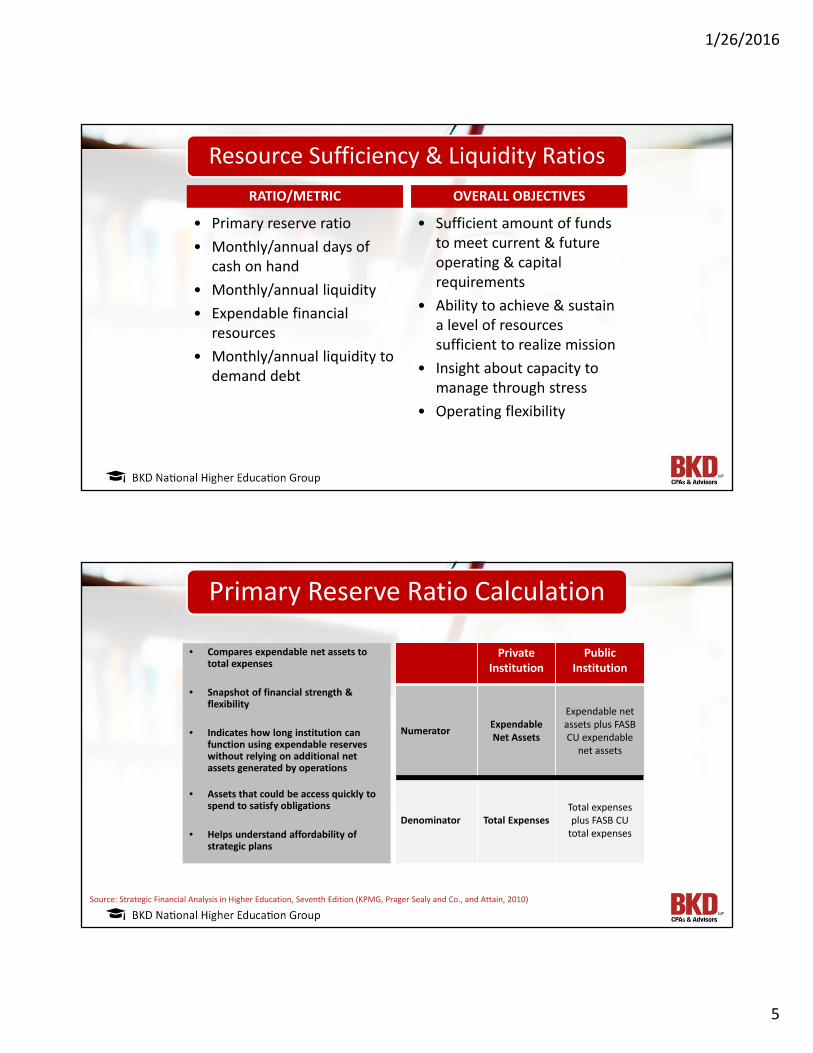
Resource Sufficiency & Liquidity RatiosRATIO/METRIC
• Primary reserve ratio• Monthly/annual days of
cash on hand• Monthly/annual liquidity• Expendable financial
resources• Monthly/annual liquidity to
demand debt
OVERALL OBJECTIVES
• Sufficient amount of funds to meet current & future operating & capital requirements
• Ability to achieve & sustain a level of resources sufficient to realize mission
• Insight about capacity to manage through stress
• Operating flexibility
Primary Reserve Ratio Calculation
Private Institution
Public Institution
Numerator Expendable Net Assets
Expendable net assets plus FASB CU expendable
net assets
Denominator Total ExpensesTotal expenses plus FASB CU
total expenses
• Compares expendable net assets to total expenses
• Snapshot of financial strength & flexibility
• Indicates how long institution can function using expendable reserves without relying on additional net assets generated by operations
• Assets that could be access quickly to spend to satisfy obligations
• Helps understand affordability of strategic plans
Source: Strategic Financial Analysis in Higher Education, Seventh Edition (KPMG, Prager Sealy and Co., and Attain, 2010)
1/26/2016
6
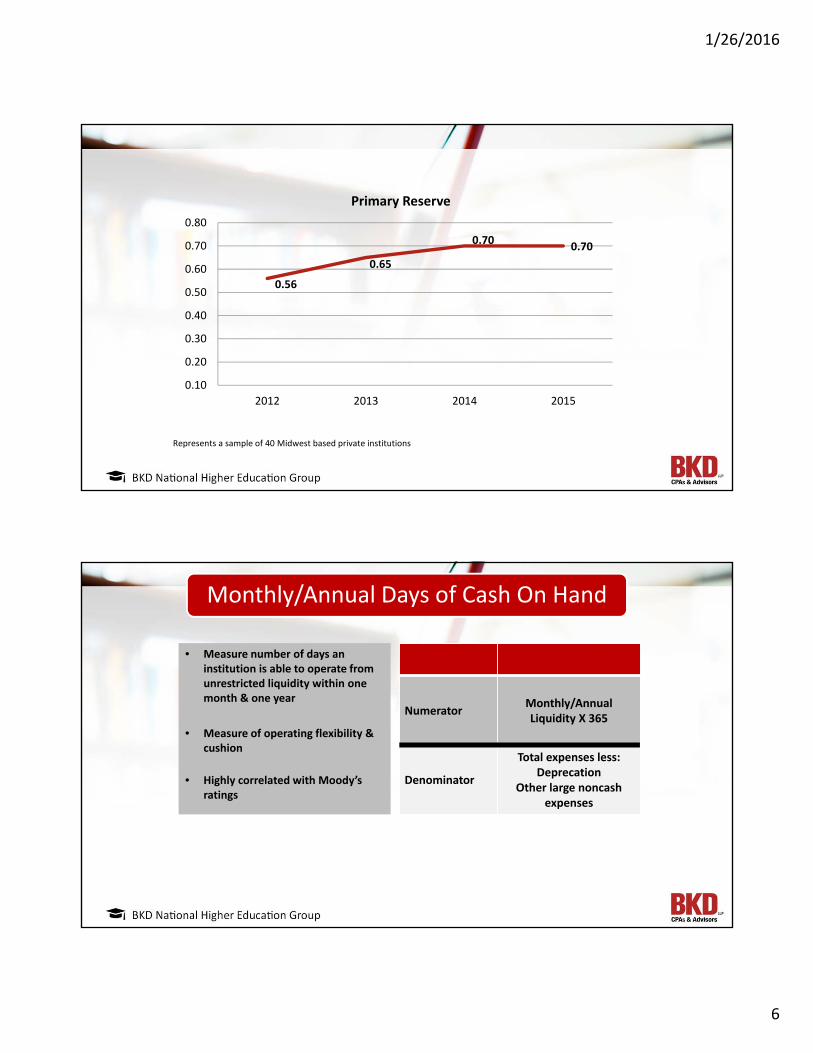
0.56
0.65
0.70 0.70
0.10
0.20
0.30
0.40
0.50
0.60
0.70
0.80
2012 2013 2014 2015
Primary Reserve
Represents a sample of 40 Midwest based private institutions
Monthly/Annual Days of Cash On Hand
Numerator Monthly/AnnualLiquidity X 365
Denominator
Total expenses less: Deprecation
Other large noncash expenses
• Measure number of days an institution is able to operate from unrestricted liquidity within one month & one year
• Measure of operating flexibility & cushion
• Highly correlated with Moody’s ratings
1/26/2016
7
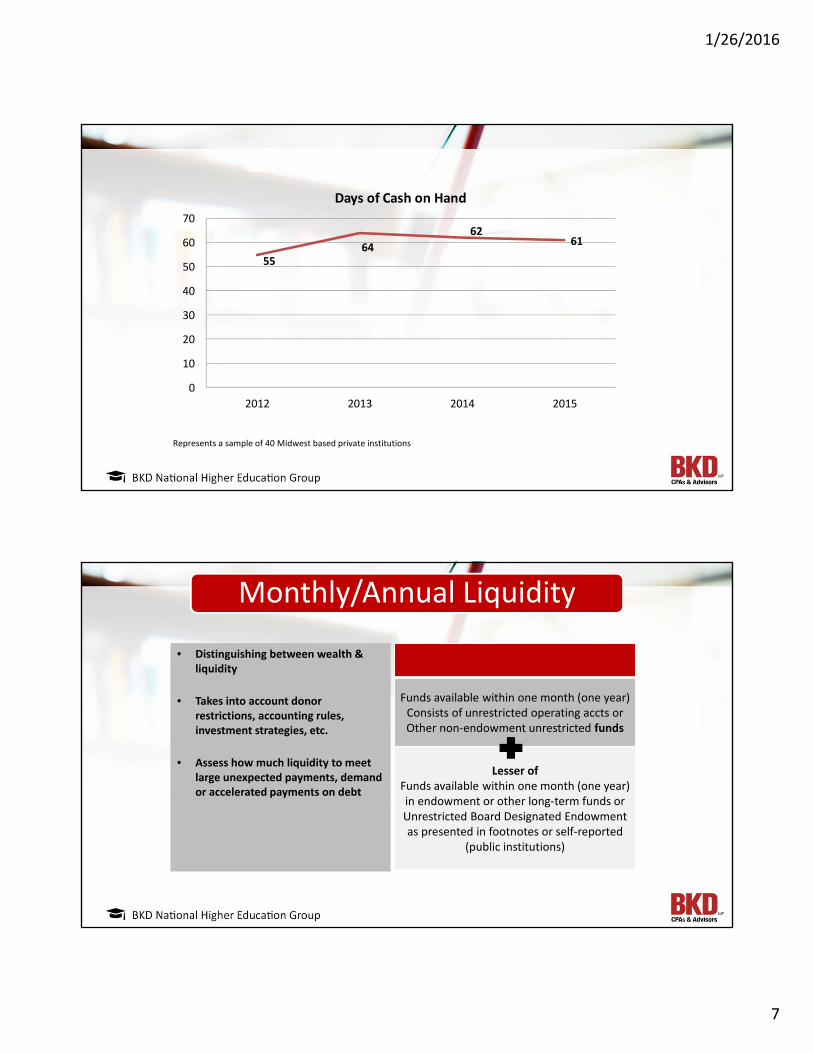
5564
6261
0
10
20
30
40
50
60
70
2012 2013 2014 2015
Days of Cash on Hand
Represents a sample of 40 Midwest based private institutions
Monthly/Annual Liquidity
Funds available within one month (one year)Consists of unrestricted operating accts or Other non-endowment unrestricted funds
Lesser ofFunds available within one month (one year) in endowment or other long-term funds orUnrestricted Board Designated Endowment as presented in footnotes or self-reported
(public institutions)
• Distinguishing between wealth & liquidity
• Takes into account donor restrictions, accounting rules, investment strategies, etc.
• Assess how much liquidity to meet large unexpected payments, demand or accelerated payments on debt
1/26/2016
8
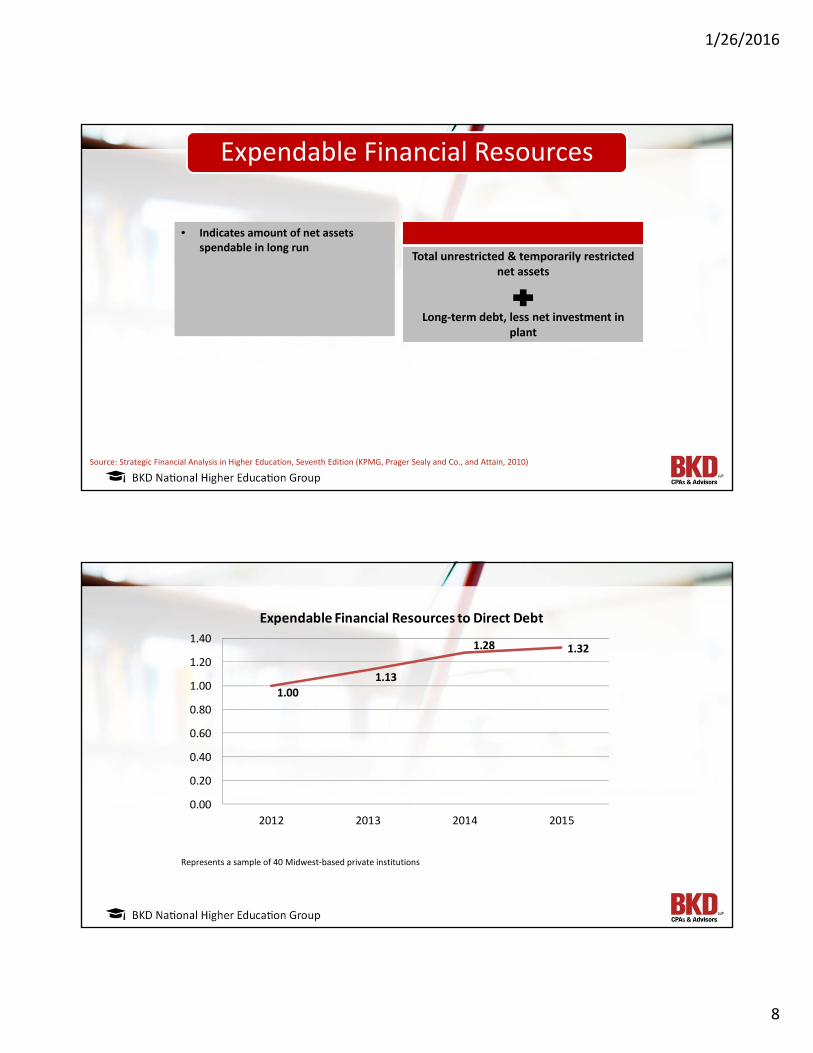
Expendable Financial Resources
Total unrestricted & temporarily restricted net assets
Long-term debt, less net investment in plant
• Indicates amount of net assets spendable in long run
Source: Strategic Financial Analysis in Higher Education, Seventh Edition (KPMG, Prager Sealy and Co., and Attain, 2010)
1.001.13
1.28 1.32
0.00
0.20
0.40
0.60
0.80
1.00
1.20
1.40
2012 2013 2014 2015
Expendable Financial Resources to Direct Debt
Represents a sample of 40 Midwest-based private institutions
1/26/2016
9
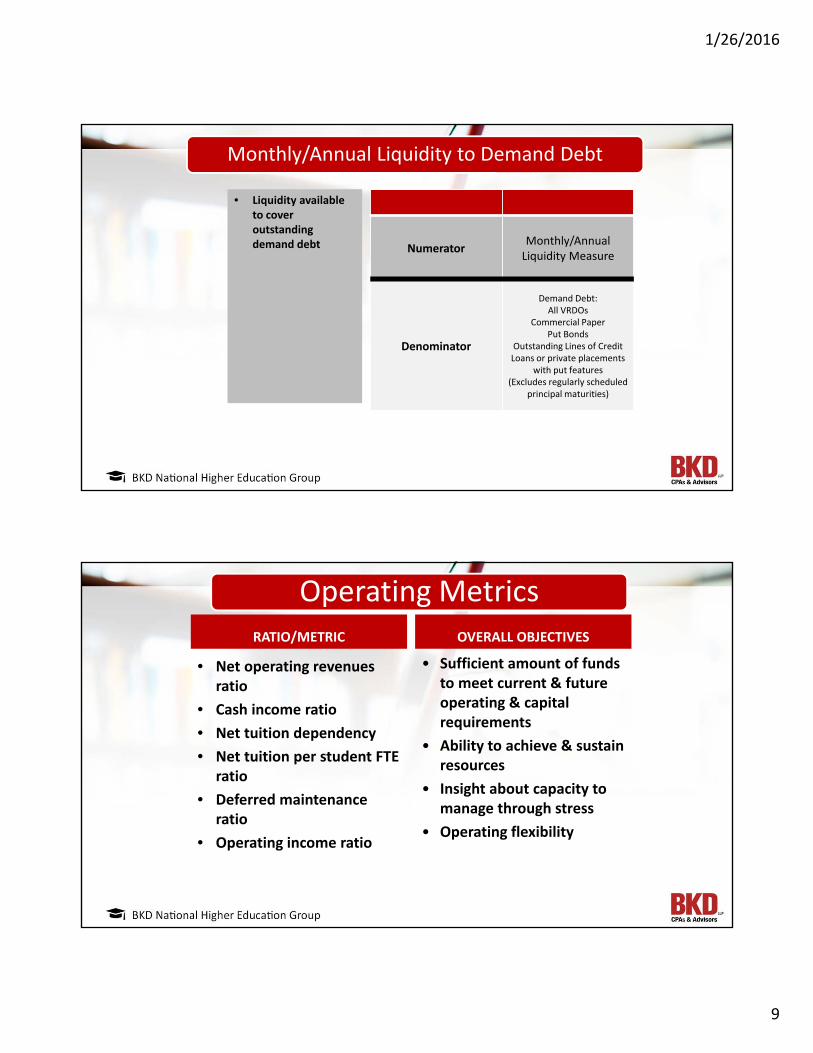
Monthly/Annual Liquidity to Demand Debt
Numerator Monthly/Annual Liquidity Measure
Denominator
Demand Debt:All VRDOs
Commercial PaperPut Bonds
Outstanding Lines of CreditLoans or private placements
with put features(Excludes regularly scheduled
principal maturities)
• Liquidity available to cover outstanding demand debt
Operating MetricsRATIO/METRIC
• Net operating revenues ratio
• Cash income ratio• Net tuition dependency• Net tuition per student FTE
ratio• Deferred maintenance
ratio• Operating income ratio
OVERALL OBJECTIVES
• Sufficient amount of funds to meet current & future operating & capital requirements
• Ability to achieve & sustain resources
• Insight about capacity to manage through stress
• Operating flexibility
1/26/2016
10
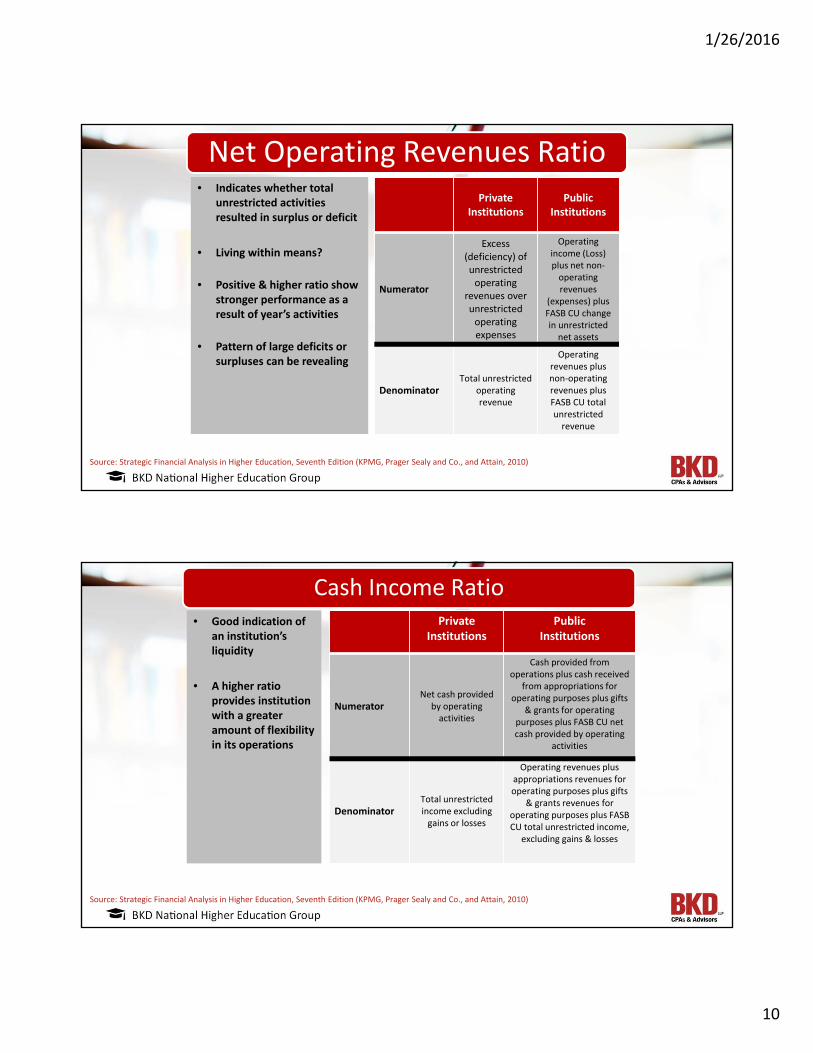
Net Operating Revenues RatioPrivate
InstitutionsPublic
Institutions
Numerator
Excess(deficiency) of unrestricted
operating revenues over unrestricted
operating expenses
Operatingincome (Loss) plus net non-
operating revenues
(expenses) plus FASB CU change in unrestricted
net assets
DenominatorTotal unrestricted
operating revenue
Operatingrevenues plus non-operating revenues plus FASB CU total unrestricted
revenue
• Indicates whether total unrestricted activities resulted in surplus or deficit
• Living within means?
• Positive & higher ratio show stronger performance as a result of year’s activities
• Pattern of large deficits or surpluses can be revealing
Source: Strategic Financial Analysis in Higher Education, Seventh Edition (KPMG, Prager Sealy and Co., and Attain, 2010)
Cash Income RatioPrivate
InstitutionsPublic
Institutions
NumeratorNet cash provided
by operating activities
Cash provided from operations plus cash received
from appropriations foroperating purposes plus gifts
& grants for operating purposes plus FASB CU net cash provided by operating
activities
DenominatorTotal unrestricted income excluding
gains or losses
Operating revenues plus appropriations revenues for operating purposes plus gifts
& grants revenues for operating purposes plus FASB CU total unrestricted income,
excluding gains & losses
• Good indication of an institution’s liquidity
• A higher ratio provides institution with a greater amount of flexibility in its operations
Source: Strategic Financial Analysis in Higher Education, Seventh Edition (KPMG, Prager Sealy and Co., and Attain, 2010)
1/26/2016
11
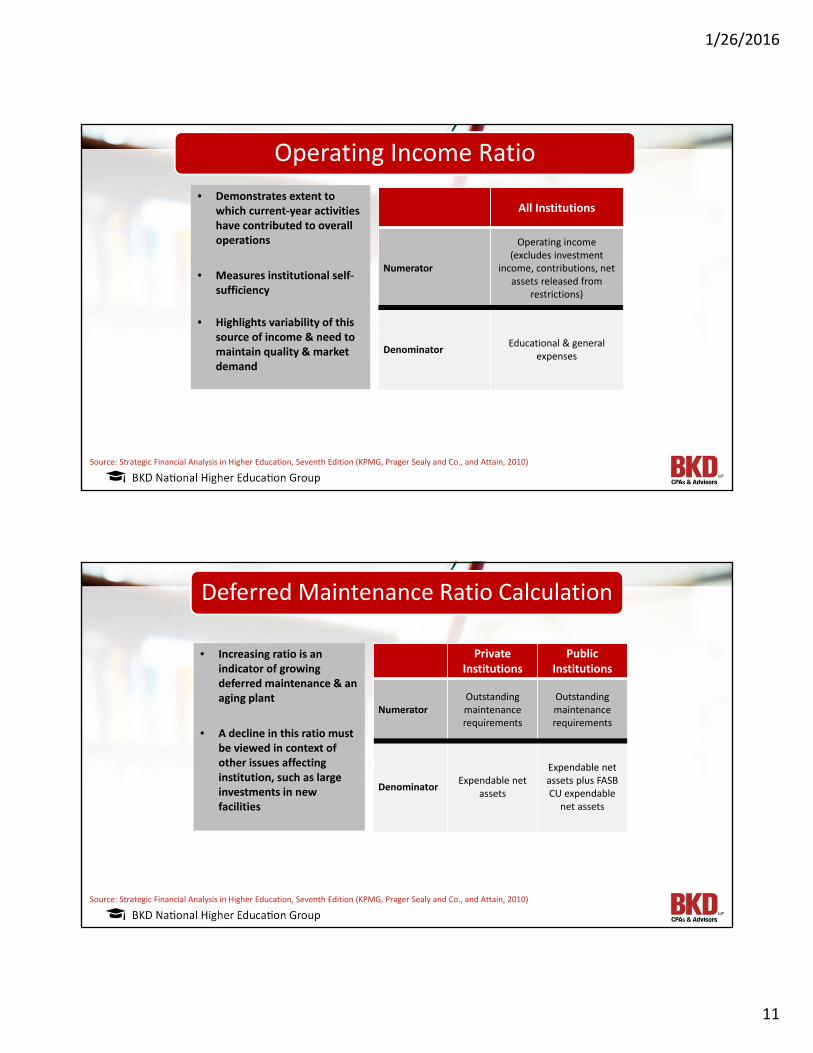
Operating Income Ratio
All Institutions
Numerator
Operating income(excludes investment
income, contributions, net assets released from
restrictions)
Denominator Educational & general expenses
• Demonstrates extent to which current-year activities have contributed to overall operations
• Measures institutional self-sufficiency
• Highlights variability of this source of income & need to maintain quality & market demand
Source: Strategic Financial Analysis in Higher Education, Seventh Edition (KPMG, Prager Sealy and Co., and Attain, 2010)
Deferred Maintenance Ratio Calculation
Private Institutions
Public Institutions
NumeratorOutstandingmaintenance requirements
Outstandingmaintenance requirements
Denominator Expendable net assets
Expendable net assets plus FASB CU expendable
net assets
• Increasing ratio is an indicator of growing deferred maintenance & an aging plant
• A decline in this ratio must be viewed in context of other issues affecting institution, such as large investments in new facilities
Source: Strategic Financial Analysis in Higher Education, Seventh Edition (KPMG, Prager Sealy and Co., and Attain, 2010)
1/26/2016
12
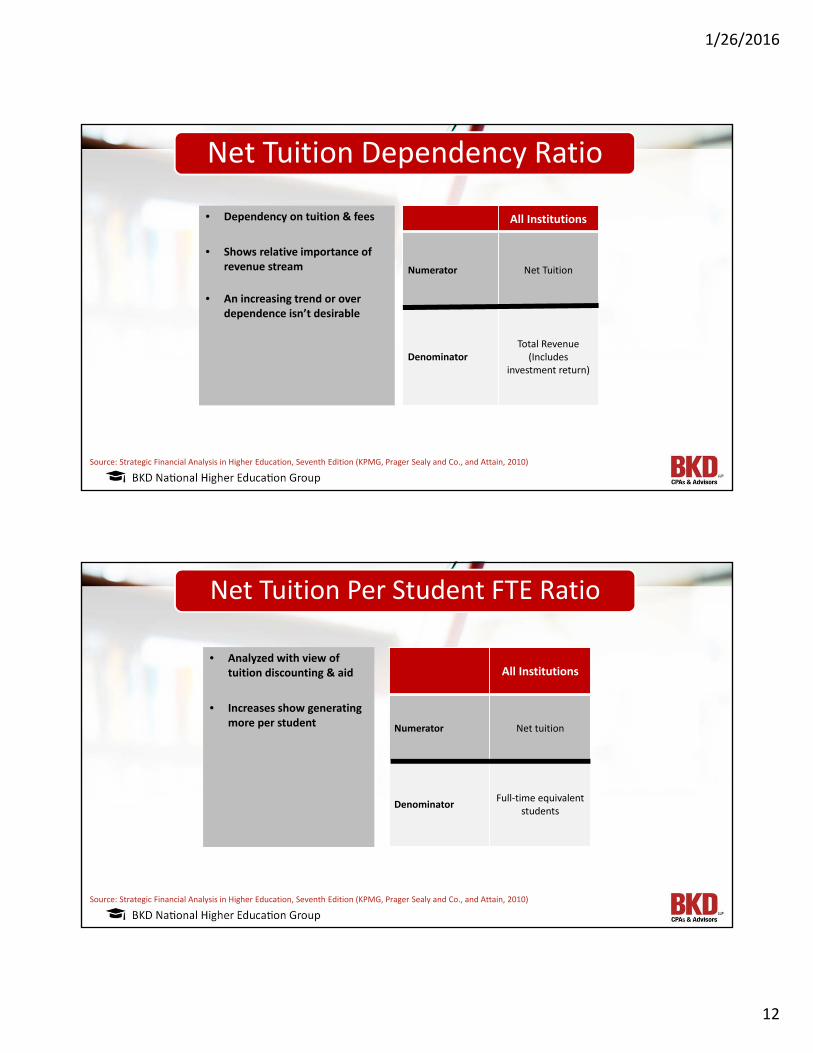
Net Tuition Dependency Ratio
All Institutions
Numerator Net Tuition
DenominatorTotal Revenue
(Includes investment return)
• Dependency on tuition & fees
• Shows relative importance of revenue stream
• An increasing trend or over dependence isn’t desirable
Source: Strategic Financial Analysis in Higher Education, Seventh Edition (KPMG, Prager Sealy and Co., and Attain, 2010)
Net Tuition Per Student FTE Ratio
• Analyzed with view of tuition discounting & aid
• Increases show generating more per student
All Institutions
Numerator Net tuition
Denominator Full-time equivalent students
Source: Strategic Financial Analysis in Higher Education, Seventh Edition (KPMG, Prager Sealy and Co., and Attain, 2010)
1/26/2016
13
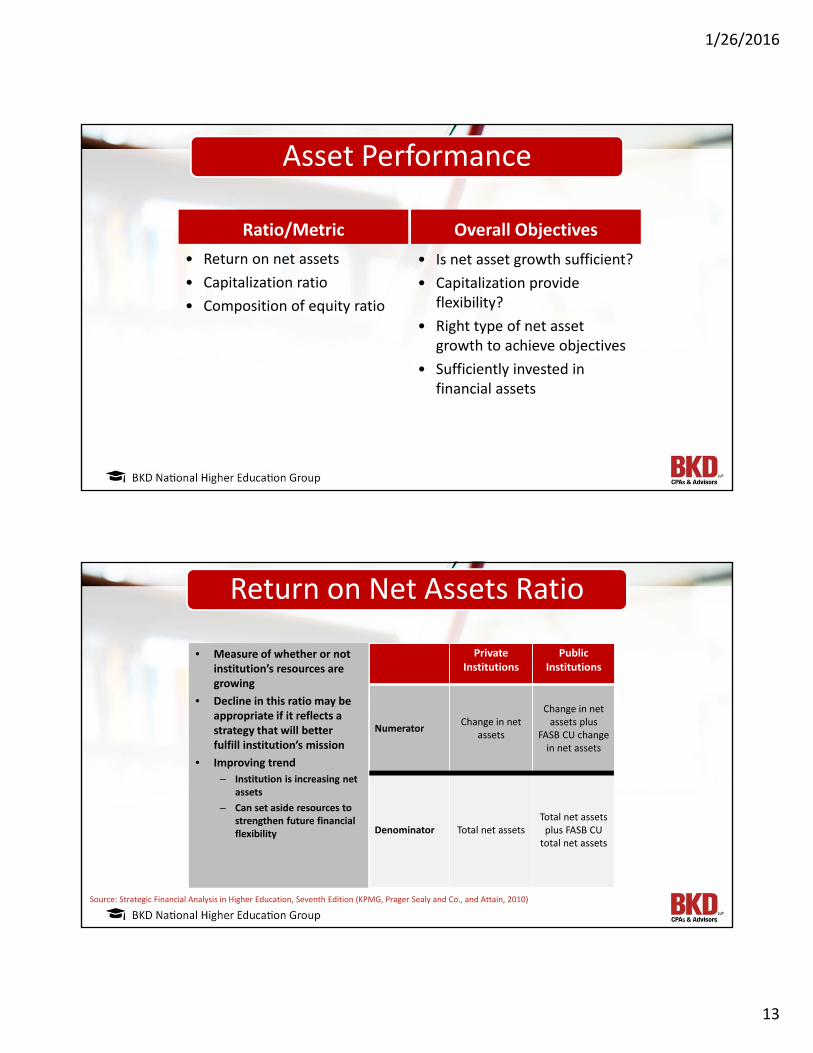
Asset Performance
Ratio/Metric• Return on net assets• Capitalization ratio• Composition of equity ratio
Overall Objectives• Is net asset growth sufficient?• Capitalization provide
flexibility?• Right type of net asset
growth to achieve objectives• Sufficiently invested in
financial assets
Return on Net Assets Ratio
Private Institutions
Public Institutions
Numerator Change in net assets
Change in net assets plus
FASB CU change in net assets
Denominator Total net assetsTotal net assets
plus FASB CUtotal net assets
• Measure of whether or not institution’s resources are growing
• Decline in this ratio may be appropriate if it reflects a strategy that will better fulfill institution’s mission
• Improving trend– Institution is increasing net
assets– Can set aside resources to
strengthen future financial flexibility
Source: Strategic Financial Analysis in Higher Education, Seventh Edition (KPMG, Prager Sealy and Co., and Attain, 2010)
1/26/2016
14
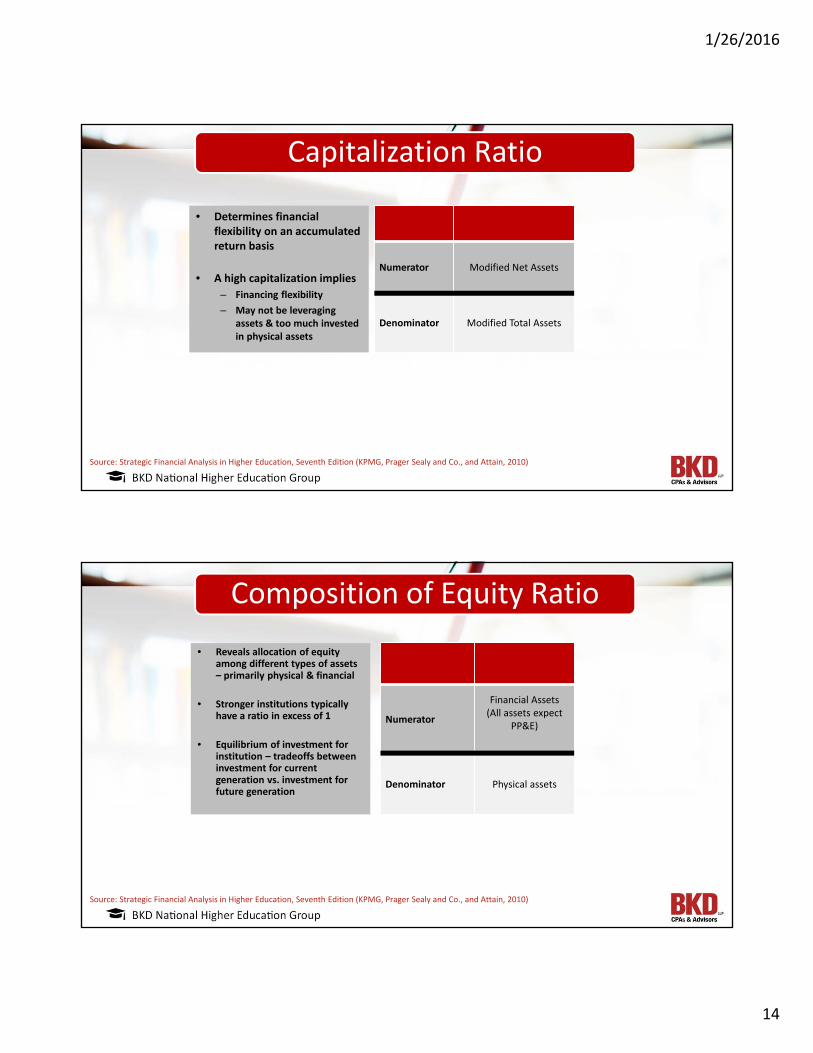
Capitalization Ratio
Numerator Modified Net Assets
Denominator Modified Total Assets
• Determines financial flexibility on an accumulated return basis
• A high capitalization implies– Financing flexibility– May not be leveraging
assets & too much invested in physical assets
Source: Strategic Financial Analysis in Higher Education, Seventh Edition (KPMG, Prager Sealy and Co., and Attain, 2010)
Composition of Equity Ratio
Numerator
Financial Assets(All assets expect
PP&E)
Denominator Physical assets
• Reveals allocation of equity among different types of assets – primarily physical & financial
• Stronger institutions typically have a ratio in excess of 1
• Equilibrium of investment for institution – tradeoffs between investment for current generation vs. investment for future generation
Source: Strategic Financial Analysis in Higher Education, Seventh Edition (KPMG, Prager Sealy and Co., and Attain, 2010)
1/26/2016
15
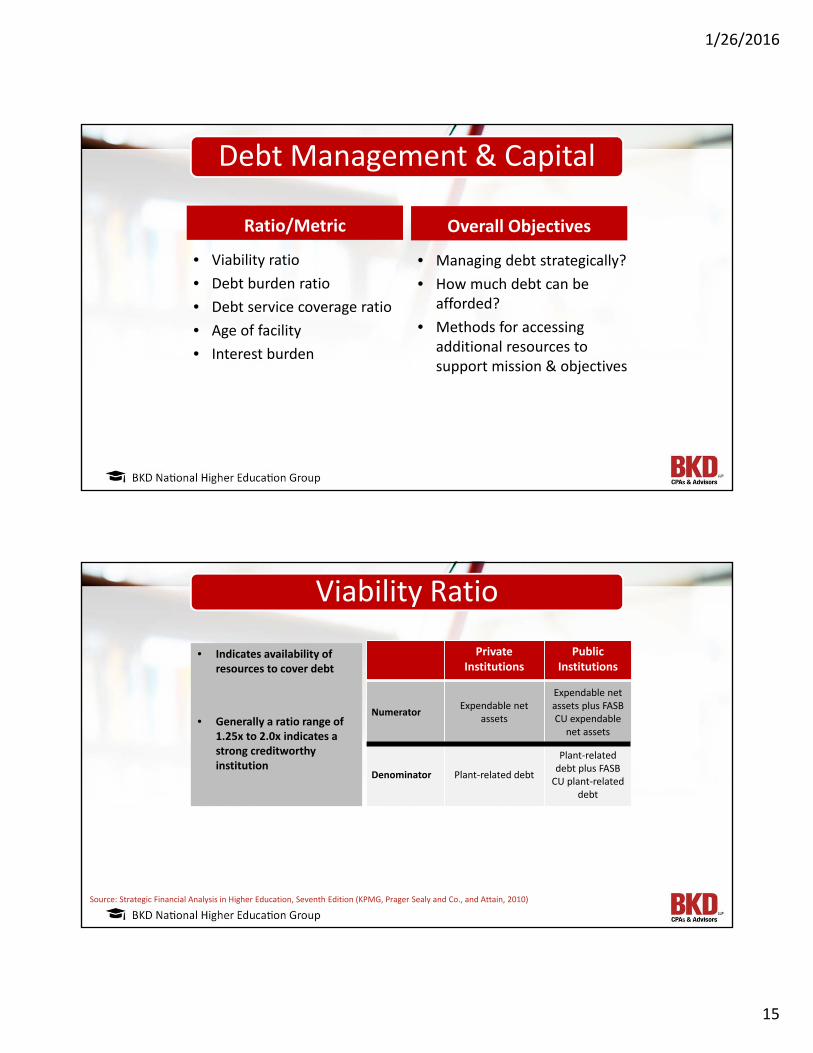
Debt Management & Capital
Ratio/Metric
• Viability ratio• Debt burden ratio• Debt service coverage ratio• Age of facility• Interest burden
Overall Objectives
• Managing debt strategically?• How much debt can be
afforded?• Methods for accessing
additional resources to support mission & objectives
Viability Ratio
Private Institutions
Public Institutions
Numerator Expendable net assets
Expendable net assets plus FASB CU expendable
net assets
Denominator Plant-related debt
Plant-related debt plus FASB
CU plant-relateddebt
• Indicates availability of resources to cover debt
• Generally a ratio range of 1.25x to 2.0x indicates a strong creditworthy institution
Source: Strategic Financial Analysis in Higher Education, Seventh Edition (KPMG, Prager Sealy and Co., and Attain, 2010)
1/26/2016
16
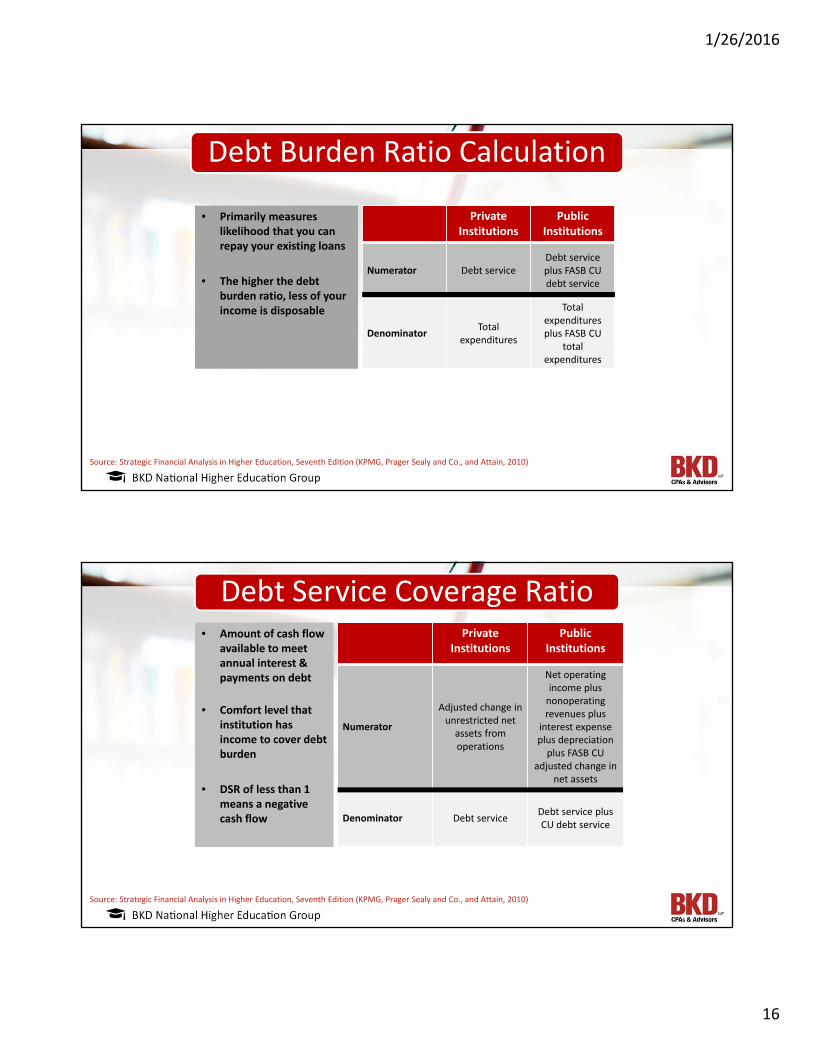
Debt Burden Ratio Calculation
Private Institutions
Public Institutions
Numerator Debt serviceDebt service plus FASB CU debt service
Denominator Total expenditures
Total expenditures plus FASB CU
total expenditures
• Primarily measures likelihood that you can repay your existing loans
• The higher the debt burden ratio, less of your income is disposable
Source: Strategic Financial Analysis in Higher Education, Seventh Edition (KPMG, Prager Sealy and Co., and Attain, 2010)
Debt Service Coverage RatioPrivate
InstitutionsPublic
Institutions
Numerator
Adjusted change in unrestricted net
assets from operations
Net operating income plus
nonoperating revenues plus
interest expense plus depreciation
plus FASB CU adjusted change in
net assets
Denominator Debt service Debt service plus CU debt service
• Amount of cash flow available to meet annual interest & payments on debt
• Comfort level that institution has income to cover debt burden
• DSR of less than 1 means a negative cash flow
Source: Strategic Financial Analysis in Higher Education, Seventh Edition (KPMG, Prager Sealy and Co., and Attain, 2010)
1/26/2016
17
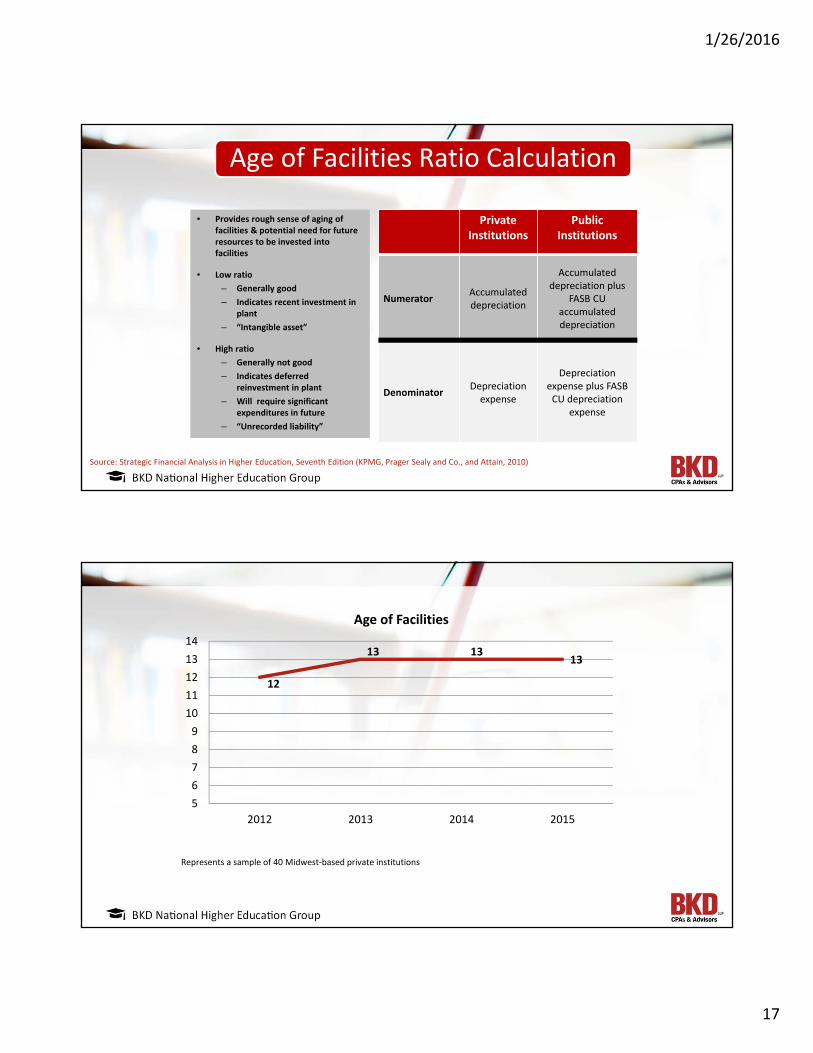
Age of Facilities Ratio Calculation
Private Institutions
Public Institutions
Numerator Accumulated depreciation
Accumulateddepreciation plus
FASB CU accumulated depreciation
Denominator Depreciation expense
Depreciation expense plus FASB
CU depreciation expense
• Provides rough sense of aging of facilities & potential need for future resources to be invested into facilities
• Low ratio– Generally good– Indicates recent investment in
plant– “Intangible asset”
• High ratio– Generally not good– Indicates deferred
reinvestment in plant– Will require significant
expenditures in future– “Unrecorded liability”
Source: Strategic Financial Analysis in Higher Education, Seventh Edition (KPMG, Prager Sealy and Co., and Attain, 2010)
12
13 1313
56789
1011121314
2012 2013 2014 2015
Age of Facilities
Represents a sample of 40 Midwest-based private institutions

1/26/2016
18
Interest Burden Calculation
Private Institutions
Public Institutions
Numerator Interest expense
Interest expense plus FASB CU
interest expense
Denominator Total expenditures
Total expenditures plus FASB CU total
expenditures
• Target range should be no greater than 5% - 6%
• Principal is excluded from this ratio
• More useful in perpetual debt structure
Source: Strategic Financial Analysis in Higher Education, Seventh Edition (KPMG, Prager Sealy and Co., and Attain, 2010)
• Developed by KPMG & Prager McCarthy and Sealy, LLC in late 1990s • Developed specifically for higher education institutions• Widely accepted set of ratios & overall measurement of financial health• Four core ratios
• Primary reserve ratio• Net operating revenues ratio• Return on net assets ratio• Viability ratio
COMPOSITE FINANCIAL INDEX
1/26/2016
19
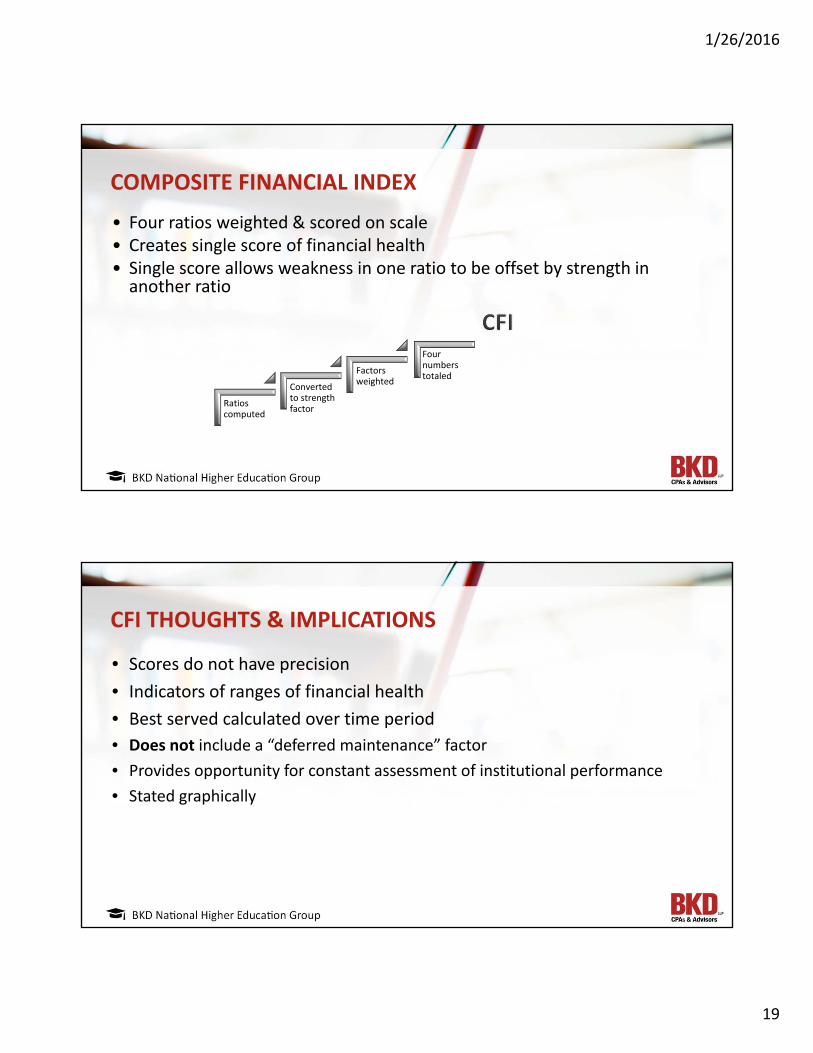
• Four ratios weighted & scored on scale• Creates single score of financial health• Single score allows weakness in one ratio to be offset by strength in
another ratio
COMPOSITE FINANCIAL INDEX
Ratios computed
Converted to strength factor
Factors weighted
Four numbers totaled
• Scores do not have precision• Indicators of ranges of financial health• Best served calculated over time period• Does not include a “deferred maintenance” factor• Provides opportunity for constant assessment of institutional performance• Stated graphically
CFI THOUGHTS & IMPLICATIONS
1/26/2016
20
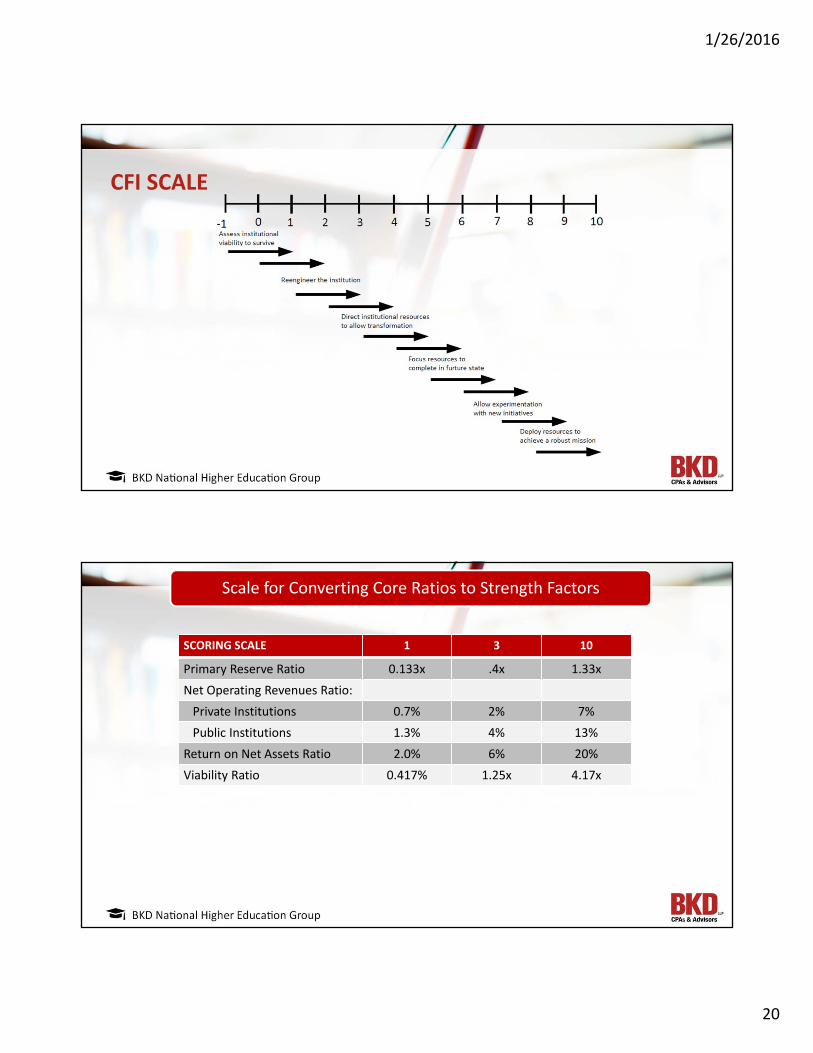
CFI SCALE
Scale for Converting Core Ratios to Strength Factors
SCORING SCALE 1 3 10
Primary Reserve Ratio 0.133x .4x 1.33xNet Operating Revenues Ratio:
Private Institutions 0.7% 2% 7%Public Institutions 1.3% 4% 13%
Return on Net Assets Ratio 2.0% 6% 20%Viability Ratio 0.417% 1.25x 4.17x
1/26/2016
21
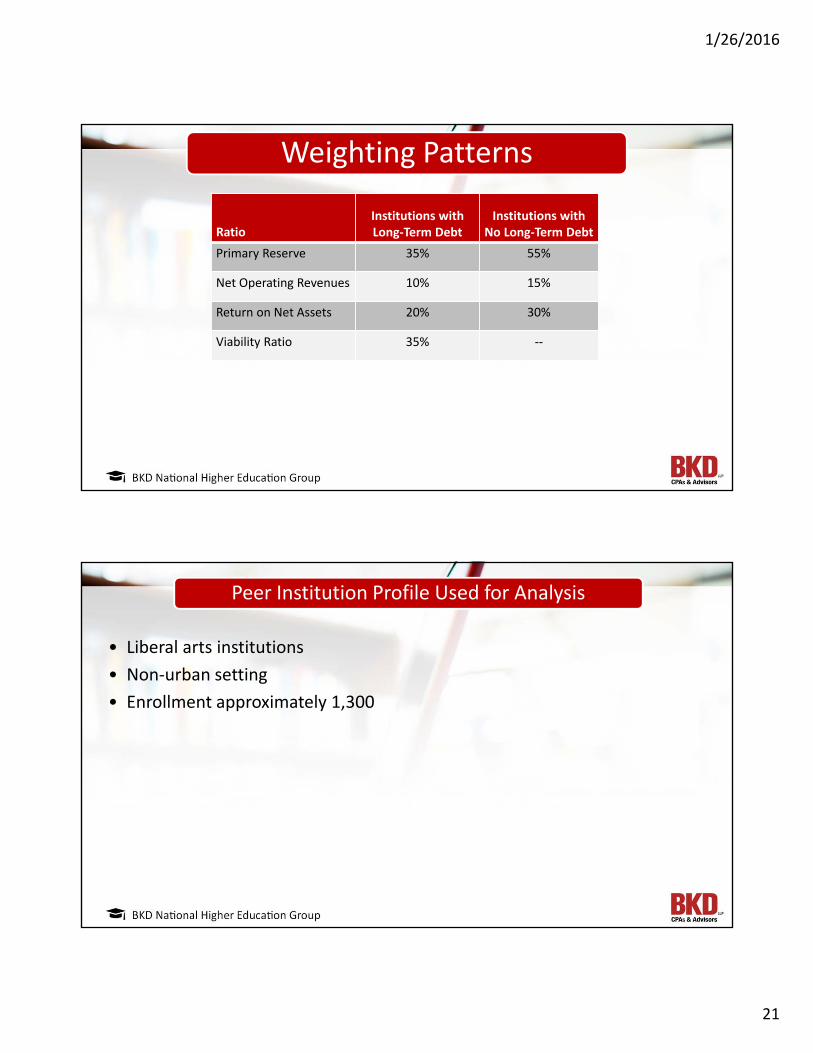
Weighting Patterns
RatioInstitutions with Long-Term Debt
Institutions with No Long-Term Debt
Primary Reserve 35% 55%
Net Operating Revenues 10% 15%
Return on Net Assets 20% 30%
Viability Ratio 35% --
• Liberal arts institutions• Non-urban setting• Enrollment approximately 1,300
Peer Institution Profile Used for Analysis
1/26/2016
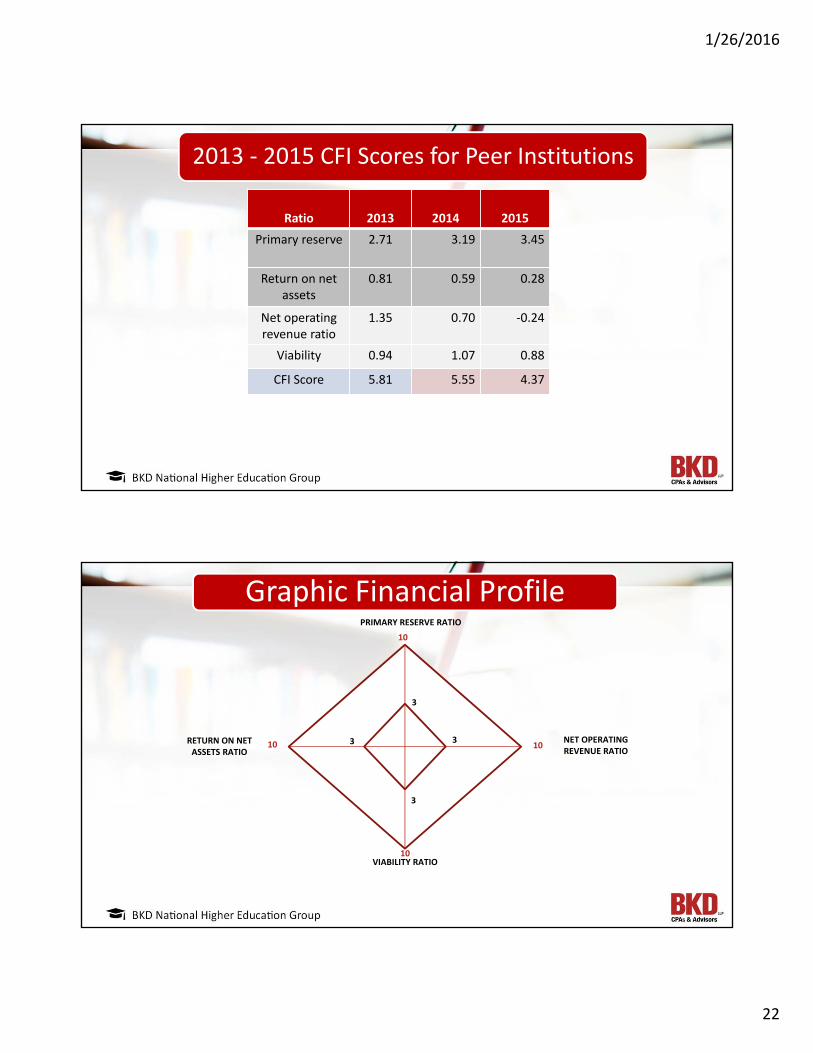
22
2013 - 2015 CFI Scores for Peer Institutions
Ratio 2013 2014 2015Primary reserve 2.71 3.19 3.45
Return on net assets
0.81 0.59 0.28
Net operating revenue ratio
1.35 0.70 -0.24
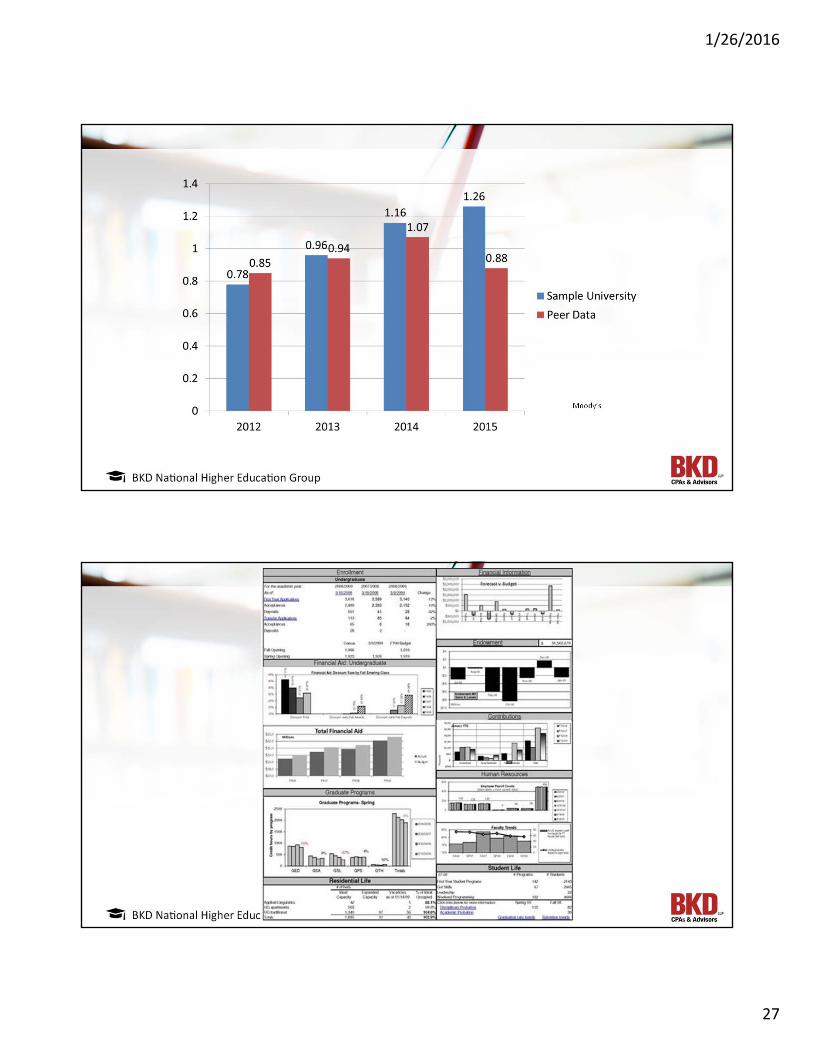
Viability 0.94 1.07 0.88
CFI Score 5.81 5.55 4.37
Graphic Financial ProfilePRIMARY RESERVE RATIO
1010
10 NET OPERATING REVENUE RATIO
10VIABILITY RATIO
10RETURN ON NETASSETS RATIO
3
3
3
3
1/26/2016
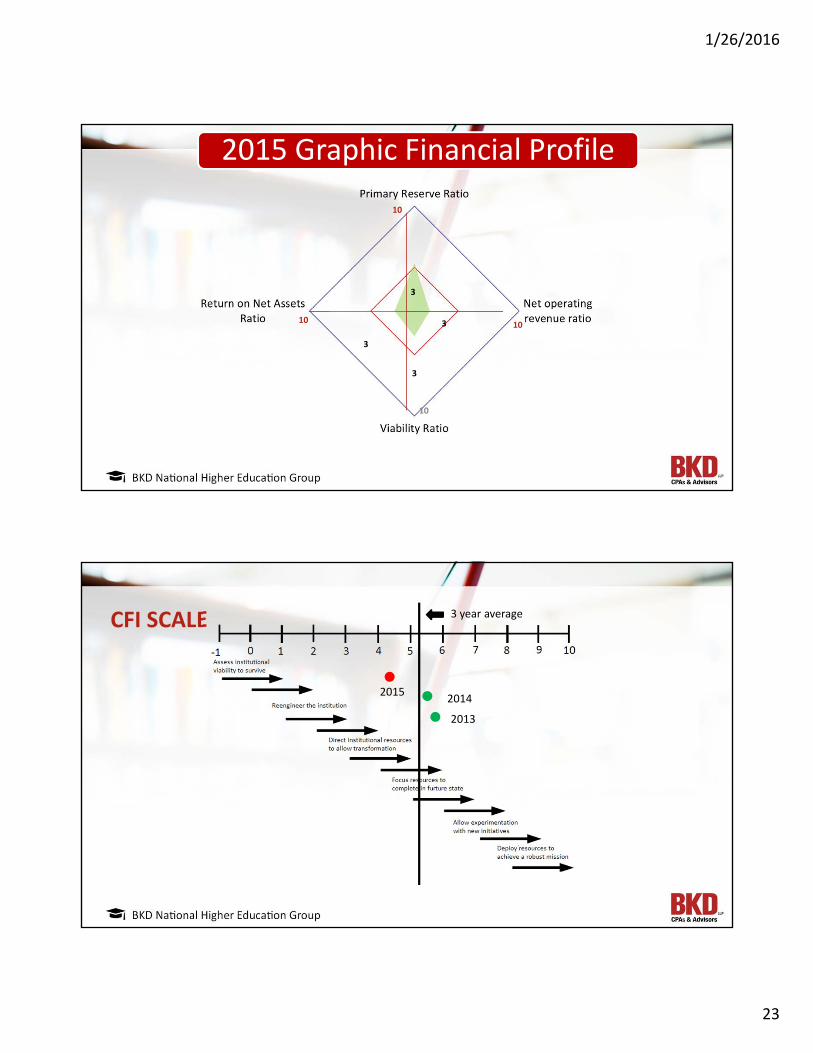
23
2015 Graphic Financial Profile1010
10
10
10
3
3
3
3
CFI SCALE
2015 2014
2013
3 year average
1/26/2016
24
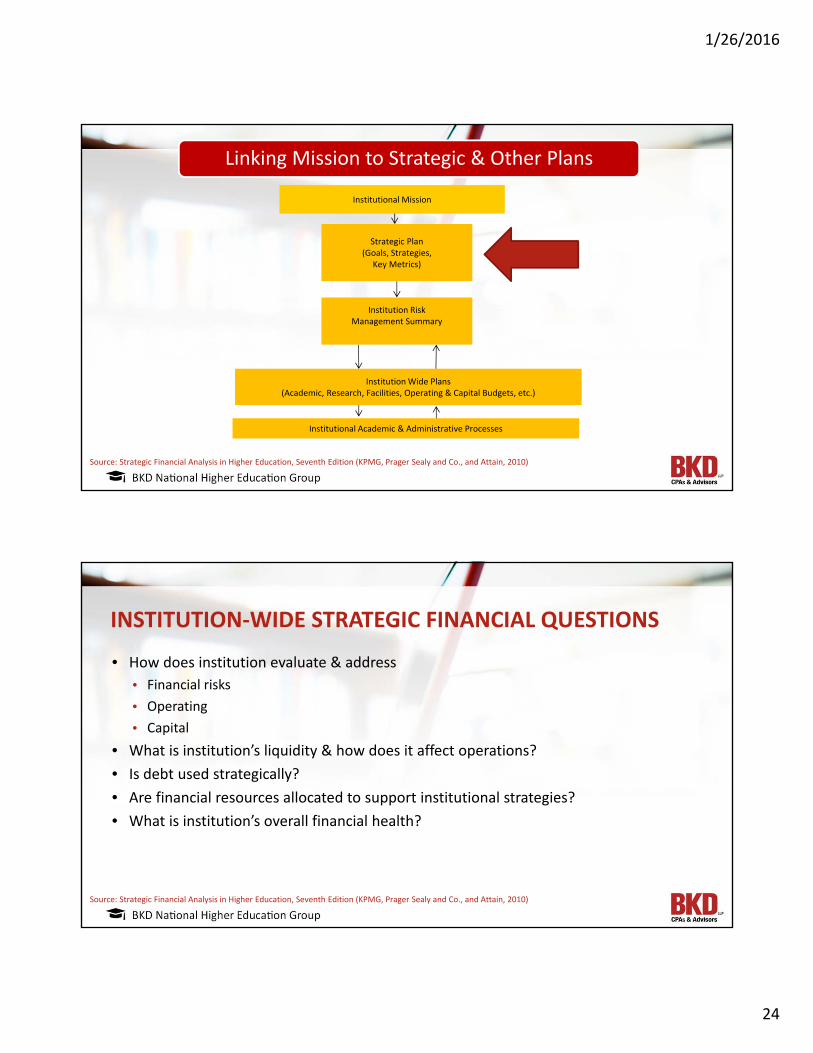
Linking Mission to Strategic & Other Plans
Strategic Plan(Goals, Strategies,
Key Metrics)
Institutional Mission
Institution RiskManagement Summary
Institution Wide Plans(Academic, Research, Facilities, Operating & Capital Budgets, etc.)
Institutional Academic & Administrative Processes
Source: Strategic Financial Analysis in Higher Education, Seventh Edition (KPMG, Prager Sealy and Co., and Attain, 2010)
• How does institution evaluate & address• Financial risks • Operating• Capital
• What is institution’s liquidity & how does it affect operations?• Is debt used strategically?• Are financial resources allocated to support institutional strategies?• What is institution’s overall financial health?
INSTITUTION-WIDE STRATEGIC FINANCIAL QUESTIONS
Source: Strategic Financial Analysis in Higher Education, Seventh Edition (KPMG, Prager Sealy and Co., and Attain, 2010)
1/26/2016
25
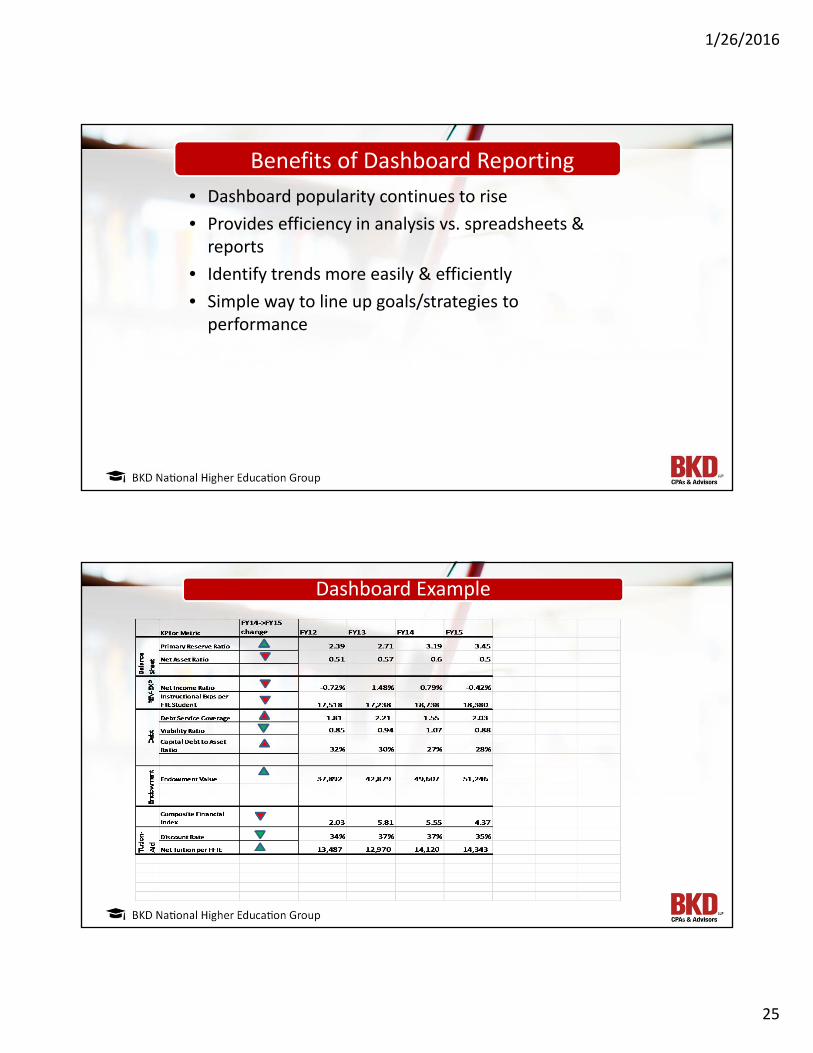
Benefits of Dashboard Reporting • Dashboard popularity continues to rise• Provides efficiency in analysis vs. spreadsheets &
reports• Identify trends more easily & efficiently • Simple way to line up goals/strategies to
performance
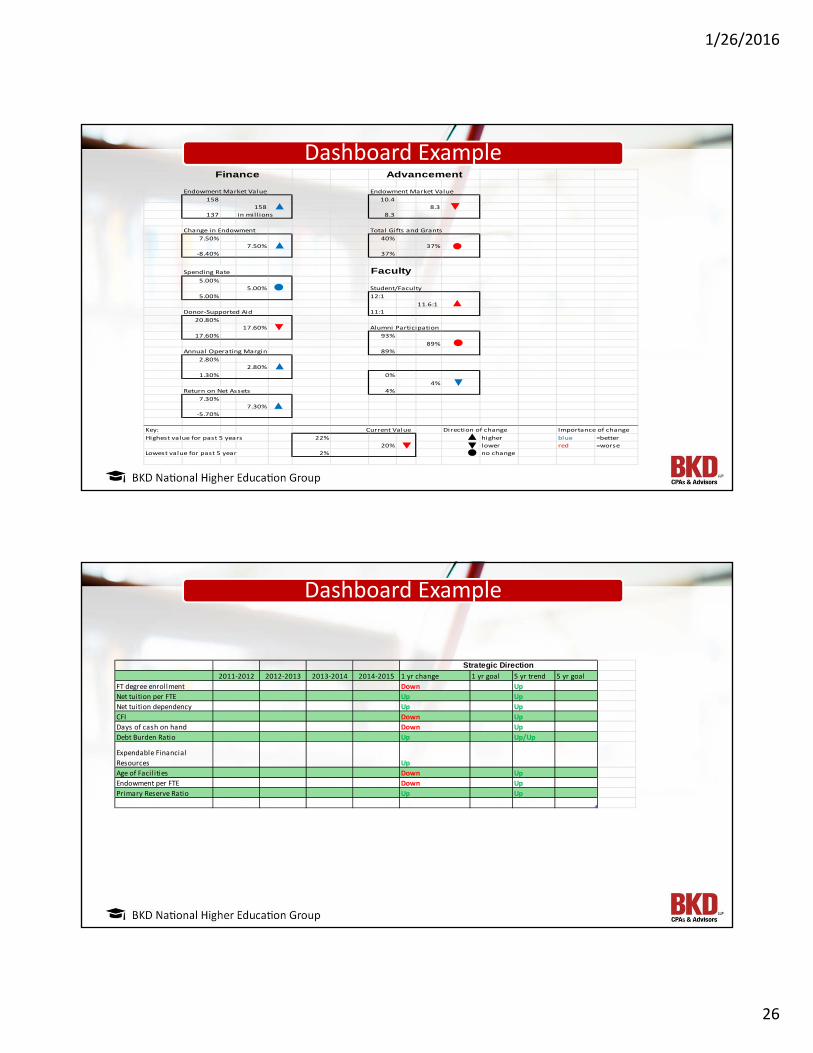
Dashboard Example
1/26/2016
26
Endowment Market Value Endowment Market Value158 10.4
158 8.3137 in mill ions 8.3
Change in Endowment Total Gifts and Grants7.50% 40%
7.50% 37%-8.40% 37%
Spending Rate Faculty5.00%
5.00% Student/Faculty5.00% 12:1
11.6:1Donor-Supported Aid 11:1
20.80%17.60% Alumni Participation
17.60% 93%89%
Annual Operating Margin 89%2.80%
2.80%1.30% 0%
4%Return on Net Assets 4%
7.30%7.30%
-5.70%
Key: Current Value Direction of change Importance of changeHighest value for past 5 years 22% higher blue =better
20% lower red =worseLowest value for past 5 year 2% no change
Finance Advancement
Dashboard Example
2011-2012 2012-2013 2013-2014 2014-2015 1 yr change 1 yr goal 5 yr trend 5 yr goalFT degree enrollment Down UpNet tuition per FTE Up UpNet tuition dependency Up UpCFI Down UpDays of cash on hand Down UpDebt Burden Ratio Up Up/Up
Expendable Financial Resources UpAge of Facil ities Down UpEndowment per FTE Down UpPrimary Reserve Ratio Up Up
Strategic Direction
Dashboard Example
1/26/2016
27
Moody’s
1/26/2016
28
QUESTIONS?
CONTINUING PROFESSIONAL EDUCATION (CPE) CREDITS
BKD, LLP is registered with the National Association of State Boards of Accountancy (NASBA) as a sponsor of continuing professional education on the National Registry of CPE Sponsors. State boards of accountancy have final authority on the acceptance of individual courses for CPE credit. Complaints regarding registered sponsors may be submitted to the National Registry of CPE Sponsors through its website: www.learningmarket.org.
The information in BKD webinars is presented by BKD professionals, but applying specific information to your situation requires careful consideration of facts & circumstances. Consult your BKD advisor before acting on any matters covered in these webinars.
1/26/2016
29
• CPE credit may be awarded upon verification of participant attendance
• For questions, concerns or comments regarding CPE credit, please email BKD Learning & Development Department at [email protected]
CPE CREDIT
THANK YOU!FOR MORE INFORMATION
Jim Creeden // [email protected]
Adam Smith // [email protected]
1/26/2016
30


