+ All Categories
Home > Documents > Terho Norja Designing a Framework for Linking Company ...

Terho Norja Designing a Framework for Linking Company ...

Date post: 15-Nov-2021
Category:
Upload: others
View: 3 times
Download: 0 times
Share this document with a friend
61
Aalto University School of Science and Technology Faculty of Information and Natural Sciences Terho Norja Designing a Framework for Linking Company Goals with Daily Tasks in a Small Software Company Master´s thesis submitted in partial fulfillment of the requirements for the degree of Master of Science in Technology in the Degree Programme in Engineering Physics and Mathematics. Espoo, 15.6.2010 Supervisor: Professor Casper Lassenius Instructor: Kristian Rautiainen, Lic.Sc.(Tech.)
Transcript

Aalto University

School of Science and Technology

Faculty of Information and Natural Sciences

Terho Norja

Designing a Framework for Linking Company Goals with

Daily Tasks in a Small Software Company

Master´s thesis submitted in partial fulfillment of the requirements for the degree

of Master of Science in Technology in the Degree Programme in Engineering

Physics and Mathematics.

Espoo, 15.6.2010

Supervisor: Professor Casper Lassenius

Instructor: Kristian Rautiainen, Lic.Sc.(Tech.)

ii

Aalto University

School of Science and Technology

Faculty of Information and Natural Sciences

ABSTRACT OF THE MASTER’S THESIS

Author: Terho Norja

Title: Designing a Framework for Linking Company Goals with Daily Tasks in a Small SoftwareCompany

Title in Finnish: Yritystavoitteiden ja päivittäisen tekemisen yhdistäminen pienessä ohjelmistoyrityksessä –viitekehyksen suunnittelu

Degree Programme: Degree Programme in Engineering Physics and Mathematics

Major subject (name and code):9001 Personal Major (Software Engineering)

Minor subject (name and code):9002 Personal Minor(Systems and Operations Research)

Chair (code): T-76

Supervisor:

Professor Casper Lassenius

Instructor: Kristian Rautiainen, Lic.Sc.(Tech.),

Aalto University of Technology and Science

Abstract:

Action of a company should be based on company’s strategic objectives and strategy. Strategy is the plan tofulfill the strategic objectives. Fluidity of resources is important: resources should be easily allocated tostrategically important areas. Today, strategy work in companies is more dynamic and practical than it usedto be earlier. Also a small company can take a major advantage of the practical strategy tools and models.

Agile software development methods have made it more effective to manage the development work throughstories selected into iterations and broken into tasks for development to be completed. This model workingeffectively to provide a method for effective resource allocation.

In this thesis, the possibility to improve a company’s functions and management by linking the strategic,company-level goals with day-to-day tasks is studied. The target of the study was a small software company,which employs less than 50 employees and is using agile software development methods.

The business and management models of the case company were studied profoundly. The model wasperceived to be functioning well and serving the purposes of the company. The company uses a softwaretool called Agilefant.org for managing its software development projects. Agilefant is very suitable foroperational management purposes. All the work efforts (i.e. also other than software development) arelogged into Agilefant.

The activity logged into Agilefant was analyzed for a 13 month period. The analysis of the data showed thatthe personnel of the company have notably too many projects in-process at the same time. The companysuffers from the loss of effectiveness due to task switching. The most important reason for too many projectsrunning at the same time was noted to be the inability to plan future activated. The company did not haveany functional method or tool to do the planning and prioritization of future goals and therefore it did nothave a functional model to manage future work.

A framework was designed to link future goals with day-to-day activities in the studied company.

Date: Jun 15, 2010 Language: English Number of pages: 47

Keywords: Software business, small companies, strategy, strategic agility, software development, software

engineering

iii

Aalto-yliopisto

Teknillinen korkeakoulu

Informaatio- ja luonnontieteiden tiedekunta

DIPLOMITYÖN TIIVISTELMÄ

Tekijä: Terho Norja

Työn nimi: Yritystavoitteiden ja päivittäisen tekemisen yhdistäminen pienessä ohjelmistoyrityksessä –viitekehyksen suunnittelu

Title in English: Designing a Framework for Linking Company Goals with Daily Tasks in aSmall Software Company

Tutkinto-ohjelma: Teknillisen fysiikan ja matematiikan tutkinto-ohjelma

Pääaineen koodi ja nimi:9001 Henkilökohtainen pääaine(Ohjelmistotekniikka)

Sivuaineen koodi ja nimi:9002 Henkilökohtainen sivuaine(Systeemi- ja operaatiotutkimus)

Opetusyksikön (ent. professuuri) koodi: T-76

Työn valvoja:

Professori Casper Lassenius

Työn ohjaaja(t): Tekn.lis. Kristian Rautiainen,

Aalto-yliopiston Teknillinen korkeakoulu

Tiivistelmä:

Yrityksen toiminnan tulee perustua sen strategisiin tavoitteisiin ja strategiaan eli suunnitelmaansa toteuttaatavoitteita. Resurssien sujuva liikuteltavuus strategisesti tärkeille alueille on tärkeää. Varsinainenstrategiatyö on kehittynyt dynaamisemmaksi, mutta myös käytännöllisemmäksi. Myös pieni yritys voi saadahyötyä käytännöllisempien strategiatyökalujen avulla..

Ketterät menetelmät ovat parantaneet ohjelmistokehityksen hallittavuutta: kehitysideat valitaankäyttäjätarinoina iteraatioihin ja pilkotaan kehitystehtäviksi toteutettavaksi. Tätä voidaan hyödyntääresurssien ketterämmässä ohjaamisessa.

Tässä työssä tutkitaan mahdollisuuksia saada hyötyä ja parantaa tehokkuutta strategisten tavoitteidenyhdistämisestä käytännön jokapäiväisiin tehtäviin. Tutkimuksen kohteena on pieni, alle 50 henkilöä,työllistävä ohjelmistoyritys, jossa sovelletaan ketteriä menetelmiä ohjelmistokehityksessä.

Tutkimuksen kohteena olevan yrityksen tapa toimia ja ohjata toimintaansa selvitettiin seikkaperäisesti.Yrityksen toiminnan mallin havaittiin olevan perusteltu ja hyvin yritystä palveleva. Yritys käyttääohjelmistokehityksensä ohjaamiseen Agilefant.org –nimistä ohjelmistoa. Se palvelee hyvin operatiivisentekemisen ohjaamisessa. Agilefant-ohjelmistoa käytetään kaiken tehdyn työajan ja sen kohteidenkeräämisessä, myös muun työn kuin ohjelmistokehityksen.

Yrityksen työtehtävien toteuttamista tutkittiin 13 kuukauden ajan. Kerätyn tiedon analysointi osoitti, ettäyrityksen henkilöstöllä oli merkittävästi liikaa tehtäviä hoidettavanaan samanaikaisesti. Tämä johtaa siihen,että yritys menettää paljon työaikaa, kun henkilöt vaihtoivat jatkuvasti tehtävästä toiseen. Isoimmaksitekijäksi samanaikaisen työn ylimäärään havaittiin tekemisen suunnittelun puutteet. Yrityksellä ei ollut silleistuvaa tapaa ja työkaluja työstää ja priorisoida tulevan tekemisen tavoitteita, eikä siten myöskään toimivaamallia hallita tekemistä.

Työssä suunniteltiin viitekehys, jossa yritystasoiset tavoitteet yhdistetään alempien tavoitteiden kauttakäytännön tekemiseen tutkitussa yrityksessä.

Päivämäärä: 15.6.2010 Kieli: Englanti Sivumäärä: 47

Avainsanat: Ohjelmistoliiketoiminta, pienyritys, strategia, strateginen ketteryys, ohjelmistokehitys,

ohjelmistotuotanto

iv

Acknowledgements

I would like to thank the supervisor and instructor of this thesis, prof. Casper Lassenius

and Kristian Rautiainen, respectively. It was a delight to work with them and to note their

uncompromising scientific attitude and high craftsmanship. The work model in the end

was very agile and lean.

My colleagues at IPSS-Intelligent Precision Solutions and Services Oy have helped me

with this project by enthusiastically inventing new and more functional ways to run a

software company. The special thanks go to Pirkka Liukkonen, Sami Helin, and Antti

Paappanen.

Many thanks to my lovely wife Anu Kaukovirta-Norja. She encouraged-insisted me to

continue with this work. Thanks and warm hugs to my children Ella and Vilma for

inspiring me through their positivity to life and everything.

Espoo, 15th June, 2010

Terho Norja

v

Contents

1 Introduction................................................................................................................1

1.1 Background ........................................................................................................1

1.2 Research Problem...............................................................................................2

1.3 Methodology ......................................................................................................3

1.4 Scope and Restrictions .......................................................................................4

1.5 Structure and Outline of the Thesis ....................................................................6

2 Research Design of the Case Study on IPSS Oy......................................................7

2.1 Research Design of the First Part: Services, Products, and Organisation .........7

2.1.1 Data Collection............................................................................................................ 7

2.1.2 Data Analysis .............................................................................................................. 8

2.2 Research Design of the Second Part: Work Effort Distribution and

Improvement Opportunities ...............................................................................8

2.2.1 Data Collection............................................................................................................ 8

2.2.2 Data Analysis .............................................................................................................. 8

2.3 Research Design of the Third Part: Management Model ..................................9

2.3.1 Data Collection............................................................................................................ 9

2.3.2 Data Analysis .............................................................................................................. 9

3 Results of the Case Study on IPSS Oy ...................................................................10

3.1 Part 1: Services, Products, and Organisation of IPSS ......................................10

3.1.1 Services and Products................................................................................................ 10

3.1.2 Organisation .............................................................................................................. 12

3.1.3 Agile Task and Project Management......................................................................... 15

3.1.4 Business Model ......................................................................................................... 15

3.1.5 Key Findings ............................................................................................................. 18

3.2 Part 2: Work Effort Distribution and Improvement Opportunities ..................18

3.2.1 Agile Task and Project Management......................................................................... 18

3.2.2 Work Effort Distribution ........................................................................................... 19

3.2.3 Waste from Task Switching ...................................................................................... 21

3.2.4 Key Findings ............................................................................................................. 27

3.3 Part 3: Management Model ..............................................................................27

3.3.1 Current Management Model...................................................................................... 27

3.3.2 Requirements for Improvement................................................................................. 30

3.3.3 Key Findings ............................................................................................................. 32

vi

3.4 Conclusions of the Case Study.........................................................................32

4 Designing a Framework for Linking Company Goals with Daily Tasks............34

4.1 Strategy as a Starting Point for the Framework ...............................................34

4.1.1 Key findings .............................................................................................................. 36

4.2 Agile Software Development ...........................................................................36

4.3 Software Goal Management .............................................................................37

4.4 Software Product Management ........................................................................38

4.5 Key findings .....................................................................................................39

4.6 Designing a Goal Based Model for Managing Portfolio and Tasks.................40

4.6.1 An Example of Strategy Work: How Strategic Decision is Transferred to

Goals and Activity..................................................................................................... 44

5 Conclusion and Discussion ......................................................................................46

5.1 Research Topics Found ....................................................................................47

References ........................................................................................................................... i

Appendix A: Interview questions and themes presented for management

group members of the Company ......................................................................................v

Appendix B: Exambles of XWiki Goal and Sub Goal pages ................................... vii

1

1 Introduction

1.1 Background

As widely agreed by the organization and management research, both small and large

companies need a vision and a strategy to be able to efficiently manage company goals.

However, the traditional strategy frameworks are prepared in the context of a large

company. For a small company, strategy work ought to proceed much faster to quite

practical things. This problem was also faced in IPSS - Intelligent Precision Solutions

and Services Oy, the target company of this case study when an ambitious strategy

project was started in autumn of 2007.

The strategy project in IPSS started by applying commonly used strategy frameworks

like Porter (1996) and Hambrick & Fredrickson (2001). In the first phase the

management formed a preliminary strategy draft to clarify the company’s position on the

market and to choose the most promising future directions. The strategy was launched to

the personnel but it was noticed soon that the different areas of the strategy were not

clear and supported not the company’s daily work. In the second phase, more than half

of the company personnel were recruited to the strategy project. Soon the strategy project

was a collection of eight different sub-strategy projects. Finally, in the spring 2008 the

strategy project was quietly killed because not any of the sub strategies was finished. The

management came to a conclusion that the strategy work model was too heavy and the

results of the work did not give enough tools for the management to make crisp decisions

on company’s future goals.

The strategic agility, suggested by for example Doz & Kosonen (2008), has become a

very popular topic in the management. In the software industry the lean software

development (Poppendieck & Poppendieck 2007) is promising new benefits. Even

though both the strategic agility and the lean are originally studied in large enterprises

they seem to be scalable into the small companies.

2

Due to the unsuccessful experiences in a strategy process, the management of IPSS

avoided to start any serious strategy project for a couple of years. However, at the same

time a continuous progress in the project work efficiency was accomplished in IPSS by

nurturing agile methods (Leffingwell 2007) and by deploying a new tool, Agilefant.org,

to support the agile task, iteration, and project management.

The success of the agile development in IPSS led to the idea to use analogical methods to

develop agile management system for the company. Optimally, the management should

be based on company’s strategy. Furthermore, the strategy tries to fulfil strategic

objectives (Hambrick & Fredrickson 2001). At the end the deployment of the strategy is

realized in the fulfilment of tasks related to objectives.

While agile management of the tasks has been a success, a blurred idea or hope to find a

way to connect company-level goals with agile tasks was born. Can this be at least for

small companies a way to realize strategy very practically?

1.2 Research Problem

The research problem of this thesis is stated as follows:

How can the planning and prioritization of daily tasks based on company’s

goals be supported in a small software company to achieve work efficiency and

strategic agility.

A solution to this research problem is sought through finding answers to the following

research questions:

1) How is work effort used in the Company? How is the work effort distributed

between employees? Based on collected data, what kind of improvements can be

achieved in the effectiveness of work?

2) What is the current way of managing company goals, the project portfolio and

other tasks and how well is it working?

3

3) Based on the literature, how could a tool for connecting company goals with daily

tasks be designed? The tool is aimed to support better task planning and more

efficiency of work for a small software company.

4) How could a better way of managing company goals, the project portfolio and

other tasks be designed?

1.3 Methodology

The answer(s) to the research problem will be sought through analysing company’s

current work effort usage, way of management, and challenges. The basis for the new

management model will be created through literature study. A proposal for the new

framework of a management model based on the company goals will be designed. The

framework will be discussed together with company’s management team members to

collect their opinions on the suitability and challenges related to the framework.

Answering the research questions in Chapter 1.2:

Answering the research question (1) starts by composing an overview of the target

company, IPSS Oy: in what business it is, what kind of work is done in the company,

how the company is organized. This supports also answering the research question (2).

For answering the research question (1) study is continued with collecting and

analysing company’s current usage of the work effort. The work effort of the whole

company from May, 2009 until May, 2010 is analysed. This material is investigated to be

able to gain understanding how much effort different work areas need and to track

opportunities for improvements in the work efficiency.

Answering the research question (2) is studied by first documenting the current way of

management and the project portfolio. Documentation is prepared by analysing how the

different functions and teams work currently and how the interaction and co-operation

between these are realized.

4

Secondly, the management group members are interviewed to collect their opinions

about needed improvements and this data analysed. One workshop will be held to deepen

the opinions and to build a shared vision about the needed improvements.

For answering the research question (3) literature is investigated to combine

information on software development management and more universal company strategy

work. Strategic agility is a popular area both in scientific and business research. The

findings of the literature survey are put into the scope of a small software company to

find out what are in practice the ways to proceed to improve the company’s model and

tools of management, projects, processes, and tasks. This work also gives preliminary

findings to answer the research question (4).

For answering the research question (4) another workshop with management group

members will be held to present and further modify the first draft model of the

management of the company’s strategy, company-level goals, and their linkage to daily

tasks and the project portfolio. Formatted Wiki pages are created to the company’s

intranet wiki system to visualize and describe essential parts of the framework and to

demonstrate how the framework can be implemented from the tool and documentation

perspective.

1.4 Scope and Restrictions

The target small software company is already practising agile software development

methods. An agile way to run project work is already expected to take place. The

personnel in the target company are already using iterative sprints, tasks tied to user

stories and through these entered into a shared project management tool. These practices

can be widened to cover tasks outside the pure software development work. The

company has been heavily investing in the agile development methods like Scrum and

applying these methods into its businesses. Therefore, the findings of this study cannot

be directly applied to companies running their projects by using more traditional plan-

based methods.

5

This thesis is focusing on linking the goals to the task. This study concentrates on

improvement of company’s functions and results by linking better hi-level company

goals to practical day-to-day tasks.

Both in agile and lean development there are a lot of other aspects and sources for

improvement of work efficiency and quality. These aspects were not studied in this

thesis.

The new framework includes all the work tasks in the company, not only the project

work tasks. In the literature, the agile software development is often focuses on the

software product development tasks and portfolio, not all tasks and processes in a

software company. Setting the scope of this thesis to include all company’s tasks was

understood crucial, because in small company the same employees are involved in all the

processes. The most crucial challenge in managing the product development is the

management of the work effort required by other tasks than direct development work.

Strategic agility (Doz & Kosonen 2008) and Lean Software development (Poppendieck

& Poppendieck 2007) set emphasis on the fluidity of resources. In a small company, this

means taking a wide look into all operations. In the target company, the present matrix

organisation is functioning well and an easy way of organising the work into hierarchical

units or teams does not seem possible.

The results of the study might not be relevant to tiny or large software companies.

This study is based and concentrating in a small software company i.e. less than 50

employees. The findings may not be directly applied to tiny companies where the amount

of employees is less than ten. Tiny company can still work as one team and thus

overcome many of the challenges of a bigger company.

The objectiveness of the study might be in some part influenced by the close

relationship of the writer of the thesis to the target company. Terho Norja has been the

CEO of IPSS Oy for ten years.

6

1.5 Structure and Outline of the Thesis

This describes the structure and contents of the study and the contribution of each section

to the research problem. Furthermore, the background and motivation to start this study

are presented in Chapter 1. Chapter 1 introduses the research problem which was divided

into research questions. The used methodology, scope, and restrictions are also

presented in Chapter 1.

Chapter 2 describes the design of the case study on IPSS Oy.

Chapter 3 describes the results of the case study on IPSS Oy and answers the the research

questions (1) and (2).

In Chapter 4, the literature is investigated to combine information on software

development management and more universal company strategy work. The answer to the

research question (3) is based on the literature evaluation. Chapter 4 continues with the

design of a framework of a model that combines company-level goals with daily tasks.

Chapter 4 gives the answer to the research question (4)

Chapter 5 summarises the study with conclusion and discussion.

7

2 Research Design of the Case Study on IPSS Oy

The case study consists of three parts and a conclusion. The study starts by composing an

overview of the target company, IPSS Oy: The company’s business area, the type of

projects and products done in the company, and the organizational structure of the

company. The goal is to understand the company’s current situation and to form the

basis for the second and third part and to ensure that the findings are realistic and the

suggested changes are feasible.

In second part of the study, the goal is to reveal where work effort takes place in the

company. The information about the work distribution between employees is based on

the company’s work management system. The data will be analysed to gain

understanding to the challenges and to be able to show whether there is an opportunity

for improvement in the effectiveness of work.

The goal of the third part of the case study is to examine the current way of managing

company’s goals, the project portfolio and other tasks. The aim is to reveal the current

management status and the ways to improve this.

The conclusion combines the key findings of the three parts of case study.

The research approach using a case study can be characterized as a revelatory single case

study (Yin 2003).

2.1 Research Design of the First Part:

Services, Products, and Organisation

2.1.1 Data Collection

The company overview is based on the presentation material, strategy documents, and

internal development project documentation. The writer of this thesis has worked for ten

years as a CEO of the company and therefore the collection of the overview and

background information is straightforward.

8

2.1.2 Data Analysis

Collected material contains both up-to-date and outdated information. An up-to-date

overview is composed from the collected material to this study. The company type and

profile is verbally and superficially compared with generic company profiles. Profound

comparative study could have been useful but did not fit into the scope of this study.

2.2 Research Design of the Second Part:

Work Effort Distribution and Improvement Opportunities

2.2.1 Data Collection

All the work effort of the whole company from May, 2009 until May 2010 is extracted

from the company’s work management system (Agilefant.org) into an Excel sheet. The

structure of the work input to different areas is investigated through the user interface of

Agilefant. The documentation also includes the employees’ views on their tasks and how

they log their efforts with the tool.

2.2.2 Data Analysis

To the data extracted from the work management system, a new classification for

projected vs. non-projected work is added to differentiate these work categories which

are managed differently. A new classification for internal vs. external (i.e. customer-

specific) work is added. Both new classifications are generated as dependency rules on

original data and therefore no manual adjustment or corrections of the data are needed for

this part.

The content of the data is scrambled so that actual customer names, employee names as

well as the project and support area names are transformed to general terms like

“Customer1”, “Emp1”, “Project1”. Extracted data contains also work log comments but

these are not transformed with the collected data due to the confidentiality..

The amount of work effort and structure per employee and per month will be investigated

to track possible defects in the data. Some employees may not have logged their work

effort as carefully as the others and some corrective operations on the data may be

9

needed to maintain the ability to make conclusions from the data. Especially the work

areas other than project work have more challenges in the coverage.

To evaluate the potential for improvements, the analyses on the number of projects and

other main work areas the employee works on each day and week will be prepared.

2.3 Research Design of the Third Part:

Management Model

2.3.1 Data Collection

First, the current way of managing the work and the project portfolio is documented.

Documentation is prepared by analysing how the different functions and teams work

currently and how the interaction and co-operation between these are realized.

Secondly, the management group members are interviewed to collect their opinions

about the needed improvements. One workshop is held to discuss and better understand

the opinions and to consolidate them to a shared opinion.

2.3.2 Data Analysis

Shortcomings and weaknesses in the current management system are combined from

three sources: the model documenting the current way, interviews, and the workshop

results.

10

3 Results of the Case Study on IPSS Oy

3.1 Part 1: Services, Products, and Organisation of IPSS

The background information on services, products, and organisation of IPSS was

collected from company’s presentation material and strategy documents. The target of

this evaluation was to gain understanding about the mission of the IPSS and the type of

work and businesses that are done in the company.

3.1.1 Services and Products

The mission of IPSS is to develop software for leading and managing customer

relationships and to implement solutions in this area for its customers (Figure 1).

Figure 1: The business idea of IPSS is to build solution for customer leaderships and

management to its customers. IPSS implements tools for three major areas shown in the

picture: 1) Build knowledge on customer potential, 2) Set goals and plan activities to create

tasks linked to customers and customer segments, and 3) Optimize interaction with customers.

IPSS earns major part of its income from project work with customers (Figure 2).

Implemented solutions are normally based on commercial CRM (Customer Relationship

Management) software and Business Intelligence software (see Figure 3).

KNOWL-EDGE

GOALS,ACTIONS,

ANDTASKS

INTERACTION

CustomerInform-mationCollect and

managecustomer

data

Enrichcustomer

information

Detectcustomer potential

Convert businessobjectives into

goalsPlan

customeror segment-

relatedcare models

Createtask listsand workqueues

for customeractivities

Managecustomers

through differentchannels

Enhanceefficient customer

interactionusing tasks and

work queues

Monitorcustomer

interaction

11

Figure 2: The income structure of IPSS from the fiscal year 2009/4 – 2010/3.

IPSS also develops a suite of its own products (see Figure 4). These products are used as

modular building blocks to minimize customer-specific software development in those

areas that are often repeated from case to case. License fees from these products are at

the moment very small.

Project work at IPSS is integration and configuration of the tools for customers to

comprehend a needed solution. IPSS also provides its software as service through an

outsourced hosting centre. An important part of the income is based on customer support

services. IPSS also offers help desk and technical 2nd line support services for its

customers.

Support andmaintenance

(including SaaS)19 %

Training1 %

Licenses2 %

Project works(including

deployment anddevelopment

projects)78 %

Income percentages by business area

12

Figure 3: Partnerships of IPSS with commercial software providers to build solutions to

customers.

Figure 4: IPSS’s own product suite. Other modules than iSTEER Contact are based on Java 6

SE platform. iSTEER Contact is based on Salesforce.com’s Force.com cloud software

platform.

3.1.2 Organisation

During the study, IPSS employs 29 persons. IPSS is organised as a matrix organisation

(see Figure 5). People and knowledge are divided into three technology teams (Business

intelligence team, CRM solutions team, and Integration and platform development team)

and a management team. Each team has a named team leader and the CEO manages the

management team. People resources are owned and managed by technology teams and

teams are responsible for the development of the knowledge and capabilities at IPSS.

Oracle / Siebel[CRM]

• Sales• Contact Center• Marketing• Segmentation• Targeting

SAP[SAP Labs]

• ContactCentre(BCM)

BusinessObjects

• Reporting• Analytics

Oracle / BI

• Reporting• Analytics

Microsoft

• Reporting• Analytics• DW• CRM

Digium

• Feedbackmanagement

• Listeningcustomers

SPSS

• Mining• Analytics

Salesforce.com[CRM]

• Sales• Contact

Center• Marketing

(B2B)

Cognos

• Reporting• Analytics

JaicomCIRIX

• Tilaustenhallinta

• Jakelunhallinta

Pentaho

• Raportointi• Analysointi

Setting and managingcustomer goals.Engaging salescommitment.

Creating customercare plans.Converting plansinto actionsand tasks.MDM

Targeting andcampaignmanagement.Generating tasksautomatically.Sending messages.

Enhancing customer interaction, customerrelationship management, maintainingcustomer information, reporting customercontacts, time management.

Management ofcustomer feedback,listening tocustomers, collectionof customerinformation.

Connecting andupdating customerinformation, MDM.

Multilayeredarchitecture forenabling reusabilityand f lexibility.

iSTEERGoal

iSTEERPlan

iSTEERTarget

iSTEERContact / Mobile

iSTEERSurvey

iSTEERConnect

iSTEERTools

Java 6

...

Application Server

DataMgmt

Metadata

iFace

UserInterfaceMetadata

ApplicationPrivileges

User Data(Relational)

iBase

Result set

SQL, MDX

Result Set

Data requestas XML

iSTEER ToolsApplications

Properties

User Data(MDXCube)

EJB, WebServices

3rd partycomponents

IPSSiStore

iStore logic

jsp css

BrowserUser

InterfaceMobileUser

Interface

13

Most of the work (processes, projects, and development) is managed by business areas:

Development, Customer Service and Infrastructure, Projects, and Sales. Members of each

technology team are named and responsible for different tasks within business areas.

Work is done for business areas and resources are provided by technology teams.

Structure supports the model where the major part of the work is organized into projects

or iterations resourced by technology teams.

Business Intelligence

[team leader1]

CRM solutions

[team leader2]

Integration andplatform development[team leader3]

Peop

le a

ndkn

owle

dge

mgm

t

Team

s

Operation management andDevelopment

Cus

tom

ers

and

part

ners

Management

[CEO]

Sales

[Mgr4]

Projects

[Mgr3]

Deve-lopment

[Mgr1]

Custservice,Infra[Mgr2]

Figure 5: IPSS organisation. Personnel are organised into three technology teams and a

management team. Development and other work are divided into four areas: Development,

Customer service & Infrastructure, Projects, and Sales and Marketing. technology teams and

the team leaders are responsible for people (as resources) and knowledge development.

Technology teams do not own any projects while they only provide resources and knowledge

to the projects.

Duncan (1979) presents a decision tree for deciding the best organisational structure. The

key driver in his work is the classification of the organisational environment (Figure 6).

In practice IPSS has been forced organise as a matrix organization to be able to achieve a

good quality of people and knowledge management in reasonable sized teams and at the

same time to be able to deliver resources to all business areas. The conclusions of

Duncan (1979) supports the decision of IPSS.

14

Figure 6: Classification of organisational environments by Duncan (1979). Although small

organization, IPSS still seems to fit best into the category “high perceived uncertainty”.

According to Bartlett & Ghoshal (1990) the development of human resources is an

important motivation argument for matrix organisation. This is also supported by

experiences in IPSS. When IPSS was organised hierarchically by the business areas and

functions the team size became too small. To solve this, virtual teams were founded to

seat same employees to several teams at the same time. Furthermore, knowledge

management and employee career planning are especially important tasks for a software

company. To manage those tasks excellently presumes that team leaders have

reasonably-sized teams. Otherwise they cannot invest in themselves enough to be

professionals in management.

Matrix organisation, on the other hand, enables fluidity of resources to those tasks where

they are needed, which is important to achieve strategic agility (Doz & Kosonen 2008).

The matrix organisation may, on the other hand, create serious challenges. Bartlett &

Ghoshal (1990) perceived some usual problems: “Dual reporting led to conflict and

confusion; the proliferation of channels created informational log-jams as a proliferation

of committees and reports bogged down the organisation; and overlapping

responsibilities produced turf battles and a loss of accountability.” More focus and effort

on the functionality and handiness of methods and tools are needed in the matrix

organisation to be able to manage different tasks. Reporting the status of activities and

15

keeping all stakeholders in touch with changes, progress, and possible impediments all

need special tools.

3.1.3 Agile Task and Project Management

IPSS has applied agile development models since 2003. First phase happened in 2003

when Excel-based work task and project management was replaced with a browser-based

AgilElephant tool. In practice this tool was mainly used for logging project work hours.

In the spring of 2009 IPSS trained 35% of its personnel working as or planned to be

working as project manager positions to be Scrum masters. In May 2009 IPSS started to

use a new tool, Agilefant.org, for managing all the work in IPSS.

3.1.4 Business Model

Rönkkö et al. (2009) categorized software companies in different but overlapping

contexts (Figure 7): customer tailored software, software products, in-house systems, and

embedded software. IPSS is operating in all the contexts despite embedded software.

Figure 7: Contexts for professional software development by Rönkkö et al. (2009). IPSS

business includes all other contexts than embedded software.

Business models in Finnish software companies and their revenue sources are presented

in Figure 8 (Rönkkö et al. 2009). For IPSS the most fitting business model of these

categories is the deployment project firm, as major part of the income is based on

deployment projects.

16

Figure 8: Sources of revenue by business models in Finnish software companies by Rönkkö et

al. (2009). The revenue structures between these business types differ very much from each

other. The business model of IPSS is nearest to the deployment project firm category.

However, IPSS still also invests in the own product development.

Rönkkö et al. (2009) present information on how many of the studied deployment project

firms also have major investment in their own software product development. Table 1

presents research and development investments of different company types including

“Software project contractor”, but R&D figures contain all research and development

investments, not just software product development.

Research and development investments in IPSS can be estimated from the work effort

distribution presented in Figure 9, page 17. Major part of the costs of the research and

development is based on the work effort amounts. Research and development is coded in

Agilefant into three areas: product development (8%), non-projected development (2%),

and knowledge development (7%). The total percentage for R&D in IPSS is 18%.

17

Table 1: Research and development investments in Finnish software companies by Rönkkö et

al. (2009).

Figure 9: Work effort distribution in IPSS.

Internal Administration9 %

Internal Non-projectedDevelopment

2 %

Internal / Dump pit8 %

Internal Infra (non-projected)

4 %

Internal Knowledge dev(non-projected)

7 %

Internal Sales, Marketingand partnerships

8 %Internal Work welfare1 %

Internal Product dev(non-projected)

1 %

External Support (non-projected)

12 %

Internal Product Devprojects

8 %

External Projects40 %

Work effort distribution

18

Comparing the revenue structures of Finnish software companies in Figure 8 (Rönkkö et

al. 2009) to the revenue structure of IPSS (Figure 2 at page 11) reveals that IPSS seems

to be fitting best with development service firm category. However, the income from

support services, maintenance services, and SaaS (Software as a Service) is 19% at IPSS

while the percentage is much lower in typical Finnish software development companies

on the average. The direct income from licences is minimal (2%) at IPSS. This

percentage is misleading because major part of the service income is based on renting the

licences of own product development as a part of the service.

3.1.5 Key Findings

The business idea of IPSS drives it to operate on exceptionally many software business

areas, especially when taking into account its size. The amount and distribution of the

areas of work is more carefully studied in the next part (Part 2 - study on the usage of

work effort in IPSS). While matrix organisation seems to be the best choice for the

organisational structure of IPSS, it also requires special emphasis on the model of

management and functionality and tools for managing and reporting.

3.2 Part 2: Work Effort Distribution and Improvement Opportunities

3.2.1 Agile Task and Project Management

IPSS uses Agilefant.org (Figure 10) as a tool to manage all the work done in IPSS.

Customer projects and own product and service development projects fit easily with

Scrum and Agilefant.org. For other areas included into Agilefant.org, in practice only the

work effort is logged to the stories and tasks prepared structurally into the tool.

19

Figure 10: View from development portfolio view of Agilefant.org. Currently running projects

are prioritized and status (green = ok, yellow = some problems, red = serious problems, black

= status not updated) of the project is updated in project manager meeting in every two weeks.

3.2.2 Work Effort Distribution

The project management tool, Agilefant, contains work plans and effort for example

customer-specific projects, recurring processes like customer support, administration,

sales and marketing. Table 2 presents the structure of projects and tasks in Agilefant as

well as the work efforts in hours [h] logged to each area.

Table 2: Work areas in IPSS and amount of work logged [h] to each area.Sum of Spent effort (hours) Year Month

2009 2010 Grand TotalInt-Ext Product* Project* 5 6 7 8 9 10 11 12 1 2 3 4 5

Internal IPSS Internal Administration 409 333 164 357 410 373 300 246 291 260 306 272 259 3979Dump pit 246 276 194 323 313 256 271 266 258 264 313 291 250 3520Development 165 92 16 69 115 80 49 83 51 49 69 120 120 1077Infra 82 104 56 121 196 195 237 179 217 137 114 103 81 1822Knowledge dev 401 347 196 279 173 214 213 105 198 338 225 217 162 3069Sales, Marketing and partnerships300 255 25 292 348 356 268 275 270 276 346 324 332 3668Work welfare 12 3 1 9 16 2 1 23 13 39 100 7 2 227

IPSS Internal Total 1614 1410 652 1451 1571 1476 1340 1177 1297 1362 1473 1333 1206 17363Product dev Product Dev 227 144 128 175 223 257 249 241 223 187 528 401 415 3398

Concepting 6 11 16 1 6 40Fixes 17 20 22 8 2 2 3 1 1 1 1 78Evaluations 16 30 38 33 21 33 13 30 213Roadmapping 1 15 1 11 12 14 9 2 3 8 11 4 91

Product dev Total 228 176 149 208 243 289 290 290 271 232 563 432 449 3820Internal Total 1842 1586 801 1659 1814 1765 1630 1468 1568 1593 2036 1765 1655 21183

External 1879 1882 920 1452 2016 1982 2204 1727 1611 1743 1573 1584 1761 22336Grand Total 3721 3468 1722 3112 3830 3747 3835 3195 3179 3336 3609 3349 3416 43519

20

Agile way of working is practised only in projected type of work: external customer

projects and internal product development projects. For other types of work,

administration, sales, infrastructure maintenance and development, process development,

knowledge development, Agilefant is currently used only for logging the work effort

used on tasks belonging to these areas. For different projects the goals of project

iterations are planned as user stories into Agilefant. After this the project team plans the

tasks for design and implementation work and estimates the work effort for each task.

Therefore for projected work Agilefant contains typically one sprint ahead telling what is

planned to happen but for the other type of work Agilefant shows no visibility to future

tasks, work effort, and objectives.

As presented in Table 3 and Figure 11 the percentage of projected work during the

studied period was about 48% of the total work effort and the percentage of non-

projected work was about 52%. These numbers are not absolutely exact because for

major customer support tasks (12%, see Figure 9, page 17) separate stories and/or tasks

may be created and work effort estimated beforehand. In Agilefant these tasks are

entered into same hierarchy where recurring support tasks are and therefore sorting the

projected tasks out of the basic recurring work was not possible. The percentage of this

kind of tasks can still be estimated to be quite low because normal convention in IPSS is

to create a project – iteration structure for all customer project work.

Table 3: Work areas in IPSS and amount of work logged as percentages [%].

Based on this analysis, about half of the work takes place without any real plan and

objective. Thus there does not exist any straightforward tool or model for communicating

to each other of the intended progress and result. For some areas of currently non-

projected work the creation of plans and setting goals does not make much difference i.e.

Grand TotalInt-Ext Product* Project* 5 6 7 8 9 10 11 12 1 2 3 4 5Internal IPSS Internal Administration 11,0 9,6 9,5 11,5 10,7 10,0 7,8 7,7 9,1 7,8 8,5 8,1 7,6 9,1

Dump pit 6,6 8,0 11,2 10,4 8,2 6,8 7,1 8,3 8,1 7,9 8,7 8,7 7,3 8,1Development 4,4 2,6 0,9 2,2 3,0 2,1 1,3 2,6 1,6 1,5 1,9 3,6 3,5 2,5Infra 2,2 3,0 3,3 3,9 5,1 5,2 6,2 5,6 6,8 4,1 3,2 3,1 2,4 4,2Knowledge dev 10,8 10,0 11,4 9,0 4,5 5,7 5,6 3,3 6,2 10,1 6,2 6,5 4,8 7,1Sales, Marketing and partnerships8,1 7,4 1,4 9,4 9,1 9,5 7,0 8,6 8,5 8,3 9,6 9,7 9,7 8,4Work welfare 0,3 0,1 0,1 0,3 0,4 0,1 0,0 0,7 0,4 1,2 2,8 0,2 0,1 0,5

IPSS Internal Total 43,4 40,7 37,9 46,6 41,0 39,4 34,9 36,9 40,8 40,8 40,8 39,8 35,3 39,9Product dev Product Dev 6,1 4,1 7,4 5,6 5,8 6,9 6,5 7,5 7,0 5,6 14,6 12,0 12,1 7,8

Concepting 0,2 0,4 0,5 0,0 0,2 0,1Fixes 0,5 1,2 0,7 0,2 0,1 0,1 0,1 0,0 0,0 0,0 0,0 0,2Evaluations 0,4 0,8 1,2 1,0 0,6 0,9 0,4 0,9 0,5Roadmapping 0,0 0,4 0,1 0,4 0,3 0,4 0,2 0,1 0,1 0,2 0,3 0,1 0,2

Product dev Total 6,1 5,1 8,7 6,7 6,4 7,7 7,6 9,1 8,5 6,9 15,6 12,9 13,1 8,8Internal Total 49,5 45,7 46,5 53,3 47,4 47,1 42,5 45,9 49,3 47,8 56,4 52,7 48,4 48,7External 50,5 54,3 53,5 46,7 52,6 52,9 57,5 54,1 50,7 52,2 43,6 47,3 51,6 51,3Grand Total 100,0 100,0 100,0 100,0 100,0 100,0 100,0 100,0 100,0 100,0 100,0 100,0 100,0 100,0

21

majority of administration (9%) and dump pit (8%). For some areas of the work, totally

non-projected at the moment, there is also development targets for which objectives

could easily be set and tasks planned into the already available tools. These work areas

include some of the infrastructure maintenance and development (4%), sales (8%), and

knowledge development (7%).

Figure 11: 48% of work effort is projected (External projects 40%, Internal product dev 8%).

51% of work effort is external work for customers. 49% of work effort is internal (i.e. not

directly for customers).

3.2.3 Waste from Task Switching

Effect of task switching and interruptions on the software developer work has been

widely studied.

Parnin & Rugaber (2009) state that developers consistently spend a significant portion of

their time doing non-editing activities before making their first edit in a session. During

this time period, developers are performing a variety of activities that relate to rebuilding

their task context. Iqpal & Horvitz (2007) found that users spent about 15 minutes in

resuming phase after email or instant message interruption. Solingen et al. (1998) state

that if more than 10 interrupts occur during a day, the time between the interrupts

Non-projectedInternal

41 %

Non-projectExternalSupport

11 %

Project edInternalProduct

Development8 %

Project External40 %

Work effort distribution

22

becomes too short to accomplish product development work. Perry et al. (1994) claim

that developers typically perform their work in blocks of two hours.

Most of the studies are concentrating on the software development work and therefore

these findings do not directly fit to all work areas and types registered by work

management system of IPSS. Furthermore, at this study the employee roles other than

software developer were also under investigation. However, almost all the personnel in

IPSS are engaged in the development work.

Figure 12 presents the amount of projects and/or other major work areas each employee

in IPSS is working during one day. It should be noticed that most of the ad hoc

interruptions are entered into “dump pit” and therefore these kind of interruption are not

visible in Agilefant data. If a significant contribution for some task had to be

unexpectedly made normal practice was to log the work effort into the relevant task.

Most of the employees work on the average for 3 – 5 projects or work areas during one

day. Although 3 – 5 may not be a highly alerting number it still means switching the

major task 2 – 4 times per day.

Both Poppendieck & Poppendieck (2007) and especially Rothman (2009) warn about

task switching. Poppendieck & Poppendieck (2007) note that when knowledge workers

have three or four tasks to do, they will often spend more time in resetting their minds as

they switch to each new task than they spend actually working on it. Task switching time

is waste in the terms of lean software development. Poppendieck & Poppendieck (2007)

state that, albeit causing task switching, it still is viable to have software developers to

take care of support tasks on the software they have developed.

Rothman (2009) is quite strict about the harmfulness of part-time people in a project.

Rothman (2009) states that if a project is staffed with people who are working part-time

on that project and part-time on other projects, the project is an uncommitted project. As

understood from the data and Figure 12 at IPSS projects seldom get staffed with every

team member working fulltime for one project. On the other hand in IPSS the projects

and resources are managed through a common shared system which diminishes the harm

23

of employee involvement in many projects at the same time and offers tools to manage

the work at a higher level than one project.

Figure 12: Chart shows how many projects and work areas employee contributes during one

day in the average (Internal administration or “dump pit” work logs are not taken into

account in this analysis).

Figure 13 shows the distribution of the lengths of the efforts one employee has worked

for different tasks during one day. Actual non-interrupted lengths may be even shorter

because employees commonly log the daily effort into one task at once even though they

were interrupted in the mean time. Only 19% of the effort logs are at least for two hours.

0

2

4

6

8

10

12

14

16

18

Amount of Different Projects & Support Areas per Day user haslogged work effort

Ave

Min

Max

24

Figure 13: Chart shows the distribution of lengths of logged efforts: how long employee has

worked on one project or work area during one day.

As the maximum values in the Figure 12 were quite high the distribution of the amount

of tasks employee works during one day was analysed more carefully. Days were

classified into six categories: less than 2 tasks per day, 3 tasks per day, 4 tasks per day, 5

tasks per day, 6, and more than 7 tasks per day. Figure 14 presents the results of this

analysis. Only 27% of the work days were such that the employee was working at most

three tasks. On 58% of the work days the employee was working on at least five tasks.

logh < 30min1 % 30min <= logh

< 1h30 %

1h <= logh < 2h50 %

logh >= 2h19 %

Distribution of lenghts [h] of logged effort

25

Figure 14: Chart shows the distribution of how many tasks one employee has worked on

during one day. 58% of the days are such that employee has worked on at least 5 projects or

work areas. 27% of the days are such that employee has been able to concentrate only at most

3 projects or work areas during the day.

Figure 15 presents the weekly average amounts of tasks for each employee. Most

employees work on 10 – 20 tasks during each week.

Weekly averages do differ very much from the daily averaged multiplied by the number

of days per week. Still the opportunity for reduction of task switching because of more

advanced planning at weekly level was analysed. The selection of daily tasks may be

done more intelligently from the collection of weekly tasks. Figure 16 presents the

estimation for possible saving in task switching. The analysis indicates a possibility for

about 0.7 task switch savings per day.

tpd <= 2: 13 %

tpd = 3: 15 %

tpd = 4: 17 %

tpd = 5: 17 %

tpd =6: 14 %

tpd >= 7: 24 %

Distribution of tasks per day (tpd) - number of tasks employee haslogged work effort during one day

tpd >= 6: 38%

tpd >= 5: 58%

tpd <= 5:62%

tpd <= 4:45%

tpd <= 3: 27%

26

Figure 15: Chart shows how many projects and work areas employee contributes during one

week on the average (Internal administration or “dump pit” work logs are not taken into

account in this analysis).

Figure 16: Chart estimates the potential daily saving in project or support work task switching

if weekly level planning was implemented. Weekly work efforts were compared to daily and

then estimated potential for saving.

0

10

20

30

40

50

60

Amount of Different Projects & Work Areas per WeekEmployee has logged hours

Ave

Min

Max

-0,1

0,1

0,3

0,5

0,7

0,9

1,1

1,3

1,5

0

50

100

150

200

250

300

Aver

age

of p

oten

t ial

/ d

ay

Sum

of

pot e

ntia

l

Potential of saving project switching per day

Sum of Pot Ave of Pot / Day

DataUser* Sum of Pot Ave of PotEmpl29 12 0,2Empl02 49 0,6Empl20 61 0,4Empl17 102 0,5Empl19 103 0,6Empl07 120 0,7Empl16 126 0,8Empl14 130 0,5Empl25 136 0,6Empl15 138 0,6Empl12 140 0,6Empl26 144 0,6Empl05 145 0,6Empl23 146 0,6Empl08 153 0,6Empl21 159 0,7Empl09 161 0,7Empl22 162 0,7Empl28 165 0,7Empl10 170 1,0Empl06 177 0,7Empl11 183 0,8Empl13 191 0,8Empl01 192 0,7Empl18 193 0,8Empl03 198 0,8Empl24 206 0,9Empl27 242 1,2Grand Total 4105 0,7

27

3.2.4 Key Findings

Half of the work effort is managed without setting explicit objectives and plan shared

with other people. Major part of this work can be managed as projects. This kind of

change very probably can serve as moderate source of improvement in work

effectiveness and shared communication.

Employees are working on too many different tasks on each day and week. As noted by

Poppendieck & Poppendieck (2007) less work gets done by the same effort because the

effort used for task switching is waste. IPSS has a significant potential for improvement

in work effectiveness if the amount of tasks in-process at the same time is diminished.

3.3 Part 3: Management Model

3.3.1 Current Management Model

Figure 17 presents the participants of the management of IPSS and the tools mainly used

by each of them. The board defines the objectives and decides the strategy for IPSS.

These are documented in PowerPoint slides and meeting minutes as Word documents.

CEO’s duty is to execute the board’s decisions. Some orders and guidelines are delivered

verbally or ad-hoc emails, etc. CEO is participant in management team, product steering

group, and sales team. Major part of the orders is delivered in the meetings of those

teams.

28

EmployeeEmployeeEmployeeEmployeeEmployeeEmployeeEmployeeEmployee

XWikiintranet

Board

CEO

Management

Team

Team

ProductDirector

ProductSteeringGroup

Scrummaster

ProjectSteeringGroup

Scrummaster

ProjectOwner

(Customer)

Scrumteam

Scrumteam

SalesTeam

Scrumteam

ProjectSteeringGroup

Scrummaster

ProjectOwner

(Customer)

Scrumteam

ProjectSteeringGroup

Scrummaster

ProjectOwner

(Customer)

Scrumteam

ProjectSteeringGroup

Scrummaster

ProjectOwner

(Customer)

Scrumteam

ProjectDirector

CustomerSupport &Infrastruc-

ture

Customer projects

XWikiintran

et

XWikiintran

et

XWikiintran

et

TeamTeamsXWiki

intranet

XWikiintranet

Figure 17: The participants of the management in IPSS and their common tools.

The management team meets twice a month using standard agenda, reports, and

suggestions prepared into IPSS intranet XWiki pages. The management team tracks the

future project cash flow using an Excel sheet updated by project managers before the

meetings. Furthermore, the management team tracks the tasks decided in the meetings

using Agilefant. The controller presents financial results from the last full month using an

Excel sheet.

Team leaders present status reports of their teams using a stationary XWiki pages. The

sales director present the sales opportunity and lead reports using Excel. Future sales and

marketing activities are updated in XWiki. CEO presents strategy changes and strategy

deployment activities using a stationary XWiki page. A project director presents project

status reports using a stationary XWiki page. Furthermore, the product director presents a

product road map status update using a PowerPoint document.

The product director keeps the product road map up-to-date as a PowerPoint document.

Product idea collection and a large part of the documentation is worked on in XWiki.

Product steering group decides the sprint content and priorities. The project director is

responsible for the preparations to the project steering group meetings. A Scrum master

named to all product development projects presents the status of the product development

29

sprints using Agilefant. The next iteration content is prepared to Agilefant. The scrum

master enters the stories decided in the product steering group, assures the assignments,

and takes care of the task planning and effort estimation for the forthcoming

development sprint.

A scrum master tracks the progress of development and preparation in weekly meetings

with employees assigned to the sprint. There might be more than one team active on

product management at the same time. Usually the same scrum master manages them all.

Team members log effort hours daily and update the effort left value at least weekly.

A scrum master is named for each customer project. For all projects a steering group is

named as well as a product owner from customer side. Usually the customer account

responsible is also a member of the project steering group. The project team works the

same way in customer projects as in product development using mainly Agilefant. Status

updating protocols and methods may be different in each customer project. Also the

development idea management, primary project backlog, and the documentation methods

vary. Current iteration’s of backlog stories as well as tasks are always in Agilefant.

CEO may start other projects if needed. He negotiates with team leaders and project

director to name optimal team (a scrum master and team members) into them. A project

steering group is usually also named. In many cases CEO is the project owner, but this

position can of course be given to somebody else.

The project director collects the status of all the projects in project managers’ meeting

held twice a month, just before management team meeting.

A sales team is managed by the sales director. Sales teams meet twice a month to co-

ordinate sales operations and follow-up lead and opportunity statuses. Sometimes, for

extensive offer preparation or some other big marketing or sales operation a scrum team

is started up. The sales director is usually the project owner.

Technology teams meet weekly to keep team leader updated of the situation of each team

member. Actual project issues are not discussed in the technology team meetings. These

30

meetings concentrate on resourcing issues, knowledge development, administration, and

employee management.

Customer support and infrastructureares at the moment of the study managed by CEO. A

permanent team is named to be responsible for different areas. For a more extensive work

a project with scrum master and team is named and started.

3.3.2 Requirements for Improvement

Improvement ideas collected from the management team members are presented in Table

4. Most of the issues presented relate more or less to the development of tools used to

support management. Each idea was classified whether it is a tool related issue or not,

whether it is a management related issue or not, and whether it has something to do with

future planning or not. Positive answers are marked with “X” in the Table 4.

Table 4: Improvement ideas collected.

Suggested improvement

Too

l

Mgm

t

Fut

ure

Better model: How to react and interact if challenges are detected in aproject

X

Better model to communicate company level focus changes or progress in bigsubjects

X X

Better model for agreeing who is responsible for each task- visibility of the responsibilities- communication of the changes in responsibilities- employees do not perceive their load

X

Challenges at task level are not always notified. Agilefant is not highlightingthe problems.

X

More efficient tools and work model for gaining ideas and suggestions.- support for many sources of ideas: internal processes, customer

cases, sales cases, ..- big picture of ideas

X X X

Quarter review of the strategy. Wider involvement by employees. X

31

Suggested improvement

Too

l

Mgm

t

Fut

ure

More visibility on long-term goals and next quarter goals- currently board is not making its decisions easily visible and

understandable

X X

More visibility on how goals and strategy are linked X XMore functional planning tools

- in one place- decisions visible: what is done / what not

X X

Tools for prioritization of tasks between projects- in most of the cases decision could be made by responsible

X X

Continuous collection of ideas- management of received ideas

X X X

Tool for working on roadmap for the board- “one slide” big goals, not necessarily tied to time- order of progress: what first, what then,- technology team goals (knowledge development)

X X

Better tools for technology team level- for discussing and treating issues- team member status reporting- future load visibility and planning

X X

Company goals- present the vision of optimal situation- more straightforward linkage to sales operations and goals

X X

Reduce the amount of work done without clear objective X X

Road map of the future goals should be visible to all X

Management model of IPSS is not clearmany views to steering (team leader, project manager, top mgmt)visibility of decision or suggestions made at different forums

X

Technology team meetings are not useful enough. Technology team roleclarification

X X

Project portfolio status report and forthcoming things shown in flat screensin the kitchen

X

Activities better linked with Strategy. X X

Better visibility to resource usage and assignment. There is many partieswho need this information, i.e. project manager, team leader, responsibleemployee

X

Better tools for progress follow-up- progress vs. goal- progress vs. forecast- progress vs. last check- effort lefts should be updated

X X

More effective communication of strategy to all- focus and focus changes- progress and progress follow-up (clear, measurable goals should

be defined, ability to measure)- activities required for success- linkage to knowledge development

X X

32

Suggested improvement

Too

l

Mgm

t

Fut

ure

More concrete communication ( easier to remember)- in the future this should change..- in the future this is staying..

X X

Better linkage on company strategy and to areas team leaders need toimprove knowledge in their technology team

X X

Support mentoring to grow shared best-practices X

3.3.3 Key Findings

The management model supports well the needs of IPSS and its challenging business

structure. The aim to start all remarkable work as scrum project or iteration brings them

to the same model already used in practise for project work. The study did not find any

major missing participating actors or gaps in interaction between actors.

Agilefant covers the operational requirements for a tool. Otherwise the tool set in IPSS is

quite fragmented. The opinions of the management team members strongly supported

this.

Tool set is crucially insufficient in the area of future planning. The management team

members named altogether 26 improvements. 15 improvement ideas were in the area of

future planning. Agilefant supports future planning for only one iteration ahead. Tools

for planning are currently fragmented or even totally missing.

3.4 Conclusions of the Case Study

The conclusions are dependent on each other. They are marked as C1 - CN to help cross-

referencing.

33

IPSS is a matrix organisation. This implies that special emphasis should be put on the

model and functionality of the management and the tools for managing and reporting

(C1).

IPSS suffers from ineffectiveness of work for two different reasons. Firstly, half of the

work effort is managed without setting explicit objectives or plans shared with other

people (C2). Secondly employees are working on too many different tasks during each

day and week (C3).

In addition to direct inefficiency, a big portion of unplanned work effectively damages

load planning and management (C4). Otherwise load planning would be functioning

better and thereby reduce C3.

Developing tools for planning should be top priority for IPSS (C4). Missing or too

superficial planning harms the ability to prioritize subjects. There is no clear visibility or

continuum of the long-term goals nor agreed and selected high-level plans to proceed.

As a result, too many projects or iterations are continuously selected in-process at the

same time (C6). C6 is the reason of C3.

Success in deploying functional tools for planning solves problems or reduces their

impact.

34

4 Designing a Framework for Linking Company Goals

with Daily Tasks

In this chapter a framework for setting explicit company level goals is designed. The

target is to be able to present a model connecting company goals through required mid-

entities to daily tasks. This framework is expected to help IPSS to improve its functions

and management as stated in the conclusions in chapter 3.4.

The starting point for the design of the framework was to collect ideas, requirements, and

possible designs from literature. These findings were analysed against the findings of this

study and the reality of a small company. These ideas for solution were prepared as

PowerPoint slides and a workshop was organised with management team members to

collect their opinions on the solution.

Finally the design of the framework was enhanced to use current IPSS tools as building

blocks where viable.

4.1 Strategy as a Starting Point for the Framework

A classic strategy article by Porter (1996) sees strategy as a positioning of an

organisation. Oliver (2001) defines that “strategy is understanding an industry structure

and dynamics, determining the organization's relative position in that industry, and taking

action to either change the industry's structure or the organization's position to improve

organizational results”. Thus he sets strong emphasis on the external things outside the

organisation.

Neither Porter’s (1996) nor Oliver’s (2001) vision about strategy is easy to integrate with

activities other than analysis of external markets and industry and the own organisation.

For the purposes of a small company extensive analysing is either too superficial or too

costly to be practical. For large companies this kind of positioning is probably more

useful and economically viable.

35

Hambrick & Fredrickson (2001) see a strategy to be more an internal plan of an

organization for five areas: (1) Where will the company be active, (2) How will the

company get there, (3) How will the company win in the marketplace (differentiators),

(4) What will the company’s speed and sequence of moves be, and (5) How will the

company obtain its returns. By Hambrick & Fredrickson (2001) the strategy of a

company is an integrated concept of how the company will achieve the objectives set.

The vision about strategy, presented by Hambrick & Fredrickson (2001), is linked to

actions of a company. All the mentioned areas, when studied more carefully, start to

imply things which the the organisation should do in practise.

Figure 18: Goal-Driven Software Measurement by Park et al. (1996) [corrected 16.6.2010]

Factors for strategic sensitivity, resource fluidity, and leadership unity by Doz & Kosonen

(2008)

Doz & Kosonen (2008) put emphasis on fluidity of resources (Figure 18). A company

should be able to target the usage of its resources aligned with the strategic decisions.

Lean software development contains analogical ideas of flexible and just-in-time

allocation of resources (Poppendieck & Poppendieck 2007). Doz & Kosonen (2008) also

note open strategy process to be one factor of strategic sensitivity.

36

Ala-Mutka (2008) suggests that companies could prepare a dynamic model of strategic

management instead of preparing a strategy through a classical strategy process. A

classical strategy process contains phases for analysis, decision making, deployment, and

measuring.

4.1.1 Key findings

Supported by the literature, a model for strategic management c be prepared (Ala-Mutka

2008). This model was able use strategic objectives, like Hambrick & Fredrickson (2001)

state, as a starting point. Optimally, the model could provide a linkage between the

objectives and the action. Thus, if the objectives are changed, respectively the actions get

changed and resources are re-allocated to new activities. This can improve the fluidity of

resources, which Doz & Kosonen (2008) see important.

4.2 Agile Software Development

In agile development paradigm the requirements are defined as stories meaning units for

development that can be estimated and completed reliably (Poppendieck & Poppendieck

2007). Suitable size of development effort is selected for one iteration for designing,

coding, testing, and deploying completed stories in the end of iteration.

This kind of model could be used for managing other kind of tasks than just software

development. It offers a possibility to effectively guide the stories and tasks selected in-

process and resources allocated. Thus it may support strategic agility when the selection

of task is based on strategic objectives. Agile model also support resource fluidity if

resources are not necessarily allocated to certain functions for more than one iteration.

37

4.3 Software Goal Management

Figure 19: Goal-Driven Software Measurement by Park et al. (1996)

Park et al. (1996) present a model for connecting business goals with software

development definitions (Figure 19). The model is very thoughtful covering the steps

measurement goals, questions, indicators, measures, and finally definitions. Breaking

questions, indicators, and measures from each other helps to formulate measurement. For

a small company this model probably is too complicated and needs to simplified if

applied.

38

4.4 Software Product Management

Vlaanderen et al. (2009) has been studied agile software product management and

presents promising models for the rhythm of development sprints and product

management sprints (Figure 20). Same kind of practise probably is interesting for goal-

based task management as the rhythm tasks and stories are prepared and ready for

development needs to functioning smoothly.

Figure 20: Agile software product management by Vlaanderen et al. (2009)

Software product management functions and actions can be studied even deeper like van

de Weerd et al. (2006) (Figure 21). The outcome is probably too complex for a small

software company.

39

Figure 21: Reference framework for software release management presented in (van de Weerd

et al. 2006).

Vähäniitty (2003) studies product strategy decisions and cycles of management. Lehtola

et al. (2008) continue the work trying to open how software solution planning should be

based on strategy. Work of Lehtola et al. (2008) may seem to be in the same area as this

study. But Lehtola et al. (2008) try to study software planning basis, structure, dynamics,

and roles of actors. The work of formulating and managing the goals for software

development is included.

The scope of this study is try to find out a model to put goals into action after formulated

and agreed.

4.5 Key findings

Novel software development practises, models, and tools serve a good starting point for

integration of agile task management and strategic objectives for small software

companies.

40

4.6 Designing a Goal Based Model for Managing Portfolio and Tasks

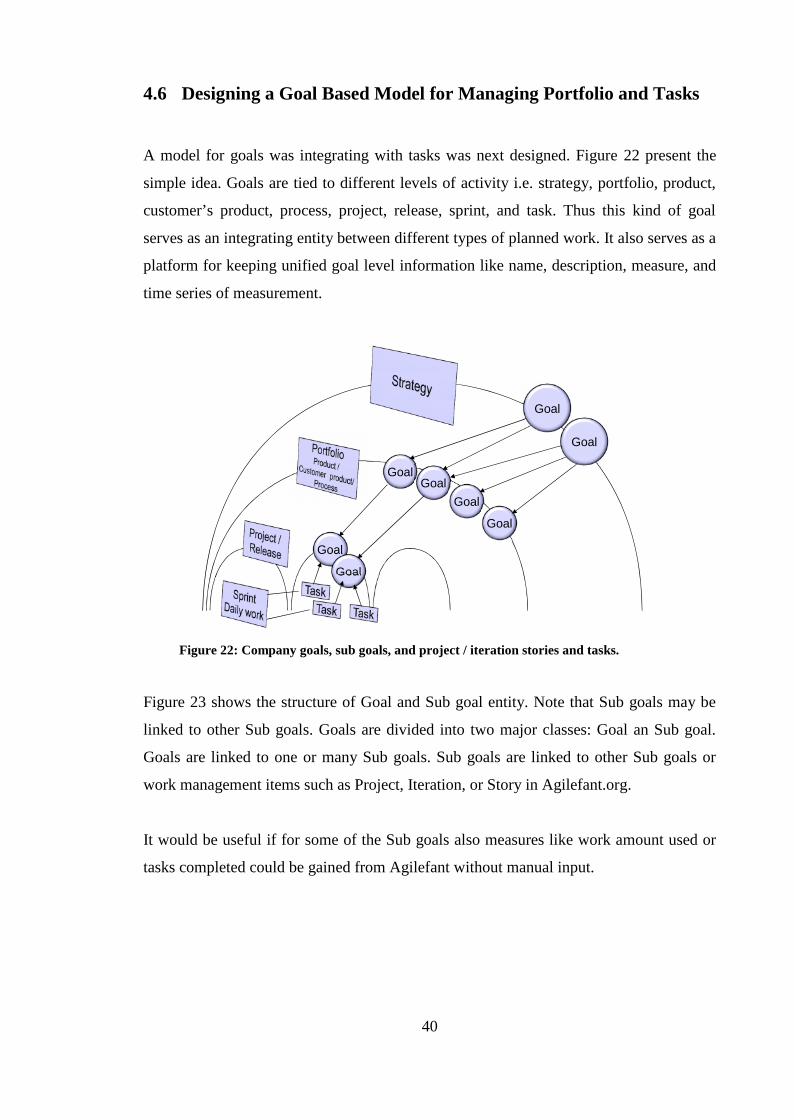
A model for goals was integrating with tasks was next designed. Figure 22 present the

simple idea. Goals are tied to different levels of activity i.e. strategy, portfolio, product,

customer’s product, process, project, release, sprint, and task. Thus this kind of goal

serves as an integrating entity between different types of planned work. It also serves as a

platform for keeping unified goal level information like name, description, measure, and

time series of measurement.

GoalGoal

Goal

Goal

Goal

Goal

Goal

Goal

Figure 22: Company goals, sub goals, and project / iteration stories and tasks.

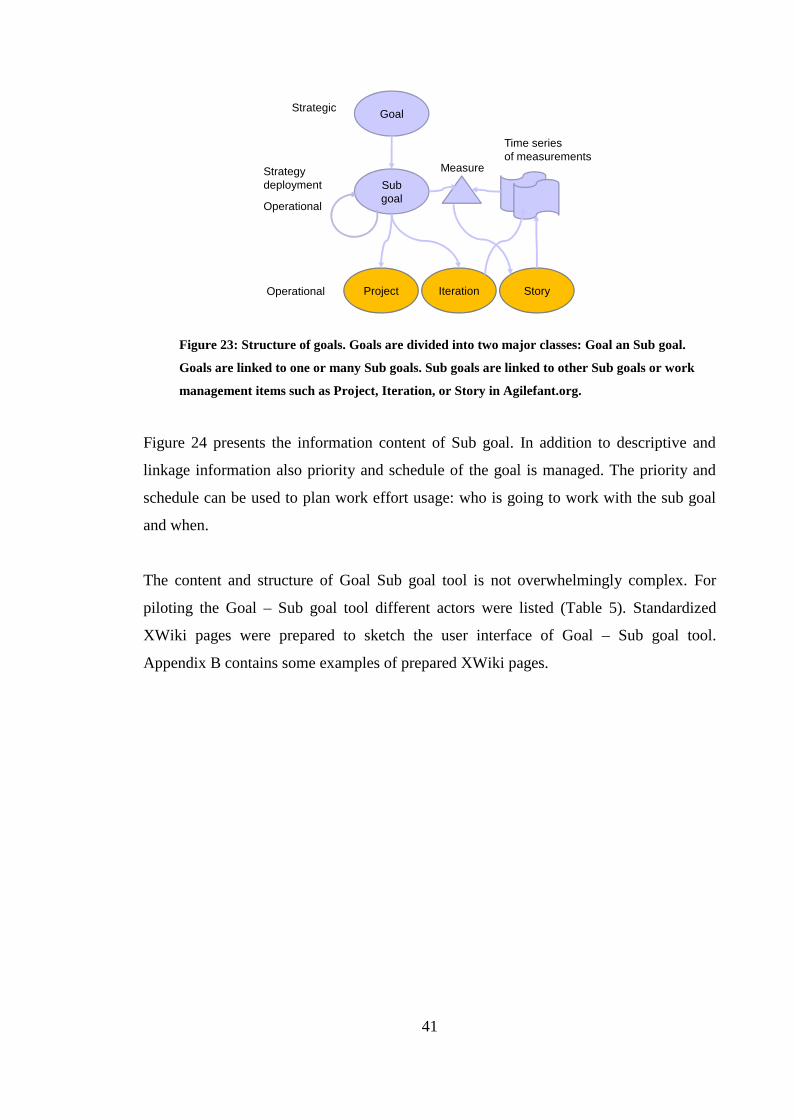
Figure 23 shows the structure of Goal and Sub goal entity. Note that Sub goals may be

linked to other Sub goals. Goals are divided into two major classes: Goal an Sub goal.

Goals are linked to one or many Sub goals. Sub goals are linked to other Sub goals or

work management items such as Project, Iteration, or Story in Agilefant.org.

It would be useful if for some of the Sub goals also measures like work amount used or

tasks completed could be gained from Agilefant without manual input.

41

Goal

Subgoal

IterationProject Story

Time seriesof measurements

Measure

Strategic

Strategydeployment

Operational

Operational

Figure 23: Structure of goals. Goals are divided into two major classes: Goal an Sub goal.

Goals are linked to one or many Sub goals. Sub goals are linked to other Sub goals or work

management items such as Project, Iteration, or Story in Agilefant.org.

Figure 24 presents the information content of Sub goal. In addition to descriptive and

linkage information also priority and schedule of the goal is managed. The priority and

schedule can be used to plan work effort usage: who is going to work with the sub goal

and when.

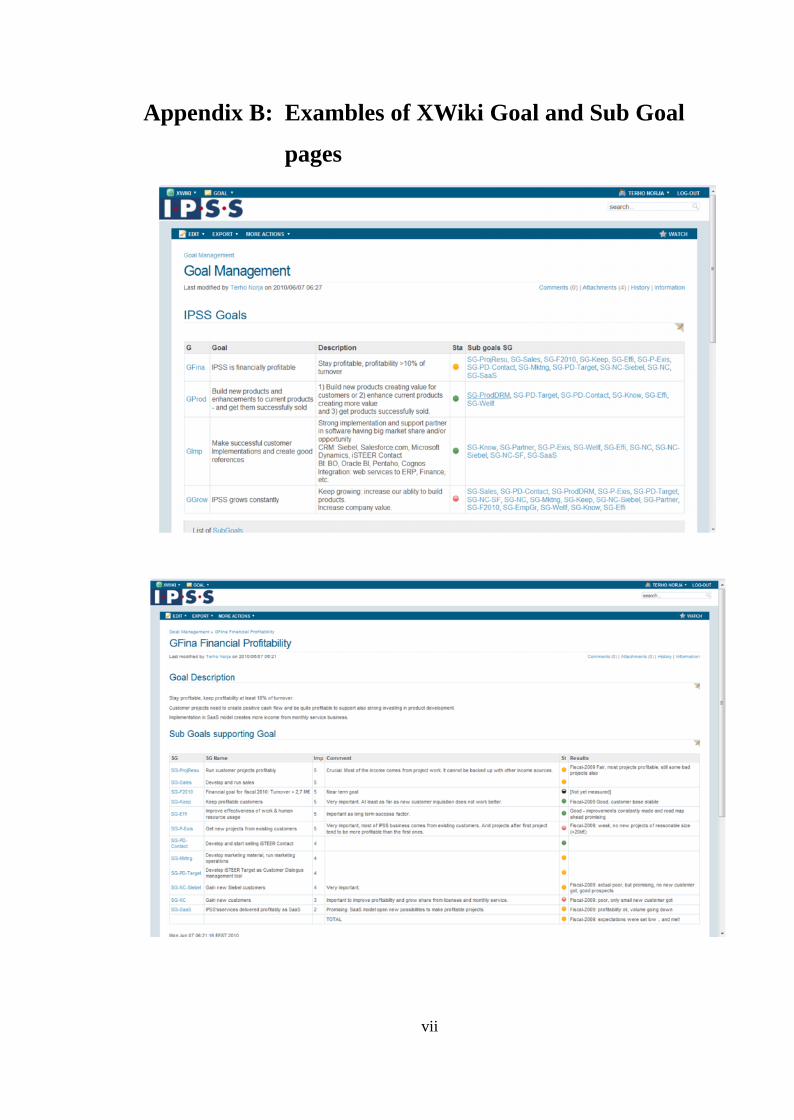
The content and structure of Goal Sub goal tool is not overwhelmingly complex. For

piloting the Goal – Sub goal tool different actors were listed (Table 5). Standardized

XWiki pages were prepared to sketch the user interface of Goal – Sub goal tool.

Appendix B contains some examples of prepared XWiki pages.

42

© IPSS Oy 2010

Sub goal information

• Name• Description• Priority [= LINKED to a specific Goal tells the priority]

• LINK: Company goal which this subgoal supports• Links to projects / iterations / stories in Fantti• Progress measuring

• Sub goals are required to be some how measurable• Questions• Indicators

– Task implementation or other indicator• Measures

– Implemented percentage / effort left vs. estimated total effort / othermeasure

• Checked dt– When the progress measure has been updated

• Status• Schedule

Figure 24: Planned information content for Sub goal. In addition to descriptive and linkage

information also priority and schedule of the goal is managed. The priority and schedule can

be used to plan work effort usage: who is going to work with the sub goal and when.

Table 5: Actors, responsibilities and tasks, and tools for goal-based management.

Actor What Why Tool(s)

Board Decide goals to make decisions about

company direction shown to

everybody

Wiki

Name and

understand sub goals

To understand itself what big

goals actually mean and how

they could be implemented

(strategy)

Wiki

to make decisions about

company concrete goal shown

to everybody

Wiki

CEO Execute decisions by

working with sub

goals

to guide what is important

and what is done

Wiki

Follow-up & react To prepare to make or

propose changes if required

Agilefant reports,

Wiki

Product development &

customer project owner

Execute decisions To plan and guide the actual

work

Wiki, Agilefant

43

Actor What Why Tool(s)

Follow-up & react To prepare to make or

propose changes if required

Agilefant reports,

Agilefant

Proposal for prod

roadmap / prod dev

sprint targets

To plan and guide the actual

work

Agilefant, Wiki

Mgmt team Operate, react to

changes

To follow up and guide the

actual work

Agilefant

Product mgmt team Task prioritization To follow up and guide the

actual work

Agilefant, Wiki

Agree the sprint plan To plan and guide the actual

work

Agilefant

Project Owner /

Steering

group

Project management To follow up and guide the

actual work

Agilefant, Wiki

Project

manager

Project management

Project reporting

To follow up and guide the

actual work

Agilefant, Wiki

Project group

member

Task management

Task status reporting

To see what tasks are

assigned to me

To update status of my tasks

Agilefant

Competence

centre

Follow-up & react To see the workload in our

team

Agilefant reports

Team Follow-up & react To see what is expected from

me and why.

To manage my workload

Agilefant,

Agilefant reports

Follow-up & react Agilefant reports,

Wiki

Individual Proposal for prod

roadmap

Wiki

Sales team Task management

Task status reporting

Proposal for prod

roadmap

To follow up Wiki

44

4.6.1 An Example of Strategy Work: How Strategic Decision is Transferred

to Goals and Activity

Figures 25, 26, and 27 present a real life situation in strategy work of IPSS. Figure 25

shows current positioning of the product and service areas. After the situation and

opportunities were analysed, a target product and service positioning for year 2011 was

prepared and accepted by the IPSS Board (Figure 26). The transition is implemented as

tasks and/or with goals tied to them. This illustrates that the tool could be very useful in

deploying strategy decisions and following their progress although it is not designed to

support strategy preparation process at all. It could be used for making strategy

preparation goals and tasks involved to them visible.

CommercialCRM1

Pure CustomerSpecific projects

CRM3

CRM2

TargetGoal

ShareMobile

BI

Connect

Figure 25: Current IPSS business areas by volume at 2009.

CommercialCRM1

Customer-specific

CommercialCRM2

TargetGoal

(NewShare) &Mobile

BI

Connect

Figure 26: Goal for 2011: Goal IPSS business areas by volume. IPSS sees much opportunity in

CRM2 area. And at the same time Customer-specific project importance and potential is

diminishing. In Share & Mobile business area there might be opportunity for growth provided

that IPSS is able to replace Share by “New Share”.

45

Starting point 2009

CommercialCRM1

Pure CustomerSpecific projects

CRM3CRM2

TargetGoalShare

Mobile

BI

Connect

Target 2011

CommercialCRM1

Customer-specific

CommercialCRM2

TargetGoal

(NewShare) &Mobile

BI

Connect

Project1

Project2

Proj3

Figure 27: Transition from 2009 to 2011. Growing business on CRM2 area is for example not

automatically happening. It means that IPSS sets the transition as an important goal and

planned activities (here Task1, Task2, and Task3) are carefully planned, realistically

resourced, and successfully fulfilled.

46

5 Conclusion and Discussion

IPSS has a significant potential for improvement in work effectiveness if the amount of

tasks in-process simultaneously is diminished. The study presented a promising reason

and background why too many things are selected to be done all the time: big amount of

work gets done without clear goal, priority, or schedule.

Organisational arrangement (Figure 17) of project and product development work is

healthy and practical. Furthermore, the operational tools for managing projects and

sprints are up-to-date and efficient. Still, the studied company, IPSS, has not found a

straightforward way to avoid the challenge of continuous multitasking. Probably

something can and will be done in the company to improve the situation without any new

tools, because the evidence is so overwhelming.

IPSS is missing a tool for setting goals and priorities for major part of the work. Sprint

planning covers less than 50% of the work effort. Sprint planning is done for the purpose

of running the current sprint. Especially IPSS has no tool to recognize or plan the for

estimating whether some employee is going to be overloaded in the future.

Possibility have a tool for planning future work by setting goals, deciding priorities

between goals and adjusting when the work is done opens lucrative opportunities for

both gaining better operational efficiency as well as strategic agility.

A tool to be used in parallel with task management system (Agilefant.org) was designed.

Goal – Sub Goal framework, a solution to link company goals and daily tasks was

presented. The tool needs not to be overwhelmingly complex. The tool does not need to

support strategy or planning work extensively. It should be very useful if only the goals

and sub goals and their information were managed. The tool should be very useful in two

ways: future load, priorities, and schedule could be continuously updated and react

before harmful over tasking is already in-place.

47

5.1 Research Topics Found

Difficulties in managing excessive amount of work in-process simultaneously may be a

major restricting factor for the growth of Finnish software companies of size 10 - 50

employees. So preparing a solution for this probably has substantial economic value.

Goal - Sub goal framework presented clearly requires more work. One interesting topic

could be to study the dependency networks of goals, sub goals and work management

items. It should be possible to develop a model from dependencies and thus automate the

priority calculation and management as well as and task scheduling tools.

The integration of the tool with Agilefant.org is a promising topic for new projects.

.

i

References

(Ala-Mutka 2008) Jukka Ala-Mutka:

Strategiamalli. (In Finnish) Talentum Media Oy. 2008.

(Bartlett & Ghoshal 1990) Christopher A. Bartlett, Sumantra Ghoshal:

Matrix Management: Not a Structure, a Frame of Mind. Harvard Business

Review; Jul/Aug90, Vol. 68 Issue 4, p. 138-145.

(Carlshamre & Regnell 2000) P. Carlshamre & B. Regnell,

Requirements Lifecycle Management and Release Planning in Market-Driven

Requirements Engineering Processes. Database and Expert Systems Applications,

International Workshop on, pp. 961, 11th International Workshop on Database

and Expert Systems Applications (DEXA'00), 2000.

(Doz & Kosonen 2008) Yvez Doz & Mikko Kosonen:

Fast Strategy: How strategic agility will help you stay ahead of the game.

Wharton School Publishing, UK. 2008.

(Duncan 1979) Robert Duncan:

What Is the Right Organization Structure? Decision Tree Analysis Provides the

Answer. Organizational Dynamics, Winter 1979, AMACOM, pp 59-80.

(Greer & Ruhe 2004) D. Greer & G. Ruhe:

Software release planning: an evolutionary and iterative approach. Information

and Software Technology, vol. 46, no. 4, pp. 243–253, 2004.

(Hambrick & Fredrickson 2001) Donald C. Hambrick & James W. Fredrickson:

Are you sure you have a strategy? Academy of Management Executive, 2005,

Vol. 19, No. 4 (Reprinted from 2001, Vol. 15, No. 4), pp. 51-62.

ii

(Iqpal & Horvitz 2007) Shamsi T. Iqbal, Eric Horvitz:

Disruption and recovery of computing tasks: field study, analysis, and directions

Proceedings of the SIGCHI conference on Human factors in computing systems,

San Jose, California, USA, 2007, pp. 677 – 686.

(Lehtola et al. 2008) Laura Lehtola, Marjo Kauppinen, Jarno Vähäniitty & Marko

Komssi:

Linking business and requirements engineering: is solution planning missing

activity in software product companies. Requirements Eng. (2009) 14:113-128.

(Leffingwell 2007) Dean Leffingwell:

Scaling Software Agility: Best Practices for Large Enterprises. Pearson

Education, Inc. 2007.

(Oliver 2001) Richard W. Oliver:

Real-Time Strategy: What is Strategy, Anyway? Journal of Business Strategy;

Volume: 22; Issue: 6; 2001, pp. 7-10.

(Park et al. 1996) Robert E. Park, B. Goethert Wolfhart & William A. Florac:

Goal-Driven Software Measurement – A Guidebook. Handbook CMU/SEI-96-

HB-002. 1996.

(Parnin & Rugaber 2009) C. Parnin, S. Rugaber:

Resumption strategies for interrupted programming tasks. ICPC '09. IEEE 17th

International Conference. 2009. pp: 80 – 89

(Perry et al. 1994) D.E. Perry; N.A. Staudenmayer, L.G. Votta:

People, organizations, and process improvement. Software, IEEE. Volume: 11 ,

Issue: 4, 1994 , pp.: 36 – 45.

(Poppendieck & Poppendieck 2007) Mary Poppendieck, Tom Poppendieck:

Implementing Lean Software Development: From Concept to Cash. Addison-

Wesley. 2007.

iii

(Porter 1996) Michael E. Porter:

What Is Strategy? Harvard Business Review, November-December, 1996, pp. 61-

78.

(Rautiainen et al. 2002) Kristian Rautiainen, Casper Lassenius, Jarno Vähäniitty, Maaret

Pyhäjärvi & Jari Vanhanen:

A Tentative Framework for Managing Software Product Development in Small

Companies. Proceedings of the Hawai'i International Conference on System

Sciences, January 7 – 10, 2002, Big Island, Hawaii.

(Rothman 2009) Johanna Rothman:

Manage Your Project Portfolio. The Pragmatic Bookshelf, Raleigh, North

Carolina, USA. 2009.

(Rönkkö et al. 2009) Mikko Rönkkö, Jukka Ylitalo, Juhana Peltonen, Nina Koivisto,

Olli-Pekka Mutanen, Jussi Autere, Aku Valtakoski, Petri Pentikäinen:

National Software Industry Survey, Helsinki University of Technology, 2009.

(Shalloway et al. 2010) Alan Shalloway, Guy Beaver & James R. Trott:

Lean-Agile Software Development: Achieving Enterprise Agility. Pearson

Education, Inc., USA. 2010.

(Solingen et al. 1998) R. van Solingen, E. Berghout, F. van Latum:

Interrupts: just a minute never is. Software, IEEE Volume: 15 , Issue: 5, 1998, pp

97 – 103.

(Vlaanderen et al. 2009) K. Vlaanderen, S. Brinkkemper, S. Jansen & E. Jaspers:

The Agile Requirements Refinery: Applying SCRUM Principles to Software

Product Management. In Proceedings of the 3rd international workshop on

software product management (IWSPM’09). Atlanta, GA, USA, 2009.

(Vähäniitty 2003) Jarno Vähäniitty:

Product Strategy Decisions in Small Software Product Businesses – A Framework

iv

and Experiences. Master’s thesis, Helsinki University of Technology, Institute of

Strategy and International Business. 2003.

(van de Weerd et al. 2006) I. van de Weerd, S. Brinkkemper, R. Nieuwenhius, J.

Versendaal & L. Bijlsma.:

On the Creation of a Reference Framework for Software Product Management:

Validation and Tool Support. Proceedings of the First International Workshop on

Software Product Management, Minneapolis/St. Paul, MN, 2006. pp. 3-12.

(Yin 2003) R. K. Yin:

Case Study Research - Design and Methods. SAGE Publications, 2003.

v

Appendix A: Interview questions and themes presented

for management group members of the

Company

Questionnaire was sent to company’s management group members beforehand and

opinions collected in interview meeting. Questions are originally in Finnish. Some

explanatory text is added to translation – in interview situation respondent was led to

answer to this point.

Original questions and themes in Finnish Translated into English

1) Strategian läpinäkyvyys ja jalkautusa. Miten saamme riittävän hyvän kuvan

kaikille organisaatiossa:i. Tavoitteistamme

ii. Prioriteeteistämme: mikä tällähetkellä on tärkeää, miksi, mihinliittyy

iii. Edistymästä

b. Miten muutokset kommunikoidaan,jalkautetaani. Painopisteen muuttuminen

ii. Edistymän kehittyminen

2) Visibility and deployment of company’sstrategya. How we can deliver adequate

picture/undesrtanding to allemployees in our organization about:i. Our goals

ii. Our priorities: what is importantright now, why, and to whichissues the priorities are linked

iii. Our progress

b. How changes to the strategy arecommunicated and deployedi. Changes in emphasis [of our

goals]ii. Changes in [our] progress

3) Miten eri asiat tulisi työstää

a. Tavoitteista sopimineni. Pitkän ajan kehityssuuntaan

liittyvät tavoitteetii. Seuraavan jakson (3kk – 6kk)

tavoitteet

4) How to work with our goals

a. Agreeing our goalsi. Long term vision and trend

ii. Next period (3-6 months) goals

vi

Original questions and themes in Finnish Translated into English

5) Keiden ja miten tekemistä pitäisi seurata jaohjata

a. Etenemisen ja tilanteen seurantai. Projektit

ii. Prosessitiii. Poikkeamien havaitseminen –

reagoinnista päättäminen

6) Who should be responsible to follow-upand guide action [upon fulfilment of thegoals]a. Following progress and status

i. Projectsii. Processes

iii. Detecting impediments –decisions to reaction

7) Ihmisten ja osaamisen johtamisennäkökulmaa. Miten tavoitteet ja tekeminen

vaikuttavatb. Miten pitäisi vaikuttaac. Motivointi?

8) People and knowledge management viewa. Impact of goals and work-in-processb. What kind of impact they shouldc. [Dependencies to] motivation?

9) Miten uusiutuminen pitäisi huomioidaa. Nykyisten tavoitteiden ja nykyisen

toiminnan kyseenalaistaminenb. Uusien ideoiden kerääminen ja käsittely

10) How regeneration should be taken intoaccounta. Questioning current goals and current

work-in-processb. Collecting and managing new ideas

vii

Appendix B: Exambles of XWiki Goal and Sub Goal

pages

viii


Recommended