Method 321 8/7/2017 1 While we have taken steps to ensure the accuracy of this Internet version of the document, it is not the official version. To see a complete version including any recent edits, visit: https://www.ecfr.gov/cgi-bin/ECFR?page=browse and search under Title 40, Protection of Environment. TEST METHOD 321—MEASUREMENT OF GASEOUS HYDROGEN CHLORIDE EMISSIONS AT PORTLAND CEMENT KILNS BY FOURIER TRANSFORM INFRARED (FTIR) SPECTROSCOPY 1.0 Introduction This method should be performed by those persons familiar with the operation of Fourier Transform Infrared (FTIR) instrumentation in the application to source sampling. This document describes the sampling procedures for use in the application of FTIR spectrometry for the determination of vapor phase hydrogen chloride (HCl) concentrations both before and after particulate matter control devices installed at portland cement kilns. A procedure for analyte spiking is included for quality assurance. This method is considered to be self validating provided that the requirements listed in section 9 of this method are followed. The analytical procedures for interpreting infrared spectra from emission measurements are described in the “Protocol For The Use of Extractive Fourier Transform Infrared (FTIR) Spectrometry in Analyses of Gaseous Emissions From Stationary Industrial Sources”, included as an addendum to proposed Method 320 of this appendix (hereafter referred to as the “FTIR Protocol)”. References 1 and 2 describe the use of FTIR spectrometry in field measurements. Sample transport presents the principal difficulty in directly measuring HCl emissions. This identical problem must be overcome by any extractive measurement method. HCl is reactive and water soluble. The sampling system must be adequately designed to prevent sample condensation in the system. 1.1 Scope and Application This method is specifically designed for the application of FTIR Spectrometry in extractive measurements of gaseous HCl concentrations in portland cement kiln emissions. 1.2 Applicability This method applies to the measurement of HCl [CAS No. 7647-01-0]. This method can be applied to the determination of HCl concentrations both before and after particulate matter control devices installed at portland cement manufacturing facilities. This method applies to either continuous flow through measurement (with isolated sample analysis) or grab sampling (batch analysis). HCl is measured using the mid-infrared spectral region for analysis (about 400 to 4000 cm −1 or 25 to 2.5 μm). Table 1 lists the suggested analytical region for quantification of HCl taking the interference from water vapor into consideration.
Transcript
Method 321 8/7/2017
1
While we have taken steps to ensure the accuracy of this Internet version of the document, it is not the
official version. To see a complete version including any recent edits, visit:
https://www.ecfr.gov/cgi-bin/ECFR?page=browse and search under Title 40, Protection of
Environment.
TEST METHOD 321—MEASUREMENT OF GASEOUS HYDROGEN CHLORIDE EMISSIONS AT
PORTLAND CEMENT KILNS BY FOURIER TRANSFORM INFRARED (FTIR) SPECTROSCOPY
1.0 Introduction
This method should be performed by those persons familiar with the operation of Fourier
Transform Infrared (FTIR) instrumentation in the application to source sampling. This document
describes the sampling procedures for use in the application of FTIR spectrometry for the
determination of vapor phase hydrogen chloride (HCl) concentrations both before and after
particulate matter control devices installed at portland cement kilns. A procedure for analyte
spiking is included for quality assurance. This method is considered to be self validating
provided that the requirements listed in section 9 of this method are followed. The analytical
procedures for interpreting infrared spectra from emission measurements are described in the
“Protocol For The Use of Extractive Fourier Transform Infrared (FTIR) Spectrometry in
Analyses of Gaseous Emissions From Stationary Industrial Sources”, included as an addendum
to proposed Method 320 of this appendix (hereafter referred to as the “FTIR Protocol)”.
References 1 and 2 describe the use of FTIR spectrometry in field measurements. Sample
transport presents the principal difficulty in directly measuring HCl emissions. This identical
problem must be overcome by any extractive measurement method. HCl is reactive and water
soluble. The sampling system must be adequately designed to prevent sample condensation in
the system.
1.1 Scope and Application
This method is specifically designed for the application of FTIR Spectrometry in extractive
measurements of gaseous HCl concentrations in portland cement kiln emissions.
1.2 Applicability
This method applies to the measurement of HCl [CAS No. 7647-01-0]. This method can be
applied to the determination of HCl concentrations both before and after particulate matter
control devices installed at portland cement manufacturing facilities. This method applies to
either continuous flow through measurement (with isolated sample analysis) or grab sampling
(batch analysis). HCl is measured using the mid-infrared spectral region for analysis (about 400
to 4000 cm−1 or 25 to 2.5 µm). Table 1 lists the suggested analytical region for quantification of
HCl taking the interference from water vapor into consideration.
1.3.1 The analytical range is determined by the instrumental design and the composition of the
gas stream. For practical purposes there is no upper limit to the range because the pathlength
may be reduced or the sample may be diluted. The lower detection range depends on (1) the
absorption coefficient of the compound in the analytical frequency region, (2) the spectral
resolution, (3) the interferometer sampling time, (4) the detector sensitivity and response, and (5)
the absorption pathlength.
1.3.2 The practical lower quantification range is usually higher than that indicated by the
instrument performance in the laboratory, and is dependent upon (1) the presence of interfering
species in the exhaust gas (notably H2O), (2) the optical alignment of the gas cell and transfer
optics, and (3) the quality of the reflective surfaces in the cell (cell throughput). Under typical
test conditions (moisture content of up to 30 percent, 10 meter absorption path length, liquid
nitrogen-cooled IR detector, 0.5 cm−1 resolution, and an interferometer sampling time of 60
seconds) a typical lower quantification range for HCl is 0.1 to 1.0 ppm.
1.4 Data Quality Objectives
1.4.1 In designing or configuring the analytical system, data quality is determined by measuring
of the root mean square deviation (RMSD) of the absorbance values within a chosen spectral
(analytical) region. The RMSD provides an indication of the signal-to-noise ratio (S/N) of the
spectral baseline. Appendix D of the FTIR Protocol (the addendum to Method 320 of this
appendix) presents a discussion of the relationship between the RMSD, lower detection limit,
DLi, and analytical uncertainty, AUi. It is important to consider the target analyte quantification
limit when performing testing with FTIR instrumentation, and to optimize the system to achieve
the desired detection limit.
1.4.2 Data quality is determined by measuring the root mean square (RMS) noise level in each
analytical spectral region (appendix C of the FTIR Protocol). The RMS noise is defined as the
root mean square deviation (RMSD) of the absorbance values in an analytical region from the
mean absorbance value in the same region. Appendix D of the FTIR Protocol defines the
minimum analyte uncertainty (MAU), and how the RMSD is used to calculate the MAU. The
MAUim is the minimum concentration of the ith analyte in the mth analytical region for which
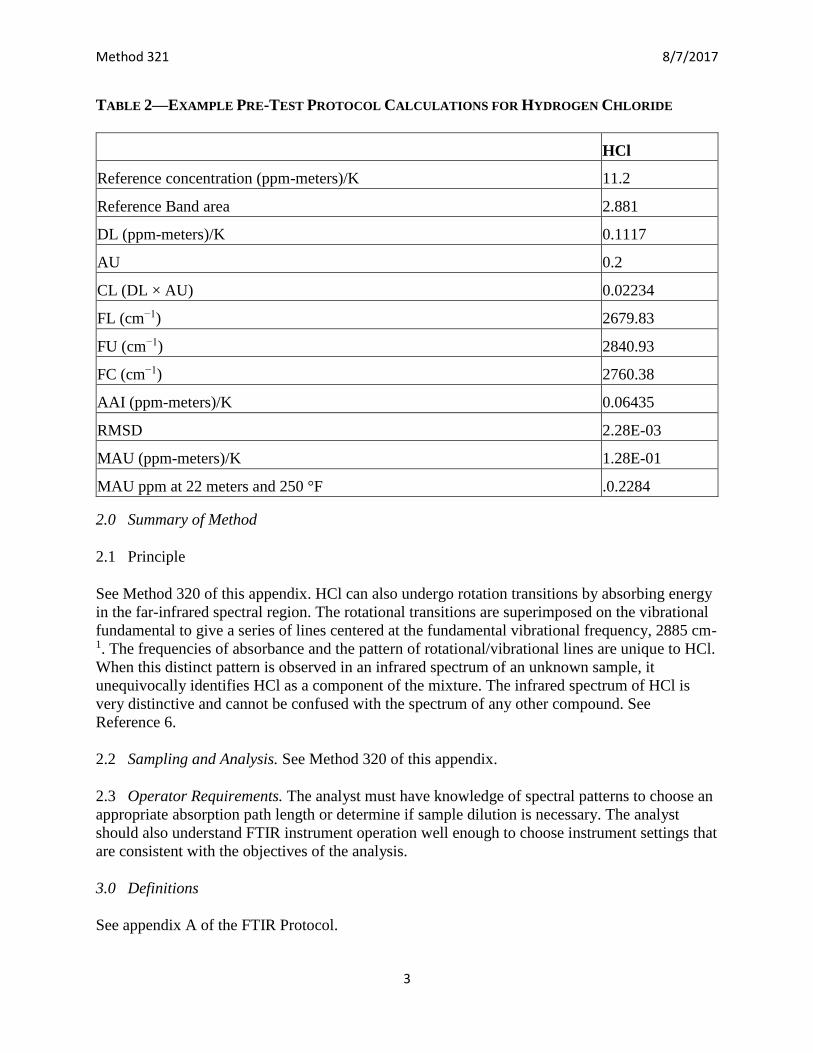
the analytical uncertainty limit can be maintained. Table 2 presents example values of AU and
MAU using the analytical region presented in Table 1.
Method 321 8/7/2017
3
TABLE 2—EXAMPLE PRE-TEST PROTOCOL CALCULATIONS FOR HYDROGEN CHLORIDE
HCl
Reference concentration (ppm-meters)/K 11.2
Reference Band area 2.881
DL (ppm-meters)/K 0.1117
AU 0.2
CL (DL × AU) 0.02234
FL (cm−1) 2679.83
FU (cm−1) 2840.93
FC (cm−1) 2760.38
AAI (ppm-meters)/K 0.06435
RMSD 2.28E-03
MAU (ppm-meters)/K 1.28E-01
MAU ppm at 22 meters and 250 °F .0.2284
2.0 Summary of Method
2.1 Principle
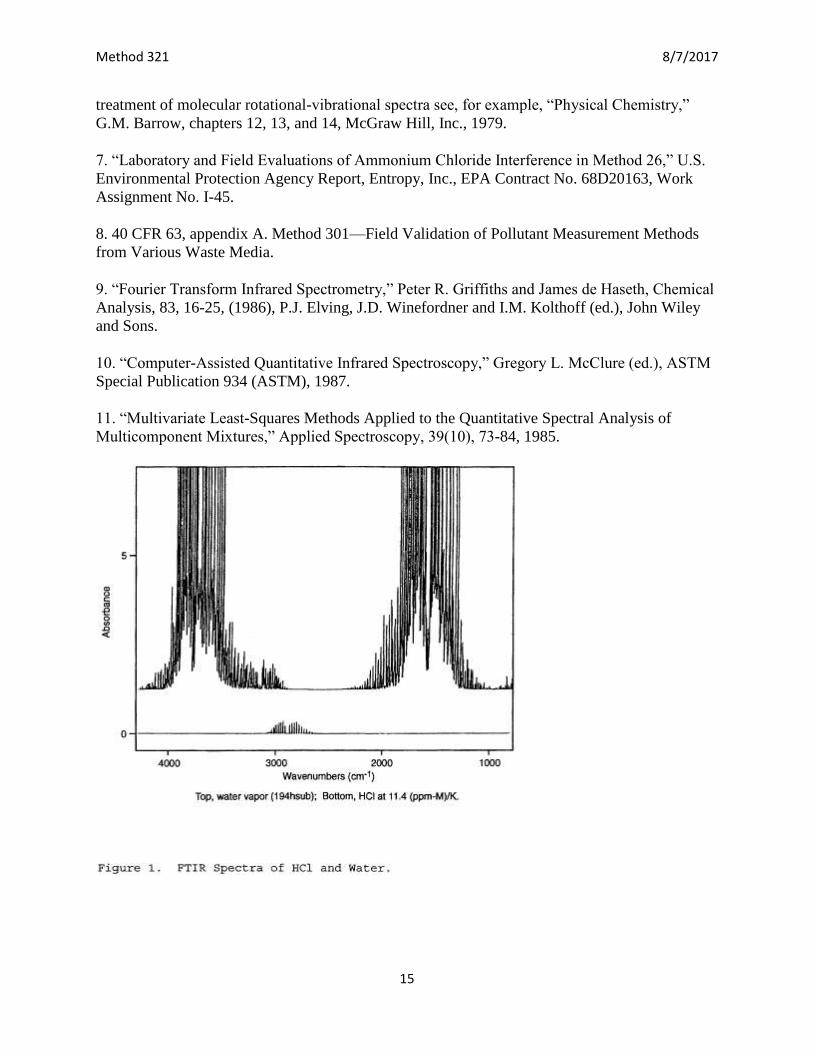
See Method 320 of this appendix. HCl can also undergo rotation transitions by absorbing energy
in the far-infrared spectral region. The rotational transitions are superimposed on the vibrational
fundamental to give a series of lines centered at the fundamental vibrational frequency, 2885 cm-1. The frequencies of absorbance and the pattern of rotational/vibrational lines are unique to HCl.
When this distinct pattern is observed in an infrared spectrum of an unknown sample, it
unequivocally identifies HCl as a component of the mixture. The infrared spectrum of HCl is
very distinctive and cannot be confused with the spectrum of any other compound. See
Reference 6.
2.2 Sampling and Analysis. See Method 320 of this appendix.
2.3 Operator Requirements. The analyst must have knowledge of spectral patterns to choose an
appropriate absorption path length or determine if sample dilution is necessary. The analyst
should also understand FTIR instrument operation well enough to choose instrument settings that
are consistent with the objectives of the analysis.
3.0 Definitions
See appendix A of the FTIR Protocol.
Method 321 8/7/2017
4
4.0 Interferences
This method will not measure HCl under conditions: (1) where the sample gas stream can
condense in the sampling system or the instrumentation, or (2) where a high moisture content
sample relative to the analyte concentrations imparts spectral interference due to the water vapor
absorbance bands. For measuring HCl the first (sampling) consideration is more critical. Spectral
interference from water vapor is not a significant problem except at very high moisture levels
and low HCl concentrations.
4.1 Analytical Interferences. See Method 320 of this appendix.
4.1.1 Background Interferences. See Method 320 of this appendix.
4.1.2 Spectral interferences. Water vapor can present spectral interference for FTIR gas
analysis of HCl. Therefore, the water vapor in the spectra of kiln gas samples must be accounted
for. This means preparing at least one spectrum of a water vapor sample where the moisture
concentration is close to that in the kiln gas.
4.2 Sampling System Interferences. The principal sampling system interferant for measuring
HCl is water vapor. Steps must be taken to ensure that no condensation forms anywhere in the
probe assembly, sample lines, or analytical instrumentation. Cold spots anywhere in the
sampling system must be avoided. The extent of sampling system bias in the FTIR analysis of
HCl depends on concentrations of potential interferants, moisture content of the gas stream,
temperature of the gas stream, temperature of sampling system components, sample flow rate,
and reactivity of HCl with other species in the gas stream (e.g., ammonia). For measuring HCl in
a wet gas stream the temperatures of the gas stream, sampling components, and the sample flow
rate are of primary importance. Analyte spiking with HCl is performed to demonstrate the
integrity of the sampling system for transporting HCl vapor in the flue gas to the FTIR
instrument. See section 9 of this method for a complete description of analyte spiking.
5.0 Safety
5.1 Hydrogen chloride vapor is corrosive and can cause irritation or severe damage to
respiratory system, eyes and skin. Exposure to this compound should be avoided.
5.2 This method may involve sampling at locations having high positive or negative pressures,
or high concentrations of hazardous or toxic pollutants, and can not address all safety problems
encountered under these diverse sampling conditions. It is the responsibility of the tester(s) to
ensure proper safety and health practices, and to determine the applicability of regulatory
limitations before performing this test method. Leak-check procedures are outlined in section 8.2
of Method 320 of this appendix.
6.0 Equipment and Supplies
NOTE: Mention of trade names or specific products does not constitute endorsement by the
Environmental Protection Agency.
Method 321 8/7/2017
5
6.1 FTIR Spectrometer and Detector. An FTIR Spectrometer system (interferometer, transfer
optics, gas cell and detector) having the capability of measuring HCl to the predetermined
minimum detectable level required (see section 4.1.3 of the FTIR Protocol). The system must
also include an accurate means to control and/or measure the temperature of the FTIR gas
analysis cell, and a personal computer with compatible software that provides real-time updates
of the spectral profile during sample and spectral collection.
6.2 Pump. Capable of evacuating the FTIR cell volume to 1 Torr (133.3 Pascals) within two
minutes (for batch sample analysis).
6.3 Mass Flow Meters/Controllers. To accurately measure analyte spike flow rate, having the
appropriate calibrated range and a stated accuracy of ±2 percent of the absolute measurement
value. This device must be calibrated with the major component of the calibration/spike gas (e.g.,
nitrogen) using an NIST traceable bubble meter or equivalent. Single point calibration checks
should be performed daily in the field. When spiking HCl, the mass flow meter/controller should
be thoroughly purged before and after introduction of the gas to prevent corrosion of the interior
parts.
6.4 Polytetrafluoroethane tubing. Diameter and length suitable to connect cylinder regulators.
6.5 Stainless Steel tubing. Type 316 of appropriate length and diameter for heated connections.
6.6 Gas Regulators. Purgeable HCl regulator.
6.7 Pressure Gauge. Capable of measuring pressure from 0 to 1000 Torr (133.3 Pa=1 Torr)
within ±5 percent.
6.8 Sampling Probe. Glass, stainless steel or other appropriate material of sufficient length and
physical integrity to sustain heating, prevent adsorption of analytes and capable of reaching gas
sampling point.
6.9 Sampling Line. Heated 180 °C (360 °F) and fabricated of either stainless steel,
polytetrafluoroethane or other material that prevents adsorption of HCl and transports effluent to
analytical instrumentation. The extractive sample line must have the capability to transport
sample gas to the analytical components as well as direct heated calibration spike gas to the
calibration assembly located at the sample probe. It is important to minimize the length of heated
sample line.
6.10 Particulate Filters. A sintered stainless steel filter rated at 20 microns or greater may be
placed at the inlet of the probe (for removal of large particulate matter). A heated filter (Balston
or equivalent) rated at 1 micron is necessary for primary particulate matter removal, and shall be
placed immediately after the heated probe. The filter/filter holder temperature should be
maintained at 180 °C (360 °F).
Method 321 8/7/2017
6
6.11 Calibration/Analyte Spike Assembly. A heated three-way valve assembly (or equivalent) to
introduce surrogate spikes into the sampling system at the outlet of the probe before the primary
particulate filter.
6.12 Sample Extraction Pump. A leak-free heated head pump (KNF Neuberger or equivalent)
capable of extracting sample effluent through entire sampling system at a rate which prevents
analyte losses and minimizes analyzer response time. The pump should have a heated by-pass
and may be placed either before the FTIR instrument or after. If the sample pump is located
upstream of the FTIR instrument, it must be fabricated from materials non-reactive to HCl. The
sampling system and FTIR measurement system shall allow the operator to obtain at least six
sample spectra during a one-hour period.
6.13 Barometer. For measurement of barometric pressure.
6.14 Gas Sample Manifold. A distribution manifold having the capabilities listed in sections
6.14.1 through 6.14.4;
6.14.1 Delivery of calibration gas directly to the analytical instrumentation;
6.14.2 Delivery of calibration gas to the sample probe (system calibration or analyte spike) via
a heated traced sample line;
6.14.3 Delivery of sample gas (kiln gas, spiked kiln gas, or system calibrations) to the analytical
instrumentation;
6.14.4 Delivery (optional) of a humidified nitrogen sample stream.
6.15 Flow Measurement Device. Type S Pitot tube (or equivalent) and Magnahelic set for
measurement of volumetric flow rate.
7.0 Reagents and Standards
HCl can be purchased in a standard compressed gas cylinder. The most stable HCl cylinder
mixture available has a concentration certified at ±5 percent. Such a cylinder is suitable for
performing analyte spiking because it will provide reproducible samples. The stability of the
cylinder can be monitored over time by periodically performing direct FTIR analysis of cylinder
samples. It is recommended that a 10-50 ppm cylinder of HCl be prepared having from 2-5 ppm
SF6 as a tracer compound. (See sections 7.1 through 7.3 of Method 320 of this appendix for a
complete description of the use of existing HCl reference spectra. See section 9.1 of Method 320
of this appendix for a complete discussion of standard concentration selection.)
8.0 Sample Collection, Preservation and Storage
See also Method 320 of this appendix.
Method 321 8/7/2017
7
8.1 Pretest. A screening test is ideal for obtaining proper data that can be used for preparing
analytical program files. Information from literature surveys and source personnel is also
acceptable. Information about the sampling location and gas stream composition is required to
determine the optimum sampling system configuration for measuring HCl. Determine the
percent moisture of the kiln gas by Method 4 of appendix A to part 60 of this chapter or by
performing a wet bulb/dry bulb measurement. Perform a preliminary traverse of the sample duct
or stack and select the sampling point(s). Acquire an initial spectrum and determine the optimum
operational pathlength of the instrument.
8.2 Leak-Check. See Method 320 of this appendix, section 8.2 for direction on performing leak-
checks.
8.3 Background Spectrum. See Method 320 of this appendix, section 8.5 for direction in
background spectral acquisition.
8.4 Pre-Test Calibration Transfer Standard (Direct Instrument Calibration). See Method 320
of this appendix, section 8.3 for direction in CTS spectral acquisition.
8.5 Pre-Test System Calibration. See Method 320 of this appendix, sections 8.6.1 through 8.6.2
for direction in performing system calibration.
8.6 Sampling
8.6.1 Extractive System. An extractive system maintained at 180 °C (360 °F) or higher which is
capable of directing a total flow of at least 12 L/min to the sample cell is required (References 1
and 2). Insert the probe into the duct or stack at a point representing the average volumetric flow
rate and 25 percent of the cross sectional area. Co-locate an appropriate flow monitoring device
with the sample probe so that the flow rate is recorded at specified time intervals during emission
testing (e.g., differential pressure measurements taken every 10 minutes during each run).
8.6.2 Batch Samples. Evacuate the absorbance cell to 5 Torr (or less) absolute pressure before
taking first sample. Fill the cell with kiln gas to ambient pressure and record the infrared
spectrum, then evacuate the cell until there is no further evidence of infrared absorption. Repeat
this procedure, collecting a total of six separate sample spectra within a 1-hour period.
8.6.3 Continuous Flow Through Sampling. Purge the FTIR cell with kiln gas for a time period
sufficient to equilibrate the entire sampling system and FTIR gas cell. The time required is a
function of the mechanical response time of the system (determined by performing the system
calibration with the CTS gas or equivalent), and by the chemical reactivity of the target analytes.
If the effluent target analyte concentration is not variable, observation of the spectral up-date of
the flowing gas sample should be performed until equilibration of the sample is achieved. Isolate
the gas cell from the sample flow by directing the purge flow to vent. Record the spectrum and
pressure of the sample gas. After spectral acquisition, allow the sample gas to purge the cell with
at least three volumes of kiln gas. The time required to adequately purge the cell with the
required volume of gas is a function of (1) cell volume, (2) flow rate through the cell, and (3) cell
Method 321 8/7/2017
8
design. It is important that the gas introduction and vent for the FTIR cell provides a complete
purge through the cell.
8.6.4 Continuous Sampling. In some cases it is possible to collect spectra continuously while
the FTIR cell is purged with sample gas. The sample integration time, tss, the sample flow rate
through the gas cell, and the sample integration time must be chosen so that the collected data
consist of at least 10 spectra with each spectrum being of a separate cell volume of flue gas.
Sampling in this manner may only be performed if the native source analyte concentrations do
not affect the test results.
8.7 Sample Conditioning
8.7.1 High Moisture Sampling. Kiln gas emitted from wet process cement kilns may contain 3-
to 40 percent moisture. Zinc selenide windows or the equivalent should be used when attempting
to analyze hot/wet kiln gas under these conditions to prevent dissolution of water soluble
window materials (e.g., KBr).
8.7.2 Sample Dilution. The sample may be diluted using an in-stack dilution probe, or an
external dilution device provided that the sample is not diluted below the instrument's
quantification range. As an alternative to using a dilution probe, nitrogen may be dynamically
spiked into the effluent stream in the same manner as analyte spiking. A constant dilution rate
shall be maintained throughout the measurement process. It is critical to measure and verify the
exact dilution ratio when using a dilution probe or the nitrogen spiking approach. Calibrating the
system with a calibration gas containing an appropriate tracer compound will allow
determination of the dilution ratio for most measurement systems. The tester shall specify the
procedures used to determine the dilution ratio, and include these calibration results in the report.
8.8 Sampling QA, Data Storage and Reporting. See the FTIR Protocol. Sample integration
times shall be sufficient to achieve the required signal-to-noise ratio, and all sample spectra
should have unique file names. Two copies of sample interferograms and processed spectra will
be stored on separate computer media. For each sample spectrum the analyst must document the
sampling conditions, the sampling time (while the cell was being filled), the time the spectrum
was recorded, the instrumental conditions (path length, temperature, pressure, resolution,
integration time), and the spectral file name. A hard copy of these data must be maintained until
the test results are accepted.
8.9 Signal Transmittance. Monitor the signal transmittance through the instrumental system. If
signal transmittance (relative to the background) drops below 95 percent in any spectral region
where the sample does not absorb infrared energy, then a new background spectrum must be
obtained.
8.10 Post-test CTS. After the sampling run completion, record the CTS spectrum. Analysis of
the spectral band area used for quantification from pre- and post-test CTS spectra should agree to
within ±5 percent or corrective action must be taken.
Method 321 8/7/2017
9
8.11 Post-test QA. The sample spectra shall be inspected immediately after the run to verify that
the gas matrix composition was close to the assumed gas matrix, (this is necessary to account for
the concentrations of the interferants for use in the analytical analysis programs), and to confirm
that the sampling and instrumental parameters were appropriate for the conditions encountered.
9.0 Quality Control
Use analyte spiking to verify the effectiveness of the sampling system for the target compounds
in the actual kiln gas matrix. QA spiking shall be performed before and after each sample run.
QA spiking shall be performed after the pre- and post-test CTS direct and system calibrations.
The system biases calculated from the pre- and post-test dynamic analyte spiking shall be within
±30 percent for the spiked surrogate analytes for the measurements to be considered valid. See
sections 9.3.1 through 9.3.2 for the requisite calculations. Measurement of the undiluted spike
(direct-to-cell measurement) involves sending dry, spike gas to the FTIR cell, filling the cell to 1
atmosphere and obtaining the spectrum of this sample. The direct-to-cell measurement should be
performed before each analyte spike so that the recovery of the dynamically spiked analytes may
be calculated. Analyte spiking is only effective for assessing the integrity of the sampling system
when the concentration of HCl in the source does not vary substantially. Any attempt to quantify
an analyte recovery in a variable concentration matrix will result in errors in the expected
concentration of the spiked sample. If the kiln gas target analyte concentrations vary by more
than ±5 percent (or 5 ppm, whichever is greater) in the time required to acquire a sample
spectrum, it may be necessary to: (1) Use a dual sample probe approach, (2) use two independent
FTIR measurement systems, (3) use alternate QA/QC procedures, or (4) postpone testing until
stable emission concentrations are achieved. (See section 9.2.3 of this method). It is
recommended that a laboratory evaluation be performed before attempting to employ this
method under actual field conditions. The laboratory evaluation shall include (1) performance of
all applicable calculations in section 4 of the FTIR Protocol; (2) simulated analyte spiking
experiments in dry (ambient) and humidified sample matrices using HCl; and (3) performance of
bias (recovery) calculations from analyte spiking experiments. It is not necessary to perform a
laboratory evaluation before every field test. The purpose of the laboratory study is to
demonstrate that the actual instrument and sampling system configuration used in field testing
meets the requirements set forth in this method.
9.1 Spike Materials. Perform analyte spiking with an HCl standard to demonstrate the integrity
of the sampling system.
9.1.1 An HCl standard of approximately 50 ppm in a balance of ultra pure nitrogen is
recommended. The SF6 (tracer) concentration shall be 2 to 5 ppm depending upon the
measurement pathlength. The spike ratio (spike flow/total flow) shall be no greater than 1:10,
and an ideal spike concentration should approximate the native effluent concentration.
9.1.2 The ideal spike concentration may not be achieved because the target concentration
cannot be accurately predicted prior to the field test, and limited calibration standards will be
available during testing. Therefore, practical constraints must be applied that allow the tester to
spike at an anticipated concentration. For these tests, the analyte concentration contributed by the
Method 321 8/7/2017
10
HCl standard spike should be 1 to 5 ppm or should more closely approximate the native
concentration if it is greater.
9.2 Spike Procedure
9.2.1 A spiking/sampling apparatus is shown in Figure 2. Introduce the spike/tracer gas mixture
at a constant flow (±2 percent) rate at approximately 10 percent of the total sample flow. (For
example, introduce the surrogate spike at 1 L/min 20 cc/min, into a total sample flow rate of 10
L/min). The spike must be pre-heated before introduction into the sample matrix to prevent a
localized condensation of the gas stream at the spike introduction point. A heated sample
transport line(s) containing multiple transport tubes within the heated bundle may be used to
spike gas up through the sampling system to the spike introduction point. Use a calibrated flow
device (e.g., mass flow meter/controller), to monitor the spike flow as indicated by a calibrated
flow meter or controller, or alternately, the SF6 tracer ratio may be calculated from the direct
measurement and the diluted measurement. It is often desirable to use the tracer approach in
calculating the spike/total flow ratio because of the difficulty in accurately measuring hot/wet
total flow. The tracer technique has been successfully used in past validation efforts (Reference
1).
9.2.2 Perform a direct-to-cell measurement of the dry, undiluted spike gas. Introduce the spike
directly to the FTIR cell, bypassing the sampling system. Fill cell to 1 atmosphere and collect the
spectrum of this sample. Ensure that the spike gas has equilibrated to the temperature of the
measurement cell before acquisition of the spectra. Inspect the spectrum and verify that the gas is
dry and contains negligible CO2. Repeat the process to obtain a second direct-to-cell
measurement. Analysis of spectral band areas for HCl from these duplicate measurements should
agree to within ±5 percent of the mean.
9.2.3 Analyte Spiking. Determine whether the kiln gas contains native concentrations of HCl by
examination of preliminary spectra. Determine whether the concentration varies significantly
with time by observing a continuously up-dated spectrum of sample gas in the flow-through
sampling mode. If the concentration varies by more than ±5 percent during the period of time
required to acquire a spectra, then an alternate approach should be used. One alternate approach
uses two sampling lines to convey sample to the gas distribution manifold. One of the sample
lines is used to continuously extract unspiked kiln gas from the source. The other sample line
serves as the analyte spike line. One FTIR system can be used in this arrangement. Spiked or
unspiked sample gas may be directed to the FTIR system from the gas distribution manifold,
with the need to purge only the components between the manifold and the FTIR system. This
approach minimizes the time required to acquire an equilibrated sample of spiked or unspiked
kiln gas. If the source varies by more than ±5 percent (or 5 ppm, whichever is greater) in the time
it takes to switch from the unspiked sample line to the spiked sample line, then analyte spiking
may not be a feasible means to determine the effectiveness of the sampling system for the HCl in
the sample matrix. A second alternative is to use two completely independent FTIR measurement
systems. One system would measure unspiked samples while the other system would measure
the spiked samples. As a last option, (where no other alternatives can be used) a humidified
nitrogen stream may be generated in the field which approximates the moisture content of the
Method 321 8/7/2017
11
kiln gas. Analyte spiking into this humidified stream can be employed to assure that the sampling
system is adequate for transporting the HCl to the FTIR instrumentation.
9.2.3.1 Adjust the spike flow rate to approximately 10 percent of the total flow by metering
spike gas through a calibrated mass flowmeter or controller. Allow spike flow to equilibrate
within the sampling system before analyzing the first spiked kiln gas samples. A minimum of
two consecutive spikes are required. Analysis of the spectral band area used for quantification
should agree to within ±5 percent or corrective action must be taken.
9.2.3.2 After QA spiking is completed, the sampling system components shall be purged with
nitrogen or dry air to eliminate traces of the HCl compound from the sampling system
components. Acquire a sample spectra of the nitrogen purge to verify the absence of the
calibration mixture.
9.2.3.3 Analyte spiking procedures must be carefully executed to ensure that meaningful
measurements are achieved. The requirements of sections 9.2.3.3.1 through 9.2.3.3.4 shall be
met.
9.2.3.3.1 The spike must be in the vapor phase, dry, and heated to (or above) the kiln gas
temperature before it is introduced to the kiln gas stream.
9.2.3.3.2 The spike flow rate must be constant and accurately measured.
9.2.3.3.3 The total flow must also be measured continuously and reliably or the dilution ratio
must otherwise be verified before and after a run by introducing a spike of a non-reactive, stable
compound (i.e., tracer).
9.2.3.3.4 The tracer must be inert to the sampling system components, not contained in the
effluent gas, and readily detected by the analytical instrumentation. Sulfur hexafluoride (SF6) has
been used successfully (References 1 and 2) for this purpose.
9.3 Calculations
9.3.1 Recovery. Calculate the percent recovery of the spiked analytes using equations 1 and 2.
%𝑅 = 100 ×𝑆𝑚−𝑆𝑢(1−𝐷𝐹)
𝐷𝐹×𝐶𝑠 (1)
𝐶𝑒 = 𝐷𝐹 × 𝐶𝑠 + 𝑆𝑢(1 − 𝐷𝐹) (2)
Sm = Mean concentration of the analyte spiked effluent samples (observed).
Ce = Expected concentration of the spiked samples (theoretical).
Method 321 8/7/2017
12
DF = Dilution Factor (Total flow/Spike flow). Total flow = spike flow plus effluent flow.
Cs = cylinder concentration of spike gas.
Su = native concentration of analytes in unspiked samples.
The spike dilution factor may be confirmed by measuring the total flow and the spike flow
directly. Alternately, the spike dilution can be verified by comparing the concentration of the
tracer compound in the spiked samples (diluted) to the tracer concentration in the direct
(undiluted) measurement of the spike gas.
If SF6 is the tracer gas, then
𝐷𝑓 = [𝑆𝐹6]𝑠𝑝𝑖𝑘𝑒/[𝑆𝐹6]𝑑𝑖𝑟𝑒𝑐𝑡 (3)
[SF6]spike = the diluted SF6 concentration measured in a spiked sample.
[SF6]direct = the SF6 concentration measured directly.
9.3.2 Bias. The bias may be determined by the difference between the observed spike value and
the expected response (i.e., the equivalent concentration of the spiked material plus the analyte
concentration adjusted for spike dilution). Bias is defined by section 6.3.1 of EPA Method 301 of
this appendix (Reference 8) as,
𝐵 = 𝑆𝑚 − 𝐶𝑒 (4)
Where:
B = Bias at spike level.
Sm = Mean concentration of the analyte spiked samples.
Ce = Expected concentration of the analyte in spiked samples.
Acceptable recoveries for analyte spiking are ±30 percent. Application of correction factors to
the data based upon bias and recovery calculations is subject to the approval of the
Administrator.
10.0 Calibration and Standardization
10.1 Calibration transfer standards (CTS). The EPA Traceability Protocol gases or NIST
traceable standards, with a minimum accuracy of ±2 percent shall be used. For other
requirements of the CTS, see the FTIR Protocol section 4.5.
10.2 Signal-to-Noise Ratio (S/N). The S/N shall be less than the minimum acceptable
measurement uncertainty in the analytical regions to be used for measuring HCl.
10.3 Absorbance Pathlength. Verify the absorbance path length by comparing CTS spectra to
reference spectra of the calibration gas(es).
Method 321 8/7/2017
13
10.4 Instrument Resolution. Measure the line width of appropriate CTS band(s) to verify
instrumental resolution.
10.5 Apodization Function. Choose the appropriate apodization function. Determine any
appropriate mathematical transformations that are required to correct instrumental errors by
measuring the CTS. Any mathematical transformations must be documented and reproducible.
Reference 9 provides additional information about FTIR instrumentation.
11.0 Analytical Procedure
A full description of the analytical procedures is given in sections 4.6-4.11, sections 5, 6, and 7,
and the appendices of the FTIR Protocol. Additional description of quantitative spectral analysis
is provided in References 10 and 11.
12.0 Data Analysis and Calculations
Data analysis is performed using appropriate reference spectra whose concentrations can be
verified using CTS spectra. Various analytical programs (References 10 and 11) are available to
relate sample absorbance to a concentration standard. Calculated concentrations should be
verified by analyzing spectral baselines after mathematically subtracting scaled reference spectra
from the sample spectra. A full description of the data analysis and calculations may be found in
the FTIR Protocol (sections 4.0, 5.0, 6.0 and appendices).
12.1 Calculated concentrations in sample spectra are corrected for differences in absorption
pathlength between the reference and sample spectra by
𝐶𝑐𝑜𝑟𝑟 = (𝐿𝑟/𝐿𝑠) × (𝑇𝑟/𝑇𝑠) × (𝐶𝑐𝑎𝑙𝑐) (5)
Where:
Ccorr = The pathlength corrected concentration.
Ccalc = The initial calculated concentration (output of the multicomponent analysis program
designed for the compound).
Lr = The pathlength associated with the reference spectra.
Ls = The pathlength associated with the sample spectra.
Ts = The absolute temperature (K) of the sample gas.
Tr = The absolute temperature (K) at which reference spectra were recorded.
12.2 The temperature correction in equation 5 is a volumetric correction. It does not account for
temperature dependence of rotational-vibrational relative line intensities. Whenever possible, the
reference spectra used in the analysis should be collected at a temperature near the temperature
of the FTIR cell used in the test to minimize the calculated error in the measurement (FTIR
Protocol, appendix D). Additionally, the analytical region chosen for the analysis should be
Method 321 8/7/2017
14
sufficiently broad to minimize errors caused by small differences in relative line intensities
between reference spectra and the sample spectra.
13.0 Method Performance
A description of the method performance may be found in the FTIR Protocol. This method is self
validating provided the results meet the performance specification of the QA spike in sections
9.0 through 9.3 of this method.
14.0 Pollution Prevention
This is a gas phase measurement. Gas is extracted from the source, analyzed by the
instrumentation, and discharged through the instrument vent.
15.0 Waste Management
Gas standards of HCl are handled according to the instructions enclosed with the material safety
data sheet.
16.0 References
1. “Laboratory and Field Evaluation of a Methodology for Determination of Hydrogen Chloride
Emissions From Municipal and Hazardous Waste Incinerators,” S.C. Steinsberger and J.H.
Margeson. Prepared for U.S. Environmental Protection Agency, Research Triangle Park, NC.
NTIS Report No. PB89-220586. (1989).
2. “Evaluation of HCl Measurement Techniques at Municipal and Hazardous Waste
Incinerators,” S.A. Shanklin, S.C. Steinsberger, and L. Cone, Entropy, Inc. Prepared for U.S.
Environmental Protection Agency, Research Triangle Park, NC. NTIS Report No. PB90-221896.
(1989).
3. “Fourier Transform Infrared (FTIR) Method Validation at a Coal Fired-Boiler,” Entropy, Inc.
Prepared for U.S. Environmental Protection Agency, Research Triangle Park, NC. EPA