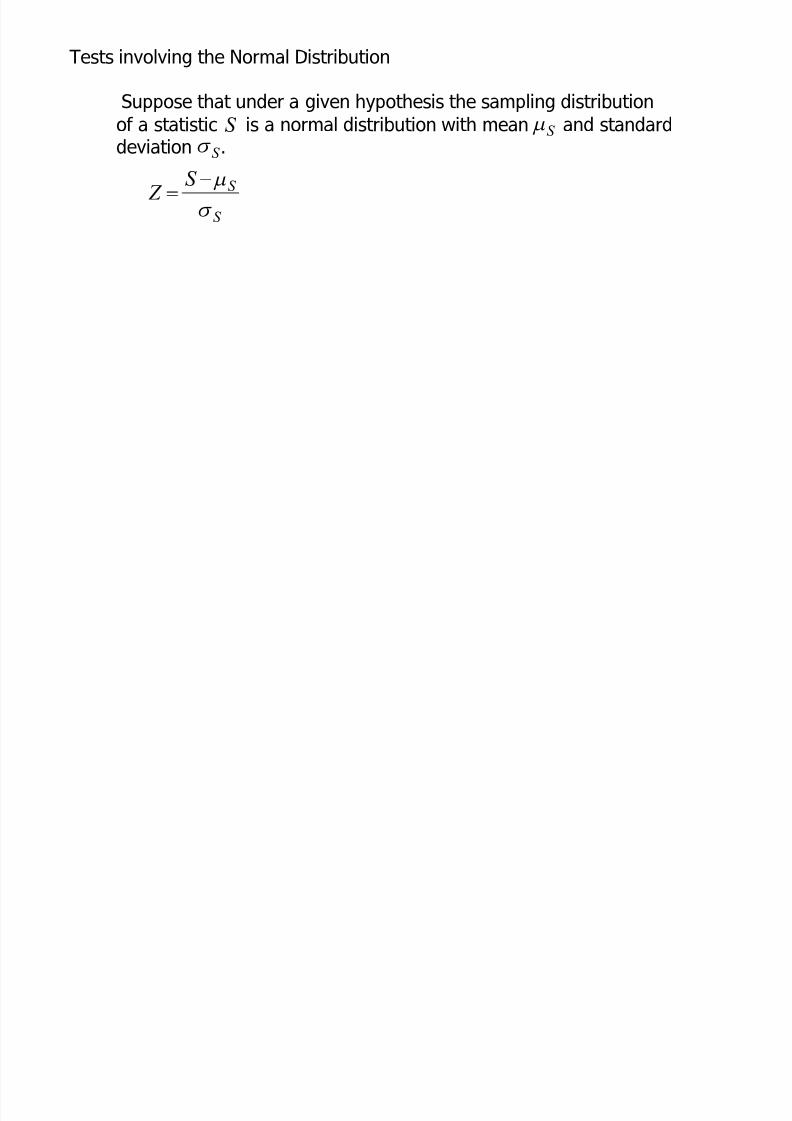
8/8/2019 Test of Hypotheses
http://slidepdf.com/reader/full/test-of-hypotheses 2/26
Statistical Hypothesis : (Null Hypothesis, Alternative hypothesis) Assumptions or guesses about the populations involved.
Ex.) If we want to decide whether a given coin is loaded, we formulate thehypothesis that the coin is fair.
Ex.) If we want to decide whether one procedure is better than another,
we formulate the hypothesis that there is no difference between theprocedures.
Ex.) Null Hypothesis (Hypothesis) : the coin is fair, there is no difference between the procedures.
Alternative Hypothesis : alternative to the null hypothesis
0H
1H
8/8/2019 Test of Hypotheses
http://slidepdf.com/reader/full/test-of-hypotheses 3/26
Tests of hypotheses and Significance :
If on the supposition that a particular hypothesis is true we find that results observed in a random sample differ markedly from thoseexpected under the hypothesis on the basis of pure chance usingsampling theory, we would say that the observed differences aresignificant and we would be inclined to reject the hypothesis.
Type I and Type II Errors :
If we reject a hypothesis when it happens to be true,
we say that a TYPE I error has been made.If we accept a hypothesis when it should be rejected,we say that a TYPE II error has been made.
8/8/2019 Test of Hypotheses
http://slidepdf.com/reader/full/test-of-hypotheses 4/26
Level of significance :In testing a given hypothesis, the maximum probabilitywith which we would be willing to risk a Type I error is calledthe level of significance of the test.
Ex.) If a 0.05 or 5% level of significance is chosen, in designing a test of ahypothesis, then there are about 5 chances in 100 that we would reject
the hypothesis when it should be accept, i.e. whenever the null hypothesisis true, we are about 95% confident that we would make the right decision.The hypothesis has been rejected at a 0.5 level of significance, which
means that we would be wrong with probability 0.05.
8/8/2019 Test of Hypotheses
http://slidepdf.com/reader/full/test-of-hypotheses 5/26
S
Tests involving the Normal Distribution
Suppose that under a given hypothesis the sampling distributionof a statistic is a normal distribution with mean and standarddeviation .
S Q
S W
S
S S
Z W
Q!
8/8/2019 Test of Hypotheses
http://slidepdf.com/reader/full/test-of-hypotheses 6/26
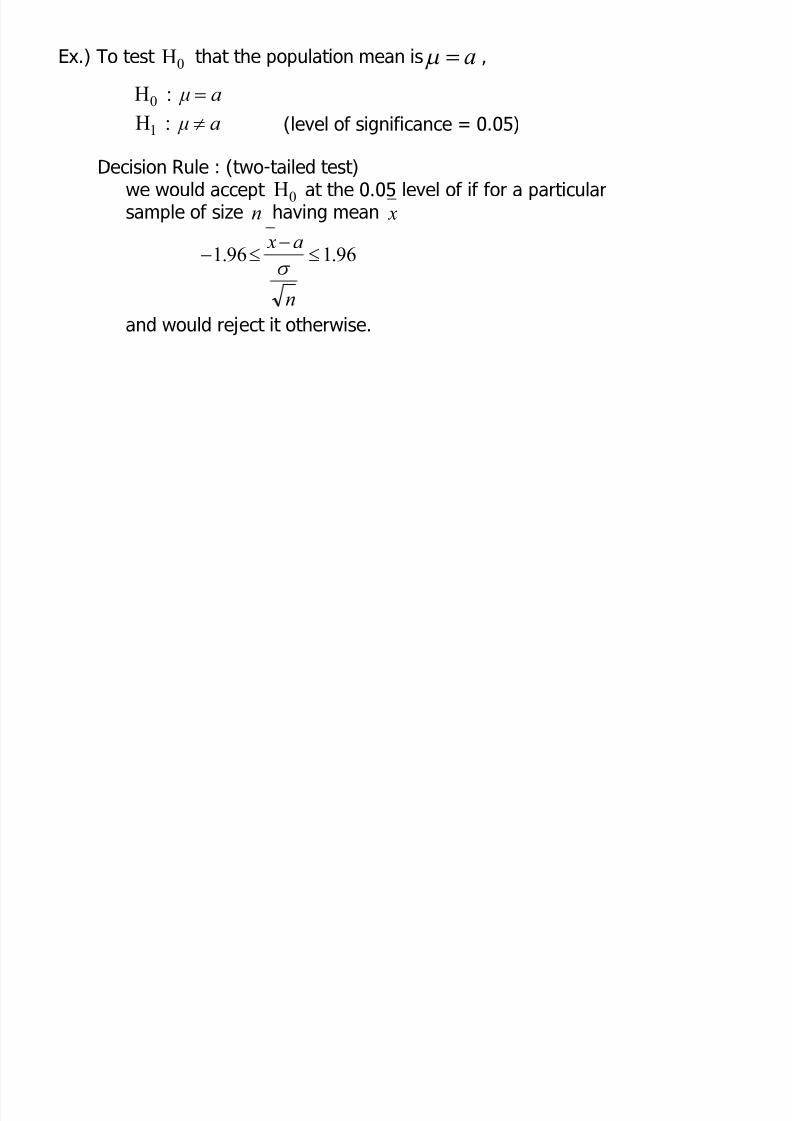
We can be 95% confident that, if the hypothesis is true, the Z scoreof an actual sampling statistic will lie between -1.96 and 1.96.
If on choosing a single sample at random we find that the Z score of its statistic lies outside the range -1.96 to 1.96, we would conclude that such an event could happen with the probability of 0.05 if the givenhypothesis were true.
We would say that this Z score differed significantly from what wouldbe expected under the hypothesis, and we would be inclined to reject the hypothesis.
The level of significance represents the probability of our being wrongin rejecting the hypothesis, i.e., the probability of making a Type I
error.
Hypothesis is rejected at 0.05 level of significance or that the Z scoreof the given statistic is significant at a 0.05 level of significance.
S
8/8/2019 Test of Hypotheses
http://slidepdf.com/reader/full/test-of-hypotheses 7/26
Two-tailed tests, one-tailed tests :
Decision Rule :
(a) Reject the hypothesis at a 0.05 level of significance if the Z score of thestatistic lies outside the range -1.96 to 1.96. Equivalently, theobserved sample statistic is significant at the 0.05 level.
(b) Otherwise, accept the hypothesis.
S
8/8/2019 Test of Hypotheses
http://slidepdf.com/reader/full/test-of-hypotheses 8/26
p-value : the probability that a value of in the direction(s) of if were true.
: Assertion that a population parameter has a specific value.
: The parameter is greater than the state value.
The parameter is less than the state value.
The parameter is either greater or less than the state value.
0H
1H
0H1HS
8/8/2019 Test of Hypotheses
http://slidepdf.com/reader/full/test-of-hypotheses 9/26
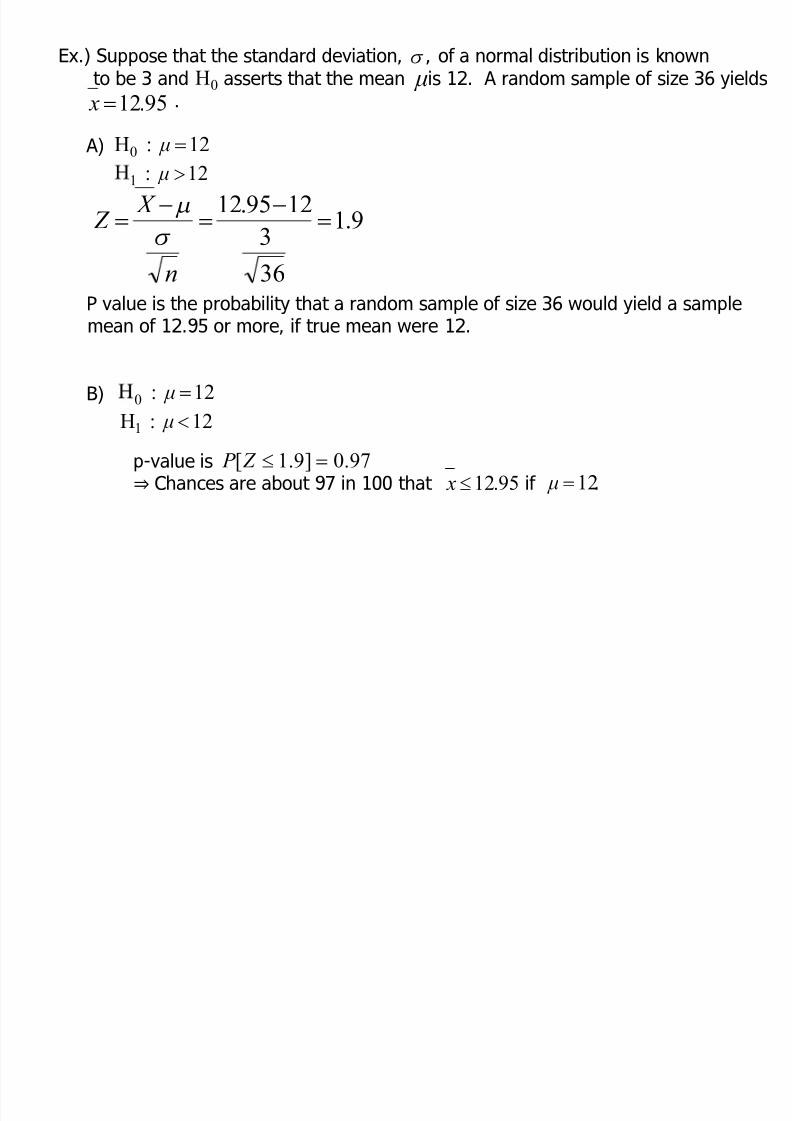
W Ex.) Suppose that the standard deviation, , of a normal distribution is knownto be 3 and asserts that the mean is 12. A random sample of size 36 yields
.
A)
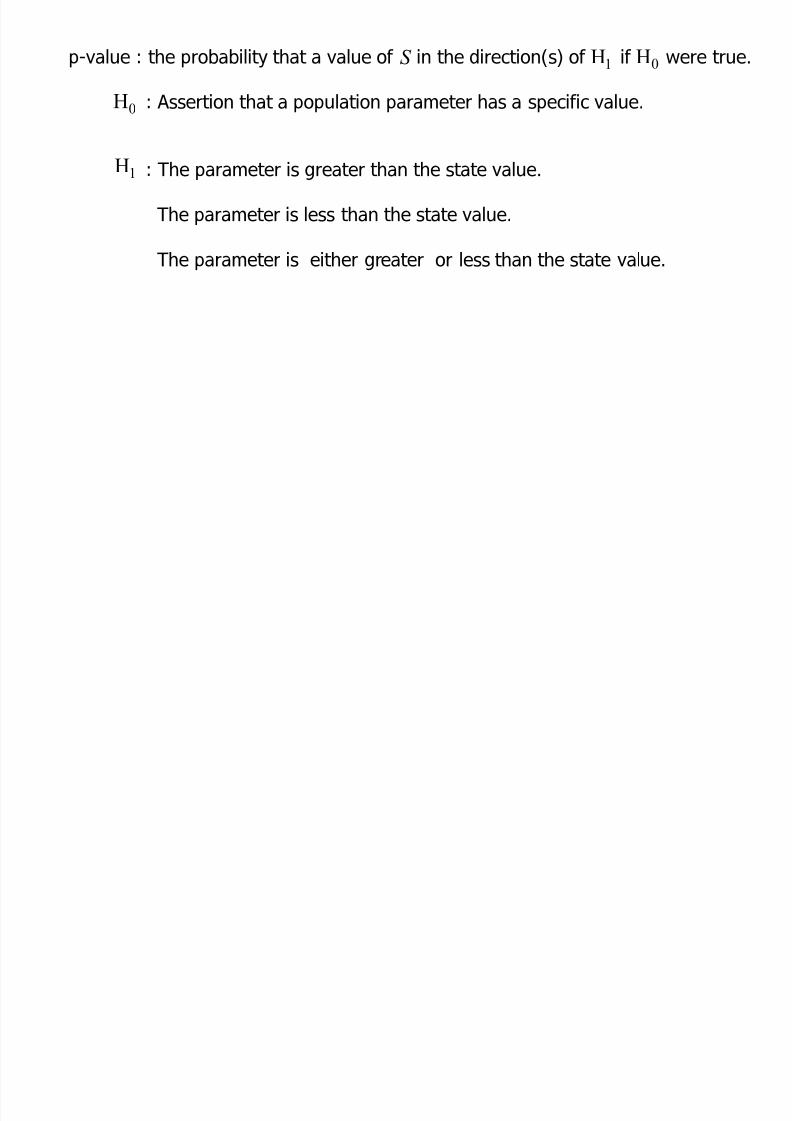
P value is the probability that a random sample of size 36 would yield a samplemean of 12.95 or more, if true mean were 12.
B)
p-value is Chances are about 97 in 100 that if .
12 : H0 !
12 : 1 "
9.1
36
3
1295.12!
!
!
n
X Z
W
Q
12 : 0 !
12 : H1
97.0]9.1[ !e Z P 95.12e x
95.12! x
12!
0H
8/8/2019 Test of Hypotheses
http://slidepdf.com/reader/full/test-of-hypotheses 10/26
C) 12 : H0 !
12 : H1 {
p-value is the probability that a random sample of size 36
would yield a sample mean 12.95 or more away from 12,if the true mean were 12.
8/8/2019 Test of Hypotheses
http://slidepdf.com/reader/full/test-of-hypotheses 11/26
Small p-value : Rejecting the null hypothesis in favor of the alternativehypothesis.
Large p-value : Not rejecting the null hypothesis in favor of the alternativehypothesis.
8/8/2019 Test of Hypotheses
http://slidepdf.com/reader/full/test-of-hypotheses 12/26
1. Means X S !
Q Q Q !! X S
n X S
W W W !!
n
X Z W
Q!
1
!
N
n N
n
X
Z W
Q
: Infinite population ORfor sampling with replacement
: Sampling without replacement from finite population
Special tests of Significance for the Large samples- Many statistics have nearly normal distribution with and .S
QS
W S
8/8/2019 Test of Hypotheses
http://slidepdf.com/reader/full/test-of-hypotheses 13/26
Ex.) To test that the population mean is ,
(level of significance = 0.05)
a ! : H0
a { : H1
0H a! Q
Decision Rule : (two-tailed test)we would accept at the 0.05 level of if for a particularsample of size having mean
and would reject it otherwise.
0Hn x
96.196.1 e
e
n
a x
W
8/8/2019 Test of Hypotheses
http://slidepdf.com/reader/full/test-of-hypotheses 14/26
Ex.)(level of significance = 0.05)
a ! : 0
a " : H1
Decision Rule : (One-tailed test)we would accept at the 0.05 level
if and reject it otherwise.
0H
645.1
n
a x
W
Ex.) a ! : H0
a : H1
Decision Ruleaccept at the 0.05 level
if . Otherwise reject it.
0H
645.1"
n
a x
W
8/8/2019 Test of Hypotheses
http://slidepdf.com/reader/full/test-of-hypotheses 15/26
2. Proportion
P S !
p P S !! Q Q
n
pq P S
!! W W
n
pq
p P Z
!
n pq
n P X Z
!
In case ( : actual number of successes in a sample)
: the proportion of successes in a sample.
n
X P ! X
8/8/2019 Test of Hypotheses
http://slidepdf.com/reader/full/test-of-hypotheses 16/26
21 Q Q !
3. Difference of Means
: sample mean obtained in large samples of size drawn
from population having , .
1 X 1n
1 Q 1W
: sample mean obtained in large samples of size drawnfrom population having , .
2 X 2n
2 Q 2W
0 : 21
0 ! X X
There is no difference between the population mean ( ).Sampling distribution of difference in means is
approximately normal with , and
.
021
! X X
2
22
1
21
21 nn X X
W W W !
2121
2121 0
X X X X
X X X X Z
!
!
W W
8/8/2019 Test of Hypotheses
http://slidepdf.com/reader/full/test-of-hypotheses 17/26
p
4. Difference of Proportions
: sample proportion obtained in large samples of size
drawn from population having proportion .
1 P 1n
1 p
: sample proportion obtained in large samples of sizedrawn from population having proportion .
2 P 2n
2 p
Sampling distribution of differences in proportion
is approximately normal with,
where is used as an estimate of population
proportion .
021
! P P 21
21 n
pq
n
pq P P !W
21
2211
nn
P n P n P
!
2121
2121 0
P P P P
P P P P Z
!
!
W W
8/8/2019 Test of Hypotheses
http://slidepdf.com/reader/full/test-of-hypotheses 18/26
Special tests of Significance for the Small samples( )30n
n
)1
Ö( S
n
nS
!3
1. Means X
nS
X n
S
X T
Ö1
Q Q !
!
: mean of a sample of size
T ~ Students distributiont
21
21
11
nn
X X T
!
W
2. Difference of Means
where
( & are sample standard deviation.)
221
222
211
!
nn
S nS nW
1S 2S
degree of freedom 221 ! nnv
8/8/2019 Test of Hypotheses
http://slidepdf.com/reader/full/test-of-hypotheses 19/26
Ex1) Find the probability of getting between 40 and 60 heads inclusive
in 100 tosses of a fair coin.
8/8/2019 Test of Hypotheses
http://slidepdf.com/reader/full/test-of-hypotheses 20/26
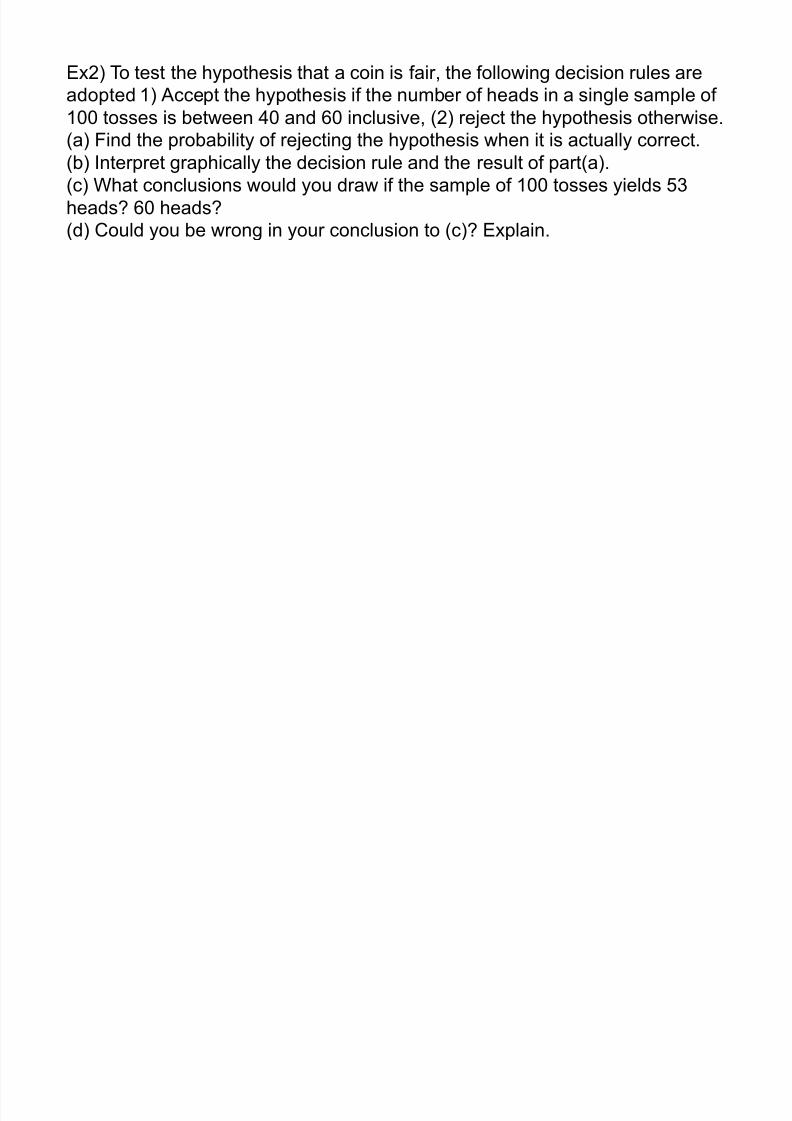
Ex2) To test the hypothesis that a coin is fair, the following decision rules are
adopted 1) Accept the hypothesis if the number of heads in a single sample of
100 tosses is between 40 and 60 inclusive, (2) reject the hypothesis otherwise.
(a) Find the probability of rejecting the hypothesis when it is actually correct.(b) Interpret graphically the decision rule and the result of part(a).
(c) What conclusions would you draw if the sample of 100 tosses yields 53
heads? 60 heads?
(d) Could you be wrong in your conclusion to (c)? Explain.
8/8/2019 Test of Hypotheses
http://slidepdf.com/reader/full/test-of-hypotheses 21/26
Ex3) Design a decision rule to test the hypothesis that a coin is fair if a
sample of 64 tosses of the coin is taken and if a level of significance of
(a) 0.05, (b) 0.01 is used.
8/8/2019 Test of Hypotheses
http://slidepdf.com/reader/full/test-of-hypotheses 22/26
Ex4) In an experiment on extrasensory perception(ESP) a subject in one room is
asked to state the color(red or blue) of a card chosen from a deck of 50 well-
shuffled cards by an individual in another room. It is unknown to the subject how
many red or blue cards are in the deck. If the subject identifies 32 cards correctly,
determine whether the results are significant at the (a) 0.05, (b) 0.01 level of significance. (c) Find and interpret the P value of the
8/8/2019 Test of Hypotheses
http://slidepdf.com/reader/full/test-of-hypotheses 23/26
Ex5) The manufacturer of a patent medicine claimed that it was 90% effective in
relieving an allergy for a period of 8 hours. In a sample of 200 people who had
the allergy, the medicine provided relief for 160 people.
(a) Determine whether the manufacturer¶s claim is legitimate by using 0.01 as
the level of significance.(b) Find the P value of the test.
8/8/2019 Test of Hypotheses
http://slidepdf.com/reader/full/test-of-hypotheses 24/26
Ex6) The mean lifetime of a sample of 100 fluorescent light bulbs produced
by a company is computed to be 1570 hours and the standard deviation of all
the bulbs produced by a company is 120 hours. If is the mean lifetime of all the
bulbs produced by the company, test the hypothesis hours against the
alternative hypothesis hours, using a level of significance of (a) 0.05
and (b) 0.01. (c) Find the P value of the test.
Q1600! Q
1600{ Q
8/8/2019 Test of Hypotheses
http://slidepdf.com/reader/full/test-of-hypotheses 25/26
Ex7) In Ex.6) test the hypothesis hours against the alternative
hypothesis hours, using a level of significance of (a) 0.05, (b)
0.01. (c) Find the P value of the test.
1600! Q1600£ Q
8/8/2019 Test of Hypotheses
http://slidepdf.com/reader/full/test-of-hypotheses 26/26
Ex8) The breaking strengths of cables produced by a manufacturer have mean
1800 lb and standard deviation 100lb. By a new technique in the manufacturing
process it is claimed that the breaking strength can be increased. To test this
claim, a sample of 50 cables is tested, and it is found that the mean breaking
strength is 18500 lb.(a) Can we support the claim at a 0.01 level of significance?
(b) What is the P value of the test.