46th International Conference on Environmental Systems ICES-2016-183 10-14 July 2016, Vienna, Austria Testing of synthetic biological membranes for forward osmosis applications Jurek Parodi 1 , Jaione Romero Mangado 2 , and Ofir Stefanson 3 Science and Technology Corporation, 21 Enterprise Parkway, Hampton, VA 23666 Michael Flynn 4 NASA Ames Research Center, Moffett Field, CA 94035 Rocco Mancinelli 5 , Brian Kawashima 6 Bay Area Environmental Research Institute, NASA Ames Research Center, Moffett Field,CA 94035 Serena Trieu 7 Logyx LLC, 425 N Whisman Rd # 400, Mountain View, CA 94043 and Adrian Brozell 8 , Kevan Rosenberg 9 zNano, 2381 Zanker Rd. 130, San Jose,CA 95135 Commercially available forward osmosis membranes have been extensively tested for human space flight wastewater treatment. Despite the improvements achieved in the last decades, there is still a challenge to produce reliable membranes with anti-fouling properties, chemical resistance, and high flux and selectivity. Synthetic biological membranes that mimic the ones present in nature, which underwent millions of years of evolution, represent a potential solution for further development and progress in membrane technology. Biomimetic forward osmosis membranes based on a polymeric support filter and coated with surfactant multilayers have been engineered to investigate how different manufacturing processes impact the performance and structure of the membrane. However, initial results of the first generation prototype membranes tests reveal a high scatter in the data, due to the current testing apparatus set up. The testing apparatus has been upgraded to improve data collection, reduce errors, and to allow higher control of the testing process. Nomenclature ARC = Ames Research Center CAD = computer aided design CFD = computational fluid dynamics FO = forward osmosis GPM = gallons per minute LPM = liters per minute 1 Engineer, NASA Ames Research Center, Moffett Field, CA 94035. 2 Scientist, NASA Ames Research Center, Moffett Field, CA 94035. 3 Scientist, NASA Ames Research Center, Moffett Field, CA 94035. 4 Engineer, NASA Ames Research Center, Moffett Field, CA 94035. 5 Scientist, NASA Ames Research Center, Moffett Field, CA 94035. 6 Engineer, NASA Ames Research Center, Moffett Field, CA 94035. 7 Engineer, NASA Ames Research Center, Moffett Field, CA 94035. 8 Engineer, zNano, 2381 Zanker Rd, San Jose, CA 95131. 9 Engineer, zNano, 2381 Zanker Rd, San Jose, CA 95131. https://ntrs.nasa.gov/search.jsp?R=20160007441 2018-08-25T16:59:41+00:00Z
Transcript
46th International Conference on Environmental Systems ICES-2016-183 10-14 July 2016, Vienna, Austria
Testing of synthetic biological membranes for forward
osmosis applications
Jurek Parodi1, Jaione Romero Mangado2, and Ofir Stefanson3
Science and Technology Corporation, 21 Enterprise Parkway, Hampton, VA 23666
Michael Flynn4
NASA Ames Research Center, Moffett Field, CA 94035
Rocco Mancinelli5, Brian Kawashima6
Bay Area Environmental Research Institute, NASA Ames Research Center, Moffett Field,CA 94035
Serena Trieu7
Logyx LLC, 425 N Whisman Rd # 400, Mountain View, CA 94043
and
Adrian Brozell8, Kevan Rosenberg9
zNano, 2381 Zanker Rd. 130, San Jose,CA 95135
Commercially available forward osmosis membranes have been extensively tested for
human space flight wastewater treatment. Despite the improvements achieved in the last
decades, there is still a challenge to produce reliable membranes with anti-fouling properties,
chemical resistance, and high flux and selectivity. Synthetic biological membranes that mimic
the ones present in nature, which underwent millions of years of evolution, represent a
potential solution for further development and progress in membrane technology. Biomimetic
forward osmosis membranes based on a polymeric support filter and coated with surfactant
multilayers have been engineered to investigate how different manufacturing processes impact
the performance and structure of the membrane. However, initial results of the first
generation prototype membranes tests reveal a high scatter in the data, due to the current
testing apparatus set up. The testing apparatus has been upgraded to improve data collection,
reduce errors, and to allow higher control of the testing process.
Nomenclature
ARC = Ames Research Center
CAD = computer aided design
CFD = computational fluid dynamics
FO = forward osmosis
GPM = gallons per minute
LPM = liters per minute
1 Engineer, NASA Ames Research Center, Moffett Field, CA 94035. 2 Scientist, NASA Ames Research Center, Moffett Field, CA 94035. 3 Scientist, NASA Ames Research Center, Moffett Field, CA 94035. 4 Engineer, NASA Ames Research Center, Moffett Field, CA 94035. 5 Scientist, NASA Ames Research Center, Moffett Field, CA 94035. 6 Engineer, NASA Ames Research Center, Moffett Field, CA 94035. 7 Engineer, NASA Ames Research Center, Moffett Field, CA 94035. 8 Engineer, zNano, 2381 Zanker Rd, San Jose, CA 95131. 9 Engineer, zNano, 2381 Zanker Rd, San Jose, CA 95131.
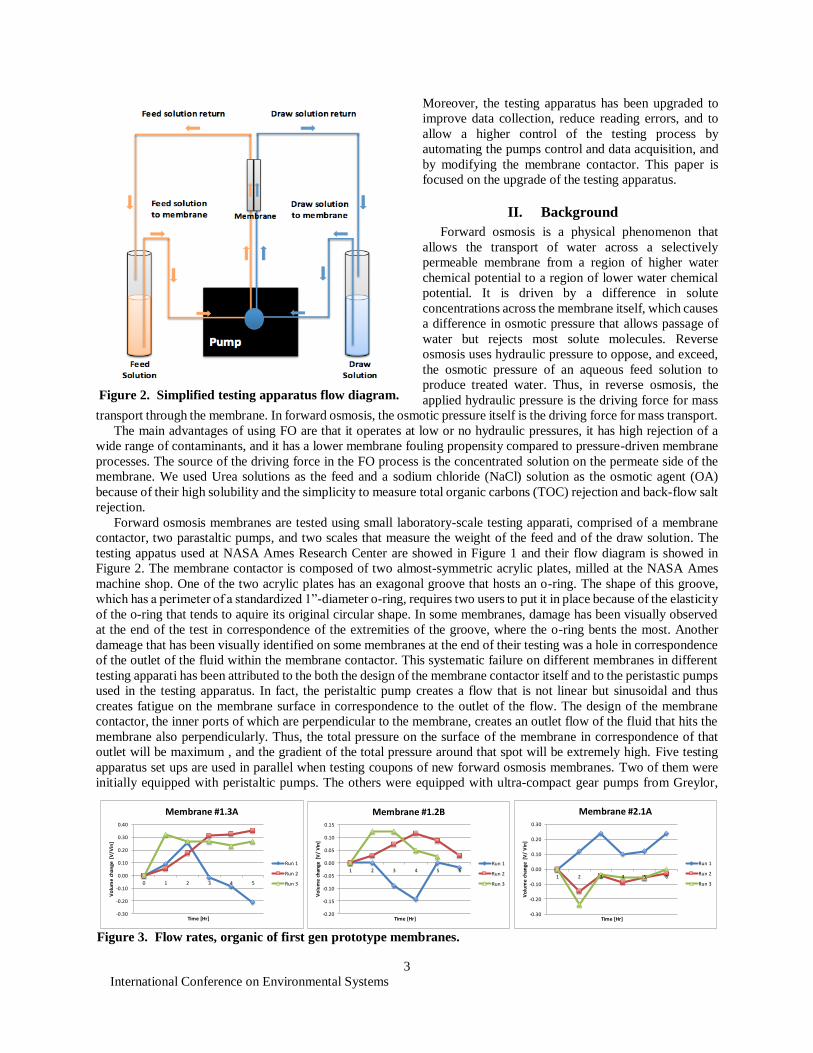
Figure 3. Flow rates, organic of first gen prototype membranes.
-0.30
-0.20
-0.10
0.00
0.10
0.20
0.30
0.40
0 1 2 3 4 5
Vo
lum
e c
han
ge [
V/V
in]
Time [Hr]
Membrane #1.3A
Run 1
Run 2
Run 3
-0.20
-0.15
-0.10
-0.05
0.00
0.05
0.10
0.15
1 2 3 4 5 6
Vo
lum
e c
han
ge [
V/
Vin
]
Time [Hr]
Membrane #1.2B
Run 1
Run 2
Run 3
-0.30
-0.20
-0.10
0.00
0.10
0.20
0.30
1 2 3 4 5 6
Vo
lum
e c
han
ge [
V/
Vin
]
Time [Hr]
Membrane #2.1A
Run 1
Run 2
Run 3
International Conference on Environmental Systems
4
which are rated for a maximum flow rate of 0.38 gallons per minute (GPM) and a maximum pressure of 25 PSI. The
membranes tested in the apparati having the gear pumps did not show the failure mode previously described. However,
the Greylor gear pumps showed very different flow rates from one unit to the other when operated at the same voltage
and amperage. Their performance also varied in function of time, affecting the results of the experiments. The scatter
of the flow rates during the run is summarized in Figure 3.
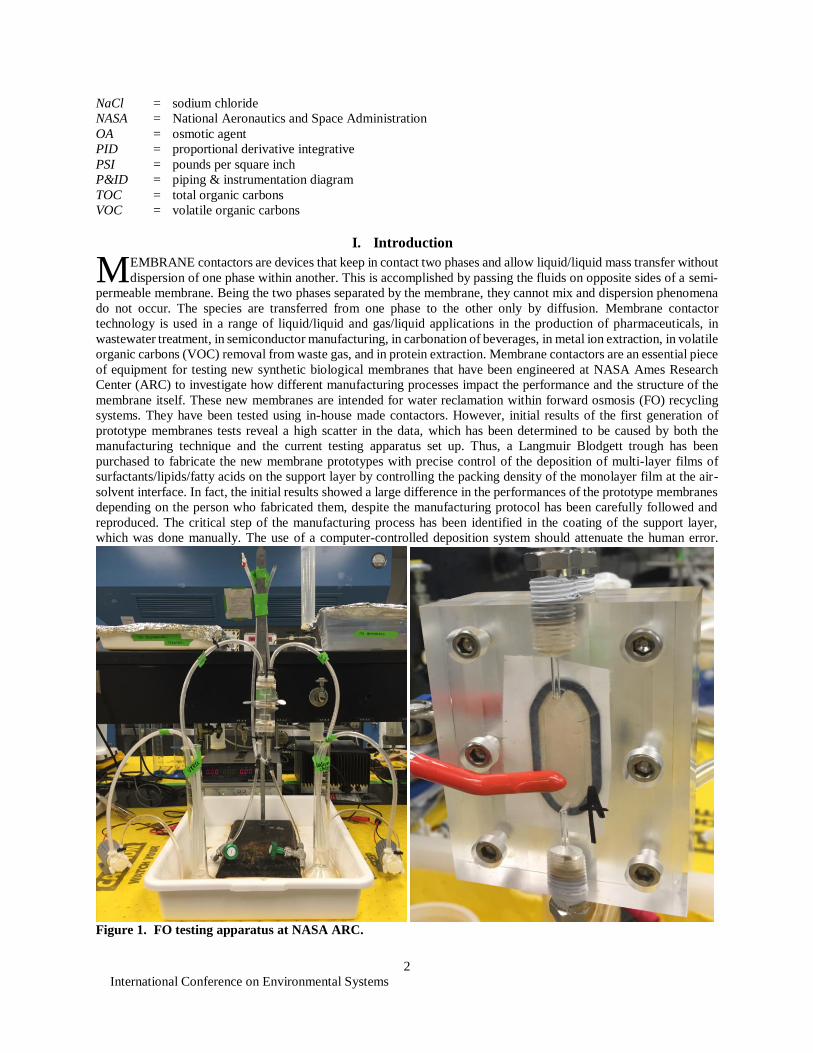
FO membranes are ususally microporous and hydrophilic. The area of contact of the two phases is ideally located
in correspondence of the pores mouths. It is important to carefully control of the pressure difference between the fluids
to keep the fluid/fluid interface at the mouth of each pore. The interfacial area can be established at the pore mouth
only if the penetration of the draw phase into the pores is prevented. If a critical value of the pressure, called the
breakthrough pressure, is exceeded, the draw phase starts to leak into the feed phase. For a particular material, the
breakthrough pressure depends on the pore radius, the tortuosity of the membrane along its thickness, the contact angle
between the membrane and the fluid, and the osmotic pressure differential. Since membrane pores have an undefined
shape related to the tortosity and non-constant pore size along its thickness, the interfacial area is often established
within the pores themselves. To keep this configuration and avoid dispersion between the phases, it is necessary to
work with pressures of the feed side equal or higher than the draw phase pressure.
III. Materials and Methods
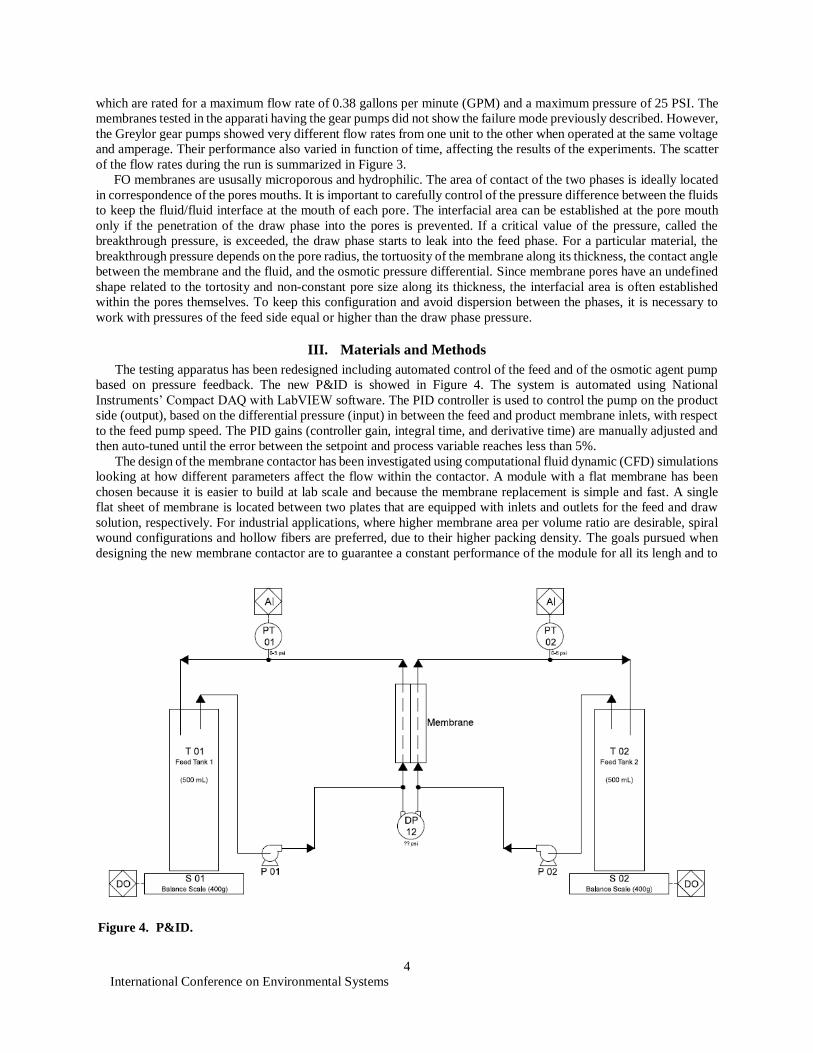
The testing apparatus has been redesigned including automated control of the feed and of the osmotic agent pump
based on pressure feedback. The new P&ID is showed in Figure 4. The system is automated using National
Instruments’ Compact DAQ with LabVIEW software. The PID controller is used to control the pump on the product
side (output), based on the differential pressure (input) in between the feed and product membrane inlets, with respect
to the feed pump speed. The PID gains (controller gain, integral time, and derivative time) are manually adjusted and
then auto-tuned until the error between the setpoint and process variable reaches less than 5%.
The design of the membrane contactor has been investigated using computational fluid dynamic (CFD) simulations
looking at how different parameters affect the flow within the contactor. A module with a flat membrane has been
chosen because it is easier to build at lab scale and because the membrane replacement is simple and fast. A single
flat sheet of membrane is located between two plates that are equipped with inlets and outlets for the feed and draw
solution, respectively. For industrial applications, where higher membrane area per volume ratio are desirable, spiral
wound configurations and hollow fibers are preferred, due to their higher packing density. The goals pursued when
designing the new membrane contactor are to guarantee a constant performance of the module for all its lengh and to
Figure 4. P&ID.
International Conference on Environmental Systems
5
work with low pressure drops. One major limitation in membrane contactors is the non-uniform flow that occurs
because of channeling, bypassing, mixing, entry region phenomena, and presence of stagnant zones, which lead to the
calculation of mass transfer coefficients that often differ from scale-up systems. The type of flow inside the module
plays also an important role. In fact, crossflow designs lead to higher mass transfer coefficients than co/counter-current
flows, but pressure drops increase too. In our case, the most conservative case of co-current flow has been chosen in
order to calculate the minimum performances of the membranes and to minimize the formation of air bubbles within
the module during the run. Often turbulence promoters are added to reduce the boundary layer resistance, however,
from past observations, it has been noticed that they often become traps for air bubbles, which affect the interfacial
area of the membrane. Thus, they have not been included in the CFD model. An extensive literature exists on hollow
fiber module design, and on how different parameters such as packing density, fibers lengh and diameters, operative
flowrates and pressures affect the performances of the module. Several mathematical models have also been developed
to analyze the performance of hollow fiber modules. However, this models cannot be used for flat sheet membrane
contactors. Due to the lack of mathematical models, a computer-aided analysis has been performed to simulate the
behavior of the tri-dimensional flow within the membrane contactors that have been used during all the membrane
testing performed until now, using as boundary conditions of the CFD simulation the same flow rates and pressures
used in the lab during the actual testing. The results of this CFD analysis have then been compared to visual
observations of the tri-dimensional flow of the fluid within the module, adding a blue methylene dye to the feed
solution when the system was running at full regime. This comparison has the objective of verifying that CFD software
can be used as a reliable tool to design a new membrane contactor with desired performances.
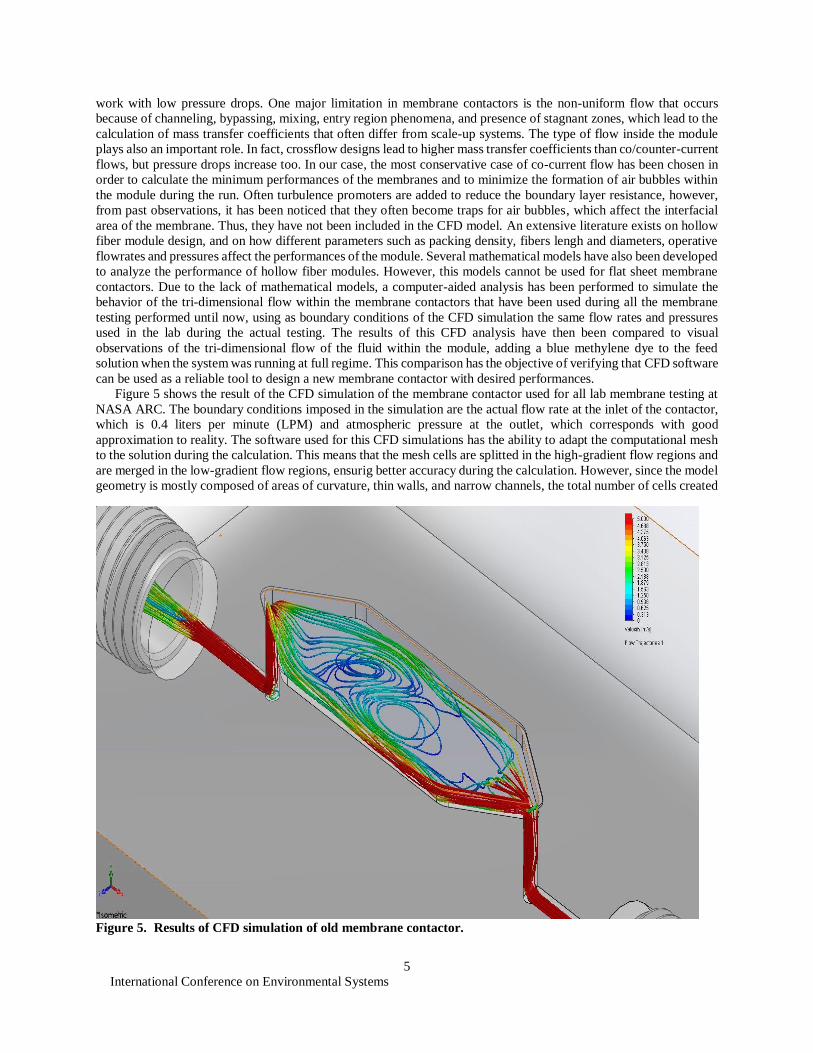
Figure 5 shows the result of the CFD simulation of the membrane contactor used for all lab membrane testing at
NASA ARC. The boundary conditions imposed in the simulation are the actual flow rate at the inlet of the contactor,
which is 0.4 liters per minute (LPM) and atmospheric pressure at the outlet, which corresponds with good
approximation to reality. The software used for this CFD simulations has the ability to adapt the computational mesh
to the solution during the calculation. This means that the mesh cells are splitted in the high-gradient flow regions and
are merged in the low-gradient flow regions, ensurig better accuracy during the calculation. However, since the model
geometry is mostly composed of areas of curvature, thin walls, and narrow channels, the total number of cells created
Figure 5. Results of CFD simulation of old membrane contactor.
International Conference on Environmental Systems
6
during the refinement process is extremely high even at the lowest refinement level, requiring a great amount of
physical RAM on the computer during the calculation. For this reason, the calculations took sever hours each and
were usually run overnight.
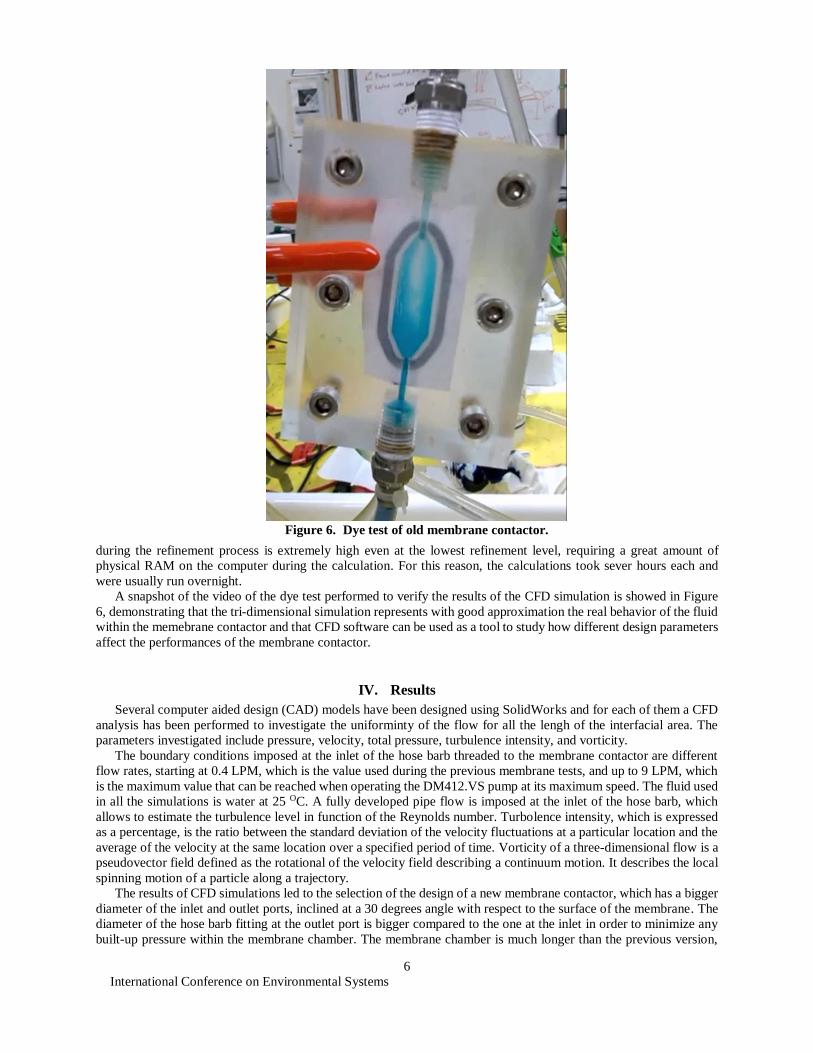
A snapshot of the video of the dye test performed to verify the results of the CFD simulation is showed in Figure
6, demonstrating that the tri-dimensional simulation represents with good approximation the real behavior of the fluid
within the memebrane contactor and that CFD software can be used as a tool to study how different design parameters
affect the performances of the membrane contactor.
IV. Results
Several computer aided design (CAD) models have been designed using SolidWorks and for each of them a CFD
analysis has been performed to investigate the uniforminty of the flow for all the lengh of the interfacial area. The
parameters investigated include pressure, velocity, total pressure, turbulence intensity, and vorticity.
The boundary conditions imposed at the inlet of the hose barb threaded to the membrane contactor are different
flow rates, starting at 0.4 LPM, which is the value used during the previous membrane tests, and up to 9 LPM, which
is the maximum value that can be reached when operating the DM412.VS pump at its maximum speed. The fluid used
in all the simulations is water at 25 OC. A fully developed pipe flow is imposed at the inlet of the hose barb, which
allows to estimate the turbulence level in function of the Reynolds number. Turbolence intensity, which is expressed
as a percentage, is the ratio between the standard deviation of the velocity fluctuations at a particular location and the
average of the velocity at the same location over a specified period of time. Vorticity of a three-dimensional flow is a
pseudovector field defined as the rotational of the velocity field describing a continuum motion. It describes the local
spinning motion of a particle along a trajectory.
The results of CFD simulations led to the selection of the design of a new membrane contactor, which has a bigger
diameter of the inlet and outlet ports, inclined at a 30 degrees angle with respect to the surface of the membrane. The
diameter of the hose barb fitting at the outlet port is bigger compared to the one at the inlet in order to minimize any
built-up pressure within the membrane chamber. The membrane chamber is much longer than the previous version,
Figure 6. Dye test of old membrane contactor.
International Conference on Environmental Systems
7
almost four times. This allows the fluid to remain uniform for a longer tract of the interfacial area. The depth of the
main chamber of the contactor has slightly increased to reduce the gradient of the velocity of the fluid between the
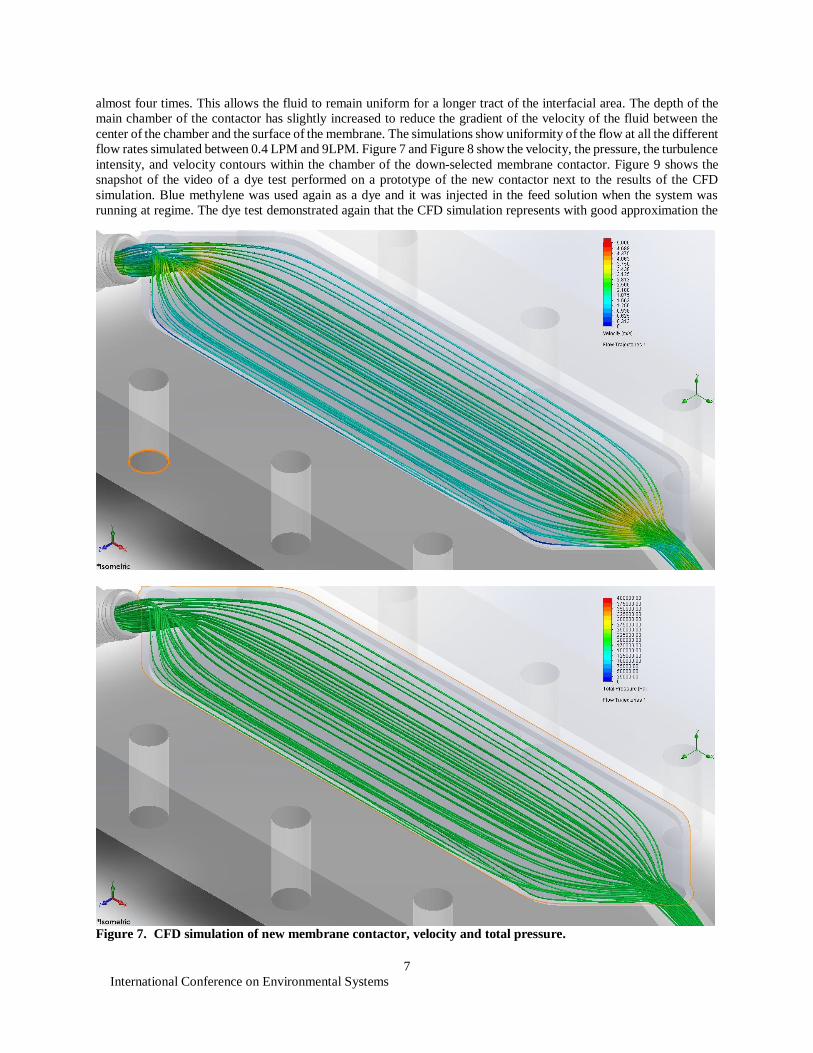
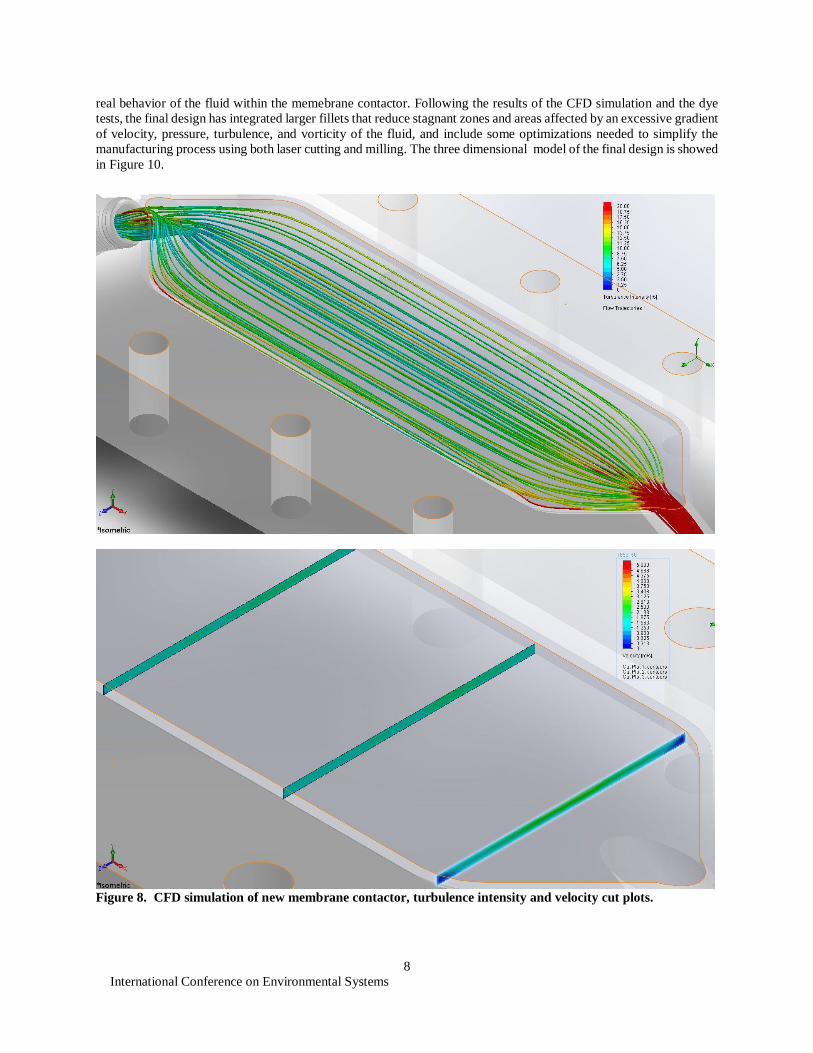
center of the chamber and the surface of the membrane. The simulations show uniformity of the flow at all the different
flow rates simulated between 0.4 LPM and 9LPM. Figure 7 and Figure 8 show the velocity, the pressure, the turbulence
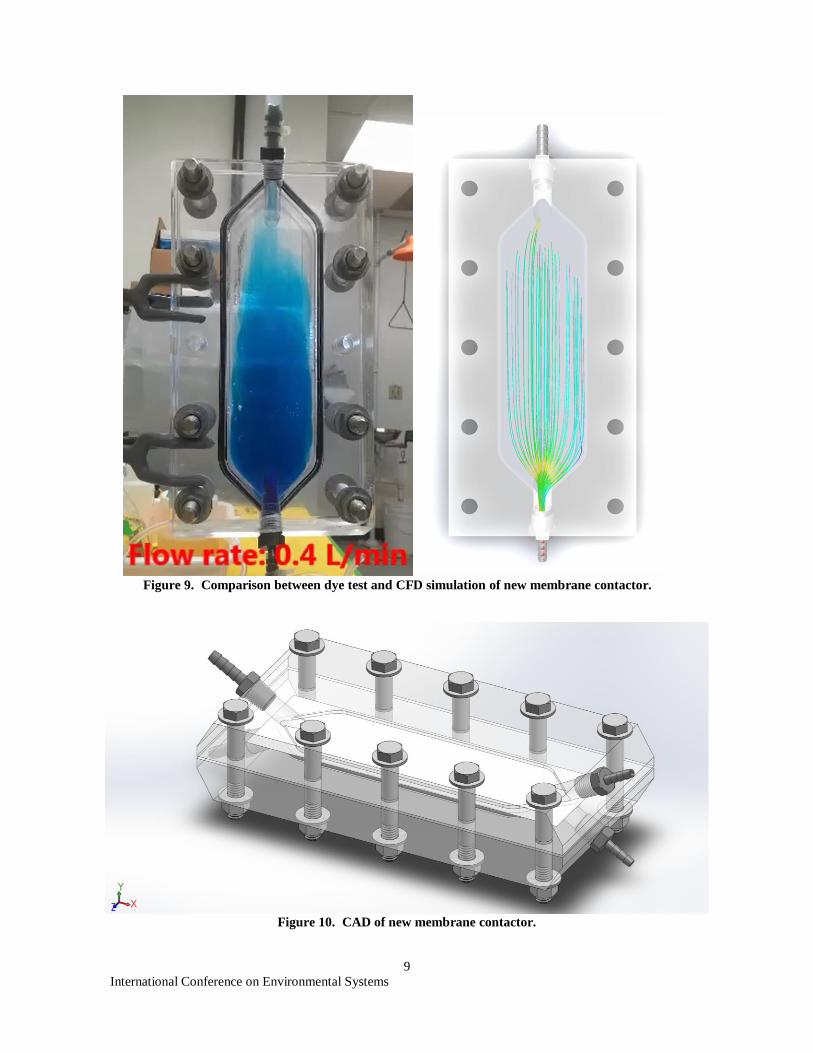
intensity, and velocity contours within the chamber of the down-selected membrane contactor. Figure 9 shows the
snapshot of the video of a dye test performed on a prototype of the new contactor next to the results of the CFD
simulation. Blue methylene was used again as a dye and it was injected in the feed solution when the system was
running at regime. The dye test demonstrated again that the CFD simulation represents with good approximation the
Figure 7. CFD simulation of new membrane contactor, velocity and total pressure.
International Conference on Environmental Systems
8
real behavior of the fluid within the memebrane contactor. Following the results of the CFD simulation and the dye
tests, the final design has integrated larger fillets that reduce stagnant zones and areas affected by an excessive gradient
of velocity, pressure, turbulence, and vorticity of the fluid, and include some optimizations needed to simplify the
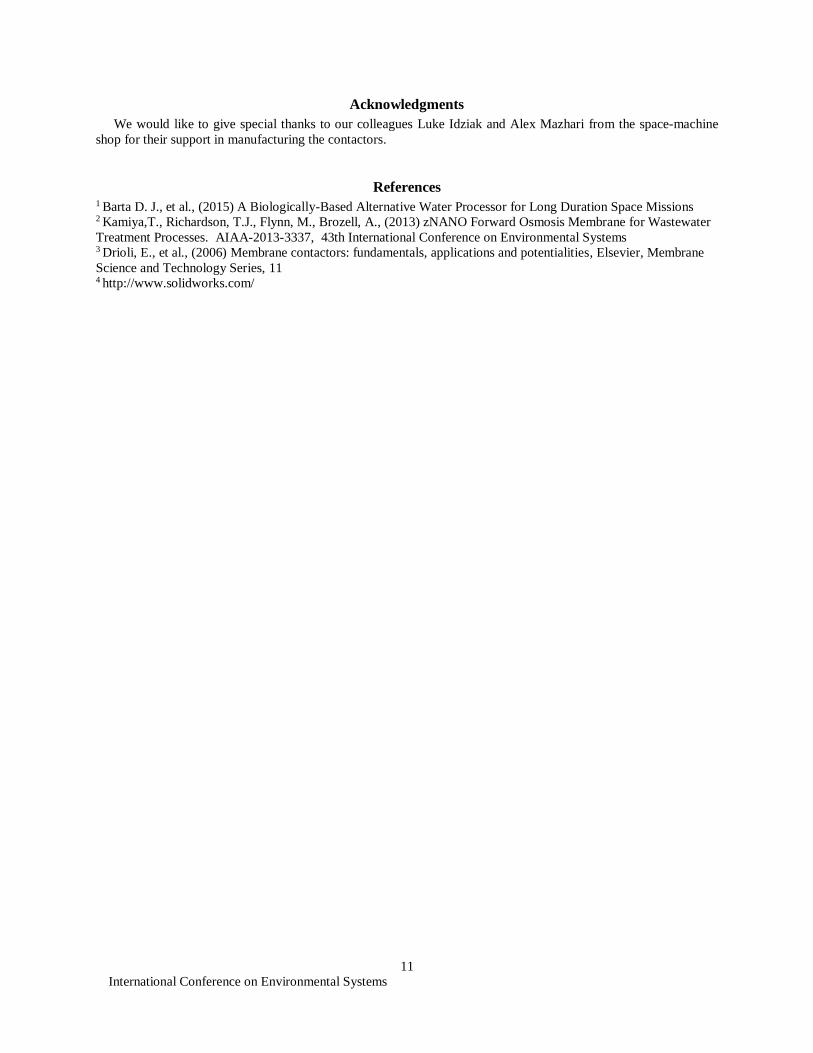
manufacturing process using both laser cutting and milling. The three dimensional model of the final design is showed
in Figure 10.
Figure 8. CFD simulation of new membrane contactor, turbulence intensity and velocity cut plots.
International Conference on Environmental Systems
9
Figure 9. Comparison between dye test and CFD simulation of new membrane contactor.
Figure 10. CAD of new membrane contactor.
International Conference on Environmental Systems
10
V. Conclusion
Computational fluid dynamic simulations have been used to optimize the design of the membrane contactor used
to test forward osmosis membranes with the objective of achieving a uniform performance of the module for all its
lengh. Dye tests done on prototypes built to verify the outcomes of the simulations have proven with very good
approximation the reliability of the software tool.
International Conference on Environmental Systems
11
Acknowledgments
We would like to give special thanks to our colleagues Luke Idziak and Alex Mazhari from the space-machine
shop for their support in manufacturing the contactors.
References 1 Barta D. J., et al., (2015) A Biologically-Based Alternative Water Processor for Long Duration Space Missions 2 Kamiya,T., Richardson, T.J., Flynn, M., Brozell, A., (2013) zNANO Forward Osmosis Membrane for Wastewater
Treatment Processes. AIAA-2013-3337, 43th International Conference on Environmental Systems 3 Drioli, E., et al., (2006) Membrane contactors: fundamentals, applications and potentialities, Elsevier, Membrane
Science and Technology Series, 11 4 http://www.solidworks.com/