Testing Web Site Design and Promotional Content _____________________________________________ Xavier Drèze and Fred Zufryden* August 18, 1998 *Xavier Drèze is Assistant Professor of Marketing at the University of Southern California, Fred Zufryden is the Ernest W. Hahn Professor of Marketing at the University of Southern California. The authors would like to express their gratitude to Kurt Eto for allowing them to use his Web site in the name of science.
Transcript
Testing Web Site Design and
Promotional Content
_____________________________________________
Xavier Drèze and Fred Zufryden*
August 18, 1998
*Xavier Drèze is Assistant Professor of Marketing at the University of SouthernCalifornia, Fred Zufryden is the Ernest W. Hahn Professor of Marketing at theUniversity of Southern California. The authors would like to express their gratitude toKurt Eto for allowing them to use his Web site in the name of science.
2
Abstract
The World Wide Web has grown at a spectacular rate as a medium for promoting
and marketing products and services. At the same time, little is known about the
effectiveness of advertising on the Internet. Yet, the Web offers unique, but so far largely
unexplored, research opportunities for measuring and analyzing the effectiveness of
promotional content. In this paper, we develop and apply a conjoint analysis-based
methodology to evaluate the design and the effectiveness of promotional content on the
Web. This methodology is shown to be ideally suited for this purpose by virtue of its
unobtrusiveness, external validity, large sample sizes, timeliness, as well as its low
implementation cost.
3
Introduction
It has recently been suggested (Ducoffe, 1996; and Ducoffe et al., 1996) that
“continuing developments in the area of new media technology represent the most
important influence on the future of the advertising industry over the next 10 to 15
years.” This view is supported by the tremendous growth of the Internet and the World
Wide Web that has been witnessed in recent years. This growth is of particular
significance to the advertising industry as “advertiser-supported” Web sites have
proliferated on the Internet (Hoffman, Novak and Chatterjee 1995). In particular, Novak
and Hoffman (1996) describe three major types of advertiser-supported sites: 1)
sponsored content sites (e.g., Los Angeles Times), 2) sponsored search agents and
directories (e.g., Yahoo) and 3) entry portal sites (e.g., Netscape). Here, advertisers, such
as company sponsors, may insert “banner ads” in the latter publisher sites that provide
links to company Web sites which may include advertising and sales information about
company products. This advertising sponsorship model is gaining significant attention as
a means of advertising and selling products and services on the Web. Moreover, various
related business models are currently emerging for Web-based advertising, including
single-sponsored sites as well as various fee arrangements (e.g., finder’s fees, and
microfee payment per unit content), that suggest future changes and growth in advertising
revenue generation on the Web (Zilber, 1997).
Nevertheless, advertising expenditures on the Web are currently small relative to
those of standard media. For example, 1995 Web expenditures have been estimated at
312 millions of dollars for the Web versus 38.1 billions for the television medium
(Jupiter Communications, 1996). However, the astonishing growth of Web users in
4
recent years, the rapidly increasing commitments by numerous companies to establish a
presence on the Web (The Economist, 1995), as well as the growing proportion of overall
company advertising budgets dedicated to Web advertising, all suggest a formidable
potential for Web-based advertising in the years to come that cannot be overlooked. In
1995, the number of advertiser sites on the Web was fifty times greater than it was two
years before (CASIE report, 1995).
Concurrently to sponsoring Web sites through advertising, many companies are
also setting up their own Web sites as an alternative way to reach consumers. The costs
associated with hosting a Web site vary greatly depending on the scope of the project.
The operating costs of internally managed Web sites range from $200,000 to $3 millions
(Forrester Research, 1995). In addition to the running cost of the Web sites, the cost of
designing the Web site content can be steep. According to a recent report from Forrester
Research (1997), the expenditure on third party Web site designer is expected to reach
$10 billion in 2000, from $582 in 1996. The same report states that the average cost of
developing the content of a Web site is currently $267,000.
Given the promise of the Web as a medium for electronic commerce and
advertising, third party companies, such as Netcount and I/Pro, have emerged that are
now focusing on developing relevant census-based measures of advertising effectiveness
for Web-based advertising. By tracking visitor flows as well as advertising exposure
patterns, measures are currently being developed that not only provide a means of
measuring advertising effectiveness but also suggest a pricing structure for Web-based
advertising in relation to standard media. However, the measurement of advertising
effectiveness on the Web is a complex problem. In particular, the impact of promotional
5
content on the Web is not accurately known because of difficulties associated with
measurement (Murphy, 1996). Aside from the technical problems associated with
measuring Web traffic and exposure patterns, measurement is further complicated by the
fact that the Web environment for advertising has characteristics that distinguish it from
those of standard advertising media. In particular, Web advertising has hybrid
characteristics that combine those of the print, broadcast, outdoor, and direct response
media. Moreover, continuing enhancements in graphic technology which is giving rise to
growing advertising creativity on the Web, with developments such as animated ads on
screen, (e.g., see Zilber, 1997 and Word at http://www.word.com for illustrations) may
make advertising effectiveness measurement on the Web even more challenging in the
future.
In this paper, we describe the development and application of a new Web-based
methodology for evaluating the effectiveness of “promotional content” on the Web. The
promotional content may be defined at two levels: 1) at the level of a Web page, which
may include specific product information or other promotional content, or 2) at the level
of a Web site that consists of a collection of Web pages which may include specific
product and promotional content as well as potential purchase transaction information. In
subsequent sections, we describe the features of the proposed methodology, the steps for
its implementation, and illustrate its application to a problem that involves the analysis
and the design of the promotional content characteristics of an actual Web site.
Features of the Proposed Methodology
In a recent report based on a joint project of the Association of National
6
Advertisers, Inc., and the American Association of Advertising Agencies, with the
support of the Advertising Research Foundation (CASIE, 1995), guiding principles have
been described for interactive media audience measurement that motivate the present
study. This report strongly stresses the need for non-intrusiveness in advertising
audience measurement. However, such a requirement is seldom achieved in standard
advertising testing methodologies. For example, various commercial advertising and
copy testing services rely on self-reported measures of advertising effectiveness from
respondents that may include advertising recall, recognition, comprehension, attitudinal,
and persuasion information (Stewart and Furse, 1986). Aside from the fact that these
measures may not be valid measures of effectiveness, they do not meet the criterion of
non-intrusiveness as the data are collected through survey-based methods that may be
subject to social desirability, or reactive biases. In-theater testing methods suffer from
similar drawbacks as well. These are not only based on intrusive measurement methods
(e.g., survey or electronic dial), applied to individual respondents, but they also lack in
external validity. For example, off-air pre- and post-advertising tests that are
administered within an in-theater setting are artificial, in the sense that they take place in
a controlled environment that does not resemble the home surroundings in which
individuals usually view TV commercials. In contrast, on-air tests do not suffer from
externally validity bias as they place ads within the home setting. However, they are
subject to response or experimental biases since respondents are typically subsequently
asked about their reactions through surveys.
Here, we propose a Web-based methodology that eliminates biases of current
advertising testing methods and offers significant advantages over the latter in a number
7
distinctive and important ways:
• Unobtrusive - The methodology is based on an experimental method that is totally
transparent and unobtrusive to each respondent. In particular, respondents go about
their normal “surfing” activities on the Web and have no way of knowing that they
are being manipulated (i.e., exposed to particular advertising stimuli that are part of a
well defined experimental design). Additionally, the methodology develops measures
of effectiveness that are based exclusively on the mouse-click streams which reflect
respondents’ flow and viewing behavior on a given Web site as they go about their
normal surfing activities on the Web. Hence, measurements are based on actual
respondent behavior and do not suffer from any experimental effects or any of the
self-report biases.
• Experimentally-based - The methodology is based on a rigorous experimental
design that draws on methods of conjoint analysis, a widely applied market research
technique, (Green and Rao, 1971; Wittink and Cattin, 1981; Cattin and Wittink,
1982). Our experimental methodology permits 1) the randomization of test groups as
well as respondent matching, 2) an unobtrusive manipulation of test stimuli as well as
an unobtrusive data collection from Web users.
• Externally valid - The methodology is designed to test the effectiveness of content
on the Web and is implemented on the Web itself. The subjects that are being
monitored are actual Web surfers engaged in their own Web surfing activities, and
not a random sample of individuals who might or might not be involved with the
product tested. Thus, the method does not suffer from any biases due to lack of
external validity as content is viewed in its actual form, by actual viewers, and within
8
its actual viewing environment (i.e., within the Web site environment for which it is
intended). Although the methodology, at this time, does not attempt to project
beyond this environment, ways to extend the methodology to test content of other
media vehicles, such as print, radio or TV on the Web, are being investigated by the
researchers.
• Based on large sample sizes - Because Web traffic is very large, this Web-based
methodology permits the collection of large sample sizes. While traditional concept
testing methodologies, such as conjoint analysis, are frequently being used with only
a few hundred respondents, this Web-based methodology can draw on tens of
thousand of respondents in a short amount of time and at a low cost. In fact, as
applied to a given Web site, the methodology collects complete census data in the
sense that it permits the collection of behavioral data (i.e., mouse-click streams) from
all visitors that have accessed the given site over a defined study period. Thus, the
methodology is free of random sampling error and expected to have high reliability.
• Instantaneous - The electronic data is collected from respondents instantaneously as
their behavior occurs, in real time. Thus, the methodology potentially provides
instantaneous measures of advertising and site content effectiveness.
• Low cost - Because of the relatively high traffic on the Internet and World Wide
Web, the methodology is extremely easy and inexpensive to implement. All that is
required is access to the publisher’s Web site - that is the Web site that contains the
pages whose content will be evaluated and the implementation of a relevant
experimental design to evaluate the promotional situation at hand.
9
Development and Application of the Methodology
In this paper we illustrate the application of the proposed Web-based
methodology to the problem of analyzing and measuring the effectiveness of a Web site’s
promotional contents. Because it involves a set of Web pages and their related contents,
this problem is potentially more complex than one which would merely involve the
evaluation of advertising content within one particular Web page within a Web site.
However, it should be emphasized that our methodology can be applied to both of these
situations as well as to the problem of Web-based product design in general (Drèze and
Zufryden, 1997).
In this section, we describe the general framework of the proposed methodology
within the context of an actual case application to Web site content analysis and
effectiveness measurement. Our methodology was used in conjunction with a Web site
that promotes and markets music CDs directly on the Internet. The Web site owner
wanted assistance in appropriately designing his Web site so as to provide appropriate
descriptive information as well as purchase-related information about its CD products.
The potential information to be delivered at the Web site consisted of factors such as
description of CD products and titles, sample sound clips, placement of endorsements
from critics, as well as CD product ordering information. A basic objective of our study
was to evaluate Web site content configuration characteristics that would most effectively
communicate the promotional information within the Web site. The methodology was
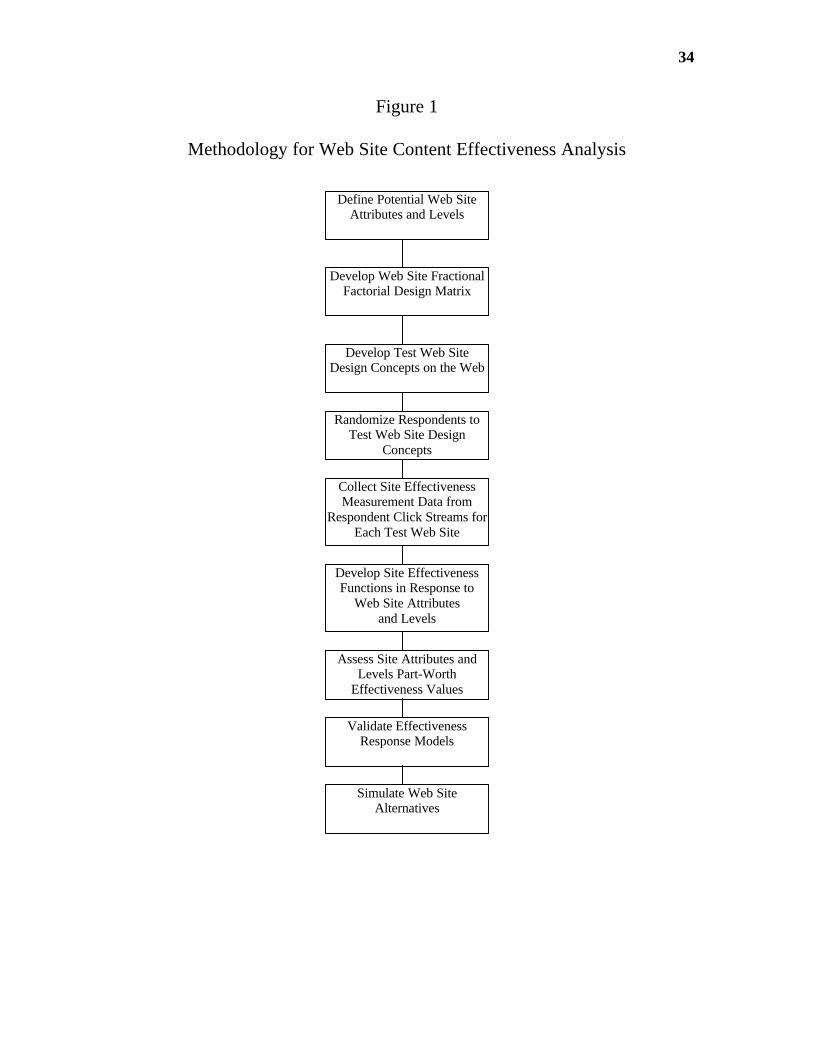
implemented according to the following nine basic steps (see Figure 1 for a flow chart):
10
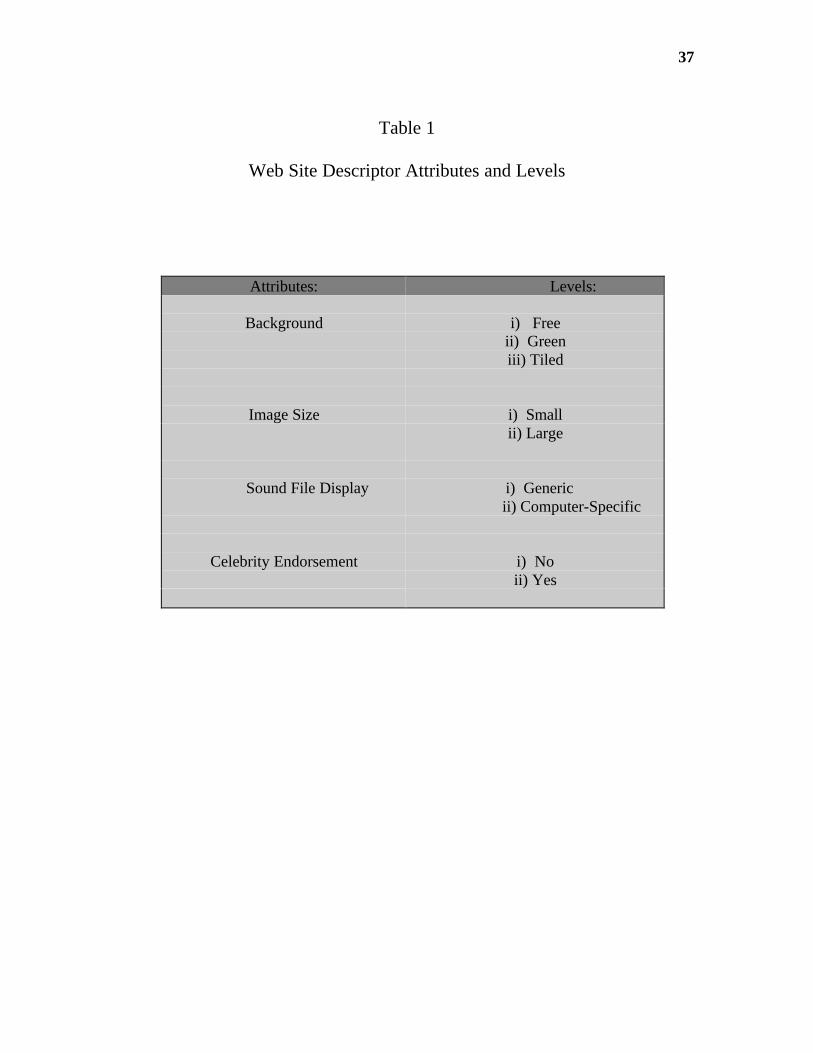
Define Potential Web Site Attributes and Levels
The first step of the methodology involves the definition of the alternative Web
site attributes and corresponding levels that will be investigated. For example, in this
illustration, based upon discussions between the researchers and the Web site owner, four
essential Web site descriptor attributes were defined: Background, Image Size, Sound
File Display and Celebrity Endorsement.
There are a wide variety of possibilities in terms of background colors.
Historically, all Web sites had the same gray background. Then, Web site designers
became bored with gray and started using other colors, ranging from “traditional” colors
such as paper white to more exotic colors such as bright pink. The latest trend is to use
backgrounds with multicolored patterns. This increased flexibility in terms of
background colors does come at a price however. First, using complex backgrounds may
slow down both transmission and display time as more information needs to be
exchanged between the Web server and the Web browser. Second, one can never be sure
of how the color will be displayed on an unknown PC system. Not all computers are
setup to display the same number of distinct colors (256 colors is now the norm, but
many systems still can only display 16 colors at one time while other can display 16
million). When there is not sufficient room in a computer’s color palette to display the
requested color, it will either substitute it for a different color, or it will use dithering to
produce a color that closely matches the requested color (the actual technique used can be
defined in the “Web browser’s” settings).
With this in mind, we decided to test three different types of backgrounds (see
11
Table 1). The first possible background is the simplest one: Free. That is, the
background color is left undefined and no background information is specified within the
HTML (hypertext markup language) page description. This causes the browser to use
whichever color the user has defined as the default background color. The advantages of
this background setting are that it does not slow down the Web surfing process, since no
information is transferred, and that one can hope that the user has defined default colors
that he/she finds pleasing. The second possible background was Green. Green was
chosen because it mixes well with the various graphical images used throughout the test
site. The last possible background was Tiled, a gray and white tile-like patterned
background. This background is more elaborate than the two other ones, it is more
aesthetically pleasing, but it also trades-off aesthetics for potentially longer download
times. Of course, once a background is specified for a given visit, the surfer will see the
same background on every page of the site. The surfer will also see the same background
in the event of a repeat visit to the test Web site.
Our second attribute is the Image Size of the graphical items used throughout the
test Web site. When using pictures, one makes a simple trade-off: the larger the picture,
the better it looks, but also the longer it takes to download. Long download times can
sometimes upset net surfers, as they may become impatient, causing them to leave a site
despite its overall attractiveness. Hence, we decided to test two different sizes (Large
and Small) for each of the graphical images. The Large images were vertically and
horizontally twice as big as the Small ones (i.e., four times larger in terms of number of
pixels).
There are several formats under which sound can be encoded into files. The
12
formats currently used most are AIFF (in use on Macintoshes and Amigas), WAV (for
IBM PCs and compatibles), and AU (for UNIX based machines). Traditionally, Web
sites offer either one of these three formats, or all of them. Offering all of them can
sometimes be overwhelming for a surfer who is confronted with a large choice of songs
under different file formats. For this purpose, we decided to test two alternative levels of
the Sound File Display attribute. One level was defined as Generic. This corresponded
to a display table where all the available songs under the three file formats were
displayed (see Figure 2 for an example of a page that incorporates this feature along with
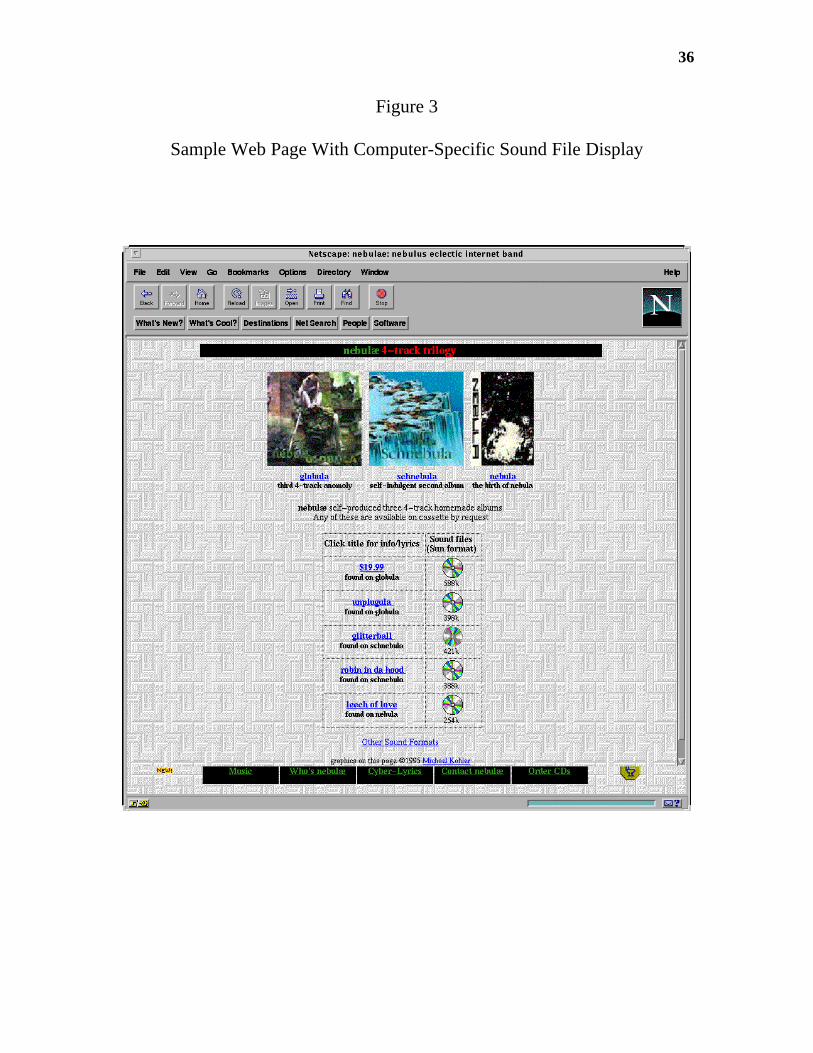
a Free background and Small images). Under the second scenario, called Computer-
Specific, the Web server determined the type of machine used by the Web surfer, and
only offered him/her a table containing the type of sound file that is appropriate for
his/her computer. For instance, if the surfer had a Sun workstation, only AU files would
be presented on the Web pages (see Figure 3 for an illustration of such a page which also
incorporates a Tiled background and Small graphical images). Similarly, if the surfer had
a Macintosh, only AIFF files would be displayed.
Our last experimental attribute was the location of Celebrity Endorsements. The
main CD title sold on the Web site, “Straight to the jugulæ,” has received a fair amount
of positive press. Originally, all the critic quotes related to this album were displayed on
a separate page that only contained quotes from critics. We tested this setup against one
in which a specific endorsement (by the “Angryman,” a popular DJ in Northern
California) was chosen and additionally displayed on one of the central pages. It was
placed within the main body of the site, right below the image representing the cover
picture of the “Straight to the jugulæ” CD. Clicking on the critic endorsement also
13
provided a short cut to the page containing the various other critic quotes. Thus, as noted
in Table 1, the Celebrity Endorsement attribute could take on the values No or Yes,
depending on whether or not the “Angryman’s” endorsement was included within the
main text body of the test Web site.
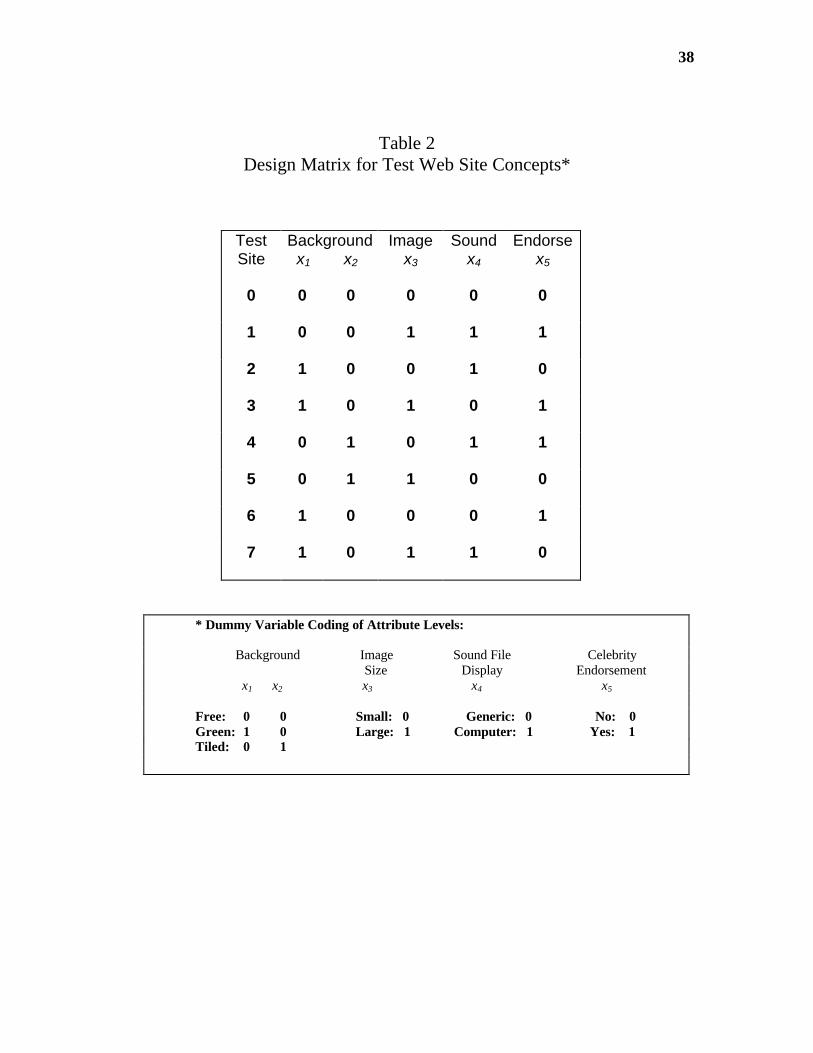
Develop Web Site Fractional Factorial Design Matrix
In conjoint analysis, because of the difficulty of developing and testing concepts
corresponding to a full factorial design, particularly as the number of attributes and levels
becomes large, it is common practice to develop and apply an orthogonal fractional
factorial design. The fractional design consists of an appropriately chosen subset of all
possible designs that may be formed with the defined attributes and levels (Green and
Rao, 1971). For example, in our situation, we have four different attributes. One of these
attributes has 3 levels, the other ones have 2 levels each. Consequently, there is a total of
3x23 = 24 different Web sites that could be designed from the defined attributes and
levels. The smallest fractional factorial design for this configuration is a design matrix
consisting of a total of eight Web site test concepts, with configurations and
corresponding dummy variable codes (xi, i=1,...,5), as described in Table 2. This
fractional design was generated by using CI2, a commercial conjoint analysis package.
Develop Test Site Design Concepts on the Web
At the next step, test stimuli corresponding to each of the test concepts of the
design matrix are developed. In this case, in accordance with the design of Table 2, eight
test concept stimuli, including the current Web site configuration, defined as a reference
14
case, were developed and installed on the Web site’s server. We defined site indices j=0
to 7, with site j=0, the “reference” design, corresponding to the current Web site
configuration.
Note that in standard conjoint analysis, test concept stimuli are typically designed
by use of concept cards, which merely provide verbal descriptions of each test concept,
or other visual stimuli (Green and Rao, 1961). In contrast, our proposed methodology
does not suffer from external validity biases since it is based on actual products (i.e.,
Web sites). That is, according to the design of Table 2, eight actual alternative Web site
versions, including their corresponding Web pages and design contents, were developed
and installed on the site’s server by means of specifically designed software.
Randomize Respondents to Test Web Site Design Concepts
At the next stage, it is necessary to assign surfers to alternative test Web site
design concepts. In order to implement this assignment process, a randomization method
was developed and used which was based on the distinct Internet Protocol addresses (IP
addresses) of each visitor. Thus, based on his/her IP address, each visitor was assigned
one of the eight sites configuration. This insured that a particular visitor saw the same
site configuration during each repeat visit. This assignment is totally transparent to the
user. There is nothing in the site configuration or content of pages that may lead the user
to suspect that what he/she received was actually processed by our software. The user is
unaware that had he/she requested the same pages from a computer with a different IP
address, he/she might have received a different set of pages. Moreover, we went to great
length to develop a technique that did not require visible page content manipulation
15
techniques such as cgi-scripts (Drèze and Eto, 1997). This was necessary to ensure that
the technique used to test the different profiles was unobtrusive and transparent to the
user.
One potential problem with this method is that repeat visitors might have different
IP addresses each time they visit our Web site. Indeed, this could occur if they access the
Web through a service provider that gives them a different IP address each time they
connect, or if they use different computers (e.g., computers from a computer lab at a
University, using a different computer for each of their visits). To ensure that such
visitors see the same Web site configuration at each of their visits, we only used the first
half of the IP address for our randomization. This guaranties that every computer from
the same organization accesses the same Web configuration (e.g., all users accessing our
test site from the University of Southern California will see the same Web pages, but they
will see different ones than visitors using AOL or other Internet providers).
Collect Site Effectiveness Measurement Data From Respondent Click Streams
The next step involves the collection of relevant data on the basis of which site
effectiveness measures can subsequently be developed. Here, based on the
randomization procedure described above, data were collected corresponding to the eight
matched Web site visitor groups. The data were developed primarily by tracking the
mouse click streams of visitors that accessed each one of the defined alternative Web test
sites. Thus, each time visitors would request a Web page, the following information was
recorded in a special log file:
• IP address of the visitor
• Web site configuration seen by the visitor
16
• Date and time of the page request
• Name of the page requested
• Name of the previous page requested
• Name and version number of the visitor’s Web browser software
From this basic information, numerous measures can be extracted (Drèze and
Zufryden, 1997), including the following:
• Visitor’s operating system (Windows, Macintosh, UNIX, etc.)
• Ability of visitor to handle Frames
• Ability of visitor to handle JAVA scripts
• Total number of pages accessed during the site visit
• Total time spent on the visit
• Time spent per page
In this study, because the specialized study site that was chosen generated
moderate traffic, the data collection phase ran for a period of several months to permit the
collection of a sufficiently large data sample. On this basis, a total sample size of N=788,
was collected over a three month period which provided ample subsample sizes for each
of the test Web site cells. Moreover, the overall sample was split into test (n1=540) and
holdout (n2=248) subsamples, gathered over two consecutive time periods, to permit both
descriptive and predictive model testing. We emphasize at this point that the data
collection takes place as the surfer visits our test site. It is done automatically by the
software we installed on the server, and does not affect the surfer’s interaction with the
Web site. That is, the impact of a particular site’s content design characteristics, and site
effectiveness, are inferred by tracking the normal behavioral patterns (i.e., click streams)
of the visitors rather than obtained from obtrusive measurement procedures that are
17
commonly used in standard conjoint analysis (e.g., measuring expressed subject
preferences by some rating or ranking instruments, see Wittink and Cattin, 1981).
Develop Site Effectiveness Functions of Web Site Attributes and Levels
One of the relevant issues at this stage is the development of content effectiveness
measures and related effectiveness functions. Unfortunately, to date, no industry
standards have yet emerged for measuring the effectiveness of content, such as
advertising, on the Web (Novak and Hoffman, 1996; Murphy, 1996). In this study, we
focused on measures that would reflect site attractiveness and visitor interest in the site
contents, and thus could serve to compare the overall effectiveness of alternative Web
sites as well as that of their component characteristics (e.g., of explanatory variables
corresponding to levels of attributes of Background, Image Size, Sound File Display, and
Celebrity Endorsement).
From a methodological standpoint, we found that standard response modeling
techniques, such as the use of linear additive regression models (OLS), were
inappropriate. This is because, among other reasons, the data did not conform to the
requirements of normally distributed random errors. Thus, given their flexibility in
dealing with alternative error distributions, procedures for “limited dependent variables”
(Hauseman et al., 1984) were considered to formulate appropriate response functions
instead. There are numerous potential effectiveness measures that may be defined to
characterize Web site effectiveness (Drèze and Zufryden, 1997). In this section, we
develop models for two effectiveness measures that we found most relevant in our study:
the Number of Pages Accessed and Time Spent during a site visit.
18
a) The Poisson Regression Model of Number of Pages Accessed
The Poisson regression model has been shown to be useful in situations involving
count data (Maddala, 1984). We use the Poisson to model the Number of Pages Accessed
by a visitor during a site visit. To implement the Poisson over the range k ≥ 0, we define
a random variable k as the Number of Pages Accessed - 1. Thus, the probability that a
visitor will access k pages of a given site is stated as:
P k e kk( ) / != −λλ , for k ≥ 0 (1)
with λ , the mean of the Poisson, given by the relationship:
ln λ = βo+β1X1+β2 X2+.....+βI XI, + ε (2)
where Xi , i=1,...., I are explanatory variables (e.g., characteristics of site visited, as well
as browser and operating system descriptor characteristics), βi (i=0,1,..., I ) are constant
coefficients, and ε is an error term.
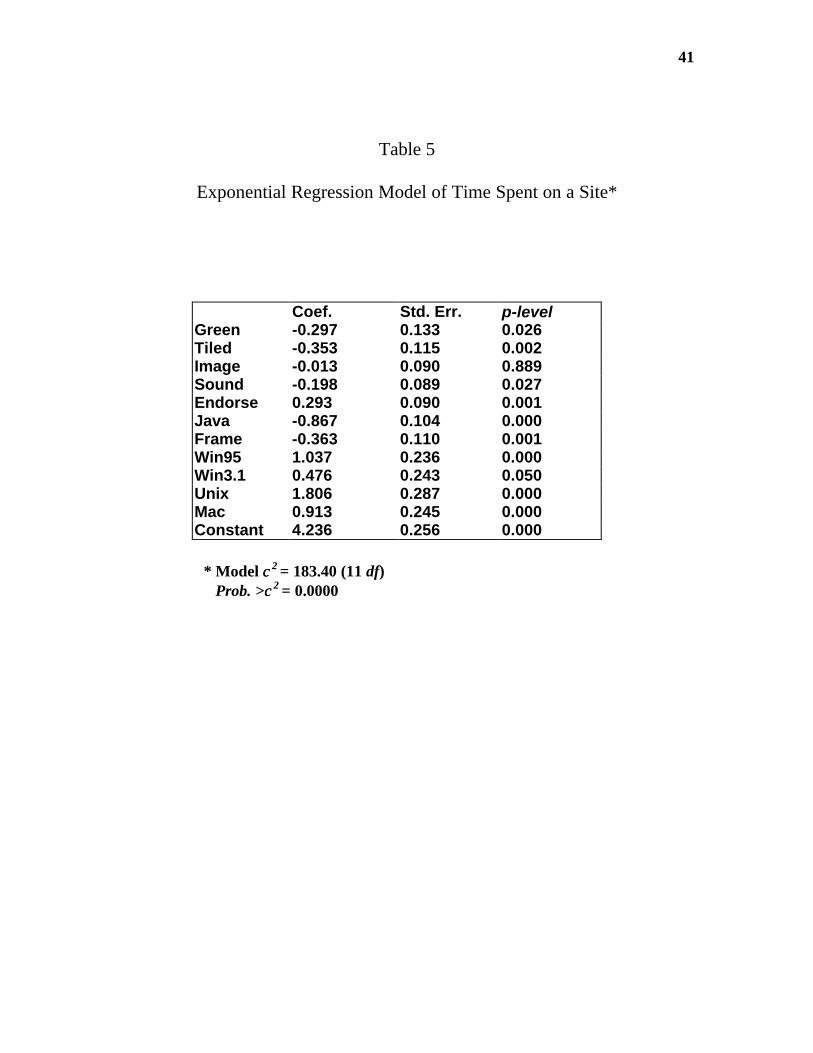
b) The Exponential Regression Model of Time Spent on a Site
The Time Spent during a site visit is best modeled as a random variable t using
survival analysis techniques (Kalbfleisch and Prentice, 1980). In this paper, we restrict
our attention to Exponential regression, which is one of the most tractable of the limited
dependent variable approaches for modeling time intervals. However, we note that this
approach may readily be extended to consider more complex model formulations as well
as distributional assumptions of unobserved heterogeneity (Jain and Vilcassim, 1991).
The probability of spending an amount of time t at a site is stated as the Exponential
model:
ln(t) = α0+α1X1+α2 X2+.....+αI XI, + ε*, (3)
19
with αi (i=1,...., I) constant coefficients, and εε* = -εε and error term, with ε given by the
extreme value distribution.
Assess Site Attributes and Levels Part-Worth Effectiveness Values
The parameters of the effectiveness models described above may be used to
assess site attributes and levels part-worth effectiveness values. To do this, the
parameters of the Poisson and Exponential models were estimated by maximum
likelihood estimator techniques (Gourieroux, 1984; Cameron, and Trivedi, 1986).
When designing the study, we had a-priori hypotheses about the impact of each
of the attribute levels. We now review these hypotheses as we discuss the results of our
empirical analyses for the Number of Pages Accessed and Time Spent models (see Table
3 for a summary of our hypothesed versus empirical results):
a) Background
Relative to background, we hypothesized that the Tiled background would have a
beneficial impact, as compared to the Free background, yielding a greater number of
pages accessed during a visit as well as a greater time spent on as site. Conversely, we
hypothesized that the Green background would appear relatively unattractive, and lead to
a lesser number of pages accessed, as well as a smaller amount of time spent per site
visits.
These hypotheses regarding the impact of the Green background were supported
by our empirical results. The negative coefficients obtained for the Green background in
both the Poisson (see Table 4) and the Exponential (see Table 5) models supported our a-
priori beliefs as they show that that Green does have a negative impact on Number of
20
Pages Accessed as well as on Time Spent. While this impact was statistically significant
(p-level<0.05) for the Exponential, it was, however, not statistically significant in the case
of the Poisson model.
With respect to the Tiled background, we found that it had a positive effect on
Number of Pages Accessed (see Table 4), but had a negative effect on Time Spent (see
Table 5). These results were marginally statistically significant (p-level<0.1) for the
Poisson model and statistically significant (p-level<0.05) for the Exponential regression
model. In particular, Tiled, by virtue of its relatively large positive coefficient, in the
Poisson model, suggests that it is the most impactful explanatory variable affecting
Number of Pages Accessed.
b) Image Size
The overall impact of the size of the graphical image files was hypothesized to be
more complex. We thought that since Small images load faster, they would induce the
visitor to see more pages, but allow him/her to do so in less time. Hence, Small (Large)
images would have a positive (negative) impact on Number of Pages Accessed, but a
negative (positive) impact on Time Spent on a site.
Our empirical results only partially supported our a-priori notions. Indeed, Large
images were shown to negatively impact the Number of Pages Accessed. This was
clearly shown in Table 4, where the coefficient of Image is not only negative but
statistically significant (p-level<0.05). However, we were unable to support our prior
hypothesis that a Large Image would have a positive impact on Time Spent. As shown in
Table 5, the corresponding coefficient was not significant in this case.
21
c) Sound File Display
In relation to the Sound File Display formats, we thought that the Generic table
would be more cumbersome, causing the visitors to be less interested in the Web site, and
leave prematurely. This would yield less page requests, and less time spent on the visit
than for the Computer-Specific table. Here, as expected, we found that the coefficients
for Sound File Display were indeed negative in both models for Number of Pages
Accessed (Table 4) and Time Spent (Table 5). However, this result was only found to be
statistically significant (p-level<0.05) in explaining Time Spent.
d) Celebrity Endorsement
We postulated that adding one major celebrity’s endorsement within the main text
body of the site would spark visitor interest, yielding more page requests and more time
spent on the site. This hypothesis was largely supported by our empirical results. As
shown in Tables 4 and 5, the coefficients for Celebrity Endorsement were found to be
positive for both the Number of Pages Accessed and Time Spent. While the coefficient
was statistically significant (p-level<0.05) for Time Spent, it was only marginally
significant for the model of Number of Pages Accessed (p-level=0.147).
e) Java Scripts and Frames
Other attributes were analyzed that were not entirely under our control: Use of Java
Scripts and Use of Frames (see Table 3). These attributes were defined by dummy
variables (1=Yes, 0=No) to indicate whether the visitor’s browser could handle Frames
and JAVA scripts, respectively. We were able to monitor these capabilities when visitors
came in, but we could not impose them (i.e., if a visitor comes in with a browser that does
not handle JAVA, we could not force him/her to see the JAVA applets contained in our
22
site). Thus, we treated the use of JAVA and Frames as a natural experiment. Our
expectation for these two attributes was that Use of JAVA Scripts, and Use of Frames,
being much touted features of the latest batch of browsers, would result in visitors who
have JAVA and/or Frames enabled Web browsers spending more time visiting the site,
and requesting more pages.
In the case of Use of JAVA Scripts, (see Tables 4 and 5) we found that both its
impact on the Number of Pages Accessed and Time Spent on a Site were highly
statistically significant (p-level<0.001), relatively large, in comparison with those of the
controllable independent variables that were discussed above, and also negative.
Contrary to our initial beliefs, these empirical results suggested that the use of JAVA
significantly adversely affects the effectiveness of our site. Upon reflection, we suggest
that this result may due to the fact that, although potentially more attractive, it takes
longer to load pages which contain JAVA Scripts. The longer downloading time appears
to be an irritant to Web surfers which not only lessens the number of pages viewed but
also the length of time they will spend at the Web site. Indeed, a recent study that
focuses on the value of advertising on the Web (Ducoffe, 1996) postulates “irritation” as
a measure of advertising value and suggests that long waiting times, while loading a
screen, may contribute to the impatience and irritation of Web surfers.
In the case of Use of Frames (see Table 4), there is mixed support of our prior
hypotheses. Use of Frames contributes positively to the explanation of Number of Pages
Accessed, as we had posited, although the corresponding coefficient has only marginal
statistical significance (p-level= 0.116). This result, nevertheless, coincides with our
prior belief that Frames should promote the viewing of more pages by more effectively
23
providing links to them.
In contrast to our prior hypothesis, we found that Use of Frames adversely affects
the Time Spent on a Site (see Table 5). The corresponding coefficient is not only found
to be negative but is also highly significant (p-level=0.001). One possible explanation for
this is that Frames may provide too much ease in navigating through a site and hence a
visitor may tend to spend less time on a site to satisfy his information or curiosity needs.
f) Operating Systems
Another attribute that was beyond our control was the PC Operating System used by
individual surfers. We defined four additional dummy variables to code alternative levels
including Windows 95, Windows 3.1, Macintosh, UNIX, and Other systems. In this case,
we found that the corresponding coefficients for these explanatory variables were all
highly statistically significant, as well as all positive, for both the Number of Pages
Accessed and Time Spent models (see Tables 4 and 5). Interestingly, the UNIX system,
by virtue of its relatively large coefficients, was the most impactful of the four popular
operating systems considered in the effectiveness models. In addition, in conformance
with prior expectations, operating systems in the Other category, were found to be less
impactful than the four popular operating system types.
The larger coefficients for the UNIX operating system may be explained by the fact
that most UNIX based computers are directly connected to the Internet using fast
Ethernet connections while most PCs and Macintoshes use slower dial-up connections.
The mixed results we obtained in validating our hypotheses do not detract from the
validity of our methodology. Quite the opposite! Eleven of the twelve parameters of the
Exponential regression and eight of the Poisson regression parameters were significant at
24
the p=0.1 level (with two others significant at the p=0.15 level). Our analysis shows that
the impact of the various components available to advertisers and Web designers may not
be obvious and that our methodology will be helpful in measuring this impact. Among
other results, it allowed us to discover that although developers consider the use of JAVA
scripts to be a selling point for their sites, Web users may actually become irritated when
they encounter them.
Validate Effectiveness Response Models
In our study, we first concentrated on model validation on the basis of the
descriptive fit of the effectiveness models. As noted above, by referring to p-levels, we
identified a number of statistically significant variables that explained the Web site
effectiveness measures. Moreover, in terms of overall descriptive goodness of fit, the
chi-square statistics, shown in Tables 4 and 5 also provide support of our models in view
of the very close compatibility that is indicated between our proposed effectiveness
models of Number of Pages Accessed and Time Spent with our empirical data. Here, the
Prob. > ×2 are negligible, suggesting a very high overall descriptive goodness of fit for
both models.
In addition, we also conducted tests of predictive fit of our proposed effectiveness
models. We utilized the estimated models from Tables 4 and 5 (based on the analysis
sample of size 540) and then used these models to predict both the average Number of
Pages Accessed and Time Spent, by setting the models’ independent variables with
corresponding data values from the holdout sample (consisting of the subsequent 248 site
visits). We then compared the predicted values of both average Number of Pages
25
Accessed and Time Spent, respectively, with their observed empirical counterparts. The
results of this test indicated very good predictive validity of the models as we found that
the mean absolute percent error (MAPE) between actual and predicted average Number
of Pages Accessed was 2.81%, while the MAPE for Time Spent was only 1.57%.
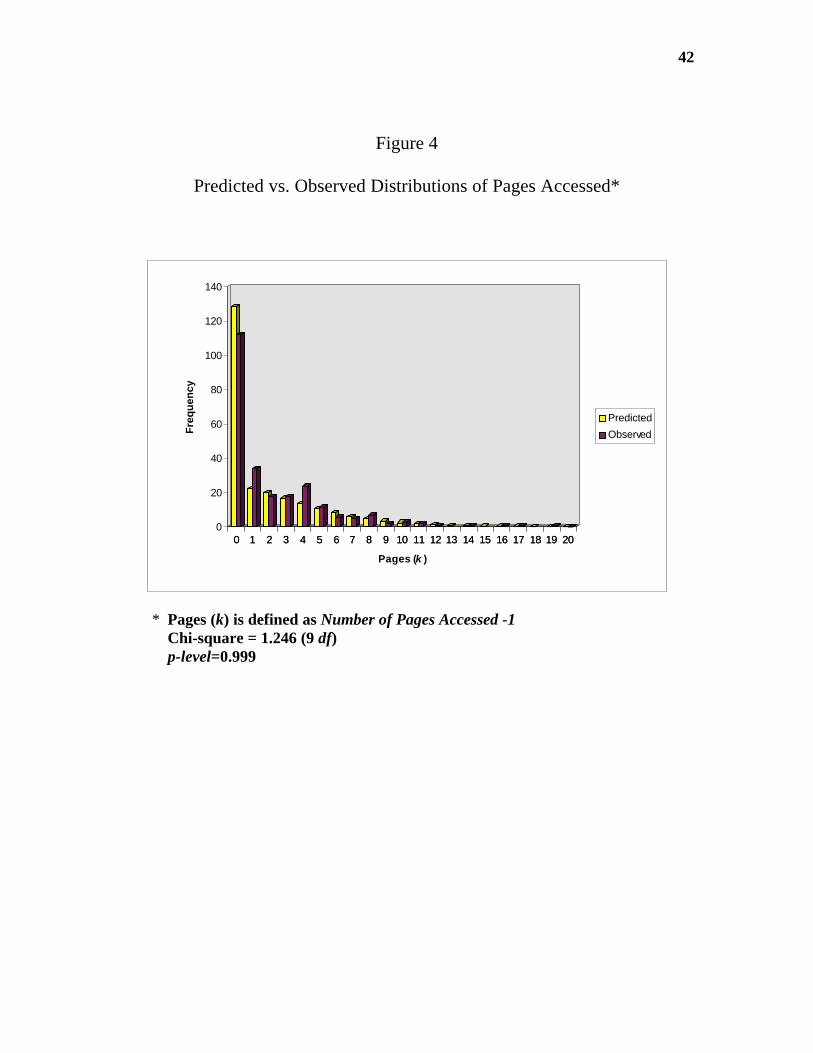
Another test of the Poisson model’s overall predictive goodness of fit, involved
the evaluation of the theoretical Poisson distribution in (1) by using values of the
independent variables, from the holdout sample period, in the model estimated from the
test data sample shown in Table 4. Hence, we predicted and then aggregated the Poisson
probabilities over each of the 248 visitors in the holdout sample. Thus, as illustrated in
Figure 4, we found a relatively good compatibility between the predicted and observed
frequencies of the random variable k, (Number of Pages Accessed - 1) over the entire
holdout sample. We further performed a chi-square test to examine the coincidence
between the observed and predicted distributions shown in Figure 4. Here, we found a p-
level=0.999 which suggested the rejection of a null hypothesis of independence between
the predicted and observed distributions. This test provides yet additional support for the
model’s predictive ability. Moreover, it suggests the potential use of a distribution of
pages accessed for a Web site (Drèze and Zufryden, 1997) as an effectiveness measure in
a manner similar to the use of a distribution of advertising exposures in media analysis
(Hulk and Thomas, 1973; Zufryden, 1987; and Pedrick and Zufryden, 1991).
Simulate Web Site Alternatives
An essential purpose of our proposed methodology is to permit the evaluation of
Web site content characteristics so as to arrive at an improved design for our study Web
26
site. As noted above, the analysis provides information concerning those explanatory
variables (including Web site content design features) that are expected to most enhance
overall Web site effectiveness. Moreover, based on the proposed methodology, a
decision-maker can easily evaluate alternative Web site configurations, by specifying
specific levels of a proposed Web site’s attributes (e.g., Background, Image Size, Sound
File Display, Celebrity Endorsements, etc.) in equations (2) and (3). This provides
corresponding effectiveness value measures for both Number of Pages Accessed andTime
Spent, as well as information about potential trade-offs between the measures.
Here, we illustrate how trade-offs among alternative Web site configurations may
be analyzed by means of an efficient frontier method (Hauser and Shugan, 1983). Our
approach was to simulate the “full factorial” Web site profiles that could be generated
from the attributes that were studied (both from our controlled and natural experimental
conditions). Thus, given that there are three Backgrounds and two of each of Image Size,
Sound File Display, Celebrity Endorsement, Java and Frame levels, respectively, a total
of 3*24 = 96 Web site configurations were defined. We then evaluated the characteristics
of each of these sites (by appropriately setting the dummy variables) in each of the
effectiveness model equations (2) and (3) to estimate the corresponding values of average
Number of Pages Accessed and average Time Spent (in seconds), respectively. We then
plotted the corresponding coordinates for each of the 96 possible Web site designs (see
Figure 5).
Obviously, subject to certain Web site capacity constraints, site configurations
that can achieve higher values with respect to both Time Spend and Number of Pages
Accessed by site visitors are more desirable from a Web site owner’s point of view. This
27
is because a site owner should desire to maximize both the breadth and depth of exposure
to a Web site’s promotional contents. These configurations should suggest greater
attractiveness from the viewpoint of Web surfers as well. Thus, as we move in a
northeast direction in Figure 5, we can find more attractive site configurations. In
particular, the most desirable Web configurations are those whose coordinates lie on the
outermost portions of the graph.
For example, in Figure 5, it is noted that one of the configurations for which
Celebrity Endorsement was also placed, within the main text body of the site, provides
one of the more desirable site configurations in terms of our two effectiveness
dimensions. However, it is observed that there may be trade-offs involved with further
variations in site design characteristics. Thus, by also providing a Tiled background, the
Number of Pages Accessed tends to increase further. However, this is at the cost of some
reduction in the amount of Time Spent. By subsequently adding Frame capabilities, the
average Number of Pages Accessed is seen to further increase. However, this too further
decreases the amount of Time Spent. Thus, efficient frontier analysis suggests that there
are three Web site configurations which dominate other configurations. Therefore, the
choice of the best Web site configuration depends on how a decision-maker (e.g., Web
site owner) trades off one effectiveness dimension for the other (i.e., Number of Pages
Accessed vs. Time Spent). Hence, it is clear that our model provides a potentially useful
approach for evaluating and designing Web site contents and configurations. Moreover,
it provides a useful approach for evaluating the potential effectiveness trade-offs that may
result from variations in Web site features.
28
Conclusion
In this paper we described a conjoint-based methodology for evaluating the
effectiveness of content on the Web. The methodology is based on an experimental
procedure that permits the testing and measurement of alternative attribute designs in a
manner that is unobtrusive, timely, cost-effective, as well as free of random sampling
error, directly on the Web.
We illustrated the application of the methodology to the design of a Web site that
promoted and marketed CD music products on the Web. In this illustrative case, our
methodology permitted us to develop effectiveness measures as functions of explanatory
variables. In particular, we found that Number of Pages Accessed and the Time Spent
were potentially useful and relevant effectiveness measures which could be explained by
independent variables for attributes that included Background, Image Size, Sound File
Display, Celebrity Endorsement, Use of Java and Frames, as well as Operating System.
However, our methodology has some limitations that should be noted. As has
been described, our approach assigns a unique Web test site to each visitor on the basis of
a visitor’s distinct Internet Protocol Address (IP address). However, it was noted that
repeat visitors might have a different IP address when they access a site from a given
provider, or if they use different computers to access a site. To mitigate this problem, we
only used the first half of the IP address for our randomization to insure that every
computer from the same organization accesses the same Web configuration (e.g., all
users accessing the test site from AOL will see the same Web site).
Another limitation of our study is that data on site visitor characteristics were not
available for this study. At present, with the exception of panel data samples, such as
29
those from the NPD Group which is limited to demographics of PC users (Novak and
Hoffman, 1996), individual surfer data corresponding to unique visitors on the Web (e.g.,
demographics) are not generally available. One way of obtaining such data is through
(obtrusive) survey methods such as on-site registrations on the Web. Unfortunately,
visitor registrations can only be done on a voluntary basis and therefore are inherently
biased, as they are neither census-based nor representative, from a statistical standpoint,
because of their inherent self-selection biases. Third party companies, such as Netcount,
are currently exploring the issue of tracking individual surfer characteristics on the Web
in less obtrusive ways.
A final limitation of our study involves the effectiveness measures used to
evaluate the various test sites. It might be argued that although Time Spent on a Web site
and Number of Pages accessed during a site visit should be expected to relate to visitors’
purchase behavior, it would be desirable to use an objective function expressed directly in
terms of sales or profitability. This can be accomplished if one tracks individual
purchases in addition to data such as that gathered in our study. In fact, we attempted to
track individual visitor purchases. Unfortunately, the relatively low traffic to the Web
site and the sparseness of the purchase data precluded a meaningful analysis of sales or
profitability in this case.
Despite these limitations, our methodology suggests a great deal of promise as a
useful tool for studying Web site promotional content effectiveness and designing Web
site content. As tracking measures on the Web become more refined in the future, it is
expected that accurate individual measurements will ultimately be available that will
provide not only unique individual user behavior patterns (e.g., the specific click streams
30
of unique site visitors) but also the specific characteristics of the site visitors (e.g.,
demographics). Thus, it is expected that the Web will eventually come closer to fulfilling
its potential and promise as the ultimate medium for market segmentation at the
individual consumer level - that is, for targeting unique individual surfers with
individually-designed promotions, content, products and services on the Web.
31
References
CASIE, “CASIE Guiding Principles of Interactive Media Audience Measurement,”
Coalition for Advertising Supported Information and Entertainment, 1995.