Texas Medicaid Managed Care and Children’s Health Insurance Program External Quality Review Organization Summary of Activities and Trends in Healthcare Quality Addendum: Performance Improvement Projects and Encounter Data Validation Contract Year 2015 Measurement Period: 2014 through 2015 The Institute for Child Health Policy University of Florida The External Quality Review Organization for Texas Medicaid Managed Care and CHIP
Transcript
Texas Medicaid Managed Care and Children’s Health Insurance Program
External Quality Review Organization Summary of Activities and Trends in
Healthcare Quality Addendum: Performance Improvement Projects and Encounter Data Validation
List of Tables Table 1. Performance Improvement Project Validation – Components of Plan Assessment....... 7 Table 2. Performance Improvement Project Validation – Components of First Progress Report Assessment ............................................................................................................................... 9 Table 3. Performance Improvement Project Validation – Components of Second Progress Report Assessment ...................................................................................................................11 Table 4. 2014 Performance Improvement Project Topics and Measures...................................14 Table 5. Performance Improvement Project Counts and Scores by Topic .................................15 Table 6. Performance Improvement Project Evaluations by Activity and Component, Planning Phase .......................................................................................................................................18 Table 7. Performance Improvement Project Evaluations by Activity and Component, Progress Report 1 ....................................................................................................................................19 Table 8. Interventions at the Member, Provider, and System Levels .........................................20 Table 9. Evaluation Scores for Performance Improvement Projects for HEDIS® Adolescent Well-Care Visits (AWC), Planning Phase and Progress Report 1 ......................................................23 Table 10. Evaluation Scores for Performance Improvement Projects for HEDIS® Well-Child Visits in the Third, Fourth, Fifth, and Sixth Years of Life (W34), Planning Phase and Progress Report 1 ....................................................................................................................................25 Table 11. Evaluation Scores for Performance Improvement Projects for Asthma, Planning Phase and Progress Report 1 ....................................................................................29 Table 12. Evaluation Scores for Performance Improvement Projects for HEDIS® Follow-Up After Hospitalization for Mental Illness (FUH), Planning Phase and Progress Report 1 .....................34 Table 13. Logistic Regression of Provider Response Rates ......................................................39 Table 14. Number and Percentage of Dental Records Received ..............................................40 Table 15. Method of Delivery Counts and Percentages by Program and Dental Maintenance Organization .............................................................................................................................42 Table 16. Overall Match Rates by Program and Dental Maintenance Organization ..................43 Table 17. Procedure Validation Dispositions by Dental Maintenance Organization ...................43 Table 18. Procedure Validation Counts and Match Rates by Program and Dental Maintenance Organization .............................................................................................................................44 Table 19. Date of Service Validation Counts and Match Rates by Program and Dental Maintenance Organization ...................................................................44 Table 20. Place of Service Validation Counts and Match Rates by Program and Dental Maintenance Organization ...................................................................45 Table 21. Place of Service Counts and Percentages ................................................................46 Table 22. First Tooth ID Validation Counts and Match Rates by Program and Dental Maintenance Organization ...................................................................46
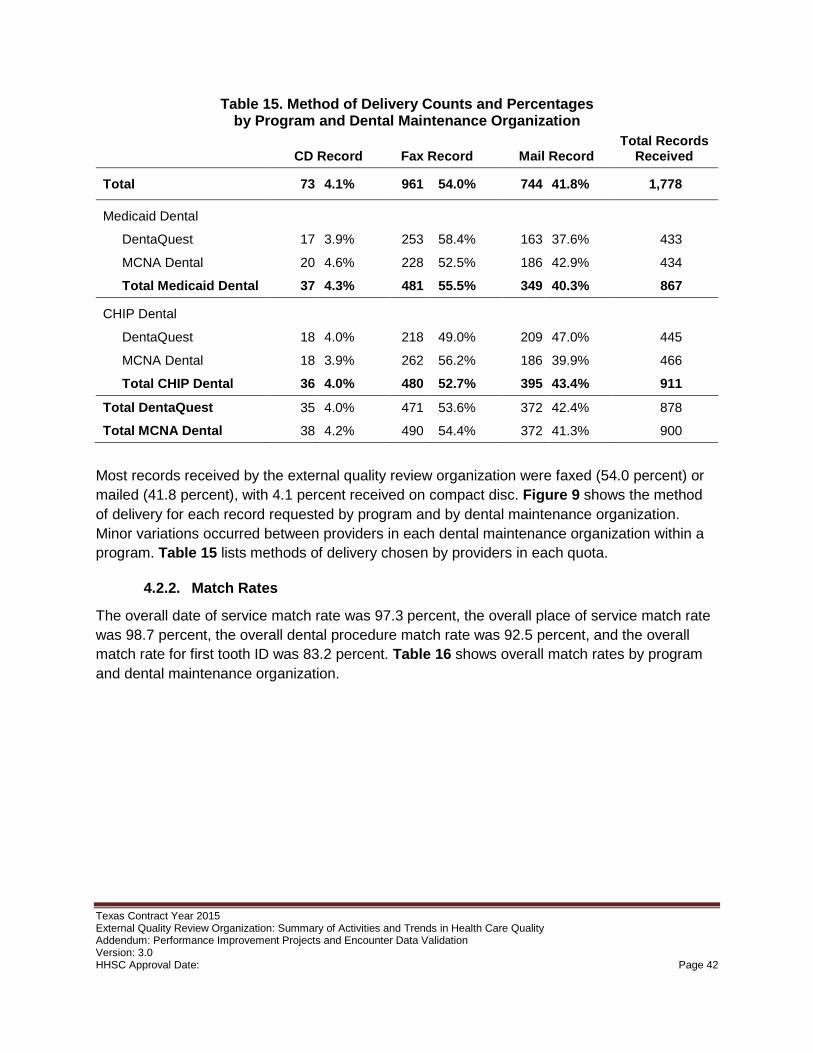
List of Figures Figure 1. Performance Improvement Project Evaluations, Plan and Progress Report 1, by Health Plan, All Programs ....................................................................................................17 Figure 2. HEDIS® Adolescent Well-Care Visits (AWC), CHIP and STAR, 2013-2014 ................26 Figure 3. HEDIS® Well-Child Visits in the Third, Fourth, Fifth, and Sixth Years of Life (W34), CHIP, 2013-2014 ......................................................................................................................27 Figure 4. HEDIS® Asthma Medication Ratio (AMR), Total Controller Medication Ratio >50%, STAR and CHIP, 2013-2014 .....................................................................................................31 Figure 5. HEDIS® Medication Management for People with Asthma (MMA), Medication Compliance 75% of Treatment Period (total), STAR, CHIP, and STAR+PLUS, 2013-2014 .......32 Figure 6. HEDIS® Follow-Up After Hospitalization for Mental Illness (FUH), 7 Days, STAR, STAR Health, and NorthSTAR, 2013-2014 ....................................................................35 Figure 7. HEDIS® Follow-Up After Hospitalization for Mental Illness (FUH), 30 Days, STAR, STAR Health, and NorthSTAR, 2013-2014 ....................................................................35 Figure 8. Dispositions of Dental Records Requested by Program and Dental Maintenance Organization ...................................................................41 Figure 9. Method of Delivery of Dental Records Requested by Program and Dental Maintenance Organization .............................................................................................................................41
1. Executive Summary 1.1. Introduction
This report addendum summarizes evaluation activities conducted by the Institute for Child Health Policy at the University of Florida to meet federal requirements for external quality review of Texas Medicaid managed care and the Children's Health Insurance Program (CHIP). The Institute for Child Health Policy has served as the external quality review organization for the Texas Health and Human Services Commission (HHSC) since 2002. The findings discussed in this report are based on performance improvement project (PIP) review and encounter data validation activities conducted during fiscal year 2015, and supplement the primary annual report document titled Texas Medicaid Managed Care and Children’s Health Insurance Program: External Quality Review Organization Summary of Activities and Trends in Healthcare Quality, Contract Year 2015.
The review is structured to comply with the Centers for Medicare and Medicaid Services (CMS) federal guidelines and protocols, and addresses care provided by managed care organizations participating in STAR, CHIP, STAR+PLUS, STAR Health, NorthSTAR, Medicaid Dental, and CHIP Dental.1
1.2. Methodology, Findings, and Recommendations Performance Improvement Project Evaluation
All 22 health plans serving Texas Medicaid and CHIP (including 19 managed care organizations, 2 dental maintenance organizations, and 1 managed behavioral health organization) implemented two performance improvement projects (PIPs) for each of their participating programs in 2014 and 2015. This indicates 100 percent compliance with State requirements on the number of required PIPs. Health plans selected topics from among choices that reflected overarching goals specified by the State based on external quality review organization feedback. In total, 92 PIPs were conducted and evaluated. The five most common topics included: well-visits for children and adolescents (27 projects); asthma (26 projects); behavioral health (8 projects); diabetes (6 projects); and cellulitis (5 projects).
Overall PIP scores
Health plans participating in Medicaid or CHIP in Texas are required to conduct PIPs on a two year cycle. Each such project is designed to improve performance on one or more measures or indicators through a series of interventions acting at the level of members, providers, or the health system. The current cycle of PIPs were planned in 2013, initiated at the start of 2014, and continued through 2015. The external quality review organization assessed each project plan prior to implementation and provided each health plan individual evaluations and recommendations in two sets of progress reports.
Texas Contract Year 2015 External Quality Review Organization: Summary of Activities and Trends in Health Care Quality Addendum: Performance Improvement Projects and Encounter Data Validation Version: 3.0 HHSC Approval Date: Page 1
Following guidance from CMS, the external quality review organization assessed seven activities related to planning and implementing PIPs. Review of the identified study population was the highest performing of these activities. Nearly every proposed project clearly defined a study population, documented the study condition among members, and considered and addressed special health care needs. The external quality review organization noted an opportunity for improvement in evaluating the extent to which each PIP documented consideration for the literacy and cultural needs of the population.
The external quality review organization developed a reporting template similar to the planning phase protocol but focused on PIP progress and ongoing evidence-based alterations to each project. Progress Report 1 evaluated progress after six months and focused on a single activity – measures, interventions, and improvement strategies – consisting of eight components. The health plans effectively provided clear descriptions of the next steps planned for each PIP as well as identified the appropriate member groups and reasonable vehicles of communication; the average score on these three activities was over 90 percent. Of the 92 projects, 47 experienced one or more substantial challenges or barriers in the implementation phase. The overall score for the component evaluating the adequacy of the reach of each project was 45.1 percent. At the time of Progress Report 1, a number of interventions had not been implemented, had been incompletely implemented, or were being revised to overcome barriers.
In early 2015, the external quality review organization revised and updated the Progress Report template that was to be used for the eighteen month PIP update submission. The revised template captures details of the activities related to the health plans’ monitoring and tracking of the PIP progress. During the course of implementing the PIPs, several health plans made modifications to their interventions either by adding new interventions, retiring existing interventions, or modifying existing interventions. These modifications, however, were not fully documented on the progress report resulting in lower overall scores on the PIP Progress Report 2. Technical assistance calls were scheduled with all plans scoring more than 5 points below the average (approximately half of the health plans) to discuss the health plans' PIP progress and evaluations. During these calls, it was determined that the lower scores were partly due to reporting errors (changes to the PIP interventions were not properly documented in the template). Therefore, the PIP Progress Report 2 scores will not be publicly reported.
.
Projects and Interventions
The 22 health plans conducted 92 PIPs in 2014 and 2015. Each PIP was composed of multiple interventions implemented at the member-level (245 interventions), provider-level (263 interventions), or system-level (100 interventions). Some interventions operated at more than one level (122 interventions).
Well care for children and adolescents comprised the most common topic of intervention, with 27 of 92 projects focused on improvements in this topic area. Interventions included physician support by identifying members overdue for an appointment and mobile health clinics which Texas Contract Year 2015 External Quality Review Organization: Summary of Activities and Trends in Health Care Quality Addendum: Performance Improvement Projects and Encounter Data Validation Version: 3.0 HHSC Approval Date: Page 2
addressed member needs while providing culturally and linguistically appropriate educational materials describing healthy behaviors and available resources.
Asthma ranked as the second most common topic, with 26 of 92 projects in this topic area. Face-to-face educational sessions between caregivers of children with asthma and providers at the point of care during asthma-related hospital visits were one of the interventions implemented to prevent future asthma-related hospital visits.
The third most common topic of PIPs consisted of behavioral health, with 8 of 92 projects in this topic area. Some intervention topics included promoting member medication adherence and setting up outpatient follow-up appointments when members were discharged from inpatient settings. These types of interventions aimed to reduce treatment barriers and involve members in their own care.
Preliminary recommendations
The external quality review organization made individual recommendations based on each PIP during the planning phase and in progress reports at 6 and 18 months. Final recommendations and evaluations will be made after each project concludes.
Encounter Data Validation
The external quality review organization annually validates encounter data for accuracy and completeness by comparing submitted claims against a representative sample of dental or medical records. In 2015, dental records were reviewed for the Medicaid Dental and CHIP Dental programs. Using dental records received directly from Texas Medicaid and CHIP providers, the external quality review organization examined the claims data for the corresponding members to validate whether each data element could be matched in both sources. The external quality review organization calculated match rates for: procedure, date of service, place of service, and tooth identification for up to two teeth.
Dental records
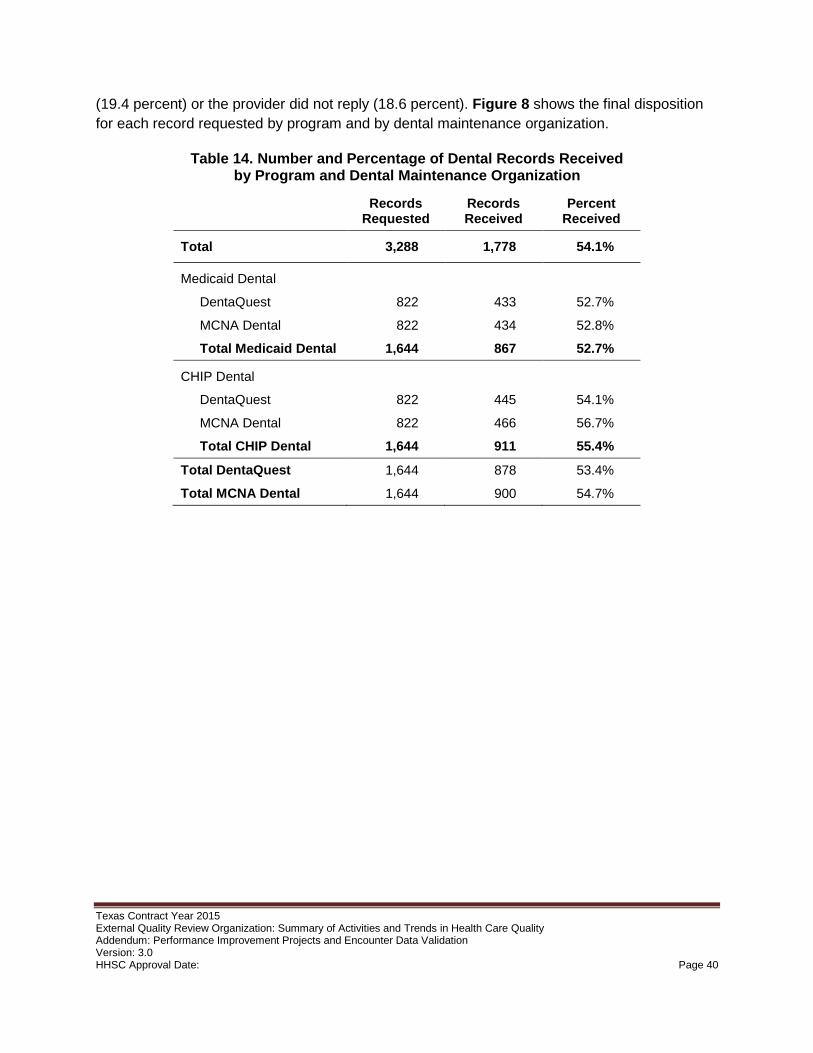
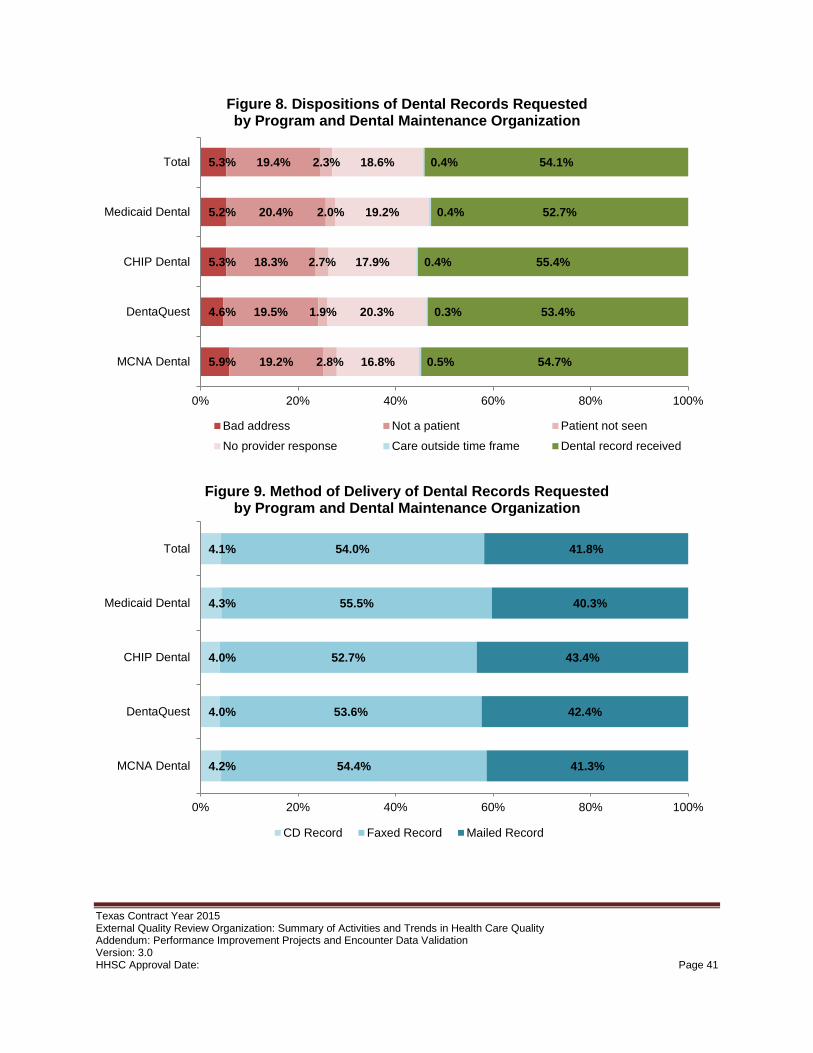
The external quality review organization requested 822 records from each dental maintenance organization in each program, for a total of 3,288 records. The overall record return rate was 54.1 percent, for a total of 1,778 records received. Of these records, 46 corresponded to members whose claims were conducted in 2013, which was outside of the sampling time frame for this study; thus, the external quality review organization excluded these claims. The external quality review organization calculated match rates for the remaining 1,732 dental records.
Match rates
The findings show a high level of quality of encounter data in Texas Medicaid Dental and CHIP Dental. Overall match rates for both date of service and place of service exceeded 97 percent. Overall dental procedure match rate was 92.5 percent and the overall match rate for first tooth ID was 83.2 percent.
Texas Contract Year 2015 External Quality Review Organization: Summary of Activities and Trends in Health Care Quality Addendum: Performance Improvement Projects and Encounter Data Validation Version: 3.0 HHSC Approval Date: Page 3
2. Introduction Validation of Medicaid managed care performance improvement projects (PIPs) is one of the key federally mandated activities of an external quality review organization.2 All health plans that participate in state Medicaid programs must design, implement, and assess PIPs that cover specific problems and populations, with the aim of improving quality of care and health outcomes for Medicaid beneficiaries. This report follows CMS protocols for PIP validation and reporting by external quality review organizations, including: (1) a description of the manner in which data were aggregated and analyzed and the conclusions drawn in regard to the quality, timeliness, and access to care provided by the managed care organizations; (2) an assessment of the overall validity and reliability of PIP study results, including reference to any potential threats to accuracy or confidence in reporting; and (3) a description of PIP interventions and outcomes associated with each state-required PIP topic.3
This report also shows findings of encounter data validation studies conducted by the external quality review organization to assess the quality of administrative claims and encounter data generated by the managed care organizations. Encounter data validation is considered by CMS to be an optional activity for external quality review organizations. The data elements assessed in these studies – in particular, dental procedures – are important for assessing health care quality through performance measures that rely on administrative data and for conducting risk assessment and rate setting.
For each activity, this report provides results stratified by health plan, meeting CMS requirements to show comparative performance results among Medicaid managed care health plans. The report also provides recommendations made by the external quality review organization in 2015 for improving PIPs and the quality of administrative claims and encounter data, as well as an assessment of the extent to which recommendations were followed by health plans based on prior-year activities.
Percentages shown in most figures and tables in this report are rounded to the first decimal place, and therefore may not add up to 100 percent.
2.1. Managed Care Programs and Participating Managed Care Organizations In 2014, Texas Medicaid and CHIP benefits were administered through the following programs:
• STAR – The State of Texas Access Reform (STAR) program provides managed care in coordination with 18 health plans to the majority of Texas Medicaid beneficiaries.
• STAR+PLUS – The STAR+PLUS program integrates acute health services with long-term services and supports in coordination with five health plans.
• STAR Health – This managed care program covers children and adolescents in state conservatorship and young adults previously in foster care and receiving Medicaid, up to age 20; members may elect to enroll in a STAR plan upon their eighteenth birthday, and
Texas Contract Year 2015 External Quality Review Organization: Summary of Activities and Trends in Health Care Quality Addendum: Performance Improvement Projects and Encounter Data Validation Version: 3.0 HHSC Approval Date: Page 4
may continue to receive Medicaid benefits through the STAR plan of their choice up to age 26. In 2014, the sole managed care organization for STAR Health was Superior HealthPlan.
• NorthSTAR – NorthSTAR provides managed behavioral health services for STAR and STAR+PLUS members who live in the Dallas service area.
• CHIP – The Children's Health Insurance Program provides managed care through 17 health plans to children in families whose income is too high to qualify for Medicaid but too low to afford private insurance for their children.
• Medicaid Dental – The Texas Medicaid Dental program provides dental services through two dental maintenance organizations for most children and young adults ages 20 and younger enrolled in Texas Medicaid.
• CHIP Dental – The CHIP Dental program provides dental services through two dental maintenance organizations for all children and adolescents ages 18 and younger enrolled in CHIP.
Currently, 22 health plans serve the Texas Medicaid and CHIP populations, including one managed behavioral health organization (MBHO), two dental maintenance organizations (DMOs), and 19 managed care organizations (MCOs).
3. Performance Improvement Project Validation Performance improvement project validation is a mandatory external quality review organization activity per 42 CFR §438.358(b)(1). The external quality review organization annually reviews the Texas Medicaid managed care organization performance improvement projects (PIPs) to evaluate aspects of structure and process that contribute to the success of these programs. This section presents assessments of study methodologies and evaluations of overall validity and reliability of PIP results following guidance by the Centers for Medicare and Medicaid Services (CMS) on required external quality review organization activities.4
Health plans participating in Medicaid or CHIP in Texas now are required to conduct PIPs on a two-year cycle. Previously, PIPs were conducted on a one-year cycle. The Texas Health and Human Services Commission is transitioning to a staggered two-year cycle to allow more time for each project to develop improvements, to alleviate planning burden, and to facilitate use of feedback from completed PIPs in the design of new projects. The PIPs described in this section were planned in late 2013, initiated in 2014, and continued or adapted in 2015. Based on overall project effectiveness, the external quality review organization selected one PIP for each health plan in each program to be retired at the end of 2015 and one to continue for a third year. Each year starting in 2017, each health plan will conduct two PIPs: one initiated that year and one initiated the year prior. The NorthSTAR program for behavioral health services in the Dallas region will terminate at the end of 2016; the behavioral health organization ValueOptions, the sole provider for NorthSTAR, will continue only one PIP initiated in 2014 through 2016.
Texas Contract Year 2015 External Quality Review Organization: Summary of Activities and Trends in Health Care Quality Addendum: Performance Improvement Projects and Encounter Data Validation Version: 3.0 HHSC Approval Date: Page 5
3.1. Methodology The Texas external quality review organization assesses the study methodology, evaluates the overall validity and reliability of study results, and makes recommendations for each PIP by each health plan participating in Medicaid or CHIP in Texas. In 2014 and 2015, these health plans included 19 managed care organizations, two dental maintenance organizations, and one behavioral health organization. Each health plan implemented two PIPs for each program of participation; over the course of the study period, some aspects of various projects and interventions were replaced or retired in response to feedback from the external quality review organization or internal monitoring. The external quality review organization evaluates and provides feedback and recommendations for each PIP at the planning phase, at two or three mid-year reviews, and at the conclusion of the two- or three-year cycle.
Following guidance by CMS, the external quality review organization systematizes evaluation of each PIP according to several activities, each of which comprises one or more components. Activities for the planning phase, progress reports, and final evaluation differ for each phase. Scoring for each component of each activity for each PIP is based on a three-point scale: component met (100 percent), component partially met (50 percent), or component not met (0 percent). The score for each activity is the average of component scores. The score for each performance project at each phase is the average of all activity scores.
For each unique PIP submitted by a health plan, the external quality review organization conducted a review and generated a score derived from the activities outlined in Table 1. The external quality review organization will evaluate additional activities related to project completion, such as sustained improvement and articulated future plans, at the conclusion of each project. A well-designed PIP should: address an identified need among members; have a clearly articulated end goal; use reliable and objective measures of a clearly defined population; use interventions based on root causes; and incorporate continual review and improvement. Where a PIP did not fully meet a component, the external quality review organization recommended steps the health plan could take to meet the component.
Texas Contract Year 2015 External Quality Review Organization: Summary of Activities and Trends in Health Care Quality Addendum: Performance Improvement Projects and Encounter Data Validation Version: 3.0 HHSC Approval Date: Page 6
Table 1. Performance Improvement Project Validation – Components of Plan Assessment
Activity Component
1. Review of Selected Topic • Prevalence in the population
2. Review of Study Questions • Study question(s) stated in the required format
3. Select Study Indicators • Objective and clearly defined measurable indicators • Available and valid data collected • Appropriate and reliable measures of changes • Appropriate baseline and reported rates • Appropriate timeframes for baseline and follow-up • Appropriate target improvement goal
4. Review of the Identified Study Population
• Study population clearly defined • Applicable study population enrolled • Special health care needs addressed
5. Sound Sampling Methods • Sound sampling and data collection methods
• Identified sample size
6. Plan to Collect Reliable Data • Specify data elements and sources
• Instruments provide consistent and accurate data
• Collection of data by qualified staff or personnel
• Clear and concise instructions for data collection process
7A. Root Cause Analysis and Existing Interventions
• Root cause analyses: factors related to topic
• Identified existing interventions
7B. Intervention and Improvement Strategies (Implementation)
• Interventions to address causes and barriers
• Interventions appropriate for identified group
• Vehicles of communication reasonable
• Literacy and cultural needs addressed
• Interventions described in detail
• New intervention
Each PIP plan the external quality review organization receives from the health plans is divided into sections corresponding to the activities outlined above. As described previously, the external quality review organization assessed the documentation of each component of each activity on a three-point scale: component met (100 percent), component partially met (50 percent), or component not met (0 percent). The overall score for each activity is an equally-weighted composite of the scores on all individual components. The total score for a PIP is the equally-weighted average of all activities.
Texas Contract Year 2015 External Quality Review Organization: Summary of Activities and Trends in Health Care Quality Addendum: Performance Improvement Projects and Encounter Data Validation Version: 3.0 HHSC Approval Date: Page 7
1. Review of Selected Study Topic – The external quality review organization reviews each PIP plan study topic and the supporting evidence for the selection process. Topic selection should be based on the results of monitoring and evaluation of clinical and service indicators.
2. Review of Study Questions – The external quality review organization reviews the research question posed by each PIP (e.g., “Does X result in Y?”) and supporting evidence. Study questions should be well specified and quantifiable.
3. Review of Study Indicators – The external quality review organization reviews the study measures and indicators the health plan intends to use to observe any changes over the course of each PIP, as well as supporting evidence for selecting each measure. Many health plans use measures from the Healthcare Effectiveness Data and Information Set (HEDIS®) or other widely recognized and validated measures with standardized numerators and denominators. Selection of study indicators should be based on the health plan’s root cause analysis to identify the underlying cause of the problem. This activity includes components evaluating both the data collection plan and the appropriateness of the improvement goal specified; target improvement goals should be both attainable and meaningful.
4. Review of Identified Study Population – The external quality review organization reviews the population of interest specified for the project (e.g., all STAR members, or only STAR members ages three to six years). If a subset of the total population is used, the study population should be representative and generalizable.
5. Review of Sampling Methods – The external quality review organization reviews the sampling methods each PIP employs. The health plan submits documentation supporting the frequency of occurrence of the problem in the study population and the number of members needed in the sample in order to produce valid and reliable results. Use of certain widely-recognized measures is taken to meet this component provided the project follows the measure specifications. Sampling is not required for: NCQA HEDIS® measures, 3M™ Potentially Preventable Events measures, or AHRQ PDI or PQI measures, unless the measure itself calls for sampling (e.g., hybrid HEDIS® measures).
6. Review of Data Collection Plan – The external quality review organization reviews the data to be collected and the plan to do so. The data collection plan should include identification of data sources, instruments used to collect data, and who will collect the data. If NCQA HEDIS® measures, 3M™ Potentially Preventable Events measures, or AHRQ PDI or PQI measures are used and those methodologies followed, no further specification of the data collection process is required.
7A. Review of Root Cause Analysis and Existing Interventions – The external quality review organization reviews health plan submissions documenting root cause analysis for each PIP topic, including any interventions already in place to improve the topic.
Texas Contract Year 2015 External Quality Review Organization: Summary of Activities and Trends in Health Care Quality Addendum: Performance Improvement Projects and Encounter Data Validation Version: 3.0 HHSC Approval Date: Page 8
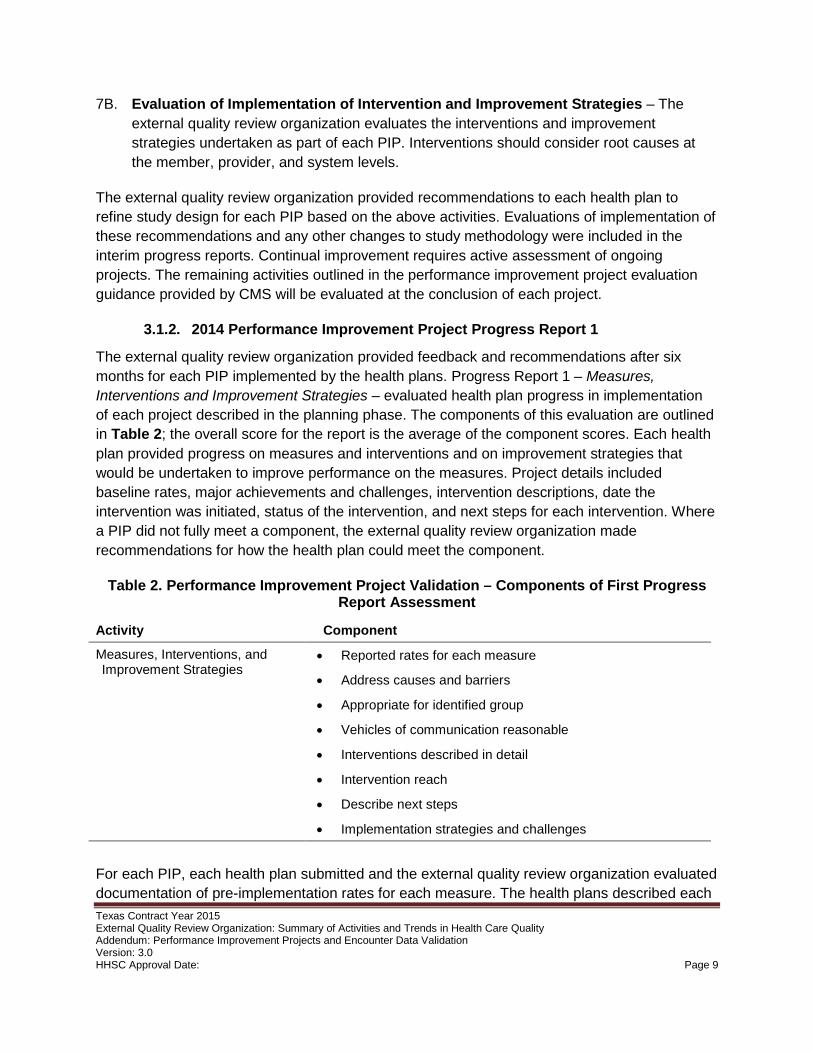
7B. Evaluation of Implementation of Intervention and Improvement Strategies – The external quality review organization evaluates the interventions and improvement strategies undertaken as part of each PIP. Interventions should consider root causes at the member, provider, and system levels.
The external quality review organization provided recommendations to each health plan to refine study design for each PIP based on the above activities. Evaluations of implementation of these recommendations and any other changes to study methodology were included in the interim progress reports. Continual improvement requires active assessment of ongoing projects. The remaining activities outlined in the performance improvement project evaluation guidance provided by CMS will be evaluated at the conclusion of each project.
The external quality review organization provided feedback and recommendations after six months for each PIP implemented by the health plans. Progress Report 1 – Measures, Interventions and Improvement Strategies – evaluated health plan progress in implementation of each project described in the planning phase. The components of this evaluation are outlined in Table 2; the overall score for the report is the average of the component scores. Each health plan provided progress on measures and interventions and on improvement strategies that would be undertaken to improve performance on the measures. Project details included baseline rates, major achievements and challenges, intervention descriptions, date the intervention was initiated, status of the intervention, and next steps for each intervention. Where a PIP did not fully meet a component, the external quality review organization made recommendations for how the health plan could meet the component.
Table 2. Performance Improvement Project Validation – Components of First Progress Report Assessment
Activity Component
Measures, Interventions, and Improvement Strategies
• Reported rates for each measure
• Address causes and barriers
• Appropriate for identified group
• Vehicles of communication reasonable
• Interventions described in detail
• Intervention reach
• Describe next steps
• Implementation strategies and challenges
For each PIP, each health plan submitted and the external quality review organization evaluated documentation of pre-implementation rates for each measure. The health plans described each Texas Contract Year 2015 External Quality Review Organization: Summary of Activities and Trends in Health Care Quality Addendum: Performance Improvement Projects and Encounter Data Validation Version: 3.0 HHSC Approval Date: Page 9
intervention in detail, and the external quality review organization evaluated the likelihood that the intervention would address identified causes and barriers, the appropriateness for the identified members or providers or to the system, and the reach, including the number of members or providers affected. Finally, the external quality review organization examined the next steps planned for each PIP, including plans to revise strategies and address any challenges encountered in implementation. The external quality review organization provided feedback and recommendations based on each component of each PIP. The final Progress Report 1 score is the equally weighted average of each component on a three-point scale: component met (100 percent), component partially met (50 percent), or component not met (0 percent).
The external quality review organization provided feedback and recommendations in the second mid-year progress report 18 months after initiation for each PIP. Performance improvement project Progress Report 2 evaluated health plan progress in monitoring and continual improvement. The components of this evaluation are outlined in Table 3; future progress reports will use these evaluation criteria. Where a PIP did not fully meet a component, the external quality review organization made recommendations for how the health plan could meet the component.
Texas Contract Year 2015 External Quality Review Organization: Summary of Activities and Trends in Health Care Quality Addendum: Performance Improvement Projects and Encounter Data Validation Version: 3.0 HHSC Approval Date: Page 10
Table 3. Performance Improvement Project Validation – Components of Second Progress Report Assessment
Activity Component
Required Documentation • All required documentation submitted
Previous PIP Evaluation Recommendations
• Address previous PIP evaluation recommendations
1. PIP Performance Measures and Indicators
• Reported rates for each measure
2. Major Achievements and Challenges to Date
• PIP achievements described
• PIP challenges and progress described
3. Status of Interventions • Report on all interventions
• Provide justification for added or newly implemented interventions
• Interventions implemented on planned start date
• Report number and percentage of members or providers attempted and reached
• Tracking and monitoring efforts
• Modifications to interventions described
• Validity of modifications to interventions
• Reported intervention barriers
• Specify provider engagement
A successful PIP includes monitoring to ensure consistent implementation, to make adjustments where an intervention is not performing as desired, and to introduce new interventions to address newly identified barriers. Each health plan submitted documentation of any changes made to ongoing PIPs (e.g., removing the measure HEDIS® Use of Appropriate Medications for People With Asthma (ASM), which is being retired by NCQA) and described in detail steps taken to address previous recommendations. Each health plan reported the indicators used to evaluate PIP effectiveness, and how these indicators had changed over the baseline measurement when the project launched. Progress reports included major achievements and challenges associated with each PIP, and steps taken to address each challenge. Finally, each health plan reported the status of each intervention along with any necessary modifications and steps taken to engage with and solicit feedback from providers.
Review Documentation – The external quality review organization evaluates the updated revised PIP plans for each health plan. Documentation should include any progress modifications based on ongoing monitoring and should address all recommendations from Progress Report 1.
Texas Contract Year 2015 External Quality Review Organization: Summary of Activities and Trends in Health Care Quality Addendum: Performance Improvement Projects and Encounter Data Validation Version: 3.0 HHSC Approval Date: Page 11
Review Previous PIP Evaluation Recommendations – The external quality review organization evaluates documentation from each health plan detailing actions taken to meet recommendations from Progress Report 1. The external quality review organization also evaluates how each recommendation has been incorporated into the PIP and the extent to which the revised PIP meets each recommendation.
1. Review Performance Measures and Indicators – The external quality review organization evaluates data collection methods and performance on each measure or indicator defined in the PIP. Each submission should include numerator, denominator, performance rate, and dates of measurement for the baseline year and the measurement year.
2. Review Major Achievements and Challenges to Date – The external quality review organization reviews documentation from each health plan detailing progress and challenges. Documentation should include major achievements in meeting the goals of the PIP, challenges encountered, and how those challenges were addressed.
3. Review Status of Interventions – The external quality review organization evaluates documented progress on each intervention. This documentation should include each intervention proposed during the planning stage or implemented since. Any modifications, including introduction or retirement of interventions, should be described in detail, and all new interventions should include documentation (similar to the initial planning phase of the PIP) and justification as to why the new interventions were added. The external quality review organization evaluates the extent to which each modification raises the likelihood of meeting the overall goals of the PIP. Finally, this activity includes a component evaluating provider engagement where applicable and how interventions incorporate provider feedback.
In early 2015, the external quality review organization revised and updated the Progress Report template that was to be used for the eighteen month PIP update submission. The revised template captures details of the activities related to the health plans’ monitoring and tracking of the PIP progress. During the course of implementing the PIPs, several health plans made modifications to their interventions either by adding new interventions, retiring existing interventions, or modifying existing interventions. These modifications, however, were not fully documented on the progress report resulting in lower overall scores on the PIP Progress Report 2. Technical assistance calls were scheduled with all plans scoring more than 5 points below the average (approximately half of the health plans) to discuss the health plans' PIP progress and evaluations. During these calls, it was determined that the lower scores were partly due to reporting errors (changes to the PIP interventions were not properly documented in the template). Therefore, the PIP Progress Report 2 scores will not be publicly reported.
Texas Contract Year 2015 External Quality Review Organization: Summary of Activities and Trends in Health Care Quality Addendum: Performance Improvement Projects and Encounter Data Validation Version: 3.0 HHSC Approval Date: Page 12
3.2. Topics Each health plan selected performance improvement project topics from among options supplied by Texas HHSC and the external quality review organization. Topics offered to each health plan were selected by identifying quality-of-care measures that: (1) had rates below the national mean on the HEDIS® benchmark percentiles for Medicaid; (2) had an eligible denominator of at least 100 members; and (3) presented a meaningful challenge that could be met by the health plan. For health plans that were too new for these criteria to be applied, standard topics that were common for other health plans were used. These selection criteria were applied separately for each health plan participating in each program. Health plans were able to propose an alternative topic, which was reviewed by HHSC and the external quality review organization to ensure that the alternative topic met the preceding criteria. Each health plan implemented two PIPs for each program in which they participate (STAR, CHIP, STAR+PLUS, STAR Health, NorthSTAR, Medicaid Dental, and CHIP Dental); where applicable, the same project could be implemented in and used to meet the requirement for multiple programs. Health plans had the option to conduct collaborative PIPs where opportunities for improvement overlapped between health plans. Fourteen of the 22 health plans chose to collaborate on at least one PIP, forming a total of five collaborative teams. The health plans conducted and the external quality review organization evaluated a total of 92 PIPs (including collaborative projects and projects applied to more than one program). Table 4 lists the final PIP topics; each project used one or more of the listed indicators or related measures to quantify performance improvement. Admissions that were potentially preventable were defined according to the needs of each PIP using such an indicator, and included 3M™ Potentially Preventable Admissions and AHRQ Ambulatory Care Sensitive Conditions.
Overall, health plans implemented 27 PIPs related to routine well-visits for children or adolescents. Asthma was the second most common topic, with 26 projects devoted to improving performance on related measures. All five health plans participating in STAR+PLUS conducted a PIP related to diabetes, and two conducted a project related to COPD. Both dental maintenance organizations aimed for improvements in prophylactic application of sealants and fluoride for both Medicaid Dental and CHIP Dental. Table 5 shows the numbers of PIPs on each topic and average score at the planning phase and first mid-year evaluation. The evaluation scores for the planning phase and the first mid-year progress report represent different activities, as detailed in sections 3.1.1 and 3.1.2; as such, scores for the two evaluation periods should not be interpreted as a trend. Some interventions were altered, initiated, or retired between the two evaluation periods, but the project topics remained constant.
Texas Contract Year 2015 External Quality Review Organization: Summary of Activities and Trends in Health Care Quality Addendum: Performance Improvement Projects and Encounter Data Validation Version: 3.0 HHSC Approval Date: Page 13
Table 4. 2014 Performance Improvement Project Topics and Measures
2014 PIP Topics Measures
Child and adolescent well-care HEDIS® Adolescent Well-Care Visits (AWC), HEDIS® Well-Child Visits in the First 15 Months of Life (W15), and HEDIS® Well-Child Visits in the Third, Fourth, Fifth and Sixth Years of Life (W34)
Annual dental visit HEDIS® Annual Dental Visit (ADV) Antidepressant management in teens and young adults HEDIS® Antidepressant Medication Management (AMM)
Asthma management
HEDIS® Use of Appropriate Medications for People With Asthma (ASM), HEDIS® Asthma Medication Ratio (AMR), HEDIS® Medication Management for People With Asthma (MMA), and condition-related potentially preventable admissions
Childhood vaccinations HEDIS® Childhood Immunization Status (CIS)
Controlling blood pressure HEDIS® Controlling High Blood Pressure (CBP), and condition-related potentially preventable admissions
COPD
HEDIS® Use of Spirometry Testing in the Assessment and Diagnosis of COPD (SPR), HEDIS® Pharmacotherapy Management of COPD Exacerbation (PCE), and condition-related potentially preventable admissions
Diabetes HEDIS® Comprehensive Diabetes Control (CDC), various components, and condition-related potentially preventable admissions and readmissions
Behavioral health hospitalization HEDIS® Follow-Up After Hospitalization for Mental Illness (FUH), and condition-related potentially preventable admissions
Pneumonia Condition-related potentially preventable admissions Potentially preventable admissions and emergency department visits
3M™ Potentially Preventable Events, emergency department visits for non-emergent care
Schizophrenia medication management
HEDIS® Adherence to Antipsychotic Medications for Individuals With Schizophrenia (SAA), HEDIS® Diabetes Screening for People With Schizophrenia or Bipolar Disorder Who Are Using Antipsychotic Medications (SSD), HEDIS® Diabetes Monitoring for People With Diabetes and Schizophrenia (SMD), HEDIS® Cardiovascular Monitoring for People With Cardiovascular Disease and Schizophrenia (SMC)
Sealants and fluoride Percent of members at risk who received dental sealants or fluoride treatments
Substance use disorders HEDIS® Initiation and Engagement of Alcohol and Other Drug Dependence Treatment (IET)
Timeliness of oral evaluation Percent of members who had an oral evaluation within 90 days of enrollment
Texas Contract Year 2015 External Quality Review Organization: Summary of Activities and Trends in Health Care Quality Addendum: Performance Improvement Projects and Encounter Data Validation Version: 3.0 HHSC Approval Date: Page 14
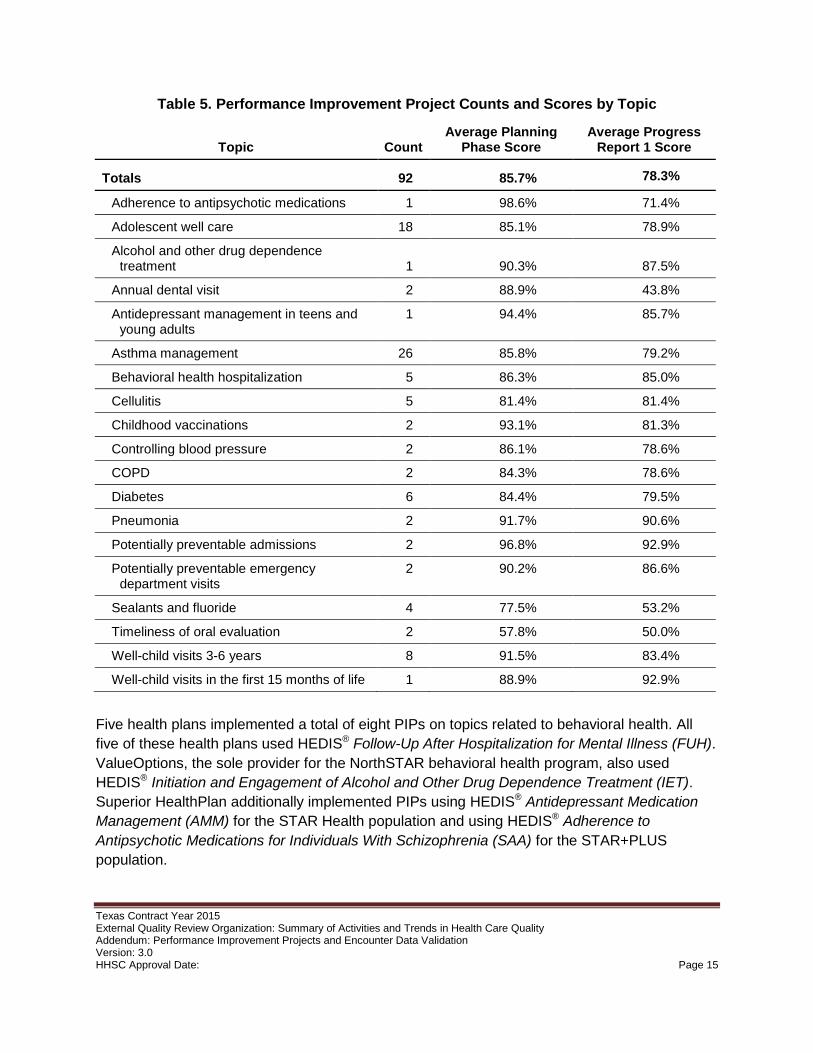
Table 5. Performance Improvement Project Counts and Scores by Topic
Topic Count Average Planning
Phase Score Average Progress
Report 1 Score
Totals 92 85.7% 78.3%
Adherence to antipsychotic medications 1 98.6% 71.4%
Adolescent well care 18 85.1% 78.9%
Alcohol and other drug dependence treatment 1 90.3% 87.5%
Annual dental visit 2 88.9% 43.8%
Antidepressant management in teens and young adults
1 94.4% 85.7%
Asthma management 26 85.8% 79.2%
Behavioral health hospitalization 5 86.3% 85.0%
Cellulitis 5 81.4% 81.4%
Childhood vaccinations 2 93.1% 81.3%
Controlling blood pressure 2 86.1% 78.6%
COPD 2 84.3% 78.6%
Diabetes 6 84.4% 79.5%
Pneumonia 2 91.7% 90.6%
Potentially preventable admissions 2 96.8% 92.9%
Potentially preventable emergency department visits
2 90.2% 86.6%
Sealants and fluoride 4 77.5% 53.2%
Timeliness of oral evaluation 2 57.8% 50.0%
Well-child visits 3-6 years 8 91.5% 83.4%
Well-child visits in the first 15 months of life 1 88.9% 92.9%
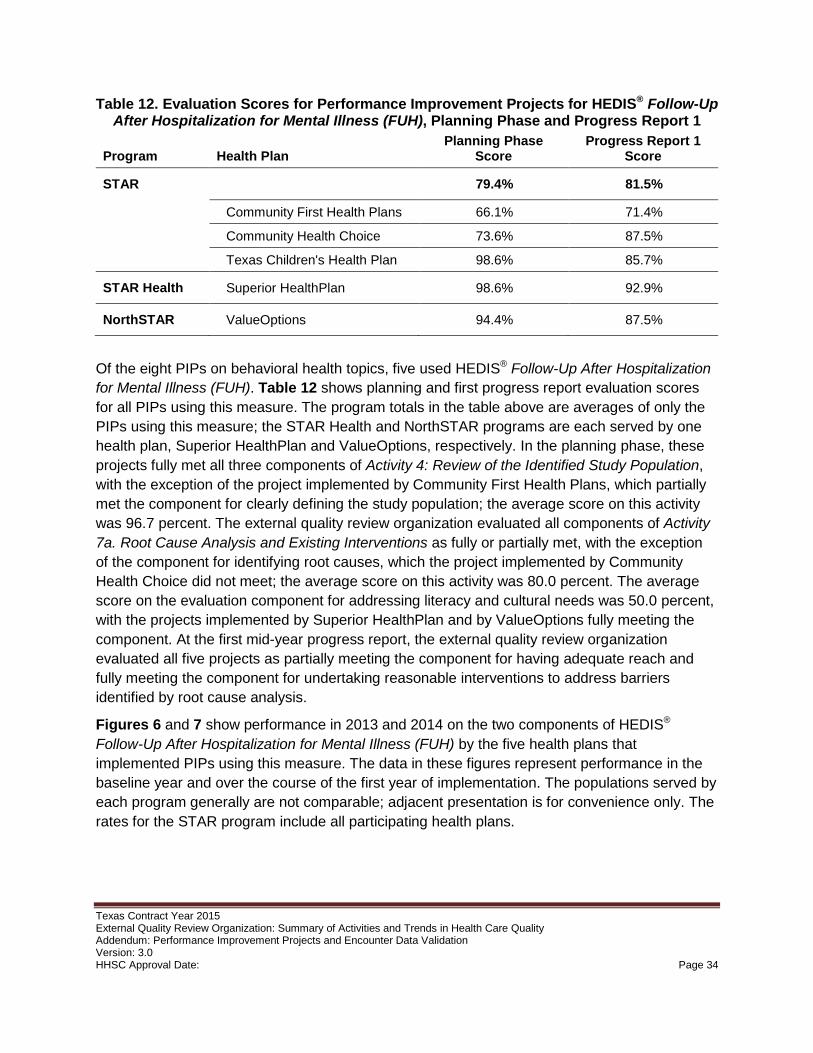
Five health plans implemented a total of eight PIPs on topics related to behavioral health. All five of these health plans used HEDIS® Follow-Up After Hospitalization for Mental Illness (FUH). ValueOptions, the sole provider for the NorthSTAR behavioral health program, also used HEDIS® Initiation and Engagement of Alcohol and Other Drug Dependence Treatment (IET). Superior HealthPlan additionally implemented PIPs using HEDIS® Antidepressant Medication Management (AMM) for the STAR Health population and using HEDIS® Adherence to Antipsychotic Medications for Individuals With Schizophrenia (SAA) for the STAR+PLUS population.
Texas Contract Year 2015 External Quality Review Organization: Summary of Activities and Trends in Health Care Quality Addendum: Performance Improvement Projects and Encounter Data Validation Version: 3.0 HHSC Approval Date: Page 15
3.3. Results Continual improvement builds on responsiveness to active monitoring. The external quality review organization evaluated planning, progress and steps taken in response to ongoing performance measurements for each PIP and provided specific recommendations to each health plan. In the current biennial cycle of performance improvement projects, 2015 marked the second year; the external quality review organization will conduct final reviews for the two-year projects and a third interim progress review for three-year projects in 2016 after measure results for 2015 are available. Figure 1 shows overall scores for each health plan averaged across all PIPs conducted by that health plan. The evaluation scores for the planning phase and the first mid-year progress report represent different activities, as detailed in sections 3.1.1 and 3.1.2; scores for the two evaluation periods should not be interpreted as a trend.
Texas Contract Year 2015 External Quality Review Organization: Summary of Activities and Trends in Health Care Quality Addendum: Performance Improvement Projects and Encounter Data Validation Version: 3.0 HHSC Approval Date: Page 16
Figure 1. Performance Improvement Project Evaluations, Plan and Progress Report 1, by Health Plan, All Programs
71.5%
57.4%
56.3%
73.2%
76.6%
45.9%
84.4%
43.8%
82.2%
89.1%
82.9%
86.5%
87.1%
90.5%
89.3%
87.5%
90.7%
82.2%
84.8%
85.7%
87.5%
87.5%
78.4%
52.8%
64.7%
66.1%
70.4%
73.6%
75.9%
84.3%
84.7%
86.6%
88.5%
88.7%
88.8%
91.0%
91.0%
92.1%
92.4%
92.4%
93.1%
93.9%
94.2%
94.7%
97.2%
85.7%
0% 20% 40% 60% 80% 100%
RightCare fromScott & White Health Plan
Community First Health Plans
DentaQuest
Cigna-HealthSpring
Community Health Choice
Molina Healthcare of Texas, Inc.
Aetna Better Health
MCNA Dental
Driscoll Health Plan
El Paso First Health Plans, Inc.
Parkland CommunityHealth Plan
Amerigroup
CHRISTUS Health Plan
UnitedHealthcareCommunity Plan
Texas Children's Health Plan
ValueOptions
FirstCare
Sendero Health Plans
Superior HealthPlan
Seton Health Plan
Cook Children's Health Plan
Blue Cross Blue Shield of Texas
Average
PIP Plan
Progress Report 1
Texas Contract Year 2015 External Quality Review Organization: Summary of Activities and Trends in Health Care Quality Addendum: Performance Improvement Projects and Encounter Data Validation Version: 3.0 HHSC Approval Date: Page 17
Table 6. Performance Improvement Project Evaluations by Activity and Component, Planning Phase
Activity
Average Activity Score Component
Average Component
Score
1. Review of Selected Topic
85.3% • Prevalence in the population 85.3%
2. Review of Study Questions
94.6% • Study question(s) stated in the required format 94.6%
3. Select Study Indicators
87.5% • Objective and clearly defined measurable indicators
92.4%
• Available and valid data collected 96.7%
• Appropriate and reliable measures of changes 88.0%
• Appropriate baseline and reported rates 84.6%
• Appropriate timeframes for baseline and follow-up 86.4%
• Appropriate target improvement goal 77.2%
4. Review of the Identified Study Population
97.3% • Study population clearly defined 92.9%
• Applicable study population enrolled 98.9%
• Special health care needs addressed 100.0%
5. Sound Sampling Methods
N/A • Sound sampling and data collection methods N/A
• Identified sample size N/A
6. Plan to Collect Reliable Data
81.3% • Specify data elements and sources 87.5%
• Instruments provide consistent and accurate data 68.8%
• Collection of data by qualified staff or personnel 93.8%
• Clear and concise instructions for data collection process
75.0%
7A. Root Cause Analysis and Existing Interventions
84.5% • Root cause analyses: factors related to topic 77.7%
• Identified existing interventions 91.3%
7B. Intervention and Improvement Strategies (Implementation)
65.0% • Interventions to address causes and barriers 67.9%
• Interventions appropriate for identified group 68.5%
• Vehicles of communication reasonable 63.0%
• Literacy and cultural needs addressed 29.9%
• Interventions described in detail 62.0%
• New intervention 91.8%
Texas Contract Year 2015 External Quality Review Organization: Summary of Activities and Trends in Health Care Quality Addendum: Performance Improvement Projects and Encounter Data Validation Version: 3.0 HHSC Approval Date: Page 18
Table 6 shows evaluations by the external quality review organization across all PIPs implemented by all plans on each component of each activity comprising the planning phase. The average score across all PIPs for the planning phase was 85.7 percent. All PIPs in the current cycle use indicators that do not require the health plan to devise a sampling strategy. The external quality review organization therefore did not evaluate any sampling methods and marked Activity 5: Sound Sampling Methods "N/A" in all cases. Nearly every proposed project clearly defined a study population, documented the study condition among members, and considered and addressed special health care needs; the external quality review organization calculated an average score of 97.3 percent for Activity 4: Review of the Identified Study Population. The PIPs also scored highly on Activity 2: Review of Study Questions, with 82 projects documenting a clear statement of the study question and 10 projects partially meeting the component for an overall average score of 94.6 percent. The external quality review organization noted an opportunity for improvement in the extent to which each PIP documented consideration for the literacy and cultural needs of the population; the overall average score for this component was 29.9 percent.
Table 7. Performance Improvement Project Evaluations by Activity and Component, Progress Report 1
Activity
Average Activity Score Component
Average Component
Score
Measures, Interventions, and Improvement Strategies
78.3% • Reported rates for each measure 79.3%
• Address causes and barriers 88.2%
• Appropriate for identified group 90.8%
• Vehicles of communication reasonable 90.8%
• Interventions described in detail 63.0%
• Intervention reach 45.1%
• Describe next steps 92.4%
• Implementation strategies and challenges 71.3%
Table 7 shows evaluations by the external quality review organization across all PIPs on each component comprising the single activity of the six-month progress report, Measures, Interventions, and Improvement Strategies. The overall average of individual plan scores was 78.3 percent. Of the 92 projects, 47 experienced one or more substantial challenges or barriers in the implementation phase; the remaining 45 projects were not evaluated for revision strategies to address challenges to implementation. The health plans provided clear descriptions of the next steps planned for each PIP in most cases, for a component average score of 92.4 percent. The overall score for the component evaluating the adequacy of the reach of each project was 45.1 percent; nine projects had adequate reach, 65 projects partially
Texas Contract Year 2015 External Quality Review Organization: Summary of Activities and Trends in Health Care Quality Addendum: Performance Improvement Projects and Encounter Data Validation Version: 3.0 HHSC Approval Date: Page 19
met the component, and 18 projects did not meet the component. At the time of the first progress report, implementation had not yet been completed for a number of interventions or revisions were underway to overcome barriers identified during implementation.
3.3.1. Projects and Interventions
Each PIP comprises several interventions designed to work in tandem to support the overall goal of improving performance on designated indicators. Several health plans implemented the same PIP for different programs where the comprising interventions could serve the different populations. Interventions are categorized as member level, provider level, or system level according to how they seek to effect change; a robust PIP will include interventions at all three levels and will address multiple aspects of quality. Member-level interventions include those aimed at reaching members directly or influencing their behavior, such as mobile clinics to provide routine care and establish an ongoing patient-centered medical home relationship, or a home-remediation to remove allergens from the living environments of vulnerable members. Provider-level interventions include those designed to educate or incent providers or otherwise influence provider behavior, such as pay-for-performance programs or outreach to and engagement of high- or low-performing providers. System-level interventions include those directed at the processes and policies underlying provision of quality health care, such as increasing network adequacy or the availability of after-hours clinics. Multi-level interventions include real-time tracking of encounters to identify super-utilizers and using these data to collaborate with hospitals to increase staff resources and coordinate enrollment in disease management programs and care transitions. Among all health plans, 245 interventions acted at the member level, 263 interventions acted at the provider level, and 100 interventions acted at the system level; 122 interventions operated at more than one level, as shown in Table 8.
Table 8. Interventions at the Member, Provider, and System Levels
Intervention Level
Number of Interventions
One Category
Total 324
Member-level 139
Provider-level 169
System-level 16
Two Categories
Total 82
Member- and Provider-level 38
Member- and System-level 28
Provider- and System-level 16
Three Categories Member-, Provider-, and System-level 40
Texas Contract Year 2015 External Quality Review Organization: Summary of Activities and Trends in Health Care Quality Addendum: Performance Improvement Projects and Encounter Data Validation Version: 3.0 HHSC Approval Date: Page 20
An effective PIP begins with a methodologically sound and thoroughly documented plan. However, an intervention that aims to improve an important indicator, has adequate reach, and is thoroughly documented still may fall short of bringing about meaningful improvement for the member population. Observed high mobility rates among the Texas Medicaid population can affect the effectiveness of an intervention; member contact information such as address and telephone number can change frequently, presenting a challenge to database management and to maintaining a continuous medical home. A 2014 systematic review indicated that interventions enabling patient self-monitoring and self-management could improve medication adherence, but cautioned that not all patients could complete the interventions and that no single intervention had been demonstrated effective in all populations and settings.5 Another 2014 systematic review examined the challenges in successful implementation of system-wide patient safety interventions, concluding that strong leadership, financial and educational support, and ongoing outreach and engagement commonly appear in interventions that produce positive and lasting change. Effective PIPs should include robust evidence-based interventions that are likely to positively influence member or provider behavior or lead to lasting systemic changes. A fully-realized PIP will include several robust interventions addressing multiple aspects of care identified by root cause analysis across the member, provider, and system levels. The following three subsections discuss projects and interventions in three topic areas in more detail: well care for children and adolescents, asthma, and behavioral health.
Well Care for Children and Adolescents
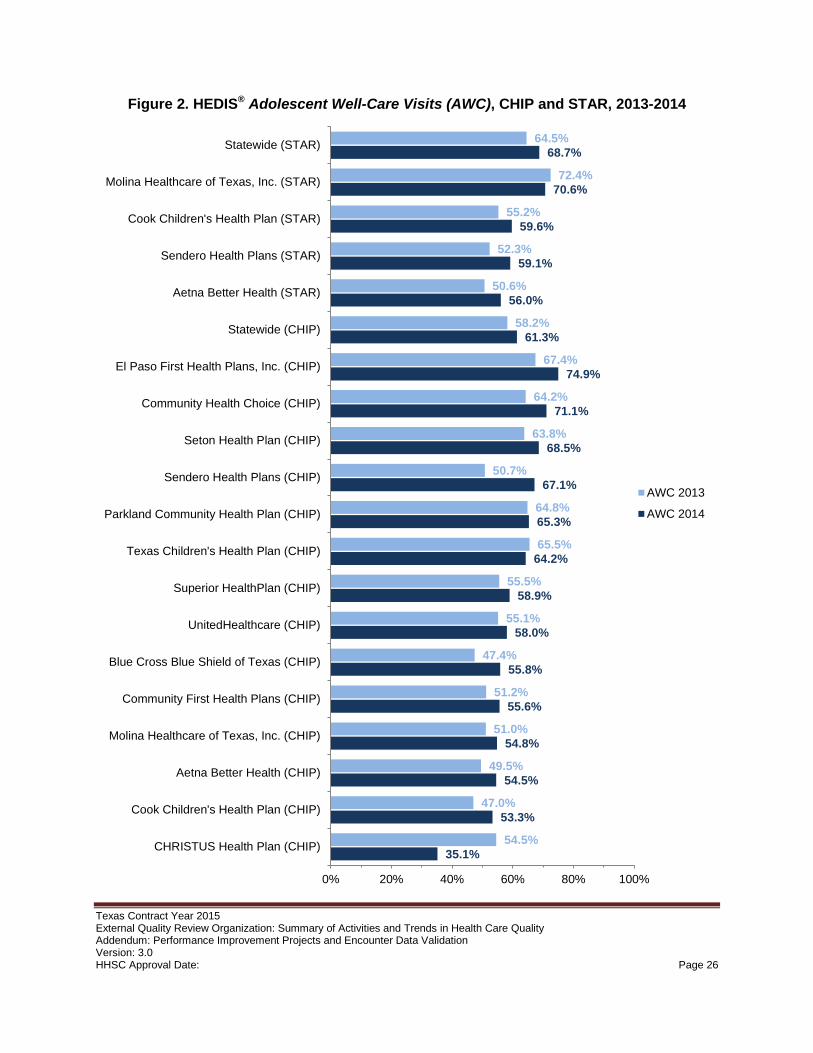
The topic of well care for children and adolescents occurred most frequently among the 2014 set of PIPs, with 27 of 92 projects aimed at better performance on a related indicator. Given the age mixes of the Texas Medicaid and CHIP populations and the importance of early access to well care, this focus aligns with HHSC priorities. PIPs designed to improve performance on indicators of well care for children and adolescents used three different measures: HEDIS® Adolescent Well-Care Visits (AWC), HEDIS® Well-Child Visits in the First 15 Months of Life (W15), Six or More Visits, and HEDIS® Well-Child Visits in the Third, Fourth, Fifth, and Sixth Years of Life (W34).
Member-level interventions included bringing care to the community through mobile clinics that provided well-care services and offered outreach to establish or renew an ongoing patient-centered medical home relationship. Interventions of this type directly address member need, provide culturally and linguistically appropriate education with direct feedback to ensure effective communication of essential points, promote engagement with the community, and serve as an information-gathering tool to elucidate barriers to care experienced by members. Further strategies for addressing well-visits at the member level include member incentive programs, remote or online appointment scheduling, transportation assistance, and visually and linguistically appealing educational materials describing healthy behaviors and available resources.6,7
Texas Contract Year 2015 External Quality Review Organization: Summary of Activities and Trends in Health Care Quality Addendum: Performance Improvement Projects and Encounter Data Validation Version: 3.0 HHSC Approval Date: Page 21
Provider-level interventions included pay-for-performance and other incentive programs to reward and encourage high performance or strong improvement. Such programs may be successful at increasing well-care visits and quality of care, but gaming behavior can occur in response to perverse incentives; the degree of success of incentive schemes in modifying provider behavior and improving member outcomes is expected to be sensitive to design and implementation of the incentive program.8,9,10 The evidence base supporting the use of provider incentive programs is mixed, and providers sometimes express concerns over design and implementation. Health plans should involve stakeholders, use theoretically sound design, and respond quickly to feedback and careful monitoring.11,12,13
Health plan support for participating physicians can promote and enable delivery of high-quality well-visits; forms of support include: continuing education on content and coding best practices, including the importance of privacy and confidentiality for adolescent members; training and outreach that emphasizes comprehensive care and the importance of early detection; and a reimbursement schedule that accounts for the time and complexity of a thorough visit.14,15 National guidelines such as Bright Futures from the American Academy of Pediatrics provide recommendations for periodicity and content of well-visits organized by developmental stage.16,17
System-level interventions included using central administrative data to identify members who were overdue for a routine visit and to assess available provider capacity in identified geographic areas of high unmet member need. Other recommended interventions at the system level included: offering extended weekday and weekend hours, providing special well-care clinics when schools are not in session, and soliciting and incorporating member feedback from adolescents as they become more responsible for their own care.18,19
Texas Contract Year 2015 External Quality Review Organization: Summary of Activities and Trends in Health Care Quality Addendum: Performance Improvement Projects and Encounter Data Validation Version: 3.0 HHSC Approval Date: Page 22
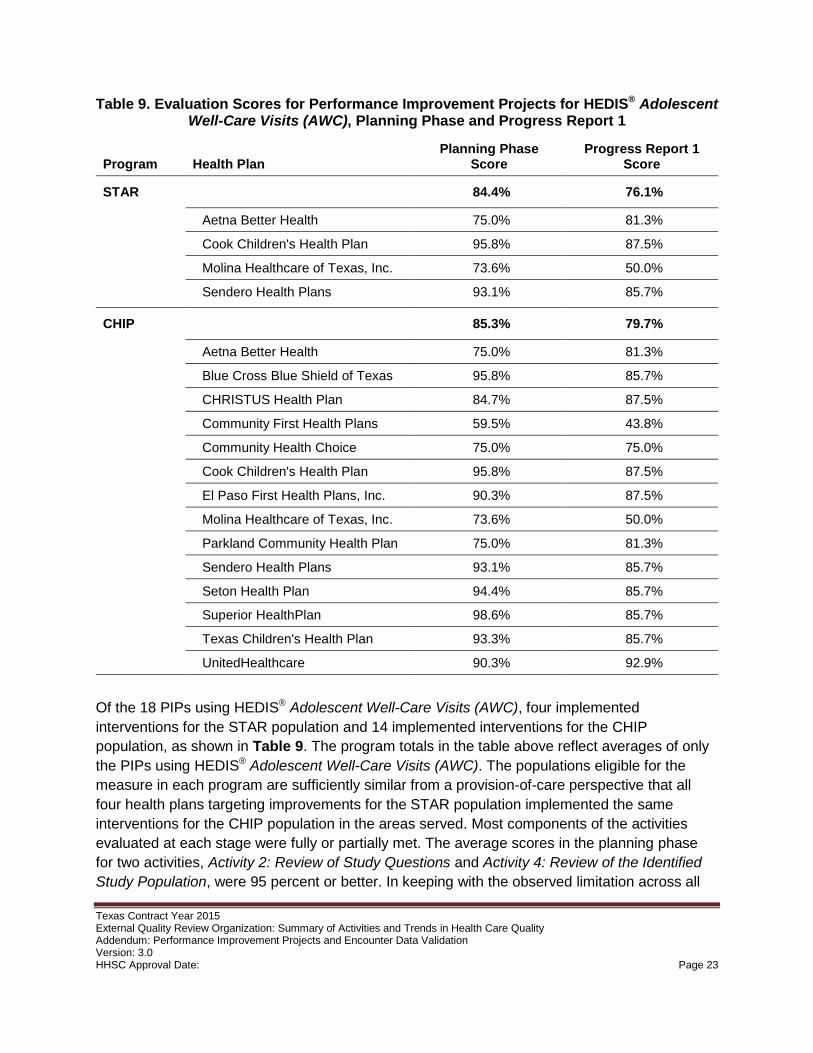
Table 9. Evaluation Scores for Performance Improvement Projects for HEDIS® Adolescent Well-Care Visits (AWC), Planning Phase and Progress Report 1
Program Health Plan Planning Phase
Score Progress Report 1
Score
STAR 84.4% 76.1%
Aetna Better Health 75.0% 81.3%
Cook Children's Health Plan 95.8% 87.5%
Molina Healthcare of Texas, Inc. 73.6% 50.0%
Sendero Health Plans 93.1% 85.7%
CHIP 85.3% 79.7%
Aetna Better Health 75.0% 81.3%
Blue Cross Blue Shield of Texas 95.8% 85.7%
CHRISTUS Health Plan 84.7% 87.5%
Community First Health Plans 59.5% 43.8%
Community Health Choice 75.0% 75.0%
Cook Children's Health Plan 95.8% 87.5%
El Paso First Health Plans, Inc. 90.3% 87.5%
Molina Healthcare of Texas, Inc. 73.6% 50.0%
Parkland Community Health Plan 75.0% 81.3%
Sendero Health Plans 93.1% 85.7%
Seton Health Plan 94.4% 85.7%
Superior HealthPlan 98.6% 85.7%
Texas Children's Health Plan 93.3% 85.7%
UnitedHealthcare 90.3% 92.9%
Of the 18 PIPs using HEDIS® Adolescent Well-Care Visits (AWC), four implemented interventions for the STAR population and 14 implemented interventions for the CHIP population, as shown in Table 9. The program totals in the table above reflect averages of only the PIPs using HEDIS® Adolescent Well-Care Visits (AWC). The populations eligible for the measure in each program are sufficiently similar from a provision-of-care perspective that all four health plans targeting improvements for the STAR population implemented the same interventions for the CHIP population in the areas served. Most components of the activities evaluated at each stage were fully or partially met. The average scores in the planning phase for two activities, Activity 2: Review of Study Questions and Activity 4: Review of the Identified Study Population, were 95 percent or better. In keeping with the observed limitation across all
Texas Contract Year 2015 External Quality Review Organization: Summary of Activities and Trends in Health Care Quality Addendum: Performance Improvement Projects and Encounter Data Validation Version: 3.0 HHSC Approval Date: Page 23
projects, the average score for the component Literacy & Cultural Needs Addressed in these projects was 19 percent; two projects, conducted by Blue Cross and Blue Shield of Texas in CHIP and by Superior HealthPlan in CHIP, fully met this component. Only one PIP using this measure undertook actions that the external quality review organization evaluated under Activity 6: Plan to Collect Reliable Data; this project, conducted by Community First Health Plans in CHIP, scored "partially met" for each of the four components and 50 percent for the activity overall. For the first progress report, all projects using this measure included a description of the planned next steps (average score: 100.0 percent) and nearly all fully met the component for providing pre-implementation baseline numerator, denominator, and rate for the measure (average score: 94.4 percent). No project fully met the component for documenting adequate reach, for an average score of 41.7 percent. Evaluation scores for the first mid-year progress report ranged from 43.8 percent (Community First Health Plans in CHIP) to 92.9 percent (UnitedHealthcare in CHIP).
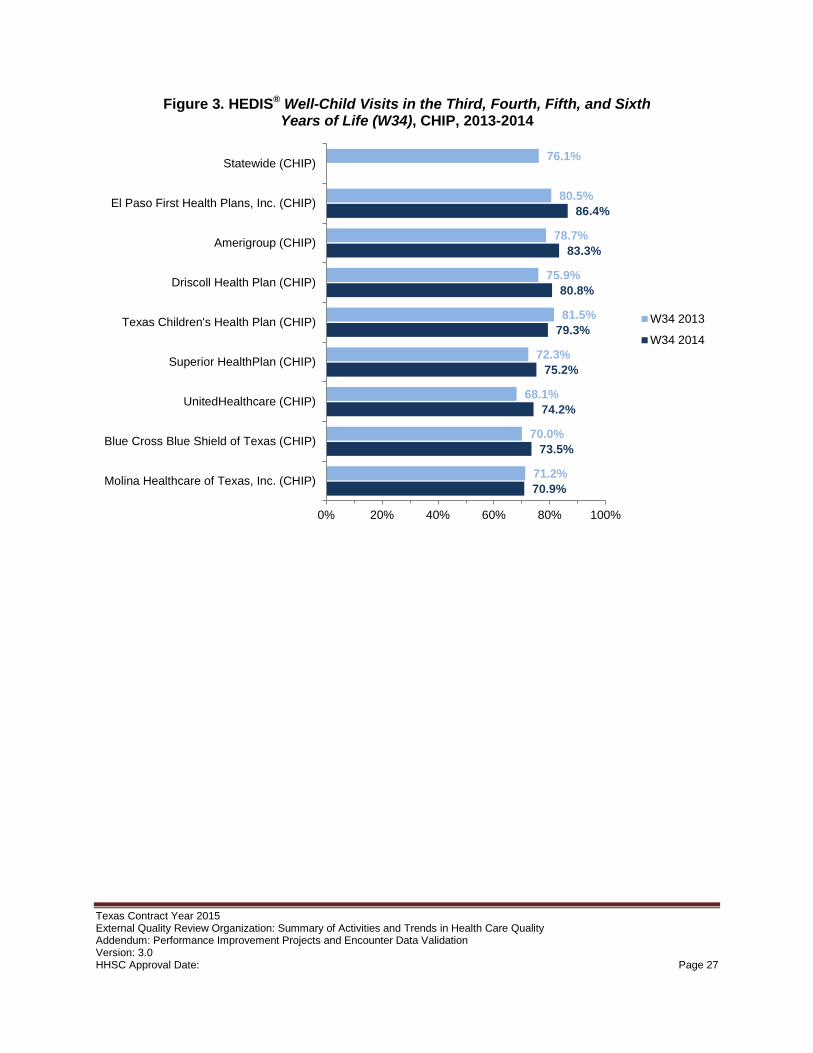
All eight PIPs using HEDIS® Well-Child Visits in the Third, Fourth, Fifth, and Sixth Years of Life (W34) implemented interventions for the CHIP population, as shown in Table 10. The program total in the table below reflects the average only of the PIPs using this measure. Most components of the activities evaluated at each stage were fully or partially met. None of the projects using this measure required a sampling or data collection plan, and the external quality review organization marked Activity 5: Sound Sampling Methods and Activity 6: Plan to Collect Reliable Data as "not applicable" in all cases. A possible area of concern for these projects is the component for creating interventions to address identified root causes and barriers; the average score on this component for projects using this measure was 55.6 percent. Overall scores for the planning phase ranged from 75.0 percent for Molina Healthcare of Texas, Inc. in CHIP to 98.6 percent for Superior HealthPlan in CHIP.
For the first progress report, all projects using this measure included a description of the planned next steps (100.0 percent) and nearly all fully met the components for implementing interventions that were reasonable based on root cause analysis (93.8 percent) and appropriate to the population (93.8 percent). The external quality review organization evaluated two projects on the component for revision if initial implementation was not successful; the project conducted by El Paso First Health Plans, Inc. fully met the component, and the project conducted by Molina Healthcare of Texas, Inc. did not meet the component. The external quality review organization identified room for improvement in documenting the adequacy of the reach of each intervention; the overall average score for this component was 56.3 percent, with two plans fully meeting the component: Amerigroup and Texas Children's Health Plan. Projects conducted by three health plans scored overall 92.9 percent on the first progress report: Amerigroup, Texas Children's Health Plan, and UnitedHealthcare.
Texas Contract Year 2015 External Quality Review Organization: Summary of Activities and Trends in Health Care Quality Addendum: Performance Improvement Projects and Encounter Data Validation Version: 3.0 HHSC Approval Date: Page 24
Table 10. Evaluation Scores for Performance Improvement Projects for HEDIS® Well-Child Visits in the Third, Fourth, Fifth, and Sixth Years of Life (W34),
Planning Phase and Progress Report 1
Program Health Plan Planning Phase
Score Progress Report 1
Score
CHIP 91.5% 83.4%
Amerigroup 95.8% 92.9%
Blue Cross Blue Shield of Texas 95.8% 85.7%
Driscoll Health Plan 91.7% 85.7%
El Paso First Health Plans, Inc. 90.3% 87.5%
Molina Healthcare of Texas, Inc. 75.0% 43.8%
Superior HealthPlan 98.6% 85.7%
Texas Children's Health Plan 94.4% 92.9%
UnitedHealthcare 90.3% 92.9%
Figures 2 and 3 show performance by each health plan conducting a PIP using HEDIS® Adolescent Well-Care Visits (AWC) and HEDIS® Well-Child Visits in the Third, Fourth, Fifth, and Sixth Years of Life (W34) in 2013, the baseline before the projects launched, and in 2014, the first year of implementation. The numerator and denominator for the measures count events and enrollment for the entire calendar year; the data collection period for the 2014 performance rates begins before any performance improvements due to these projects could reasonably be expected. The statewide rates in the figures below count all events in any health plan participating in the program during the data year, including health plans that did not implement a PIP using each measure; the populations served by different programs generally are not comparable. Performance on the adolescent well-care measure improved for 15 of the 18 populations for which a project was implemented, as well as statewide for STAR overall and CHIP overall. No statewide rate for the child well-care measure in CHIP in 2014 is available because some health plans rotated the measure (i.e., used prior-year results, following NCQA specifications). Performance on the child well-care measure improved from 2013 to 2014 for six of the eight populations for which a project was implemented.
Texas Contract Year 2015 External Quality Review Organization: Summary of Activities and Trends in Health Care Quality Addendum: Performance Improvement Projects and Encounter Data Validation Version: 3.0 HHSC Approval Date: Page 25
Texas Contract Year 2015 External Quality Review Organization: Summary of Activities and Trends in Health Care Quality Addendum: Performance Improvement Projects and Encounter Data Validation Version: 3.0 HHSC Approval Date: Page 26
Figure 3. HEDIS® Well-Child Visits in the Third, Fourth, Fifth, and Sixth Years of Life (W34), CHIP, 2013-2014
70.9%
73.5%
74.2%
75.2%
79.3%
80.8%
83.3%
86.4%
71.2%
70.0%
68.1%
72.3%
81.5%
75.9%
78.7%
80.5%
76.1%
0% 20% 40% 60% 80% 100%
Molina Healthcare of Texas, Inc. (CHIP)
Blue Cross Blue Shield of Texas (CHIP)
UnitedHealthcare (CHIP)
Superior HealthPlan (CHIP)
Texas Children's Health Plan (CHIP)
Driscoll Health Plan (CHIP)
Amerigroup (CHIP)
El Paso First Health Plans, Inc. (CHIP)
Statewide (CHIP)
W34 2013
W34 2014
Texas Contract Year 2015 External Quality Review Organization: Summary of Activities and Trends in Health Care Quality Addendum: Performance Improvement Projects and Encounter Data Validation Version: 3.0 HHSC Approval Date: Page 27
Asthma
Asthma was the second most common topic among the 2014 set of PIPs, with 26 of 92 projects aimed at bettering performance on a related indicator. HHSC requires all managed care organizations participating in STAR, STAR+PLUS, CHIP, and STAR Health to provide disease management services covering asthma.20 Asthma was the single most frequent reason for 3M™ Potentially Preventable Admissions for the CHIP and STAR populations in 2014.
Member-level interventions included face-to-face educational sessions with caregivers of children admitted to the hospital to discuss strategies for avoiding future asthma-related visits; software triggers can identify admitted members in real time, allowing a care coordinator to intervene while the member and family are still in a hospital setting. Tracking and communicating with members and their caregivers often is difficult due to frequent moves and outdated contact information; travel barriers, childcare limitations, and time constraints all impact the ability of members and caregivers to attend centralized educational opportunities. Educational outreach at the point of care therefore is not only timely but also represents an occasion when member or caregiver contact can reliably occur. At the provider level, interventions to improve provider adherence to asthma care best practices include supplying decision support tools, using explicit targets and action plans in audit and action plans, and providing clinical pharmacy support.21
Interventions acting at the member, provider, and system levels used timely analysis of individual utilization and adherence data, such as whether or not a member is prescribed sufficient medications or receives and uses the proper ratio of quick-relief medications-to-controller medications, to drive individualized disease management programs and asthma action plans coordinated through the treating physician. Individual home-remediation efforts to remove exacerbating factors such as common allergens or irritants (e.g., tobacco smoke) from a member's living environment show promise in increasing symptom-free days, reducing absenteeism, and reducing asthma acute-care visits.22 Subjective evaluation commonly overestimates the degree to which asthma is controlled and underestimates the extent to which it impacts daily life; in addition to objective lung-function tests, several validated self-report tools assess degree of asthma control.23 Achieving ongoing member buy-in to reduce intentional and non-intentional adherence to a guideline-based plan for managing and understanding chronic asthma represents a substantial challenge; shared decision-making, patient-centered care, increased provider awareness, and complex multi-pronged interventions can improve adherence and outcomes.24,25 A 2015 systematic review supported the use of multiple interventions directed at the member, provider, and system levels, including actively-supported self-management strategies, and emphasized the importance of ongoing review of the effectiveness of interventions.26
Texas Contract Year 2015 External Quality Review Organization: Summary of Activities and Trends in Health Care Quality Addendum: Performance Improvement Projects and Encounter Data Validation Version: 3.0 HHSC Approval Date: Page 28
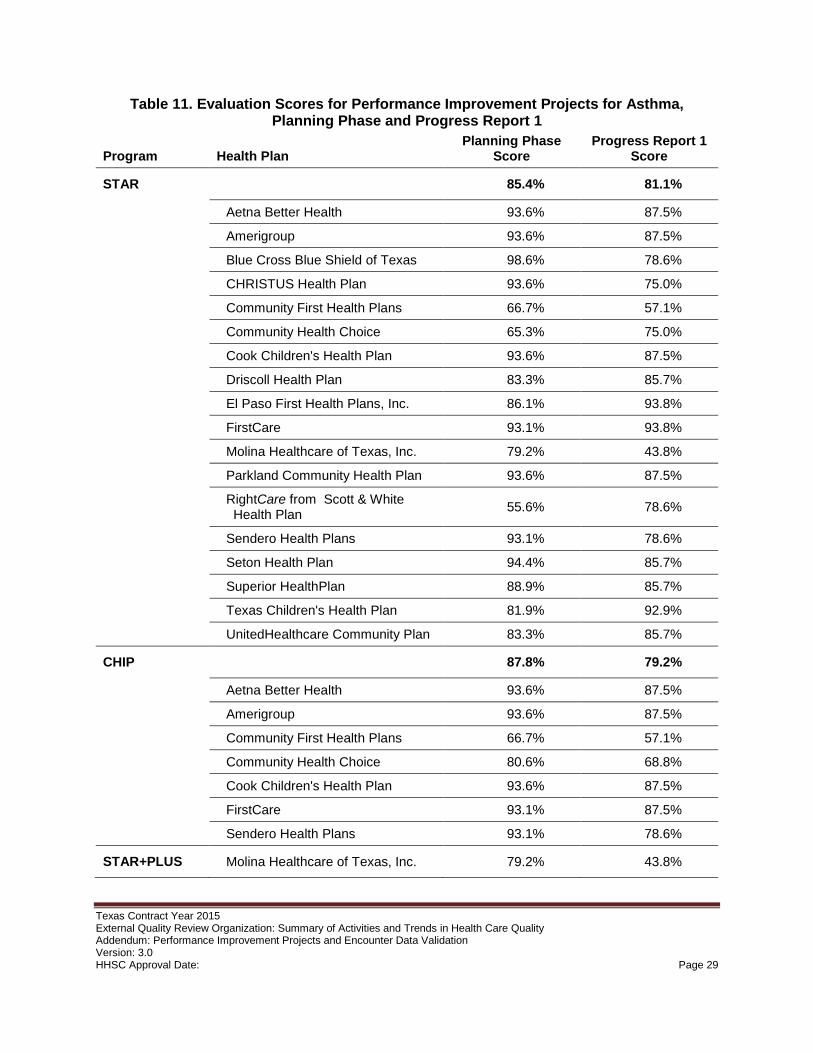
Table 11. Evaluation Scores for Performance Improvement Projects for Asthma, Planning Phase and Progress Report 1
Program Health Plan Planning Phase
Score Progress Report 1
Score
STAR 85.4% 81.1%
Aetna Better Health 93.6% 87.5%
Amerigroup 93.6% 87.5%
Blue Cross Blue Shield of Texas 98.6% 78.6%
CHRISTUS Health Plan 93.6% 75.0%
Community First Health Plans 66.7% 57.1%
Community Health Choice 65.3% 75.0%
Cook Children's Health Plan 93.6% 87.5%
Driscoll Health Plan 83.3% 85.7%
El Paso First Health Plans, Inc. 86.1% 93.8%
FirstCare 93.1% 93.8%
Molina Healthcare of Texas, Inc. 79.2% 43.8%
Parkland Community Health Plan 93.6% 87.5%
RightCare from Scott & White Health Plan 55.6% 78.6%
Sendero Health Plans 93.1% 78.6%
Seton Health Plan 94.4% 85.7%
Superior HealthPlan 88.9% 85.7%
Texas Children's Health Plan 81.9% 92.9%
UnitedHealthcare Community Plan 83.3% 85.7%
CHIP 87.8% 79.2%
Aetna Better Health 93.6% 87.5%
Amerigroup 93.6% 87.5%
Community First Health Plans 66.7% 57.1%
Community Health Choice 80.6% 68.8%
Cook Children's Health Plan 93.6% 87.5%
FirstCare 93.1% 87.5%
Sendero Health Plans 93.1% 78.6%
STAR+PLUS Molina Healthcare of Texas, Inc. 79.2% 43.8%
Texas Contract Year 2015 External Quality Review Organization: Summary of Activities and Trends in Health Care Quality Addendum: Performance Improvement Projects and Encounter Data Validation Version: 3.0 HHSC Approval Date: Page 29
Among all asthma measures targeted for improvement by the 2014 cycle of PIPs, HEDIS® Asthma Medication Ratio (AMR), Total Controller Medication Ratio >50%, and HEDIS® Medication Management for People with Asthma (MMA) were commonly used. HEDIS® Use of Appropriate Medications for People with Asthma (ASM) also was a common measure, but this measure is slated to be retired. Asthma-related 3M™ Potentially Preventable Admissions and AHRQ Asthma Admission Rate (PDI 14) were used by several projects. The external quality review organization calculated rates for all of these performance measures in 2014 for each health plan in each area served as part of regular activities supporting Texas HHSC. Table 11 shows planning and first progress report evaluation scores for all PIPs using any asthma-related measure.
Figures 4 and 5 show performance on two commonly used measures, HEDIS® Asthma Medication Ratio (AMR) and HEDIS® Medication Management for People with Asthma (MMA). Performance by each health plan conducting a related PIP is shown in 2013, the baseline before the projects launched, and in 2014, the first year of implementation. Events and enrollment for the entire calendar year were counted in both the numerator and denominator for the measure. Of note, the data collection period for the 2014 performance rates begins before any performance improvements due to these projects reasonably could be expected. Both HEDIS® Asthma Medication Ratio (AMR) and HEDIS® Medication Management for People with Asthma (MMA) require two years of enrollment for a member to be included in the denominator. Four health plans using these indicators, Blue Cross Blue Shield of Texas, CHRISTUS Health Plan, RightCare from Scott & White Health Plan, and Seton Health Plan, began participating in the STAR Medicaid program in March of 2012 and therefore do not have data for the baseline year 2013.
The program-wide rates in the figures below count all events in any health plan participating in the program during the data year, including health plans that did not implement a project to improve this measure; the populations served by each program generally are not comparable. The specifications for both measures include several component age bands, and the PIPs using these measures largely considered this level of detail; only the aggregate performance rates are presented here. Two PIPs were on the topic of asthma but did not use either of these two measures: Driscoll Health Plan and one project by El Paso First Health Plans, Inc.; the external quality review organization reviewed the indicators chosen for these projects and provided recommendations, but results are not presented here.
Texas Contract Year 2015 External Quality Review Organization: Summary of Activities and Trends in Health Care Quality Addendum: Performance Improvement Projects and Encounter Data Validation Version: 3.0 HHSC Approval Date: Page 30
Figure 4. HEDIS® Asthma Medication Ratio (AMR), Total Controller Medication Ratio >50%, STAR and CHIP, 2013-2014
58.8%
60.5%
67.0%
73.3%
74.7%
75.4%
72.2%
50.8%
54.2%
55.3%
55.5%
56.6%
58.4%
59.1%
59.7%
59.8%
61.7%
62.9%
63.1%
65.0%
65.4%
60.9%
77.1%
80.0%
88.7%
83.7%
84.0%
86.6%
84.6%
81.0%
82.7%
78.8%
74.6%
80.9%
83.2%
80.1%
81.4%
84.4%
77.3%
81.6%
0% 20% 40% 60% 80% 100%
Aetna Better Health (CHIP)
FirstCare (CHIP)
Community First Health Plans (CHIP)
Cook Children's Health Plan (CHIP)
Amerigroup (CHIP)
Community Health Choice (CHIP)
Statewide (CHIP)
CHRISTUS Health Plan (STAR)
RightCare from Scott & White Health Plan(STAR)
Aetna Better Health (STAR)
Blue Cross Blue Shield of Texas (STAR)
Community First Health Plans (STAR)
Community Health Choice (STAR)
FirstCare (STAR)
Amerigroup (STAR)
El Paso First Health Plans, Inc. (STAR)
Cook Children's Health Plan (STAR)
Seton Health Plan (STAR)
Superior HealthPlan (STAR)
Parkland Community Health Plan (STAR)
UnitedHealthcare Community Plan (STAR)
Statewide (STAR)
AMR 2013
AMR 2014
Texas Contract Year 2015 External Quality Review Organization: Summary of Activities and Trends in Health Care Quality Addendum: Performance Improvement Projects and Encounter Data Validation Version: 3.0 HHSC Approval Date: Page 31
Figure 5. HEDIS® Medication Management for People with Asthma (MMA), Medication Compliance 75% of Treatment Period (total), STAR, CHIP, and STAR+PLUS, 2013-2014
36.7%
34.8%
6.3%
14.0%
15.4%
17.4%
21.5%
18.5%
5.2%
11.8%
13.5%
13.5%
14.7%
15.4%
15.5%
15.6%
15.7%
15.8%
15.9%
16.3%
16.5%
16.5%
19.4%
21.7%
15.5%
35.7%
36.5%
15.2%
20.0%
15.5%
18.5%
13.6%
16.9%
20.2%
8.3%
14.1%
14.8%
15.7%
15.4%
14.6%
14.6%
15.9%
15.4%
21.7%
18.1%
15.4%
0% 10% 20% 30% 40% 50%
Molina Healthcare of Texas, Inc.(STAR+PLUS)
Statewide (STAR+PLUS)
Aetna Better Health (CHIP)
Amerigroup (CHIP)
FirstCare (CHIP)
Cook Children's Health Plan (CHIP)
Community First Health Plans (CHIP)
Statewide (CHIP)
CHRISTUS Health Plan (STAR)
Blue Cross Blue Shield of Texas (STAR)
UnitedHealthcare Community Plan (STAR)
Molina Healthcare of Texas, Inc. (STAR)
Community First Health Plans (STAR)
Texas Children's Health Plan (STAR)
El Paso First Health Plans, Inc. (STAR)
Parkland Community Health Plan (STAR)
Seton Health Plan (STAR)
Community Health Choice (STAR)
Aetna Better Health (STAR)
Amerigroup (STAR)
Superior HealthPlan (STAR)
Cook Children's Health Plan (STAR)
FirstCare (STAR)
RightCare from Scott & White Health Plan(STAR)
Statewide (STAR)
MMA 2013
MMA 2014
Texas Contract Year 2015 External Quality Review Organization: Summary of Activities and Trends in Health Care Quality Addendum: Performance Improvement Projects and Encounter Data Validation Version: 3.0 HHSC Approval Date: Page 32
Behavioral Health
Behavioral health was the third most common topic among the 2014 set of PIPs, with eight projects aimed at bettering performance on a related indicator. Disease management programs conducted by health plans participating in Texas Medicaid or CHIP in 2014 included ADHD, depression, and general behavioral health. "Behavioral health" is an umbrella term encompassing a wide variety of conditions that can be managed to varying degrees with pharmaceutical and psychotherapeutic interventions. Performance improvement projects designed to improve performance on behavioral health indicators used HEDIS® Antidepressant Medication Management (AMM), HEDIS® Follow-Up After Hospitalization for Mental Illness (FUH), HEDIS® Initiation and Engagement of Alcohol and Other Drug Dependence Treatment (IET), HEDIS® Adherence to Antipsychotic Medications for Individuals With Schizophrenia (SAA), and condition-related potentially preventable events.
Member-level interventions for behavioral health included community-based support, such as providing or facilitating supportive housing to promote stability among members. Support for caregivers, such as identification of resources, also would act at this level. Coordination among providers of care, especially between behavioral and physical health providers, and peer support are associated with improved outcomes for patients with depression.27 Patients with mental health or substance use issues often experience poorer access to primary care and worse outcomes than the general population.28,29 The US Preventive Services Task Force recommends primary screening for depression in adults and in adolescents ages 12-18.30,31
Lack of medication compliance prevents the full benefits of a treatment regimen from being realized; face-to-face discussion and development of behavioral strategies to help a member remember a medication schedule may lead to sustained gains in adherence and lowered rates of hospitalization.32 Common adverse effects of many schizophrenia drugs can discourage members from adhering to a treatment regimen; side-effect monitoring enables providers to offer alternatives.33,34,35 Provider-level interventions included identifying non-compliant members and encouraging providers to offer long-acting antipsychotic medications and discuss treatment outcomes goals. System-level interventions included improving coordination across levels of care to ensure every member leaving an inpatient setting had a timely post-discharge appointment and reaching out to any members who missed a follow-up appointment to identify barriers to treatment and to encourage compliance.
Texas Contract Year 2015 External Quality Review Organization: Summary of Activities and Trends in Health Care Quality Addendum: Performance Improvement Projects and Encounter Data Validation Version: 3.0 HHSC Approval Date: Page 33
Table 12. Evaluation Scores for Performance Improvement Projects for HEDIS® Follow-Up After Hospitalization for Mental Illness (FUH), Planning Phase and Progress Report 1
Program Health Plan Planning Phase
Score Progress Report 1
Score
STAR 79.4% 81.5%
Community First Health Plans 66.1% 71.4%
Community Health Choice 73.6% 87.5%
Texas Children's Health Plan 98.6% 85.7%
STAR Health Superior HealthPlan 98.6% 92.9%
NorthSTAR ValueOptions 94.4% 87.5%
Of the eight PIPs on behavioral health topics, five used HEDIS® Follow-Up After Hospitalization for Mental Illness (FUH). Table 12 shows planning and first progress report evaluation scores for all PIPs using this measure. The program totals in the table above are averages of only the PIPs using this measure; the STAR Health and NorthSTAR programs are each served by one health plan, Superior HealthPlan and ValueOptions, respectively. In the planning phase, these projects fully met all three components of Activity 4: Review of the Identified Study Population, with the exception of the project implemented by Community First Health Plans, which partially met the component for clearly defining the study population; the average score on this activity was 96.7 percent. The external quality review organization evaluated all components of Activity 7a. Root Cause Analysis and Existing Interventions as fully or partially met, with the exception of the component for identifying root causes, which the project implemented by Community Health Choice did not meet; the average score on this activity was 80.0 percent. The average score on the evaluation component for addressing literacy and cultural needs was 50.0 percent, with the projects implemented by Superior HealthPlan and by ValueOptions fully meeting the component. At the first mid-year progress report, the external quality review organization evaluated all five projects as partially meeting the component for having adequate reach and fully meeting the component for undertaking reasonable interventions to address barriers identified by root cause analysis.
Figures 6 and 7 show performance in 2013 and 2014 on the two components of HEDIS® Follow-Up After Hospitalization for Mental Illness (FUH) by the five health plans that implemented PIPs using this measure. The data in these figures represent performance in the baseline year and over the course of the first year of implementation. The populations served by each program generally are not comparable; adjacent presentation is for convenience only. The rates for the STAR program include all participating health plans.
Texas Contract Year 2015 External Quality Review Organization: Summary of Activities and Trends in Health Care Quality Addendum: Performance Improvement Projects and Encounter Data Validation Version: 3.0 HHSC Approval Date: Page 34
Figure 6. HEDIS® Follow-Up After Hospitalization for Mental Illness (FUH), 7 Days, STAR, STAR Health, and NorthSTAR, 2013-2014
Figure 7. HEDIS® Follow-Up After Hospitalization for Mental Illness (FUH), 30 Days, STAR, STAR Health, and NorthSTAR, 2013-2014
32.3%
60.8%
26.9%
38.0%
50.3%
37.5%
32.5%
59.1%
31.8%
33.4%
52.7%
32.2%
0% 20% 40% 60% 80% 100%
ValueOptions (NorthSTAR)
Superior HealthPlan (STAR Health)
Community Health Choice (STAR)
Community First Health Plans(STAR)
Texas Children's Health Plan (STAR)
Statewide (STAR)
2013 rate
2014 rate
56.3%
83.3%
54.1%
61.6%
69.8%
61.5%
58.4%
85.8%
56.8%
56.4%
71.2%
54.0%
0% 20% 40% 60% 80% 100%
ValueOptions (NorthSTAR)
Superior HealthPlan (STAR Health)
Community Health Choice (STAR)
Community First Health Plans(STAR)
Texas Children's Health Plan (STAR)
Statewide (STAR)
2013 rate
2014 rate
Texas Contract Year 2015 External Quality Review Organization: Summary of Activities and Trends in Health Care Quality Addendum: Performance Improvement Projects and Encounter Data Validation Version: 3.0 HHSC Approval Date: Page 35
4. Encounter Data Validation The external quality review organization annually validates encounter data for accuracy and completeness by comparing claims against a representative sample of dental or medical records. In 2015, dental records were reviewed for the Medicaid Dental and CHIP Dental programs. These data are crucial for accurate calculation of quality and performance indicators, setting data-driven policies, and for quantifying the effects of PIPs. The external quality review organization analyzes the records of services provided to members for accuracy and completeness and compares results to a representative sample of medical records. The 2015 encounter validation studies examined dental encounters and records from 2014 for members in Medicaid Dental and CHIP Dental.
This section presents assessments of the processes for collecting and submitting accurate and complete encounter data and of the quality of the data themselves. This procedure follows guidance by CMS on optional external quality review organization activities: review of medical records.36
4.1. Methodology The external quality review organization requested 822 records from each health plan for each dental program, sufficient to obtain 411 records per quota with a 50 percent return rate. This approach follows NCQA guidelines for sample size and estimated return rate when data from previous studies are not available.
Each record in the sample included all encounters for a member with a provider over the course of the study period. As dental claims do not have diagnosis codes, the validation study focused on procedure codes. Certified health record reviewers evaluated two components of encounter data: the accuracy of the claims data and the completeness of the claims data compared to the health record. The external quality review organization validated up to 25 procedures for each claim and date of service.
4.1.1. Data Sources and Sample Criteria
The external quality review organization used the Medicaid Master Provider File for demographic and address information of providers participating in Medicaid Dental and CHIP Dental. Letters were mailed to providers associated with each sampled claims record, requesting all records for claims for the member during the study year. The external quality review organization additionally made follow-up telephone calls with high volume providers. A second mailing, three weeks after the initial mailing, was sent to providers who had not responded to the initial mailing or telephone call.
The external quality review organization obtained managed care organization claims and encounter data from the Texas Vision 21 Encounter Data Warehouse. The study timeframe spanned from January 1, 2014, through December 31, 2014, with at least a three-month lag for
Texas Contract Year 2015 External Quality Review Organization: Summary of Activities and Trends in Health Care Quality Addendum: Performance Improvement Projects and Encounter Data Validation Version: 3.0 HHSC Approval Date: Page 36
processing purposes and data quality verification. This is the time period for which 2014 claims data were available via the Texas data warehouse. To be included in the sample, a member must have been covered for at least one month during the study period. The sampling frame consisted of Medicaid Dental and CHIP Dental members registered with one of the two dental maintenance organizations (DMO), DentaQuest or MCNA Dental. The sample request was stratified to provide representation for each of the four program-health plan combinations. The external quality review organization validated procedure, date of service, place of service, and up to two tooth IDs for each encounter. Almost all dental encounters occur in the office (place of service code 11).
The external quality review organization drew the sample from among all members in Medicaid Dental or CHIP Dental who had at least one visit with a dental health provider during the study period. Each record included all claims for a particular member submitted by a particular provider for care received in 2014; members who saw multiple providers during the study period were included in the sample. Some members saw a change in eligibility during the study period between Medicaid Dental and CHIP Dental; the sample was randomly de-duplicated to include such members in only one program sample. Claims associated with all dates of service were validated. Per claim and date of service, up to 25 procedures were validated. Reviewers identified procedures and dates of service in the claims data to match with the dental records, and identified procedures and dates of service in the dental records to match with the claims data.
4.1.2. Health Records and Confidentiality
The external quality review organization designed record request, submission, log-in, and abstraction procedures to protect confidentiality in accordance with Federal and State regulations. To ensure confidentiality, the following steps were taken: • All personnel involved in record processing and review were trained in the handling of
patient identifiable data, as required by the University of Florida Health Science Center Privacy Office.
• Patient- and provider-specific data were maintained in a password-protected database. All health records received were logged into this password-protected database.
• Hard copies received were placed in file folders with a provider code and filed in locked filing cabinets. Faxed health records were received by a secure fax line and saved to a password- protected network drive used by the health record review team.
4.1.3. Validation
A team of certified record reviewers conducted the validation study, meeting daily to discuss any questions or interpretations related to the validation process. The external quality review organization used a standardized protocol to assess inter-rater reliability and ensure accuracy. At the onset of the project, cross-reviews of 25 charts per reviewer showed accuracy of 98 to 100 percent. For the subsequent weeks, reviewers exchanged five to ten records per reviewer Texas Contract Year 2015 External Quality Review Organization: Summary of Activities and Trends in Health Care Quality Addendum: Performance Improvement Projects and Encounter Data Validation Version: 3.0 HHSC Approval Date: Page 37
to assess inter-rater reliability. The reviewers had a 99.26 percent agreement rate, agreeing 134 times on the 135 selected records.
The review team conducted the validation study by matching information found in the managed care organization’s encounter data with information found in the dental records supplied to the external quality review organization. Reviewers evaluated two components of the encounter data: looking at the accuracy of the claims data and examining the completeness of the claims data compared to the dental record. 1. Standard Encounter Data Validation. The external quality review organization compared
information in requested dental records with information in the administrative claims data for procedure, date of service, place of service and up to two tooth IDs.
2. Validation of Claims Completeness. The external quality review organization compared data in dental records to administrative claims data for all of 2014 to determine whether any encounters in the dental records were absent in the claims data.
For each encounter, reviewers used the following codes to document agreement between the claim and the dental record for each data element. • Match: The data element has an exact match between the encounter data and the dental
record. • In Dental Record but Not in Administrative Claims Data: The dental record documentation
contains evidence of a service or condition that is not reflected in the claim (under-reporting).
• In Administrative Claims Data but Not in Dental record: The claim contains evidence of a service or condition that was not documented in the dental record for the selected date of service (over-reporting).
• Care Outside Evaluation Timeframe: The record received covered an encounter that was not within the study time frame.
• Illegible: Reviewers were unable to read the dental record documentation. The external quality review organization evaluated the final-approved disposition of the claim, not the entire history of the claim. Only the final paid or denied claim is included in the results below.
4.2. Results The external quality review organization calculated final match rates for procedure, date of service, place of service and up to two tooth IDs from the sample of dental records of care in 2014. The procedure match rate is the quotient of the total number of matched procedures and the total number of procedures in claims and in dental records. The sampling methodology allows for multiple records to be associated with each provider.
The external quality review organization used a χ2 test with four degrees of freedom to examine differences in procedure validation types between each dental maintenance organization. The
Texas Contract Year 2015 External Quality Review Organization: Summary of Activities and Trends in Health Care Quality Addendum: Performance Improvement Projects and Encounter Data Validation Version: 3.0 HHSC Approval Date: Page 38
test yielded a p-value of 0.1499, indicating no statistically significant differences by health plan in the rates at which procedures were matched, appeared in the medical record but not in the claim, appeared in the claim but not in the medical record, were inadequately documented, or the external quality review organization was unable to review.
The external quality review organization calculated a logistic regression to determine whether a statistically significant difference existed between providers who responded to the records request versus providers who did not respond to the records request (Table 13). The following independent variables were included in the model: service delivery area, program affiliation, dental maintenance organization affiliation, and number of members seen by that provider for whom records were requested. Based on the regression analysis results, the intercept is different from zero and all independent variables had non-significant p-values, indicating no relationship observed between provider response and any of the independent variables.
Table 13. Logistic Regression of Provider Response Rates
Variable Degrees of Freedom
Parameter Estimates
Standard Error t Value Pr > |t|
Intercept 1 0.7842 0.0241 32.60 <0.0001
Service Area 1 -0.0038 0.0027 -1.43 0.1536
Program 1 -0.0211 0.0196 -1.08 0.2813
Health Plan 1 0.0250 0.0196 1.27 0.2034
Number of Members Seen 1 0.0119 0.0078 1.51 0.1301
4.2.1. Health Records Received in All Programs
The external quality review organization requested a total of 3,288 dental records, 822 from each of the two dental maintenance organizations in each of the two programs. Dental providers submitted a total of 1,778 records for an overall return rate of 54.1 percent, exceeding the estimated return rate of 50 percent. Of the 1,778 records returned, 46 corresponded to members who only had claims associated with an MCNA Dental project that paid an incentive to providers for procedures conducted in 2013. These 46 records did not otherwise meet the sample criteria for the study and were therefore excluded from further analysis; match rates are calculated on a base of the 1,732 remaining records. Among these there were 2,646 dates of service, 13,812 procedures, 5,118 first tooth IDs, and 4 second tooth IDs.
The return rates for providers in each dental maintenance organization when records were requested for CHIP Dental were slightly higher compared to when records were requested for Medicaid Dental (Table 14). Of the records requested but not received, the most common reasons were that the provider replied that the record requested did not correspond to a patient
Texas Contract Year 2015 External Quality Review Organization: Summary of Activities and Trends in Health Care Quality Addendum: Performance Improvement Projects and Encounter Data Validation Version: 3.0 HHSC Approval Date: Page 39
(19.4 percent) or the provider did not reply (18.6 percent). Figure 8 shows the final disposition for each record requested by program and by dental maintenance organization.
Table 14. Number and Percentage of Dental Records Received by Program and Dental Maintenance Organization
Records Requested
Records Received
Percent Received
Total 3,288 1,778 54.1%
Medicaid Dental
DentaQuest 822 433 52.7%
MCNA Dental 822 434 52.8%
Total Medicaid Dental 1,644 867 52.7%
CHIP Dental
DentaQuest 822 445 54.1%
MCNA Dental 822 466 56.7%
Total CHIP Dental 1,644 911 55.4%
Total DentaQuest 1,644 878 53.4%
Total MCNA Dental 1,644 900 54.7%
Texas Contract Year 2015 External Quality Review Organization: Summary of Activities and Trends in Health Care Quality Addendum: Performance Improvement Projects and Encounter Data Validation Version: 3.0 HHSC Approval Date: Page 40
Figure 8. Dispositions of Dental Records Requested by Program and Dental Maintenance Organization
Figure 9. Method of Delivery of Dental Records Requested by Program and Dental Maintenance Organization
5.9%
4.6%
5.3%
5.2%
5.3%
19.2%
19.5%
18.3%
20.4%
19.4%
2.8%
1.9%
2.7%
2.0%
2.3%
16.8%
20.3%
17.9%
19.2%
18.6%
0.5%
0.3%
0.4%
0.4%
0.4%
54.7%
53.4%
55.4%
52.7%
54.1%
0% 20% 40% 60% 80% 100%
MCNA Dental
DentaQuest
CHIP Dental
Medicaid Dental
Total
Bad address Not a patient Patient not seen
No provider response Care outside time frame Dental record received
4.2%
4.0%
4.0%
4.3%
4.1%
54.4%
53.6%
52.7%
55.5%
54.0%
41.3%
42.4%
43.4%
40.3%
41.8%
0% 20% 40% 60% 80% 100%
MCNA Dental
DentaQuest
CHIP Dental
Medicaid Dental
Total
CD Record Faxed Record Mailed Record
Texas Contract Year 2015 External Quality Review Organization: Summary of Activities and Trends in Health Care Quality Addendum: Performance Improvement Projects and Encounter Data Validation Version: 3.0 HHSC Approval Date: Page 41
Table 15. Method of Delivery Counts and Percentages by Program and Dental Maintenance Organization
CD Record Fax Record Mail Record
Total Records Received
Total 73 4.1% 961 54.0% 744 41.8% 1,778
Medicaid Dental
DentaQuest 17 3.9% 253 58.4% 163 37.6% 433
MCNA Dental 20 4.6% 228 52.5% 186 42.9% 434
Total Medicaid Dental 37 4.3% 481 55.5% 349 40.3% 867
CHIP Dental
DentaQuest 18 4.0% 218 49.0% 209 47.0% 445
MCNA Dental 18 3.9% 262 56.2% 186 39.9% 466
Total CHIP Dental 36 4.0% 480 52.7% 395 43.4% 911
Total DentaQuest 35 4.0% 471 53.6% 372 42.4% 878
Total MCNA Dental 38 4.2% 490 54.4% 372 41.3% 900
Most records received by the external quality review organization were faxed (54.0 percent) or mailed (41.8 percent), with 4.1 percent received on compact disc. Figure 9 shows the method of delivery for each record requested by program and by dental maintenance organization. Minor variations occurred between providers in each dental maintenance organization within a program. Table 15 lists methods of delivery chosen by providers in each quota.
4.2.2. Match Rates
The overall date of service match rate was 97.3 percent, the overall place of service match rate was 98.7 percent, the overall dental procedure match rate was 92.5 percent, and the overall match rate for first tooth ID was 83.2 percent. Table 16 shows overall match rates by program and dental maintenance organization.
Texas Contract Year 2015 External Quality Review Organization: Summary of Activities and Trends in Health Care Quality Addendum: Performance Improvement Projects and Encounter Data Validation Version: 3.0 HHSC Approval Date: Page 42
Table 16. Overall Match Rates by Program and Dental Maintenance Organization Date of
Service Place of Service
Dental Procedure Tooth ID 1 Tooth ID 2
Total 97.3% 98.7% 92.5% 83.2% 100.0%
Medicaid Dental
DentaQuest 97.6% 98.9% 92.5% 84.0% N/A
MCNA Dental 97.2% 98.6% 93.7% 84.2% 100.0%
Total Medicaid Dental 97.4% 98.7% 93.1% 84.1% 100.0%
CHIP Dental
DentaQuest 97.0% 99.2% 92.2% 83.3% N/A
MCNA Dental 97.5% 98.0% 91.4% 80.6% N/A
Total CHIP Dental 97.2% 98.6% 91.8% 81.7% N/A
Total DentaQuest 97.3% 99.0% 92.4% 83.8% N/A
Total MCNA Dental 97.3% 98.3% 92.6% 82.7% 100.0%
The external quality review organization reviewed 13,812 procedures for the 1,732 records included in the study. Of these procedures, 12,776 appeared in both the medical record and in the claims data for an overall match rate of 92.5 percent. More procedures appeared in the claim but not in the medical record (566, 4.1 percent) than appeared in the medical record but not in the claim (447, 3.2 percent); this pattern held for both dental maintenance organizations. A small percentage of procedures did not have adequate documentation to determine a match (5, 0.0 percent) or were illegible or otherwise could not be reviewed (18, 0.1 percent). Table 17 shows final match disposition for each procedure. Table 18 shows the numbers of records reviewed and matched and final match rates for each quota.
Table 17. Procedure Validation Dispositions by Dental Maintenance Organization
DentaQuest MCNA Dental Total
Match Rate 92.4% 92.6% 92.5%
Matched 6,269 92.4% 6,507 92.6% 12,776 92.5%
In medical record, not in claim 238 3.5% 209 3.0% 447 3.2%
In claim, not in medical record 273 4.0% 293 4.2% 566 4.1%
Inadequate documentation 3 0.0% 2 0.0% 5 0.0%
Unable to review 5 0.1% 13 0.2% 18 0.1%
Total procedures reviewed 6,788 7,024 13,812
Texas Contract Year 2015 External Quality Review Organization: Summary of Activities and Trends in Health Care Quality Addendum: Performance Improvement Projects and Encounter Data Validation Version: 3.0 HHSC Approval Date: Page 43
Table 18. Procedure Validation Counts and Match Rates by Program and Dental Maintenance Organization
Procedures Matched
Procedures Reviewed Match Rate
Total 12,776 13,812 92.5%
Medicaid Dental
DentaQuest 3,360 3,632 92.5%
MCNA Dental 3,598 3,841 93.7%
Total Medicaid Dental 6,958 7,473 93.1%
CHIP Dental
DentaQuest 2,909 3,156 92.2%
MCNA Dental 2,909 3,183 91.4%
Total CHIP Dental 5,818 6,339 91.8%
Total DentaQuest 6,269 6,788 92.4%
Total MCNA Dental 6,507 7,024 92.6%
Table 19. Date of Service Validation Counts and Match Rates by Program and Dental Maintenance Organization
Date of Service Matched
Dates of Service Reviewed Match Rate
Total 2,575 2,646 97.3%
Medicaid Dental
DentaQuest 693 710 97.6%
MCNA Dental 685 705 97.2%
Total Medicaid Dental 1,378 1,415 97.4%
CHIP Dental
DentaQuest 606 625 97.0%
MCNA Dental 591 606 97.5%
Total CHIP Dental 1,197 1,231 97.2%
Total DentaQuest 1,299 1,335 97.3%
Total MCNA Dental 1,276 1,311 97.3%
The external quality review organization reviewed 2,646 dates of service for the 13,812 procedures in the 1,732 records included in the study. Of these dates of service, 2,575 appeared in both the medical record and in the claims data for an overall match rate of
Texas Contract Year 2015 External Quality Review Organization: Summary of Activities and Trends in Health Care Quality Addendum: Performance Improvement Projects and Encounter Data Validation Version: 3.0 HHSC Approval Date: Page 44
97.3 percent. Place of service match rates were similar in all quotas, ranging from 97.0 percent for DentaQuest in CHIP Dental to 97.6 percent for DentaQuest in Medicaid Dental. Table 19 shows the numbers of dates of service reviewed and matched and final match rates for each quota.
The external quality review organization reviewed 2,646 places of service corresponding to the 2,646 dates of service reviewed. Of these places of service, 2,611 appeared in both the medical record and in the claims data for an overall match rate of 98.7 percent. Date of service match rates were similar in all quotas, ranging from 98.0 percent for MCNA Dental in CHIP Dental to 99.2 percent for DentaQuest in CHIP Dental. Table 20 shows the numbers of places of service reviewed and matched and final match rates for each quota. Almost all procedures were conducted in a dental office setting. Table 21 shows final place of service counts and percentages.
Table 20. Place of Service Validation Counts and Match Rates by Program and Dental Maintenance Organization
Place of Service Matched
Place of Service Reviewed Match Rate
Total 2,611 2,646 98.7%
Medicaid Dental
DentaQuest 702 710 98.9%
MCNA Dental 695 705 98.6%
Total Medicaid Dental 1,397 1,415 98.7%
CHIP Dental
DentaQuest 620 625 99.2%
MCNA Dental 594 606 98.0%
Total CHIP Dental 1,214 1,231 98.6%
Total DentaQuest 1,322 1,335 99.0%
Total MCNA Dental 1,289 1,311 98.3%
Texas Contract Year 2015 External Quality Review Organization: Summary of Activities and Trends in Health Care Quality Addendum: Performance Improvement Projects and Encounter Data Validation Version: 3.0 HHSC Approval Date: Page 45
Table 21. Place of Service Counts and Percentages Place of Service Total Percentage
Office 2,636 99.6%
Outpatient hospital 9 0.3%
Other 1 0.0%
Total 2,646 100.0%
Table 22. First Tooth ID Validation Counts and Match Rates by Program and Dental Maintenance Organization
Tooth ID 1 Matched
Tooth ID 1 Reviewed Match Rate
Total 4,256 5,118 83.2%
Medicaid Dental
DentaQuest 1,058 1,259 84.0%
MCNA Dental 1,532 1,819 84.2%
Total Medicaid Dental 2,590 3,078 84.1%
CHIP Dental
DentaQuest 675 810 83.3%
MCNA Dental 991 1,230 80.6%
Total CHIP Dental 1,666 2,040 81.7%
Total DentaQuest 1,733 2,069 83.8%
Total MCNA Dental 2,523 3,049 82.7%
The external quality review organization reviewed 5,118 first tooth IDs for the 13,812 procedures reviewed. Of these tooth IDs, 4,256 appeared in both the medical record and in the claims data for an overall match rate of 83.2 percent. The total match rate was higher for Medicaid Dental (84.1 percent) than for CHIP Dental (81.7 percent). The match rates by dental maintenance organization were closer at 83.8 percent for DentaQuest and 82.7 percent for MCNA Dental. Table 22 shows the numbers of first tooth IDs reviewed and matched and final match rates for each quota. Four records including a second tooth ID corresponded to MCNA Dental in the Medicaid Dental program; all four matched.
Texas Contract Year 2015 External Quality Review Organization: Summary of Activities and Trends in Health Care Quality Addendum: Performance Improvement Projects and Encounter Data Validation Version: 3.0 HHSC Approval Date: Page 46
1 HHSC (Texas Health and Human Services Commission). 2015. Texas Medicaid and CHIP in Perspective – 10th Edition. Available at: http://www.hhsc.state.tx.us/medicaid/about/PB/PinkBook.pdf. 2 CMS. 2012a. Quality of Care External Quality Review (EQR). Available at: http://www.medicaid.gov/Medicaid-CHIP-Program-Information/By-Topics/Quality-of-Care/Quality-of-Care-External-Quality-Review.html. 3 CMS. 2012b. External Quality Review Toolkit for States. Available at: http://www.medicaid.gov/medicaid-chip-program-information/by-topics/quality-of-care/downloads/eqr-toolkit.pdf. 4 CMS. 2012c. EQR Protocol 3: Validating Performance Improvement Projects (PIPs). Available at: http://www.medicaid.gov/medicaid-chip-program-information/by-topics/quality-of-care/downloads/eqr-protocol-3.pdf. 5 Ryan R, N Santesso, D Lowe, S Hill, J Grimshaw, M Prictor, C Kaufman, G Cowie, and M Taylor. Interventions to improve safe and effective medicines use by consumers: an overview of systematic reviews. Cochrane Database of Systematic Reviews. 2014 Apr 29;4:CD007768. doi: 10.1002/14651858.CD007768.pub3 6 CMS. 2014. Paving the road to good health: Strategies for increasing Medicaid adolescent well-care visits. Available at, https://www.medicaid.gov/Medicaid-CHIP-Program-Information/By-Topics/Benefits/Downloads/Paving-the-Road-to-Good-Health.pdf 7 Medicaid Health Plans of America (MHPA). 2012. Best practices compendium 2012-2013. Available at: https://www.mhpa.org/_upload/2012Compendium.pdf 8 Scott A, P Sivey, D Ait Ouakrim, L Willenberg, L Naccarella, J Furler, and D Young. The effect of financial incentives on the quality of health care provided by primary care physicians. Cochrane Database of Systematic Reviews 2011 Sep 7;(9):CD008451. doi: 10.1002/14651858.CD008451.pub2. 9 CMS 2014. 10 Eijkenaar, Frank. Key Issues in the design of pay for performance programs. The European Journal of Health Economics. 2013 Feb; 14(1): 117–131. doi: 10.1007/s10198-011-0347-6 11 Houle, SK, FA McAlister, CA Jackevicius, AW Chuck, and RT Tsuyuki. Does performance-based remuneration for individual health care practitioners affect patient care?: a systematic review. Annals of Internal Medicine. 2012 Dec 18;157(12):889-99. doi: 10.7326/0003-4819-157-12-201212180-00009 12 Lee, JY, SI Lee, and MW Jo. Lessons from healthcare providers' attitudes toward pay-for-performance: what should purchasers consider in designing and implementing a successful program?. Journal of Preventive Medicine and Public Health. 2012 May;45(3):137-47. doi: 10.3961/jpmph.2012.45.3.137
Texas Contract Year 2015 External Quality Review Organization: Summary of Activities and Trends in Health Care Quality Addendum: Performance Improvement Projects and Encounter Data Validation Version: 3.0 HHSC Approval Date: Page 47
13 Van Herck, P, D De Smedt, L Annemans, R Remmen, MB Rosenthal, and W Sermeus. Systematic review: Effects, design choices, and context of pay-for-performance in health care. BMC Health Services Research. 2010 Aug 23;10:247. doi: http://dx.doi.org/10.1186/1472-6963-10-247 14 CMS 2014. 15 MHPA 2012. 16 CMS 2014. 17 Hagan, Joseph F, Judith S Shaw, and Paula Duncan. Bright Futures: Guidelines for Health Supervision of Infants, Children, and Adolescents. American Academy of Pediatrics. 2007. https://brightfutures.aap.org/materials-and-tools/guidelines-and-pocket-guide/Pages/default.aspx 18 CMS 2014. 19 MHPA 2012. 20 HHSC. 2008. HHSC Uniform Managed Care Manual: Disease Management. Available at: http://www.hhsc.state.tx.us/medicaid/managed-care/umcm/Chp9/9_1.pdf. 21 Okelo SO, AM Butz, R Sharma, GB Diette, SI Pitts, TM King, ST Linn, M Reuben, Y Chelladurai, and KA Robinson. 2016. Interventions to modify health care provider adherence to asthma guidelines: a systematic review. Pediatrics 2013 Sep;132(3):517-34. doi: 10.1542/peds.2013-0779. 22 Crocker DD, S Kinyota, GG Dumitru, CB Ligon, EJ Herman, JM Ferdinands, DP Hopkins, BM Lawrence, and TA Sipe. 2011. Effectiveness of home-based, multi-trigger, multicomponent interventions with an environmental focus for reducing asthma morbidity: a community guide systematic review. American Journal of Preventive Medicine 2011 Aug;41(2 Suppl 1):S5-32. doi: 10.1016/j.amepre.2011.05.012. 23 Alzahrani, YA, EA Becker. Asthma Control Assessment Tools. Respiratory Care. 2016 Jan;61(1):106-16. doi: 10.4187/respcare.04341 24 Klok T, AA Kaptein, and PL Brand. 2015. Non-adherence in children with asthma reviewed: The need for improvement of asthma care and medical education. Pediatric Allergy and Immunology. 2015 May;26(3):197-205. doi: 10.1111/pai.12362 25 Blakemore, A, C Dickens, R Anderson, B Tomenson, A Woodcock, and E Guthrie. Complex interventions reduce use of urgent healthcare in adults with asthma: systematic review with meta-regression. Respiratory Medicine. 2015 Feb;109(2):147-56. doi: 10.1016/j.rmed.2014.11.002 26 Pinnock, H, E Epiphaniou, G Pearce, H Parke, T Greenhalgh, A Sheikh, CJ Griffiths, and SJ Taylor. Implementing supported self-management for asthma: a systematic review and suggested hierarch of evidence of implementation studies. BMC Medicine. 2015 Jun 1;13:127. doi: 10.1186/s12916-015-0361-0 27 Thota AB, TA Sipe, GJ Byard, CS Zometa, RA Hahn, LR McKnight-Eily, DP Chapman, AF Abraido-Lanza, JL Pearson, CW Anderson, AJ Gelenberg, KD Hennessy, FF Duffy, ME Vernon-Smiley, DE
Texas Contract Year 2015 External Quality Review Organization: Summary of Activities and Trends in Health Care Quality Addendum: Performance Improvement Projects and Encounter Data Validation Version: 3.0 HHSC Approval Date: Page 48
Nease Jr, SP Williams; and Community Preventive Services Task Force. 2012. Collaborative care to improve the management of depressive disorders: a community guide systematic review and meta-analysis. American Journal of Preventive Medicine. 2012 May;42(5):525-38. doi: 10.1016/j.amepre.2012.01.019 28 Ross LE, S Vigod, J Wishart, M Waese, JD Spence, J Oliver, J Chambers, S Anderson, R Shields. 2015. Barriers and facilitators to primary care for people with mental health and/or substance use issues: a qualitative study. BMC Family Practice. 2015 Oct 13;16(1):135. doi: 10.1186/s12875-015-0353-3 29 Janssen EM, EE McGinty, ST Azrin, D Juliano-Bult, and GL Daumit. 2015. Review of the evidence: prevalence of medical conditions in the United States population with serious mental illness. General Hospital Psychiatry. 2015 May-Jun;37(3):199-222. doi: 10.1016/j.genhosppsych.2015.03.004 30 Siu, Albert L. and the US Preventive Services Task Force (USPSTF). 2016. Screening for Depression in Adults: US Preventive Services Task Force Recommendation. JAMA. 2016;315(4):380-387. doi: 10.1001/jama.2015.18392 31 Siu, Albert L. and the US Preventive Services Task Force (USPSTF). 2016. Screening for Depression in Children and Adolescents: US Preventive Services Task Force Recommendation. Pediatrics. 2016 Mar;137(3):1-8. doi: 10.1542/peds.2015-4467 32 Conn VS, TM Ruppar, M Enriquez, and P. Cooper. Medication adherence interventions that target subjects with adherence problems: systematic review and meta-analysis. Research in Social and Administrative Pharmacy. 2016 Mar-Apr;12(2):218-46. 10.1016/j.sapharm.2015.06.001 33 Young SL, M Taylor, SM Lawrie. 2015. "First do no harm." A systematic review of the prevalence and management of antipsychotic adverse effects. Journal of Psychopharmacology. 2015 Apr;29(4):353-62. doi: 10.1177/0269881114562090 34 Pringsheim T, D Lam, H Ching, and S Patten. 2011. Metabolic and neurological complications of second-generation antipsychotic use in children: a systematic review and meta-analysis of randomized controlled trials. Drug Safety. 2011 Aug 1;34(8):651-68. doi: 10.2165/11592020-000000000-00000 35 Almandil NB, Y Liu, ML Murray, FM Besag, KJ Aitchison, IC Wong. 2013. Weight gain and other metabolic adverse effects associated with atypical antipsychotic treatment of children and adolescents: a systematic review and meta-analysis. Pædiatric Drugs. 2013 Apr;15(2):139-50. doi: 10.1007/s40272-013-0016-6 36 CMS. 2012d. EQR Protocol 4: Validation of Encounter Data Reported by the MCO. Available at: https://www.medicaid.gov/medicaid-chip-program-information/by-topics/quality-of-care/downloads/eqr-protocol-4.pdf
Texas Contract Year 2015 External Quality Review Organization: Summary of Activities and Trends in Health Care Quality Addendum: Performance Improvement Projects and Encounter Data Validation Version: 3.0 HHSC Approval Date: Page 49