Page 1
Questions or comments concerning this publication shall be directed to
Maya Halebic at [email protected] , (210) 208-8212.
Texas Population Growth, Projections,
and Implications
Maya Halebic , M.B.A.
Senior Economist
MARCH 2012
Page 2
The Shifting Demography of Texas
“Rich natural resources, abundant land, a central location within
the United States and a business-friendly environment have long
attracted both immigrants and U.S. natives to Texas. As a result,
the state’s population is faster growing, younger and more diverse
than the nation’s. These rapid demographic changes present
challenges for the future. […] Hispanics, already a dominant force
in Texas, are expected to become the majority population group by
2020. The significant increase in this population (both immigrant
and native) has far-reaching implications for education, housing
and the labor force.”D’Ann Petersen and Laila Assanie, Federal Reserve Bank of Dallas
2
Page 3
Population and Population Change in
Texas, 1950-2010
TEXAS Change in Population
Year Population Numerical Percent
1940 6,414,824 - -
1950 7,711,194 1,296,370 20.21%
1960 9,579,677 1,868,483 24.23%
1970 11,196,730 1,617,053 16.88%
1980 14,229,191 3,032,461 27.08%
1990 16,986,510 2,757,319 19.38%
2000 20,851,820 3,865,310 22.76%
2010 25,145,561 4,293,741 20.59%
Source: U.S. Census Bureau
3
According to the 2010 Census,
Texas has a total population of
25,145,561.
From 2000 to 2010, the total
population of the state of Texas
increased by 4,293,741 persons,
from 20,851,820 in 2000 to
25,145,561 in 2010. Thus, the total
population grew by 20.59%.
Over the past 50 years, the greatest
population growth was recorded for
the period 1970-1980. Driven
primarily by the Texas oil boom,
the state’s total population grew by
27.08% during this time period.
Table 1
Page 4
UNITED STATES Change in Population
Year Population Numerical Percent
1940 131,669,275 - -
1950 150,697,361 19,028,086 14.45%
1960 179,323,175 28,625,814 19.00%
1970 203,302,031 23,978,856 13.37%
1980 226,545,805 23,243,774 11.43%
1990 248,709,873 22,164,068 9.78%
2000 281,421,906 32,712,033 13.15%
2010 308,745,538 27,323,632 9.71%
Population and Population Change in the
United States, 1950-2010
Source: U.S. Census Bureau
4
Based on the 2010 Census, the
United States has a total population
of 308,745,538.
From 2000 to 2010, the nation’s
total population grew by 27,323,632
persons, from 281,421,906 in 2000
to 308,745,538 in 2010.
Thus, the total population of the
United States grew by 9.71%.
Over the past 50 years, the greatest
population growth was recorded for
the period 1950-1960, mainly driven
by the baby boomers. During this
time period, the nation’s total
population rose by 19.00%.
Table 2
Page 5
Texas and U.S. Population Growth, 1970-2000Annual Growth Rate
2.43%
1.79%
2.07%1.89%
1.09%0.94%
1.24%
0.93%
0.00%
0.50%
1.00%
1.50%
2.00%
2.50%
3.00%
1970s 1980s 1990s 2000
Texas U.S.Source: U.S. Census Bureau
5
Since the 1970s, Texas has grown
faster than the nation.
During the Texas oil boom of the
1970s, Texas more than doubled the
nation’s population growth.
Even with the late-2000s financial
crisis, the state’s population grew
by 1.89% annually, increasing
almost twice as fast as the nation’s.
The state’s historically high birth
rates and a strong pace of net
migration have contributed to a
growing population (see Table 3 in
the next slide).
Figure 1
Page 6
Total Population and Components of
Population Change in Texas, 1950-2009
Year* PopulationTotal
Increase
Natural
Increase**
Net
Migration***
Percent
Change
Percent Change Due To
Natural
IncreaseNet Migration
1950 7,711,194 - - - - - -
1960 9,579,677 1,868,483 1,754,652 113,831 24.23% 93.91% 6.09%
1970 11,196,730 1,617,053 1,402,683 214,370 16.88% 86.74% 13.26%
1980 14,229,191 3,032,461 1,260,794 1,771,667 27.08% 41.58% 58.42%
1990 16,986,510 2,757,319 1,815,670 941,649 19.38% 65.85% 34.15%
2000 20,851,820 3,865,310 1,919,281 1,946,029 22.76% 49.65% 50.35%
2009 24,782,302 3,930,482 2,124,124 1,806,358 18.85% 54.04% 45.96%
* All values for the decennial dates are for the indicated census year. Values for 2009 are for July 1 as estimated by the U.S. Census Bureau.
** Natural increase is defined as births less deaths.
*** Net migration is defined as the total number of immigrants less the annual number of emigrants, including both citizens and noncitizens.
Source: U.S. Census Bureau
6
Table 3
Page 7
Growth of the Foreign-Born Population,
1990-2000 and 2000-2009
57.37%
90.21%
175.09%
130.76%
77.74%
52.69%
23.82%
37.43%45.86%
10.87%
24.78%35.40%
0.00%
20.00%
40.00%
60.00%
80.00%
100.00%
120.00%
140.00%
160.00%
180.00%
200.00%
U.S. Texas Austin Dallas Houston San
Antonio
1990-2000 2000-2009
Source: U.S. Census Bureau;
Texas State Data Center
7
Figure 2 The foreign-born population share in Texas
rose significantly during the 1990s. Thus,
from 1990 to 2000, the foreign-born
population in the state rose by 90.21%. In
comparison, the foreign-born population at
the national level increased by 57.37%
during this time period.
During the 1990s, Austin, among all major
Texas metropolitan areas, experienced the
largest relative increase of the foreign-born
population, well above the state average of
90.21%. Of Texas’ major metros, Houston
(77.74%) and San Antonio (52.69%)
recorded foreign-born growth rates below
the state average.
Shares of the foreign-born in the U.S.,
Texas, and in the major metros are shown in
Figure 3 in the next slide.
Page 8
Share of the Foreign-Born Population,
1990, 2000, and 2009
7.9%9.0% 8.5%
12.5%
17.8%
9.4%11.1%
13.9%
16.6%
24.4%
26.4%
11.7%12.5%
16.1%
20.2%
24.8%
28.5%
13.2%
0.0%
5.0%
10.0%
15.0%
20.0%
25.0%
30.0%
U.S. Texas Austin Dallas Houston San Antonio
1990 2000 2009Source: U.S. Census Bureau;
Texas State Data Center
8
Figure 3
Page 9
Texas Population by Race and Ethnicity,
1980-2010
1980 1990 2000 2010
White 9,350,297 10,291,680 11,074,716 11,397,345
Black 1,692,542 1,976,360 2,421,653 2,886,825
Hispanic 2,985,824 4,339,905 6,669,666 9,460,921
Other 200,528 378,565 685,785 1,400,470
0
2,000,000
4,000,000
6,000,000
8,000,000
10,000,000
12,000,000
Source: U.S. Census Bureau;
Texas State Data Center
9
Figure 4 Over the past three decades, Texas’
population has changed much in
regard to its racial and ethnic
background.
While the number of Whites and
Blacks has experienced only slight
increases over the period 1980-2010,
the number of the state’s Hispanics
has seen considerable growth.
From 2000 to 2010, Texas’ Hispanic
population increased by 41.85%,
while the state’s White and Black
population grew by 2.91% and
19.21%, respectively.
Shares of the Texas population by race
and ethnicity are shown in Figure 5 in
the next slide.
Page 10
Share of the Texas Population by Race and
Ethnicity, 1980-2010
65.71%
60.59%
53.11%
45.33%
11.89% 11.63% 11.61% 11.48%
20.98%
25.55%
31.99%
37.62%
1.41% 2.23% 3.29%5.57%
0.00%
10.00%
20.00%
30.00%
40.00%
50.00%
60.00%
70.00%
1980 1990 2000 2010
White Black Hispanic Other
Source: U.S. Census Bureau;
Texas State Data Center
10
Figure 5 During the time period 1980-2010, the share
of Texas’ White population has fallen, while
the share of the Hispanic population has
significantly increased. The share of the
state’s Black population has remained rather
constant.
The strong rise in Texas’ Hispanic
population has far-reaching implications.
Hispanics’ higher-than-average birth rate,
which drives the growth in this population,
suggests that this group will continue to
grow at a more rapid pace than that of
Whites and Blacks. Additionally, Hispanics,
on average, are younger, which has
ramifications for housing, education, and
the work force.
In 2010, the median age of Hispanics in
Texas was 26.7 versus 40.9 for Texas
Whites. This compares with the median age
for all Texans of 33.4 and for the United
States of 36.9.
Page 11
Projected Proportion of Texas Population by
Race and Ethnicity, 2010-2040
2010 2020 2030 2040
White 45.33% 42.12% 37.04% 32.23%
Black 11.48% 10.90% 10.27% 9.52%
Hispanic 37.62% 42.43% 47.56% 52.58%
Other 5.57% 4.55% 5.13% 5.67%
0.00%
10.00%
20.00%
30.00%
40.00%
50.00%
60.00%
Note: Assuming net migration rate is half that
of 1990-2000.
Source: U.S. Census Bureau; Texas State Data
Center
11
Figure 6 Texas’ population will change in two major
ways over the next several decades: in diversity
and in age.
According to estimates by the Texas State Data
Center, by 2020, Hispanics will make up the
majority of the state’s population, while Whites
will fall to the second-most-populous ethnicity.
By 2040, Hispanics will account for over 50%
of all Texans.
Large disparities mark socioeconomic
conditions among Texas’ racial and ethnic
groups. Compared with their White
counterparts, the state’s Hispanics tend to have
lower levels of education (see Figure 7), have
lower wages (see Figure 8), and depend more
on state services. This is partly a result of
immigration. Without changes in socioeconomic
conditions, this suggests that Texas’ future
population could be less educated, less
competitive, poorer, and more in need of state
services.
Page 12
12
2.35%
5.92%
20.57%
4.66%
25.53%
7.11%
22.71%
11.13%
25.15%
16.31%
20.40%
5.03%
17.27%
4.55%
8.14%
3.16%
0.00% 5.00% 10.00% 15.00% 20.00% 25.00% 30.00%
Less than 9th grade
9th to 12th grade, no diploma
Regular high school diploma
GED or alternative credential
Some college, no degree
Associate's degree
Bachelor's degree
Graduate degree
Hispanic White
Educational Attainment by Race and Ethnicity
Among Population 25 Years or Older in Texas, 2010
Source: U.S. Census Bureau
Figure 7 Much of the education disparity in Texas is due to
rapid Hispanic immigration into the state:
immigrants’ income and education levels tend to
be much lower than natives.
According to the Texas State Data Center,
Hispanics are expected to make up the majority of
the labor force in Texas by 2040. If the education
disparity between Whites and Hispanics
continues, the state economy could face several
important challenges.
First, by 2040, about 30% of the Texas labor
force will not have a high school diploma, up
from 19% in 2000. If that occurs, a higher
percentage of Texas’ labor force would be less
educated and low skilled, potentially making the
state economy less competitive.
Second, empirical studies show that low
education levels are associated with lower income
levels. Thus, failure to complete high school or
college negatively impacts average earnings.
Page 13
Per Capita Income by Race and Ethnicity
in Texas, 201013
$34,826
$14,169
$0
$5,000
$10,000
$15,000
$20,000
$25,000
$30,000
$35,000
$40,000
White HispanicNote: All data are in 2010 inflation-adjusted dollars.
Source: U.S. Census Bureau
Figure 8 The existing income differential between
Whites and Hispanics could lead to a large
share of Texans being drawn into poverty in the
future.
According to the Texas State Data Center, the
percentage of households with annual incomes
of $25,000 or less is projected to increase from
31% (in 2000) to 38% by 2040. Furthermore,
the share of families with earnings exceeding
$100,000 will fall from 12% to 9% . The net
impact could be a decline in real income,
reduced tax revenue per household, and
increased burden on the state government to
pay for welfare services in Texas.
As Texas is likely to depend progressively
more on Hispanic Texans for future tax
revenues, it is important to lessen the existing
income gap and educational differential
between Hispanics and Non-Hispanics.
Page 14
2010 2020 2030 2040
White 54.68% 52.22% 47.85% 43.41%
Black 7.02% 7.39% 6.98% 6.53%
Hispanic 31.36% 35.28% 39.60% 44.02%
Other 6.93% 5.10% 5.57% 6.04%
0.00%
10.00%
20.00%
30.00%
40.00%
50.00%
60.00%
Projected Proportion of Austin-Round Rock
Population by Race and Ethnicity, 2010-2040
Note: Assuming net migration rate is
half that of 1990-2000.
Source: U.S. Census Bureau; Texas
State Data Center
14
Figure 9
Page 15
2010 2020 2030 2040
White 50.25% 47.10% 40.99% 35.23%
Black 14.78% 13.27% 12.40% 11.34%
Hispanic 27.50% 33.42% 39.70% 45.91%
Other 7.47% 6.21% 6.91% 7.52%
0.00%
10.00%
20.00%
30.00%
40.00%
50.00%
60.00%
Projected Proportion of Dallas-Fort Worth-Arlington
Population by Race and Ethnicity, 2010-2040
Note: Assuming net migration rate
is half that of 1990-2000.
Source: U.S. Census Bureau; Texas State
Data Center
15
Figure 10
Page 16
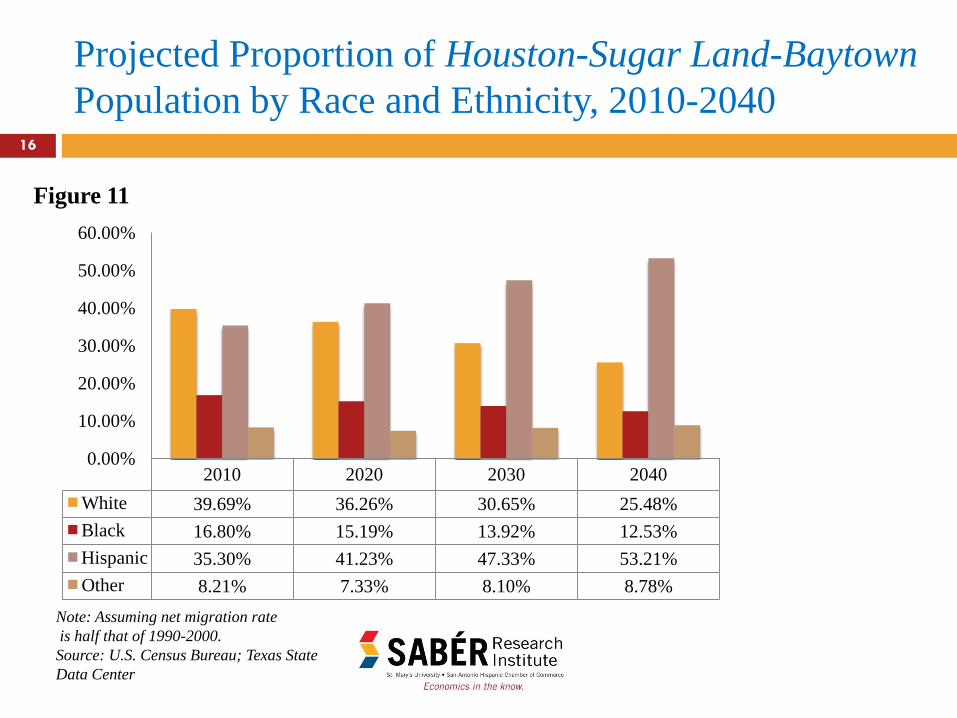
2010 2020 2030 2040
White 39.69% 36.26% 30.65% 25.48%
Black 16.80% 15.19% 13.92% 12.53%
Hispanic 35.30% 41.23% 47.33% 53.21%
Other 8.21% 7.33% 8.10% 8.78%
0.00%
10.00%
20.00%
30.00%
40.00%
50.00%
60.00%
Projected Proportion of Houston-Sugar Land-Baytown
Population by Race and Ethnicity, 2010-2040
Note: Assuming net migration rate
is half that of 1990-2000.
Source: U.S. Census Bureau; Texas State
Data Center
16
Figure 11
Page 17
2010 2020 2030 2040
White 36.12% 34.53% 31.75% 29.25%
Black 6.07% 6.02% 5.85% 5.64%
Hispanic 54.06% 56.55% 58.99% 61.12%
Other 3.76% 2.89% 3.41% 3.98%
0.00%
10.00%
20.00%
30.00%
40.00%
50.00%
60.00%
70.00%
Projected Proportion of San Antonio-New Braunfels
Population by Race and Ethnicity, 2010-2040
Note: Assuming net migration rate
is half that of 1990-2000.
Source: U.S. Census Bureau; Texas State
Data Center
17
Figure 12
Page 18
U.S. Population by Age, 201018
0
5,000,000
10,000,000
15,000,000
20,000,000
25,000,000
Figure 13Baby Boomers
Echo Boomers Texas’ overall population,
like the nation’s, is
growing older. This aging
is mainly a result of the
maturing of the largest
segment of the nation’s
population: the baby boom
generation.
The youngest of the baby
boom generation will turn
60 by 2024. As they retire,
they will put large
demands on the Social
Security system and other
government programs for
the elderly. Furthermore,
the baby boomers may
drive housing demand
toward move-up or second
homes.
Source: U.S. Census Bureau
Page 19
Texas Population by Age and Ethnicity, 2010
19
0.00%
10.00%
20.00%
30.00%
40.00%
50.00%
60.00%
70.00%
80.00%
Under
5 years
5 to 9
years
10 to
14
years
15 to
19
years
20 to
24
years
25 to
29
years
30 to
34
years
35 to
39
years
40 to
44
years
45 to
49
years
50 to
54
years
55 to
59
years
60 to
64
years
65
years
and
over
White Hispanic
Figure 14
Source: U.S. Census Bureau
One factor that may
moderate Texas’ aging
population is that the fast-
growing Hispanic population
has a different age structure
than the White population.
In 2010, the state’s
population in age groups
over 35 was predominantly
White. For instance, in 2010,
59.85% of Texans aged 55-
59 were White compared
with 24.97% that were
Hispanic. On the other hand,
of Texans aged 5 and under,
49.94% were Hispanic, while
35.60% were White.
Page 20
Texas Population by Age and Ethnicity, 2040
20
Figure 15
Source: U.S. Census Bureau
0.00%
10.00%
20.00%
30.00%
40.00%
50.00%
60.00%
70.00%
Under
5 years
5 to 9
years
10 to
14
years
15 to
19
years
20 to
24
years
25 to
29
years
30 to
34
years
35 to
39
years
40 to
44
years
45 to
49
years
50 to
54
years
55 to
59
years
60 to
64
years
65
years
and
over
White Hispanic
Assuming further rapid
growth of Texas’ Hispanic
population, Hispanics will
make up a much higher
percentage of most age
groups by 2040, with only
those 65 years and over being
predominantly White.
The age differential between
the Hispanic and the White
populations has important
implications for education,
housing, and state services.
Page 21
Poverty Characteristics of United States, Texas, and
Its Major and Border Metropolitan Areas, 1989-201021
Individuals below poverty Percent below poverty
Place 1989 1999 2010 1989 1999 2010
U.S. 31,742,864 33,899,812 40,917,513 13.1% 12.4% 13.8%
Texas 3,000,515 3,117,609 3,972,054 18.1% 15.4% 16.8%
Austin-Round Rock- San
Marcos129,942 134,589 220,577 15.9% 11.1% 13.9%
Brownsville-Harlingen 101,362 109,288 135,270 39.7% 33.1% 34.7%
Dallas-Forth Worth-Arlington 322,604 384,146 812,558 12.3% 11.1% 13.4%
El Paso 155,298 158,722 194,454 26.8% 23.8% 25.6%
Houston-Sugar Land-Baytown 494,457 572,410 840,268 15.1% 13.9% 15.0%
Laredo 50,116 59,339 70,879 38.2% 31.2% 29.8%
McAllen-Edinburg-Mission 159,216 201,865 251,650 41.9% 35.9% 34.4%
San Antonio-New Braunfels 252,301 234,478 317,801 19.5% 15.1% 15.8%
Table 4
Source: U.S. Census Bureau;
Texas State Data Center
While the poor live all over
the state, the border
metropolitan areas fare
worst, with the highest
poverty rates.
Even though poverty rates
fell in the border metros
during the 1990s as the
economy boomed, the
percentage of the population
below poverty level
remained well above the
state average of 15.4% in
1999.
In contrast, poverty levels in
the major Texas metros have
rarely been above the state
average.
Page 22
Sources 22
“The Changing Face of Texas: Population Projections and Implications,” by
D’Ann Petersen and Laila Assanie, Federal Reserve Bank of Dallas, October
2005. http://dallasfed.org/research/pubs/fotexas/fotexas_petersen.html
U.S. Census Bureau, American Fact Finder
http://factfinder2.census.gov/faces/nav/jsf/pages/index.xhtml
Texas State Data Center
http://txsdc.utsa.edu/Reports/Subject/
Page 23
SABÉR Research Institute
200 East Grayson Street, Suite 203
San Antonio, Texas 78215
One Camino Santa Maria
San Antonio, Texas 78228
(210) 208-8212
www.saberinstitute.org