S. Nalesso , C. Codemo, E. Franceschinis, N. Realdon, R. Artoni, A.C. Santomaso, Texture analysis asa tool to study the kinetics of wet agglomeration processes (2015) International Journal of
Texture analysis as a tool to study the kinetics of wet agglomeration processesSilvia Nalessoa , Carlo Codemob , Erica Franceschinisb, Nicola Realdonb ,Riccardo Artonic, Andrea C.
Santomasoa,*aAPTLab - Advanced Particle Technology Laboratory, University of Padova, Department of Industrial Engineering, via
Marzolo 9, 35131 Padova, ItalybPharmaTeG - Pharmaceutical Technology Group, University of Padova, Department of Pharmaceutical and
Pharmacological Sciences, via Marzolo 5, 35131 Padova, ItalycLUNAM Université, IFSTTAR, site de Nantes, MAST/GPEM, Route de Bouaye CS4, 44344 Bouguenais, France
AbstractIn this work wet granulation experiments were carried out in a planetary mixer with the aim
to develop a novel analytical tool based on surface texture analysis. The evolution of a simpleformulation (300 g of microcrystalline cellulose with a solid binders pre-dispersed in water) wasmonitored from the very beginning up to the end point and information on the kinetics ofgranulation as well as on the effect of liquid binder amount were collected. Agreement betweentexture analysis and granules particle size distribution obtained by sieving analysis was alwaysfound. The method proved to be robust enough to easily monitor the process and its use for morerefined analyses on the different rate processes occurring during granulation is also suggested.
1. IntroductionWet granulation is a common pharmaceutical operation aiming at eliminating unfavorable
properties of fine powders, improving flow properties, compaction characteristics and compositionhomogeneity of the granulated products. It is usually performed in four phases: (1) homogenizationof dry powders; (2) liquid addition; (3) wet massing with liquid feeding system switched off; (4)granules drying. All these phases (excepted drying) are often carried out in mechanically agitatedvessels which can promote efficient mixing also of cohesive materials. Such mixers exert an intenselocal shear on the powder which breaks down the small cohesive aggregates (Harnby, 1997),promotes a good liquid dispersion and a proper product consolidation (Cavinato et al., 2010). Theyare generally constituted by a vessel and an impeller rotating about an horizontal or a vertical axis.When rotating about a vertical axis, the impeller can also revolve following circular trajectories sothat these mixer-granulators are called planetary or orbital mixers (Laurent, 2005; Hiseman et al.,2002). In some cases the rotating axis does not revolve but it is the vessel that rotates (Boerefijn etal., 2009). Despite the large use of this type of granulators in many industrial processes, theagglomeration mechanisms caused by liquid binder addition are currently not totally understood(Laurent, 2005; Knight et al., 2001). Granulation can be indeed affected by a large number ofvariables, including process parameters, material properties and formulation variables (Faure et al.,2001). Monitoring the behavior of a wet bed of powders and following its evolution during time is
S. Nalesso , C. Codemo, E. Franceschinis, N. Realdon, R. Artoni, A.C. Santomaso, Texture analysis asa tool to study the kinetics of wet agglomeration processes (2015) International Journal of
of paramount importance to design, analyze and control the pharmaceutical manufacturing processin a Process Analytical Technology (PAT) perspective. Different techniques have been used in thepast to monitor and carry out a description of the powder agglomeration process within the mixer-granulator. A comprehensive review of such techniques can be found in Watano (2001). Most of themeasurement methods can give an indirect information on the status of the granulation processsince they do not observe the particles directly but they measure physical variables supposed to berelated to particle size. Acoustic emission, for example, has shown possibilities for granulation end-point detection (Briens et al., 2007). Also amperage or motor power consumption and impellertorque are frequently monitored as indirect measures of the agglomeration process. Particularly,power consumption and impeller torque have been used to identify how the system evolve duringthe agglomeration as a function of mixer geometric configuration (impeller and bowl shape) andimpeller speed (Paul et al., 2003). Leuenberger et al. (2009) have investigated the relationshipbetween granule growth and power consumption curves and have demonstrated the possibility ofend-point determination by power consumption monitoring. Bier et al. (1979) also reported thatrecords of power consumption and torque were in good agreement. In alternative to the end pointdetermination Leuenberger et al. (2009), torque has been used also to predict the starting point ofgranulation (Cavinato et al., 2010, 2013) as a function of liquid binder amount. All this methodshowever, even if effective in collecting information about the process, are indirect; other techniquescan give a more direct information on the status of the granules in the mixer-granulator. Techniquessuch as the focused beam reflectance measurement (FBRM), which allows to follow the granulechord length evolution in real time (Huang et al. 2010), are starting to be used in wet granulationstudies. Also the simultaneous combination of different techniques such as FBRM, acousticemission measurement and near infrared spectroscopy have been used to asses granulation rates influidized beds (Tok et al., 2008). A direct measurement and control of granule growth can be alsoachieved through the use of sensors capturing digital images of the powder bed and analyzing themwith image analysis techniques. Image processing systems have been used for direct and continuousmonitoring of the granule growth in fluidized bed granulation (Watano, 2001) and in high sheargranulators (Watano et al., 2001). Since all the above techniques try to identify each particleindividually, issues related to particles overlapping and contacts, and to the minimum number ofparticles to be analyzed exist. For process control purposes it would be advisable to develop PATanalyzers able to process thousand of particles simultaneously and extract averaged information onthe status of the granular mixture during time, possibly providing real-time process information.Texture analysis (TA) of digital images of the powder bed surface (also known as surface imaging(Lakio et al., 2012)) can be potentially used in this sense. TA is already used in a variety ofapplications spanning from remote sensing to automated inspection and medical image processing(Russ, 1999; Gonzales et al., 2004). The basic idea behind the use of TA is that smooth surfaces willhave small variation in gray scale values and the rougher the surface the larger are the variations. Inthe pharmaceutical context it has been used to determine the particle size distribution (PSD)(Laitinen et al., 2002) and the segregation tendency of granulated products (Lakio et al., 2012) instatic conditions. In this work the wet granulation process was studied with TA by taking time seriesof digital images of the moving powder bed inside the granulator during the whole granulationprocess. The subsequent analysis was therefore carried out on the bulk powder (not on single
S. Nalesso , C. Codemo, E. Franceschinis, N. Realdon, R. Artoni, A.C. Santomaso, Texture analysis asa tool to study the kinetics of wet agglomeration processes (2015) International Journal of
granules) and its evolution from being a dry mixture up to a wet mass of distinct aggregates wasmonitored and studied. The aim of the work was to assess if TA can be used as an analytical tool toobserve the effect of different liquid binder addition rates and amounts on the granulation kineticsand on product properties.
The paper is structured as follow: in Section 2 some principles of image and texture analysisare resumed and the texture descriptors, the experimental set-up and the materials are presented.The potential of the texture analysis is verified and tested in Section 3 with preliminary experimentsin simplified and controlled conditions. In Section 4 the use of TA is finally described in wetgranulation experiments where the granulation kinetics are measured as a function of binderaddition rate and the effects of binder total amount on granules PSDs are described.
2. Experiments and methods2.1. Texture analysis
The main advantages of looking at surface texture are that the technique is not invasive andthe particles are not analyzed individually but in bulk. Moreover issues on sample preparation, onthe number of granules to be analyzed, on the dispersion of the material to avoid particlesoverlapping and contacts are therefore avoided. Since the camera can be positioned far enough fromthe moving powder bed, fouling of the lenses can be avoided as well. This allows to analyze amoving bed of particles provided that the surface is sufficiently defined and a suitable lightningsource is available.
TA attempts to quantify intuitive qualities described by terms such as rough, smooth, silky orbumpy as a function of the spatial variation in pixel intensities on gray-scale digital images that inour case are pictures of the powder bed surface (Laitinen et al., 2002). A digital image (raster orbitmap image) is a binary representation of a two-dimensional image with a finite set of digitalvalues, called picture elements or pixels. Pixels are ordered in a fixed number of rows and columnsand hold a set of quantized values that represent the color and the brightness at any specific point.Often for scientific and industrial purposes digital images are in gray-scale i.e. only the brightnesszi (or intensity level) is given for each pixel (Russ, 1999; Gonzales et al., 2004). The index iindicate the level number which for a 8 bit image spans from 0 to 28 = 256. Level intensities can begraphically represented according to their frequency of appearance in the image (number of pixelswith a given intensity) as histograms f(zi). Two examples of intensity histograms are shown inFigure 1. They characterize two images of generic granules with different size. It can be appreciatedalso by simple visual inspection that the larger the granules size, the more contrasted the surfaceand the broader the corresponding histogram, i.e. f(zi) spreads over a larger number of intensitylevels. It is therefore clear that a correlation between intensity level histogram, texture of the imageand particle size exists and this correlation can be used to study the granulation process wherechanges in size of the wet aggregates occur.
Several texture descriptors of different complexity exist. In order of increasing complexity,we can enumerate descriptors based on the average value, the standard deviation (STD), the thirdmoment of the intensity level histogram and those based on the gray level co-occurence matrix(GLCM). GLCM is a second order statistics which describes the spatial correlation between couples
S. Nalesso , C. Codemo, E. Franceschinis, N. Realdon, R. Artoni, A.C. Santomaso, Texture analysis asa tool to study the kinetics of wet agglomeration processes (2015) International Journal of
of neighbouring pixels by compiling the frequency for which different gray level intensities arefound in a defined area (Gosselin at al., 2008). On the whole 11 descriptors have been consideredbut finally the standard deviation STD of f(zi) has been used in this study since most of the texturedescriptors were found to be equivalent to STD (the same or similar information could beextracted). Similarly to other texture descriptors (such as smoothness, uniformity or entropy whichimplementation can be found in Gonzales et al., 2004) STD is based on some statistics performedon f(zi) . In particular the STD in mathematical form is expressed as:
σ=√μ2 ( zi ) (1)and is related to the second moment, μ2 , about the mean m of the histogram f(zi):
μ2=∑ (zi−m)2 f (zi ) (2)
From the observations and reasonings made on Figure 1 it is intuitable that the STD, whichis recognized as a simple but robust measure of the average contrast of the image (Gonzales et al.,2004), has the potential for being used as an analytical tool in the granulation process.
2.2. Image AcquisitionTwo different types of experiments were performed, static and dynamic tests, with
increasing level of difficulty for the image acquisition process. Static tests were performed on smallsamples of granulated dry materials of known particle size and size distribution, in order to verifythe feasibility of the TA in simplified conditions. Tests were performed in a simple ad hoc setupwith controlled lightning conditions. It was a photographic box made of an open vertical PVCcylinder (150 mm in diameter and 200 mm long); the powder was put in a 25 cm3 cup (27.4 mm indiameter) placed at center of the cylinder base (Figure 2). The light source was constituted by acontinuous strip of white LEDs fitted to the internal wall of the box to form a ring. A digital camera(DBK-61BUC02, 1/2” CMOS, 2048×1536, The Imaging Source, Bremen, Germany) with12mm/1:1.4 lens (Pentax) and a 5 mm spacer was aligned on the top of the cylinder axis to takepictures of the sample surface.
In the dynamic tests the same camera was placed above the mixer vessel but for geometricconstraints due to the arm holding the impeller, it was not axially positioned. Because of the offsetonly a portion of the bed surface was monitored. The image acquisition process was automated at aframe rate of 0.5 fps and with an exposure time of 1/714 s. A relatively short exposure time wasrequired to avoid the blurring of the images due to the surface motion. As a consequence of theshort exposure time of the CMOS sensor a more intense lightning of the surface was required. Thelight source was constituted by three continuous strips of white LEDs (instead of one as in the staticexperiments) fitted to form three rings. The rings were fixed to the mixer internal wall through ametallic structure (Figure 3). In both cases the height of the light source with respect to the powdersurface was roughly 80-90 mm, while that of the camera was 290 mm.
Because of the orbital motion it could be that the impeller appeared in some of the imagestaken during the granulation experiments biasing the analysis. The upper part of the impeller wastherefore painted green and pictures containing green pixels were automatically discarded byworking in the HSV (hue, saturation and value) color-space where green was found in the range0.3-0.4 of the hue channel (Dal Grande et al., 2008). The image selection procedure and the TA
S. Nalesso , C. Codemo, E. Franceschinis, N. Realdon, R. Artoni, A.C. Santomaso, Texture analysis asa tool to study the kinetics of wet agglomeration processes (2015) International Journal of
were not performed on the full image but on a region of interest (ROI) of size 200 x 300 pixels. Theresolution of the images was 105 μm/pixel, so that the observation area was 21.0 x 31.5 mm large.The size, the shape and the position of the ROI were chosen with a trial and error procedure in orderto minimize the presence of the impeller blade in the pictures and consequently the number ofdiscarded images during the analysis. On the average 15% of the images were discarded. Afterselection, the ROI was converted to gray-scale and processed by TA. All the softwares for imageselection and for TA were customized and written in Matlab (MATLAB 7.5 and Image ProcessingToolbox 6.0, The MathWorks, Inc., Natick, Massachusetts, United States). Image acquisitioninstead was performed with the software bundled with the digital camera (IC Capture v2.2).
2.3. Powders and granulating liquidA simple formulation made up of microcrystalline cellulose (T1 Ph. Eur., MCC) was chosen
as it is commonly used in pharmaceutical granulations and has porous particles able to absorb highamount of granulation liquid. The batch size was 300g. The MCC particle size, determined withMalvern Mastersizer 2000 (Worcestershire,185 UK), expressed as d10 , d50 , d90 resulted equal to 13,48 and 176 μm respectively.
Dispersion in water of xanthan gum (XG) at 0.05w/w% was used as liquid binder. XG is apolysaccharide produced by aerobic fermentation of glucose, sucrose or lactose by the bacteriumXanthomonas campestris. It is used as a pharmaceutical thickening agent and as a stabilizer andthickening agent in food preparations (E415) because of its strong thickening power (Litster andEnnis, 2004). In order to obtain the liquid binders, XG powder was pre-dispersed in water. In thisway complications related to additional rate processes such as the hydration of the solid binderduring the granulation process were avoided.
The viscosity of the binder aqueous dispersion was measured with a rotational viscometer(Rotovisco RV20, Haake, Germany) and the surface tension with the sessile drop method(Middlemann, 1995). Their values were respectively 30 mPa s and 0.069 N/m, while the densitywas 998.0 kg/m3.
MCC and XG powders were provided by ACEF SpA, Fiorenzuola d’Arda, Piacenza, Italy.
2.4. Granulation procedureExperiments have been carried out in a planetary mixer (Kenwood Major Premier KMM
760, Kenwood Ltd., London, UK) which consisted of a bowl 200 mm high with 230 mm maximumdiameter and 6.7 l total volume. A standard K shaped impeller was used. The mixer bowl was openat the top so that it was possible to observe the powder bed by visual or camera inspection duringthe granulation process and a sensor was used to collect digital images of the powder bed asdescribed in Section 2.2. The mixer was operated at constant impeller speed of 100 rpm in all theexperiments. The ratio between rotations and revolutions was fixed by a gearing ratio of 3.333. Theworking conditions were chosen in order to ease the development of the analytical method based onTA. A detailed description of this specific mixer geometry and of the flow patterns inside the mixercan be found in dedicated papers (Hiseman et al., 2002; Laurent, 2005).
The granulation procedure followed these steps: a) powder loading, b) dry mixing (3minutes), c) wetting phase (with variable length from 4 to 36 minutes according to liquid binder
S. Nalesso , C. Codemo, E. Franceschinis, N. Realdon, R. Artoni, A.C. Santomaso, Texture analysis asa tool to study the kinetics of wet agglomeration processes (2015) International Journal of
addition rate), d) massing phase (5 minutes), e) granules discharge and f) drying.The liquid binder was added to the MCC using a peristaltic pump (Velp SP 311/2) by dripping fromthree evenly spaced points (droplet size was approximately 4 mm). The amount of liquid was fixedto 330 g excepted where specified. The feed flow rate adopted in the experiments were in the range9 to 83 ml/min. The feed rate was monitored by measuring the decrease in weight of the liquidremaining in the reservoir (see Figure 3). Granules were then dried in a ventilated oven attemperature of 50°C overnight and sieved (AS 200 control Retsch, Germany) using the followingsieves: 45, 100, 200, 300, 400, 500, 600, 710, 800, 1000, 1410, 2000, 5000 μm.
3. Results and discussionPreliminary static tests (out of the mixer) and dynamic tests (within the mixer) were carried
out in dry conditions in order to validate the TA and verify its ability to distinguish between powdermixtures made of particles with different sizes. This was of course a necessary prerequisite todevelop an analytical method able to follow particle size variations in time as a consequence ofliquid binder addition. It is important to emphasize here that no attempt were made to determine thefull PSD of the granulation products with TA since this task is beyond the scopes of this work. Inprevious literature works full PSDs of granules have been measured with TA by using static samplesunder sequential bidirectional lightning (Laitinen et al., 2002; Lakio et al., 2012). The strictlycontrolled lighting conditions adopted in such works can not be obtained inside the mixer indynamic conditions so that we limited the study to the use of a simple texture index, the STD,related to particle size in average sense.
3.1. Preliminary static testsTwo different tests were performed using static samples. The first test was made on
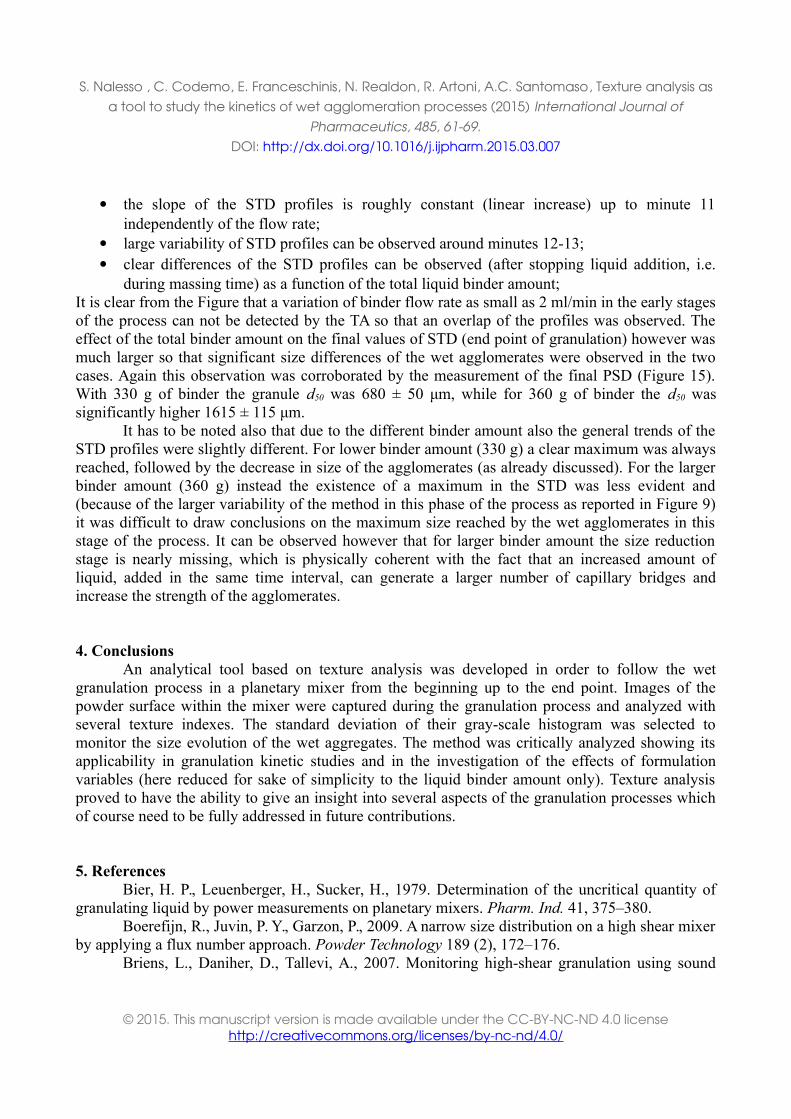
monodispersed powders or granules. A granulated microcrystalline cellulose was sieved in 7 sizeranges (spanning from 50 to 1000 μm). Images of bulk powder belonging to each size range weretaken in the photographic box and surface texture was analyzed. The results in terms of STD of thegray-scale histogram are shown in Figure 4 where it can be appreciated that the STD increasedmonotonically with the granules size in a quite large size range. A second test was then made inorder to verify if TA was effective also with polydispersed powder mixtures of smaller size (whichis more similar to what can be found in a granulator especially in the early stages of the process).Different quantities of MCC particles (d'
50 =75 μm) and granules (d''50 =250 μm) where mixed
together in 8 different proportions (0, 0.1, 0.2, 0.4, 0.5, 0.6, 0.8, 1.0 expressed as fractions of thegranules weight) and analyzed as previously described for the monodispersed case. Also in this casethe TA was able to distinguish between different samples with a roughly linear trend of the STD as afunction of the average particle size of the mixture calculated as d'
50 w + d''50 (1 − w), where w is the
weight fraction of larger particles (Figure 5).
3.2. Preliminary dynamic testsThe observation of the powder bed surface in process conditions, i.e. within the mixer with
impeller rotating at 100 rpm, was a more complex task than in static conditions. Many issues can
S. Nalesso , C. Codemo, E. Franceschinis, N. Realdon, R. Artoni, A.C. Santomaso, Texture analysis asa tool to study the kinetics of wet agglomeration processes (2015) International Journal of
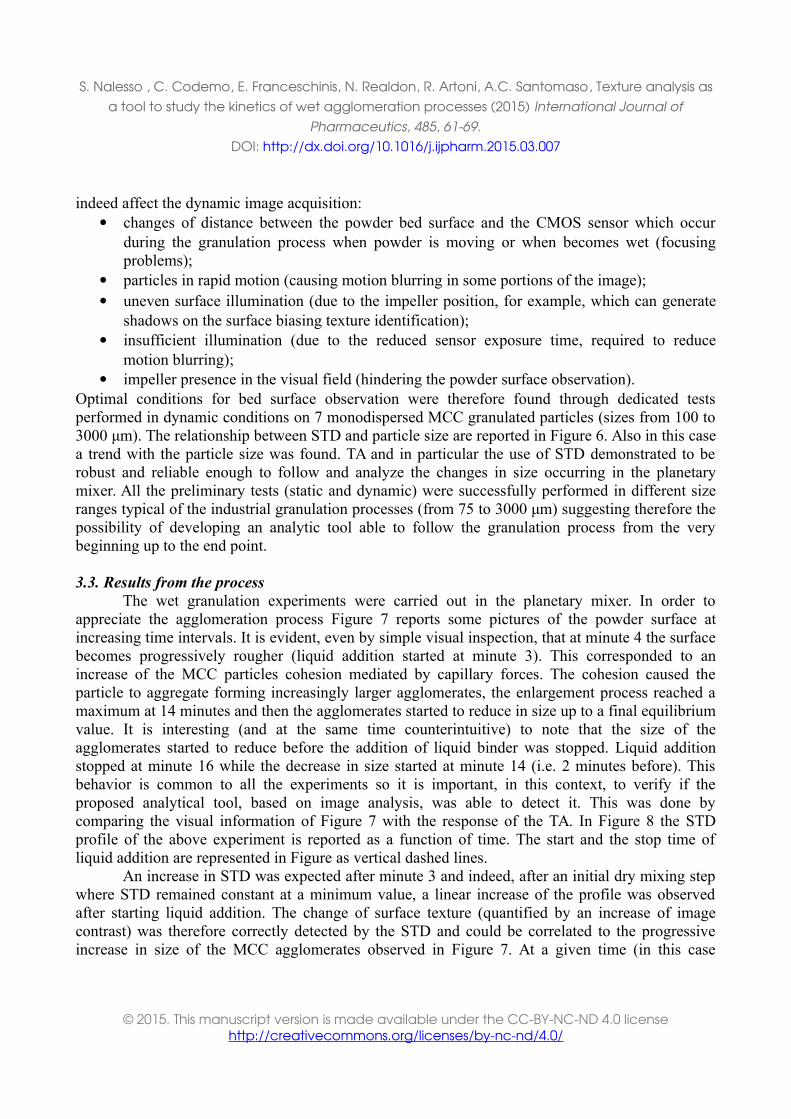
indeed affect the dynamic image acquisition: changes of distance between the powder bed surface and the CMOS sensor which occur
during the granulation process when powder is moving or when becomes wet (focusingproblems);
particles in rapid motion (causing motion blurring in some portions of the image); uneven surface illumination (due to the impeller position, for example, which can generate
shadows on the surface biasing texture identification); insufficient illumination (due to the reduced sensor exposure time, required to reduce
motion blurring); impeller presence in the visual field (hindering the powder surface observation).
Optimal conditions for bed surface observation were therefore found through dedicated testsperformed in dynamic conditions on 7 monodispersed MCC granulated particles (sizes from 100 to3000 μm). The relationship between STD and particle size are reported in Figure 6. Also in this casea trend with the particle size was found. TA and in particular the use of STD demonstrated to berobust and reliable enough to follow and analyze the changes in size occurring in the planetarymixer. All the preliminary tests (static and dynamic) were successfully performed in different sizeranges typical of the industrial granulation processes (from 75 to 3000 μm) suggesting therefore thepossibility of developing an analytic tool able to follow the granulation process from the verybeginning up to the end point.
3.3. Results from the processThe wet granulation experiments were carried out in the planetary mixer. In order to
appreciate the agglomeration process Figure 7 reports some pictures of the powder surface atincreasing time intervals. It is evident, even by simple visual inspection, that at minute 4 the surfacebecomes progressively rougher (liquid addition started at minute 3). This corresponded to anincrease of the MCC particles cohesion mediated by capillary forces. The cohesion caused theparticle to aggregate forming increasingly larger agglomerates, the enlargement process reached amaximum at 14 minutes and then the agglomerates started to reduce in size up to a final equilibriumvalue. It is interesting (and at the same time counterintuitive) to note that the size of theagglomerates started to reduce before the addition of liquid binder was stopped. Liquid additionstopped at minute 16 while the decrease in size started at minute 14 (i.e. 2 minutes before). Thisbehavior is common to all the experiments so it is important, in this context, to verify if theproposed analytical tool, based on image analysis, was able to detect it. This was done bycomparing the visual information of Figure 7 with the response of the TA. In Figure 8 the STDprofile of the above experiment is reported as a function of time. The start and the stop time ofliquid addition are represented in Figure as vertical dashed lines.
An increase in STD was expected after minute 3 and indeed, after an initial dry mixing stepwhere STD remained constant at a minimum value, a linear increase of the profile was observedafter starting liquid addition. The change of surface texture (quantified by an increase of imagecontrast) was therefore correctly detected by the STD and could be correlated to the progressiveincrease in size of the MCC agglomerates observed in Figure 7. At a given time (in this case
S. Nalesso , C. Codemo, E. Franceschinis, N. Realdon, R. Artoni, A.C. Santomaso, Texture analysis asa tool to study the kinetics of wet agglomeration processes (2015) International Journal of
roughly at minute 12) STD reached a maximum and then started to decrease meaning that surfacetexture tended to homogenize because of a size reduction of the largest aggregates in the mixture.TA was therefore in complete agreement with the initial visual observation that the maximum sizeof the agglomerates was reached before the stopping of the liquid feeding. At the end of the processthe STD profile tended to become flat meaning that an equilibrium between the different andcompeting agglomeration mechanisms was reached and size remained constant.
To assess the reliability of the method, the variability associated to the joint effects of thegranulation experiments and of the TA was evaluated with replicated tests performed in the sameconditions. Figure 9, shows the result of three replicated granulation tests carried out at 28 ml/minof binder flow rate. The average STD profile and the corresponding error bars (representing thestandard deviation of STD at each monitored time) are reported. It can be observed that thevariability of the STD was not constant during the process. It was minimum in the early stages ofthe process (±6%), then increased reaching a maximum before the STD peak (±12%) and thenreduced towards the end where the profile tended to become flat (±6%). So even if the general trendof the STD profiles is clear, it happens that while the early stages and the end point of thegranulation process can be characterized quite confidently by TA, attention should be paid lookingat the central stage of the granulation process where STD variability is larger.
3.4. Effect of binder flow rateIn order to study the applicability of the TA on granulation kinetic studies experiments at
different liquid binder flow rate (9, 22, 28, 47, 83 ml/min) were performed. The liquid binder was adispersion of XG in water (0.05 w/w%).
Since the amount of liquid binder was fixed to 330 g so the duration of each experiment wasdifferent with the wetting phases lasting respectively 36, 15, 12, 7 and 4 minutes. Results arereported as STD profiles in Figure 10 where it is evident their strong dependence on the binder flowrate. In particular the following observations can be done:
the overall shape of the profile did not change since they all showed a maximum of STD; the early stages of the process (nucleation and growth) were strongly influenced by the
binder flow rate; the maximum of the STD (i.e. the maximum size of the wet agglomerates) was always
reached before the stopping of the binder feeding (stopping time is not reported in theFigures for sake of clarity, it always occurred 5 minutes before the end of the granulationprocess because the massing time was a constant);
the final level of the STD profiles (i.e. the final sizes of the wet agglomerates) were roughlyconstant, independent of the flow rate and of the process length;
A more detailed analysis can be carried out by quantifying the slope m of the profiles through twolinear fittings performed before and after the maximum of STD (Figure 10: a and b respectively).Kinetic information are summarized in Figure 11 where the value of the kinetic constants (slopes ofthe linear fitting) are reported as function of the binder flow rate. It can be observed that while thegrowth rates increased with the binder flow rate, the size reduction rates were almost constant andindependent of binder flow rate, which is consistent with the fact that the operating conditions werenearly the same in this stage of the process. This again indicates that TA response is sensitive to and
S. Nalesso , C. Codemo, E. Franceschinis, N. Realdon, R. Artoni, A.C. Santomaso, Texture analysis asa tool to study the kinetics of wet agglomeration processes (2015) International Journal of
coherent with the physical changes of the system. Figure 12 instead shows the liquid to solid ratio,L/S, required to reach the maximum in the STD profiles (i.e the maximum size of theagglomerates), as a function of binder flow rate. The evidence that when flow rate increases, themaximum granule size is reached with larger amount of liquid binder, suggests that a competitionbetween liquid addition rate and liquid adsorption rate (by the MCC primary particles) exists. Thesecond evidence that the size of the wet agglomerates starts to reduce before the liquid binderaddition is stopped, suggests that also a competition between growth and breakage mechanismsexists. Since MCC particles are porous, the capillaries within the porous particles draw liquid intothe interior of the particle, leaving at the surface less liquidavailable to form bridge bonds withother particles. If a sufficient fluid flow rate is used to saturate the MCC particles, or at least allowthem to become surface wet, new MCC particles can be continuously incorporated into thegranules. If however liquid addition rate is low, liquid will be completely absorbed into the MCCinternal pores so that new liquid bridges can not form and the growth of the granules start to becontrasted by the breakage action of the impeller action already at low L/S ratios. Size reductioncontinues until an equilibrium granule size is reached where the strength of the aggregates equatesthe shear stresses generated by the impeller. This is a tentative explanation and the fullunderstanding of the phenomena just described is beyond the scope of this paper which is focusedon the development of an analytical tool.
In order to corroborate the idea that constant values of STD profiles at the end of thegranulation process correspond to the same size of the wet agglomerates, the PSDs of the final drygranules were measured by sieving and as can be observed in Figure 13 they resulted to overlap,with d50 = 680 ± 50 μm. The constant value of the final granule size however is not surprising if wethink that, all the formulation variables (type of powder and liquid binder) and the operatingconditions (impeller speed, powder amount, massing time), excepted for the binder flow rate, werethe same in all the experiments.
Even though the history of the granules was very different (different residence time in thebatch mixer, different duration of the growth and consolidation phases) the final PSDs were verysimilar. This observation in addition to the fact that all the experiments were carried out with thesame impeller speed suggests the idea that experiments were operated in the so called mechanicaldispersion regime (Hapgood et al., 2003). In the mechanical dispersion regime the final PSD isroughly independent of the liquid dispersion modality and wetting dynamics and depends mainly onthe intensity of the mechanical agitation, that in our case was the same in all the experiments.
3.5. Effect of binder amountIn order to further validate the TA methodology a set of experiments was also performed by
changing the total amount of liquid binder and keeping constant the binder addition time (12minutes). Therefore the binder flow rate was changed together with the total amount of binder. With330 g of binder, the flow rate was the same as in the previous experiments 28 ml/min while for 360g of binder the flow rate increased to 30 ml/min. It can be observed that despite the very small flowrate variation a significant difference of liquid binder amount was added to the powder in the twocases ( = 30 g of liquid binder on 300 g of MCC). The corresponding STD profiles are shown inFigure 14 where it can be observed that:
S. Nalesso , C. Codemo, E. Franceschinis, N. Realdon, R. Artoni, A.C. Santomaso, Texture analysis asa tool to study the kinetics of wet agglomeration processes (2015) International Journal of
the slope of the STD profiles is roughly constant (linear increase) up to minute 11independently of the flow rate;
large variability of STD profiles can be observed around minutes 12-13; clear differences of the STD profiles can be observed (after stopping liquid addition, i.e.
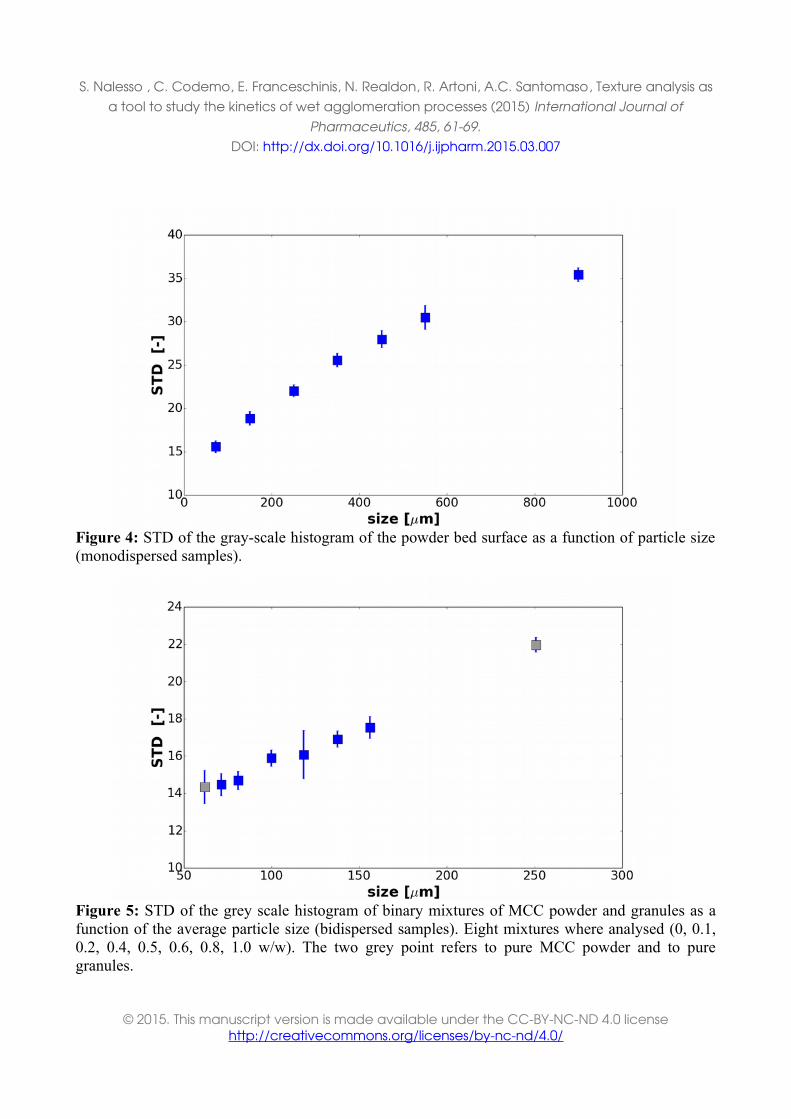
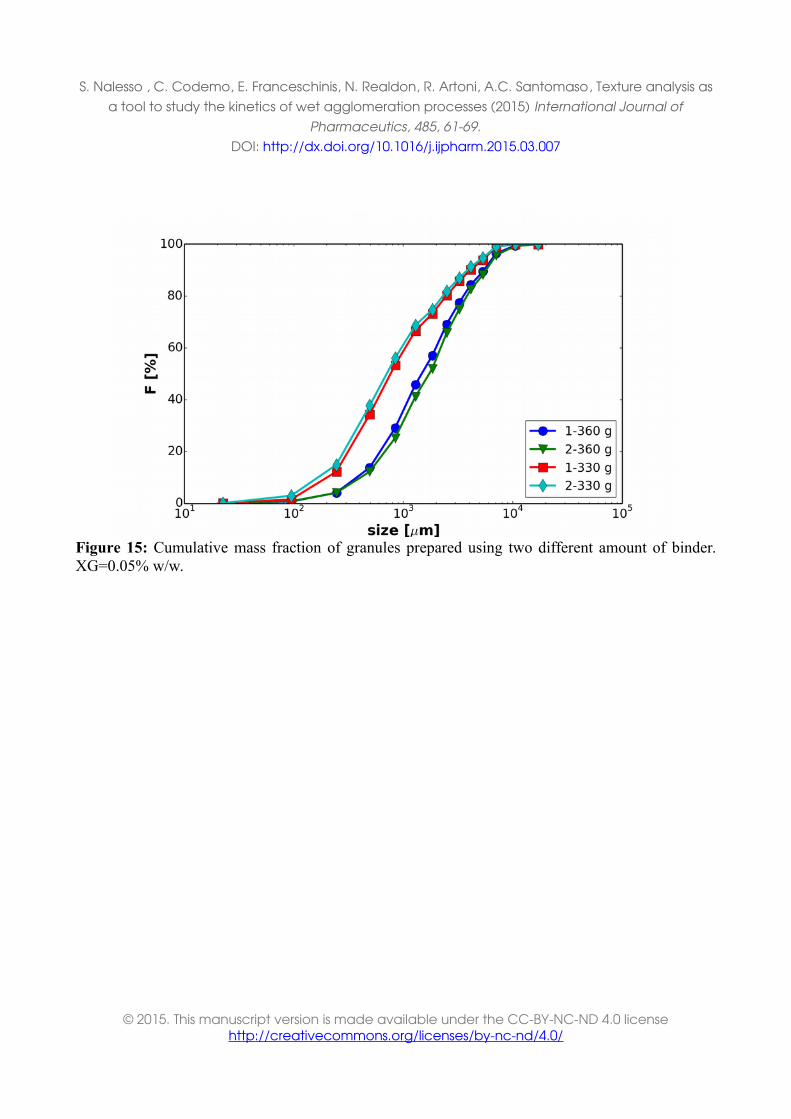
during massing time) as a function of the total liquid binder amount;It is clear from the Figure that a variation of binder flow rate as small as 2 ml/min in the early stagesof the process can not be detected by the TA so that an overlap of the profiles was observed. Theeffect of the total binder amount on the final values of STD (end point of granulation) however wasmuch larger so that significant size differences of the wet agglomerates were observed in the twocases. Again this observation was corroborated by the measurement of the final PSD (Figure 15).With 330 g of binder the granule d50 was 680 ± 50 μm, while for 360 g of binder the d50 wassignificantly higher 1615 ± 115 μm.
It has to be noted also that due to the different binder amount also the general trends of theSTD profiles were slightly different. For lower binder amount (330 g) a clear maximum was alwaysreached, followed by the decrease in size of the agglomerates (as already discussed). For the largerbinder amount (360 g) instead the existence of a maximum in the STD was less evident and(because of the larger variability of the method in this phase of the process as reported in Figure 9)it was difficult to draw conclusions on the maximum size reached by the wet agglomerates in thisstage of the process. It can be observed however that for larger binder amount the size reductionstage is nearly missing, which is physically coherent with the fact that an increased amount ofliquid, added in the same time interval, can generate a larger number of capillary bridges andincrease the strength of the agglomerates.
4. ConclusionsAn analytical tool based on texture analysis was developed in order to follow the wet
granulation process in a planetary mixer from the beginning up to the end point. Images of thepowder surface within the mixer were captured during the granulation process and analyzed withseveral texture indexes. The standard deviation of their gray-scale histogram was selected tomonitor the size evolution of the wet aggregates. The method was critically analyzed showing itsapplicability in granulation kinetic studies and in the investigation of the effects of formulationvariables (here reduced for sake of simplicity to the liquid binder amount only). Texture analysisproved to have the ability to give an insight into several aspects of the granulation processes whichof course need to be fully addressed in future contributions.
5. ReferencesBier, H. P., Leuenberger, H., Sucker, H., 1979. Determination of the uncritical quantity of
granulating liquid by power measurements on planetary mixers. Pharm. Ind. 41, 375–380.Boerefijn, R., Juvin, P. Y., Garzon, P., 2009. A narrow size distribution on a high shear mixer
by applying a flux number approach. Powder Technology 189 (2), 172–176.Briens, L., Daniher, D., Tallevi, A., 2007. Monitoring high-shear granulation using sound
S. Nalesso , C. Codemo, E. Franceschinis, N. Realdon, R. Artoni, A.C. Santomaso, Texture analysis asa tool to study the kinetics of wet agglomeration processes (2015) International Journal of
and vibration measurements. International Journal of Pharmaceutics 331, 54–60.Cavinato, M., Andreato, E., Bresciani, M., Pignatone, I., Bellazzi, G., Franceschinis, E.,
Realdon, N., Canu, P., Santomaso, A. C., 2011. Combining formulation and process aspects foroptimizing the high-shear wet granulation of common drugs. International Journal ofPharmaceutics 416, 229–241.
Cavinato, M., Artoni, R., Bresciani, M., Canu, P., Santomaso, A. C., 2013. Scale-up effectson flow patterns in the high shear mixing of cohesive powders. Chemical Engineering Science 102(0), 1–9.
Cavinato, M., Bresciani, M., Machin, M., Bellazzi, G., Canu, P., Santomaso, A. C., 2010.Formulation design for optimal high-shear wet granulation using on-line torque measurements.International Journal of Pharmaceutics 387, 48–55.
Chirkot, T., Propst, C., 1997. Low shear granulators in Handbook of PharmaceuticalGranulation Technology. Marcel Dekker, New York, 1997, 205-225.
Dal Grande, F., Santomaso, A. C., Canu, P., 2008. Improving local compositionmeasurements of binary mixtures by image analysis. Powder Technology 187(3), 205–213.
Ennis, B. J., 2006. Theory of granulation: an engineering perspective, in Parikh, D.M.(Ed.), Handbook of Pharmaceutical Granulation Technology, 2nd ed. Taylor and Francis Group,New York (U.S.A.), pp. 7-78.
Faure, A., York, P., Rowe, R., 2001. Process control and scale-up of pharmaceutical wetgranulation processes: a review. European Journal of Pharmaceutics and Biopharmaceutics 52,269–277.
Gonzales, R. C., Woods, R. E., Eddins, S. L., 2004. Digital Imaging Processing usingMatlab. Pearson Prentice-Hall.
Ryan Gosselin, R., Duchesne, C., Rodrigue, D., 2008, On the characterization of polymerpowders mixing dynamics by texture analysis, Powder Technology 183, 177-188.
Hapgood, K. P., Iveson, S. M., Litster, J. D., Liu, L. X., 2007, Granulation rate processes, inSalman, A.D., Hounslow,M.J., Seville, J.P.K. (Eds.) Granulation. Elsevier B.V., pp. 898–977.
Hapgood, K. P., Litster, J. D., Smith, R., 2003. Nucleation regime map for liquid boundgranules. AIChE J. 49, 350–361.
Harnby, N., 1997. Mixing in the process industries. Butterworth-Heinemann, Oxfor, UK.Hiseman, M. J. P., Laurent, B. F. C., Bridgwater, J., Wilson, D. I., Parker, D. J., North, N.,
Merrifield, D. R., 2002. Granular flow in a planetary mixer. Chemical Engineering Research andDesign 80 (5), 432–440.
Huang, J., Kaul, G., Utz, J., Hernandez, P., Wong, V., Bradley, D., Nagi, A., O’Grady, D.,2010. A pat approach to improve process understanding of high shear wet granulation through in-line particle measurement using fbrm c35. Journal of Pharmaceutical Sciences 99(7), 3205–3212.
Knight, P. C., Seville, J. P. K., Wellm, A. B., Instone, T., 2001. Prediction of impeller torquein high shear powder mixers. Chemical Engineering Science 56, 4457–4471.
Laitinen, N., Antikainen, O., Yliruusi, J., 2002. Does a powder surface contain all necessaryinformation for particle size distribution analysis? European Journal of Pharmaceutical Sciences17, 217–227.
S. Nalesso , C. Codemo, E. Franceschinis, N. Realdon, R. Artoni, A.C. Santomaso, Texture analysis asa tool to study the kinetics of wet agglomeration processes (2015) International Journal of
tendency of granules using surface imaging. Journal of Pharmaceutical Sciences 101 (6), 2229–2238.
Laurent, B. F. C., 2005. Structure of powder flow in a planetary mixer during wet-massgranulation. Chemical Engineering Science 60 (14), 3805–3816.
Leuenberger, H., Puchkov, M., Krausbauer, E., Betz, G., 2009. Manufacturingpharmaceutical granules: Is the granulation end-point a myth? Powder Technology 189, 141–148.
Litster, J. D., Ennis, B., 2004. The science and engineering of granulation processes. KluwerPowder Technology Series.
Middlemann, S., 1995. Modeling axisymmetric flows: dynamics of films, jets, and drops.Academic Press, Inc.
Paul, E. L., Atiemo-Obeng, V. A., Kresta, S. M. (Eds.), 2003. Handbook of IndustrialMixing: Science and Practice. Wiley-Interscience, John Wiley & Sons, Inc., Hoboken, New Jersey.
Russ, J., 1999. The Image Processing Handbook, 3rd Edition. Boca Raton, FL:CRC Press.Tok, A. T., Goh, X., Ng, W. K., H., T. R. B., 2008. Monitoring granulation rate processes
using three pat tools in a pilot-scale fluidized bed. AAPS PharmSciTech 9 (4), 1083–1091.Watano, S., 2001. Direct control of wet granulation processes by image processing system.
S. Nalesso , C. Codemo, E. Franceschinis, N. Realdon, R. Artoni, A.C. Santomaso, Texture analysis asa tool to study the kinetics of wet agglomeration processes (2015) International Journal of
S. Nalesso , C. Codemo, E. Franceschinis, N. Realdon, R. Artoni, A.C. Santomaso, Texture analysis asa tool to study the kinetics of wet agglomeration processes (2015) International Journal of
Figure 2: Experimental set-up for taking images from static samples. A) Digital camera. B)Photographic box containing the sample of powder protected from external light. C) Computer forimage storage. D) Sample holder. E) The photographic box is represented magnified and sectionedto show the position of the sample holder and of the ring of LEDs.
Figure 3: Experimental set-up for dynamic analysis of the granulation process. A) Electronicbalance. B) Liquid binder dispersion. C) Peristaltic pump. D) Metallic circular structure holdingthree rings of LEDs for even illumination of the powder bed surface. E) Planetary mixer. F) Digitalcamera, connected to a frame grabber and a personal computer (not shown).
S. Nalesso , C. Codemo, E. Franceschinis, N. Realdon, R. Artoni, A.C. Santomaso, Texture analysis asa tool to study the kinetics of wet agglomeration processes (2015) International Journal of
Figure 4: STD of the gray-scale histogram of the powder bed surface as a function of particle size(monodispersed samples).
Figure 5: STD of the grey scale histogram of binary mixtures of MCC powder and granules as afunction of the average particle size (bidispersed samples). Eight mixtures where analysed (0, 0.1,0.2, 0.4, 0.5, 0.6, 0.8, 1.0 w/w). The two grey point refers to pure MCC powder and to puregranules.
S. Nalesso , C. Codemo, E. Franceschinis, N. Realdon, R. Artoni, A.C. Santomaso, Texture analysis asa tool to study the kinetics of wet agglomeration processes (2015) International Journal of
S. Nalesso , C. Codemo, E. Franceschinis, N. Realdon, R. Artoni, A.C. Santomaso, Texture analysis asa tool to study the kinetics of wet agglomeration processes (2015) International Journal of
Figure 7: Evolution of the bed surface texture as a function of binder addition. The experiment wascarried out at the following conditions: binder composition: 0.05% XG; binder addition rate: 28
S. Nalesso , C. Codemo, E. Franceschinis, N. Realdon, R. Artoni, A.C. Santomaso, Texture analysis asa tool to study the kinetics of wet agglomeration processes (2015) International Journal of
S. Nalesso , C. Codemo, E. Franceschinis, N. Realdon, R. Artoni, A.C. Santomaso, Texture analysis asa tool to study the kinetics of wet agglomeration processes (2015) International Journal of
Figure 10: STD profile obtained for XG based binder (0.05 w/w%) at different flow rates and theirlinear interpolation in the size enlargement a) and size reduction b) stages.
S. Nalesso , C. Codemo, E. Franceschinis, N. Realdon, R. Artoni, A.C. Santomaso, Texture analysis asa tool to study the kinetics of wet agglomeration processes (2015) International Journal of
Figure 11: Kinetic constants m of the size growth and reduction as a function of the flow rate Q.Values are obtained from the slopes measured in Figure 10.
Figure 12: Liquid to solid ratio at the maximum of STD, as a function of the binder flow rate.
S. Nalesso , C. Codemo, E. Franceschinis, N. Realdon, R. Artoni, A.C. Santomaso, Texture analysis asa tool to study the kinetics of wet agglomeration processes (2015) International Journal of
Figure 13: Cumulative mass fraction of granules obtained with dispersion of XG =0.05% w/w atdifferent flow rates.
Figure 14: STD profiles for two different total amount of liquid binder (360 g and 330 g of binderrespectively). Experiments have been replicated twice.
S. Nalesso , C. Codemo, E. Franceschinis, N. Realdon, R. Artoni, A.C. Santomaso, Texture analysis asa tool to study the kinetics of wet agglomeration processes (2015) International Journal of