80
Thai Oil Public Company Limited Presentation to Investors May 2016

Thai Oil Public Company Limited
Presentation to Investors
May 2016

-2-
Disclaimer
The information contained in this presentation is intended solely for your
personal reference. Please do not circulate this material. If you are not an
intended recipient, you must not read, disclose, copy, retain, distribute or take
any action in reliance upon it.
Some statements made in this material are forward-looking with relevant
assumptions, which are subject to uncertainties, which may cause the actual
result/performance to be materially deviated from any future
result/performance implied by such forward-looking statements. Please note
that the company and management/staff are not capable to control and
guarantee if these forward-looking statements will be accurately materialized,
they are subject to various risks and uncertainties.

-3-
VISION A LEADING FULLY INTEGRATED REFINING & PETROCHEMICAL
COMPANY IN ASIA PACIFIC
MISSION
• To be in top quartile on performance and return on investment
• To create a high-performance organization that promotes
teamwork, innovation and trust for sustainability
• To emphasis good Corporate Governance and commit to Corporate
Social Responsibility
VALUES
Corporate Vision, Mission and Values
Professionalism
Ownership & Commitment
Social Responsibility Integrity Teamwork & Collaboration Initiative
Vision Focus
Excellent Striving

-4-
Corporate Governance Policy
Corporate Governance Policy
The board of directors, management
and all staff shall commit to moral
principles, equitable treatment to all
stakeholders and perform their duties for
the company’s interest with dedication,
integrity, and transparency.
Roles and Responsibilities for
Stakeholders
• Truthfully report company’s situation and
future trends to all stakeholders equally
on a timely manner.
• Shall not exploit the confidential
information for the benefit of related
parties or personal gains.
• Shall not disclose any confidential
information to external parties.
CG Channels
Should you discover any
ethical wrongdoing that is
not compliance to CG
policies or any activity that
could harm the Company’s
interest, please inform:
Corporate Management Office Thai Oil Public Company Limited 555/1 Energy Complex Building A
11F, Vibhavadi Rangsit Road,
Chatuchak, Bangkok 10900
[email protected] http://www.thaioilgroup.com
+66-0-2797-2999 ext. 7312-5
+66-0-2797-2973
-5-
Thaioil Group Sustainable Development
3 consecutive years for • Member of DJSI Emerging Markets • Highest Ranked Level in RobecoSAM Gold Class of Global Oil & Gas Companies
& 2 consecutive years for • No.1 in ENERGY industry around the WORLD (Industry Group Leader) • No.1 in Oil & Gas Producers Worldwide (Industry Leader)

-6-
Presentation Agenda
TOP GROUP BUSINESS OVERVIEW
KEY FINANCIAL HIGHLIGHTS
STRATEGIC INVESTMENT PLANS
MARKET OUTLOOK
APPENDIX

-7-
TOP Group Business Overview

-8-
Strategic Relationship and Operational Integration with PTT
Thai Oil’s strong shareholder base
49.1%
22.5%
17.3%
11.2%
PTT
Foreign Investors
Local Investors
NVDR
• Benefits from PTT’s dual role as our major shareholder and key business partner
• All transactions take place at arm’s length and in adherence with strong corporate governance principles
Key strategic benefits for Thai Oil
1. Long-term strategic partnership
• Thai Oil is PTT’s principal refiner
• Long-term strategic shareholder and joint investment
2. Business partnership
• Product offtake • Crude procurement
3. Operational synergies
• Freight costs reduction • Knowledge transfer and shared
services • Close management collaboration
and secondment of trained staff
49.1%
As of 29 Feb 2016
-9-
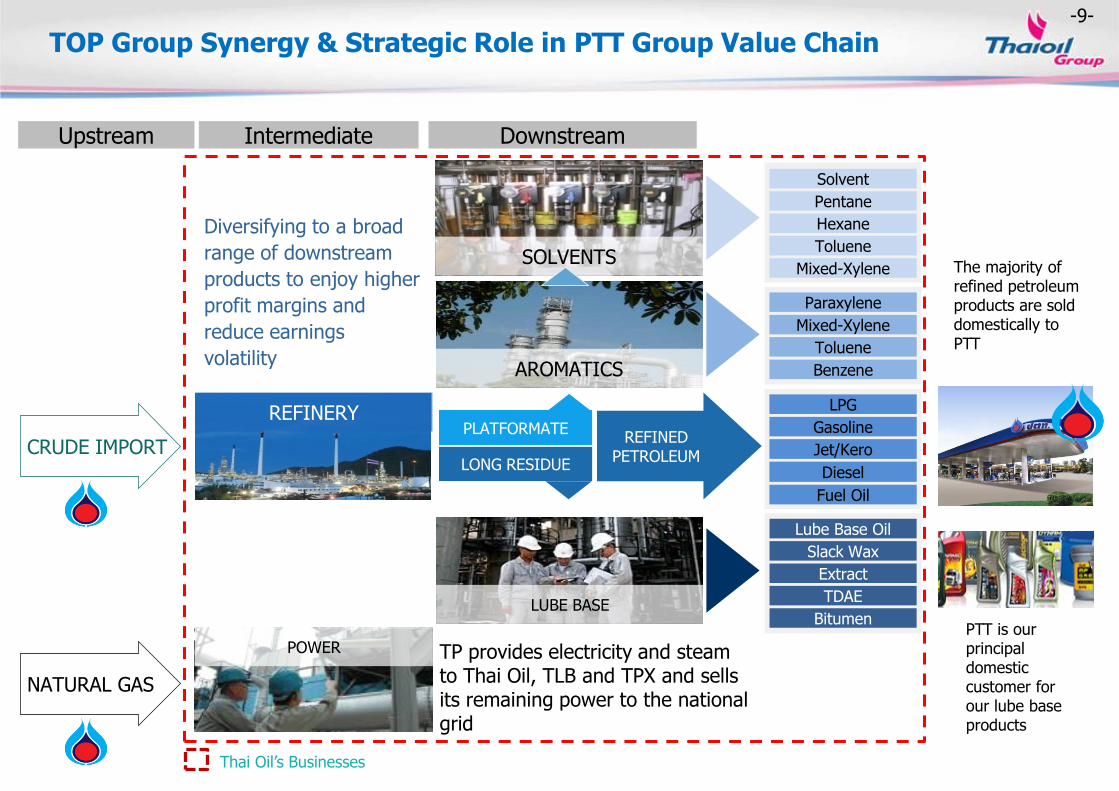
TOP Group Synergy & Strategic Role in PTT Group Value Chain
NATURAL GAS
CRUDE IMPORT
Mixed-Xylene
Solvent
Toluene
Pentane
Hexane
SOLVENTS
TP provides electricity and steam to Thai Oil, TLB and TPX and sells its remaining power to the national grid
Paraxylene
Benzene
Mixed-Xylene
Toluene
AROMATICS
Lube Base Oil
Bitumen
TDAE
Slack Wax
Extract
LUBE BASE
REFINERY LPG
Fuel Oil
Diesel
Gasoline
Jet/Kero
PLATFORMATE
LONG RESIDUE
REFINED PETROLEUM
POWER
Diversifying to a broad
range of downstream
products to enjoy higher
profit margins and
reduce earnings
volatility
Thai Oil’s Businesses
The majority of refined petroleum products are sold domestically to PTT
PTT is our principal domestic customer for our lube base products
Upstream Intermediate Downstream

-10-
Key Milestones: 55 Years, A Long Track Record of Success
2007 • Increased refining capacity to 275 kbd 2008 • The first refinery in Thailand with diesel
production to comply with the sulfur content requirements of Euro IV
• Capacity expansion of Thai Paraxylene with total aromatics capacity of 900,000 tons p.a.
• Invested in Solvents business in Thailand and Vietnam
1993 • We expanded our refining capacity to 190 kbd
1994 – 1997 • Increased total refining capacity to 220 kbd • Initial investment in Thai Paraxylene (“TPX”) and
Thai Lube Base (“TLB”) • IPT became the first IPP to enter into a PPA with
EGAT2 with 700 MW capacity ; separately, Thaioil Power (“TP”) constructed the power generation plant under the SPP with 118 MW capacity
1961 – 1997 Capacity expansion and initial stage of
business diversification
2004 – 2011 Listing, expansion and
diversification
Today A leading integrated refining and
petrochemical group in Asia Pacific
• 275 kbd refinery ( approximately 25% of Thailand’s total refining capacity)
• Nelson index 9.81 • Diversified business through 13
subsidiaries • The 3rd largest listed company by revenue in Thailand
1961 – 1964
2004
1961 • Incorporated
1964 • Commenced
operation with distillation capacity of 35 kbd
• Simple refinery with Nelson complexity Index ~ 41
1970 • Refining capacity
expanded to 65 kbpd
1989 • Increased refining
capacity to 90 kbpd
2004 • IPO and listed on the SET • Acquired remaining shares in
Thai Paraxylene and Thai Lube Base which became our wholly-owned subsidiaries
2007 -2008
2010
2011
1993-1997 1970-1989
2013-2014 • Established LABIX • Invested in power biz via
GPSC & TOP SPP • Completed Emission
Improvement, HVU-2 Debottlenecking & CDU-3 Preheat Train project
2015 • Ongoing Projects: LABIX &
TOP SPP • Revenue 293,060 MB • Net profit 12,181 MB
2011 • Manufactured diesel and
ULG in compliance with the sulfur and BZ aromatics content requirements of the Euro IV
• Acquired 1st VLCC
2010 • Established
Thaioil Ethanol • Production
expansion of TDAE by 50,000 tons per annum
Note 1. Based on our internal estimates using the methodology of the Nelson Complexity Index 2. The Electricity Generating Authority of Thailand (“EGAT”) is the national grid
-11-
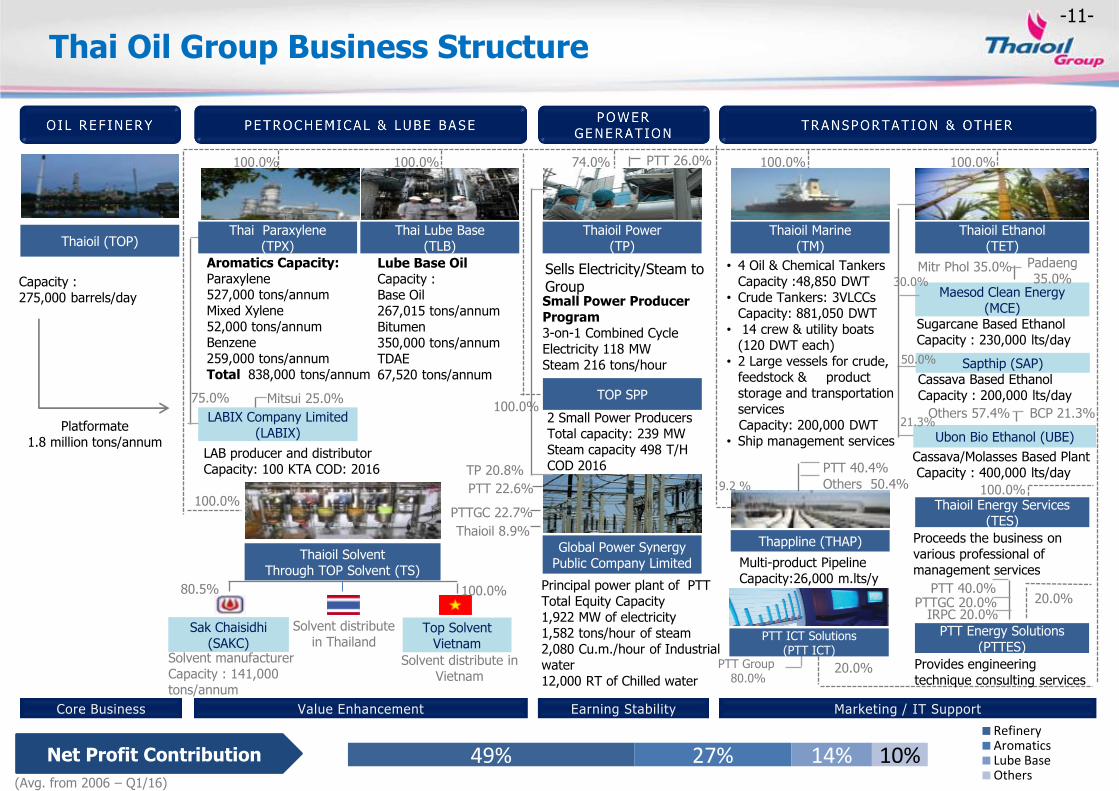
Thai Oil Group Business Structure
• 4 Oil & Chemical Tankers Capacity :48,850 DWT
• Crude Tankers: 3VLCCs Capacity: 881,050 DWT
• 14 crew & utility boats (120 DWT each)
• 2 Large vessels for crude, feedstock & product storage and transportation services
Capacity: 200,000 DWT • Ship management services
9.2 %
Principal power plant of PTT Total Equity Capacity 1,922 MW of electricity 1,582 tons/hour of steam 2,080 Cu.m./hour of Industrial water 12,000 RT of Chilled water
Platformate 1.8 million tons/annum
PTT Group 80.0%
100.0% 100.0% 74.0% 100.0%
Thaioil (TOP) Thai Lube Base
(TLB) Thaioil Power
(TP)
Global Power Synergy Public Company Limited
Thaioil Energy Services (TES)
Thaioil Marine (TM)
Maesod Clean Energy (MCE)
Capacity : 275,000 barrels/day Small Power Producer
Program 3-on-1 Combined Cycle Electricity 118 MW Steam 216 tons/hour
PTT 26.0%
Proceeds the business on various professional of management services
Sugarcane Based Ethanol Capacity : 230,000 lts/day
PTT 22.6%
Thaioil 8.9%
TP 20.8%
Padaeng 35.0%
Mitr Phol 35.0%
100.0%
Thappline (THAP)
Multi-product Pipeline Capacity:26,000 m.lts/y
20.0%
PTT 40.4%
Others 50.4%
Lube Base Oil Capacity : Base Oil 267,015 tons/annum Bitumen 350,000 tons/annum TDAE 67,520 tons/annum
Thaioil Solvent
Through TOP Solvent (TS)
100.0%
100.0%
Thaioil Ethanol (TET)
Solvent manufacturer Capacity : 141,000 tons/annum
Thai Paraxylene (TPX)
100.0% 80.5%
Solvent distribute in Thailand
Sak Chaisidhi (SAKC)
Top Solvent Vietnam
Solvent distribute in Vietnam
PTT ICT Solutions (PTT ICT)
Sapthip (SAP) Cassava Based Ethanol Capacity : 200,000 lts/day
50.0%
Ubon Bio Ethanol (UBE) 21.3%
Cassava/Molasses Based Plant Capacity : 400,000 lts/day
PTT Energy Solutions (PTTES)
Provides engineering technique consulting services
20.0% PTT 40.0%
PTTGC 20.0% IRPC 20.0%
BCP 21.3% Others 57.4%
PTTGC 22.7%
30.0%
Aromatics Capacity: Paraxylene 527,000 tons/annum Mixed Xylene 52,000 tons/annum Benzene 259,000 tons/annum Total 838,000 tons/annum
LABIX Company Limited (LABIX)
LAB producer and distributor Capacity: 100 KTA COD: 2016
Mitsui 25.0% 75.0% TOP SPP
2 Small Power Producers Total capacity: 239 MW Steam capacity 498 T/H COD 2016
100.0%
Sells Electricity/Steam to Group
49% 27% 14% 10% Refinery Aromatics Lube Base Others
Net Profit Contribution
(Avg. from 2006 – Q1/16)
-12-
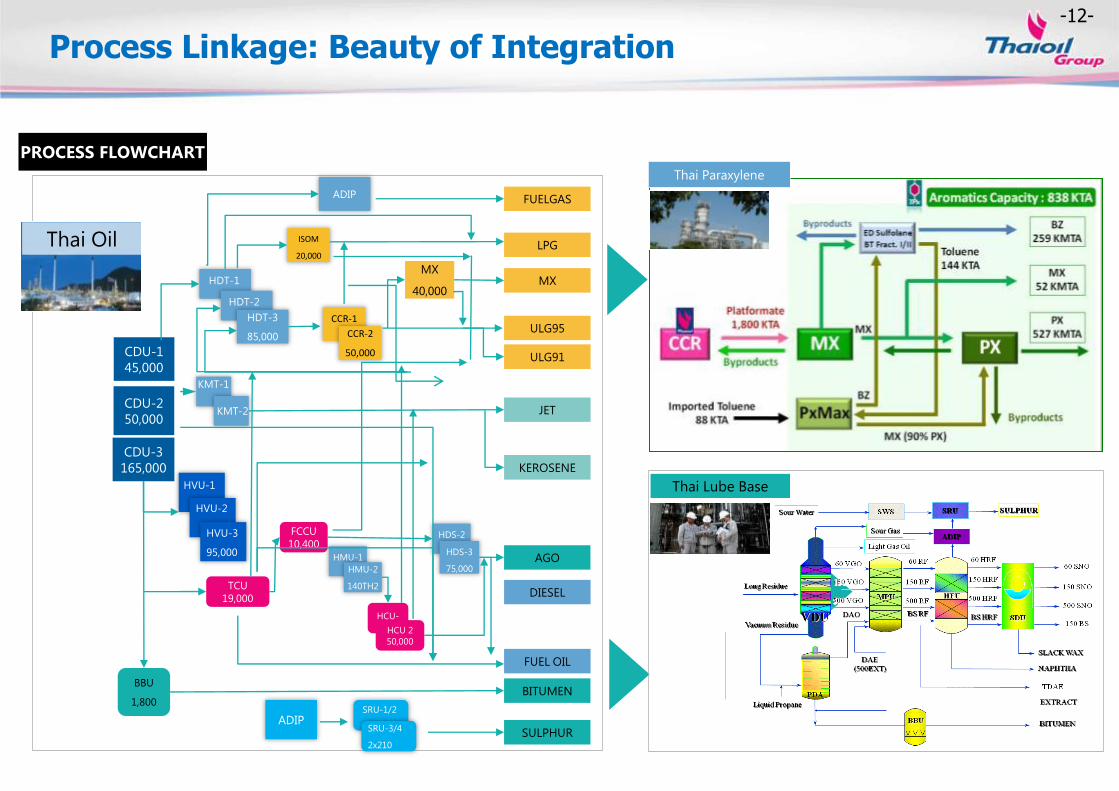
Process Linkage: Beauty of Integration
Thai Paraxylene
Thai Lube Base
PROCESS FLOWCHART
JET
ULG91
LPG
ULG95
KEROSENE
CDU-1
45,000
CDU-2
50,000
CDU-3
165,000
MX
AGO
DIESEL
FUEL OIL
BITUMEN
SULPHUR
HVU-1
HVU-2
HVU-3
95,000
FUELGAS
BBU
1,800
ADIP
TCU
19,000
FCCU
10,400
HCU-
1 HCU 2
50,000
SRU-1/2
SRU-3/4
2x210
KMT-1
KMT-2
HMU-1
HDT-1
HDT-2
HDT-3
85,000
HMU-2
140TH2
HDS-2
HDS-3
75,000
MX
40,000
CCR-1
CCR-2
50,000
ISOM
20,000
ADIP
Thai Oil

-13-
Total Thailand crude refining capacity 1,252 kbd Market shares for refined petroleum product3
Thai Oil (275 kbpd)
PTT’s Principal Refiner
Esso (177 kbpd)
IRPC2 (215 kbpd)
SPRC2 (165 kbpd)
BCP (120 kbpd)
Fang (3 kbpd)
Remarks:
• Nelson Complexity Index measures refinery’s upgrading capability for comparison
• It is the ratio of complexity barrels divided by crude distillation capacity
14.0 13.8
10.2 9.8 9.7 8.8
6.6
RPL JX PTTGC TOP SK Corp Sinopec Esso
Nelson Index - Regional Comparison4
PTTGC2 (280kbpd)
Thai Oil 22% Share Nameplate Capacity
RPCG (17 kbpd)
One of Region’s Leading Refineries
Note: 1. Source: Energy Policy and Planning Office (EPPO), Ministry of Energy Thailand
2. PTT holds a 38.51% interest in IRPC, a 48.9% interest in PTTGC, and a 5.41% interest in SPRC as at 3 Dec 15
3. Calculate by total domestic sales of refined petroleum products of Thai Oil divided by total sales of petroleum products in Thailand excl LPG as a feedstock and own used. Source from EPPO 4. Source: Worldwide Refinery Survey and Complexity Analysis 2015 from Oil & Gas Journal and company information
33% market shares
Q1/16
30% market shares
Q4/15

-14-
Our strategic location provide us with
1. Close proximity with the key domestic markets and Indochina
2. Direct access to deep water ports
3. Direct connection with multi-product pipelines
Strategic Location with Competitive Advantages in Access to Key Markets
Our plants are located within the Sriracha Complex
SBM provides direct access to deep water ports, and ability to receive feedstock directly from VLCC
We also enjoy available connections to delivery networks such as multi-product pipelines, including Thappline
Ø24”, 134 km
Saraburi
Lamlukka Don Mueng
Suvarnabhumi
ESSO
PTTGC SPRC IRPC
Map Ta Phut
Sriracha
BCP
Product pipeline system
Direct connection with product pipeline system
Access to Indochina markets through deep water ports
Close proximity to the key domestic markets
Bangkok
Map Ta Phut
Gulf of Thailand
Sriracha (124 km from BKK)
THAILAND
LAOS
VIETNAM
CAMBODIA

-15-
Optimized & Flexible Operations…Superior Performance
27% 17%
7% 17%
28% 29%
28% 28%
45% 54%
65% 55%
Oman Dubai Murban Arab Light
Short Residue Waxy Gas/Distillates
Sources of Crude
• Flexibility in crude intake allows diversification of crude types to source cheaper crude
• Flexibility in product outputs by maximizing middle distillates (jet and diesel) by adjusting production mode to capture domestic demand and price premium
• Maximize Platformate production to capture higher margin on aromatics
• Minimize fuel oil output to avoid lower margin products
Product output
Domestic demand for
petroleum products**
**Source: Energy Policy and Planning Office, Ministry of Energy Thailand
% S = 0.78 API = 39.4
% S = 1.43 API = 32.0
% S = 2.52 API = 31.2
Crude Assays based on TOP configuration*
Thai Oil is able to diversify its type of crude intake and product outputs to maximize demand and margin
*** Including Nigeria, Russia and others
% S = 1.97 API = 32.8
*Crude yield as per assay in Spiral as of Feb 2016
83%
9%
7% 1%
5% 6%
33%
22%
16%
12%
5%
5%
43%
12%
19%
21% Far East
Local
Middle East
Q1/16
1 SAUDI ARAMCO
MOPS Jet Kerosene FOB
SG
MOPS Gasoil 0.05% Sulfur
FOB SG
MOPS ULG 95 FOB SG
Others
1.LPG price = LPG CP - 20$/ton) since 2 Feb 15 onwards.
LPG
PLATFORMATE
GASOLINE
JET
DIESEL
FUEL OIL
Q1/16
***
LONG RESIDUE
MOPS Fuel Oil 180 CST 3.5% Sulfur FOB SG
Reference Price

-16-
87% 80% 81%
13% 20% 19%
Q1/16 Q4/15 Q1/15
Export
Domestic
Refinery Intake (KBD)
295
TOP’s Domestic & Export Sales Sales breakdown by customers
302 292
38%
12% 7%
1%
28%
8% 5%
Domestic Jobbers
Q1/16
Sales
Breakdown
Export 13%
38%
13% 6%
1%
22%
17% 3%
Domestic Jobbers
Q4/15
Sales
Breakdown
Export 20%
Strong Domestic Sales despite Flatten Local Demand
Domestic Oil Demand / Domestic Refinery Intake Domestic Oil Demand
684 658 621 660 709 704 661 717 757 659 698
85% 83% 83% 90% 94% 95% 94% 95%
91% 85%
94%
0%
20%
40%
60%
80%
100%
-
200
400
600
800
1,000
1,200
Domestic Demand/Sales Net Export Others Utilization Rate
KBD
Utilization = 107%
including LPG from refinery only And not including B100 and ethanol
*including TOP intake (Excluding TOP = 70%)
0
200
400
600
800
1,000
LPG Mogas Jet/Kero Diesel Fuel Oil Total Demand
Q1/2015 Q1/2016
4.9%
11.0% -10.3%
3.2% KBD
5.0% 28.8%
*LPG data in Mar-16 from TOP estimation

-17-
Competitive Performance Benchmarking
Solomon for GOC 3* Category Overall Solomon
2014 : TOP
2012 : TOP
Solomon Associates is the independent 3rd party who applies Comparative Performance Analysis methodology
to industry peers in the area of reliability, equipment, utilization, operating expense, gross margin and overall
performance range and come up with comparative ranking
Remark : *GOC 3 stands for Gas Oil Conversion Group 3, under which refineries in this group have equivalence distillation capacity 1,800 – 2,999 KEDC ** In 2014, Thai Oil had Major turnaround for CDU-3 46 days and 2014FY refinery utilization was at 98%
** **

-18-
Thailand’s largest and
one of the region’s
most advanced and
competitive refineries 1 Strategic relationship
and operational
integration with PTT as
the Group’s principal
refiner
3
Technological
superiority, logistical
advantages & cost
leadership
6
Industry with high
barriers to entry and
strong market
positioning
5 Strategic location with
competitive advantages
in access to key markets
4
Diversified earnings
through integration
with, and significant
contribution from, our
subsidiaries
2
Highly experienced
management team
7 Strong financial profile
8
TOP Group Key Highlights

-19-
Key Financial Highlights
-20-
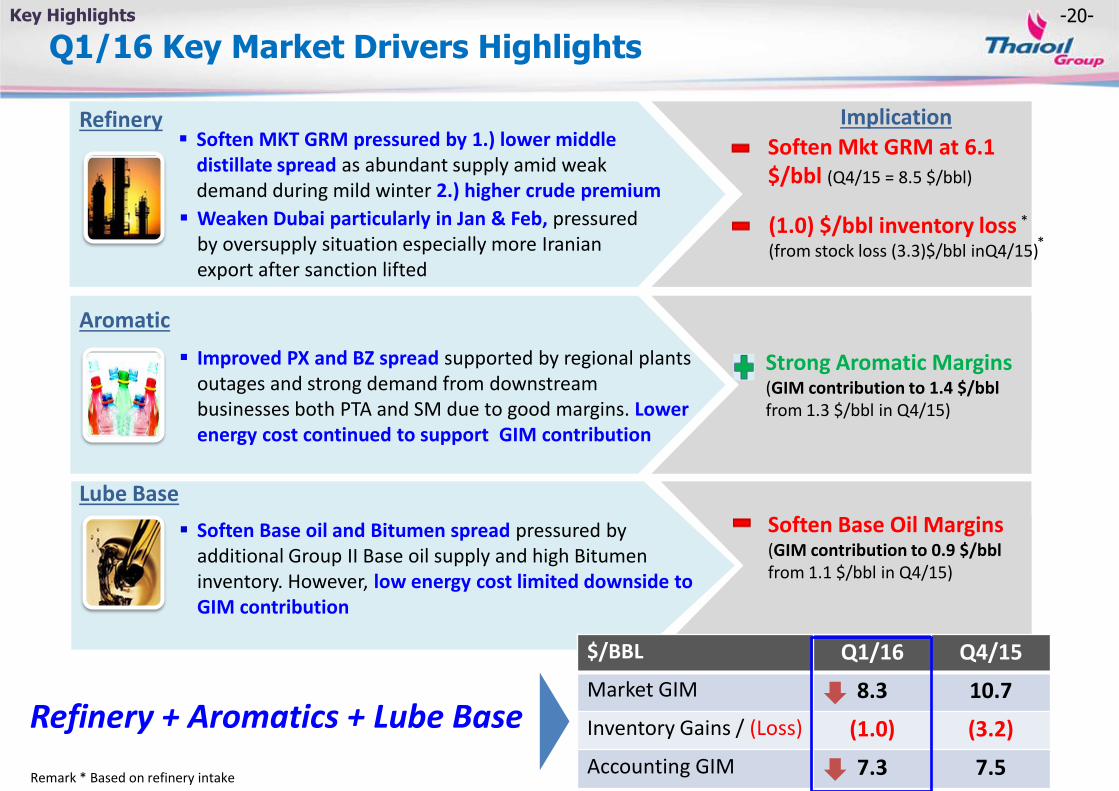
Q1/16 Key Market Drivers Highlights
Strong Aromatic Margins (GIM contribution to 1.4 $/bbl from 1.3 $/bbl in Q4/15)
Implication
(1.0) $/bbl inventory loss (from stock loss (3.3)$/bbl inQ4/15)
Soften Mkt GRM at 6.1 $/bbl (Q4/15 = 8.5 $/bbl)
Refinery
Aromatic
Lube Base Soften Base Oil Margins (GIM contribution to 0.9 $/bbl from 1.1 $/bbl in Q4/15)
Refinery + Aromatics + Lube Base
$/BBL Q1/16 Q4/15
Market GIM 8.3 10.7
Inventory Gains / (Loss) (1.0) (3.2)
Accounting GIM 7.3 7.5
Weaken Dubai particularly in Jan & Feb, pressured by oversupply situation especially more Iranian export after sanction lifted
Soften MKT GRM pressured by 1.) lower middle distillate spread as abundant supply amid weak demand during mild winter 2.) higher crude premium
Soften Base oil and Bitumen spread pressured by
additional Group II Base oil supply and high Bitumen inventory. However, low energy cost limited downside to GIM contribution
Improved PX and BZ spread supported by regional plants outages and strong demand from downstream businesses both PTA and SM due to good margins. Lower energy cost continued to support GIM contribution
Key Highlights
*
*
Remark * Based on refinery intake
-21-
4,686
7,219
3,938
(947)
(3,253)
(1,273)
636
(913)
2,272 351
696
(439)
Net Operating Profit (before tax) Stock G/(L) (before tax)
Reversal of NRV/(NRV) (before tax) Others
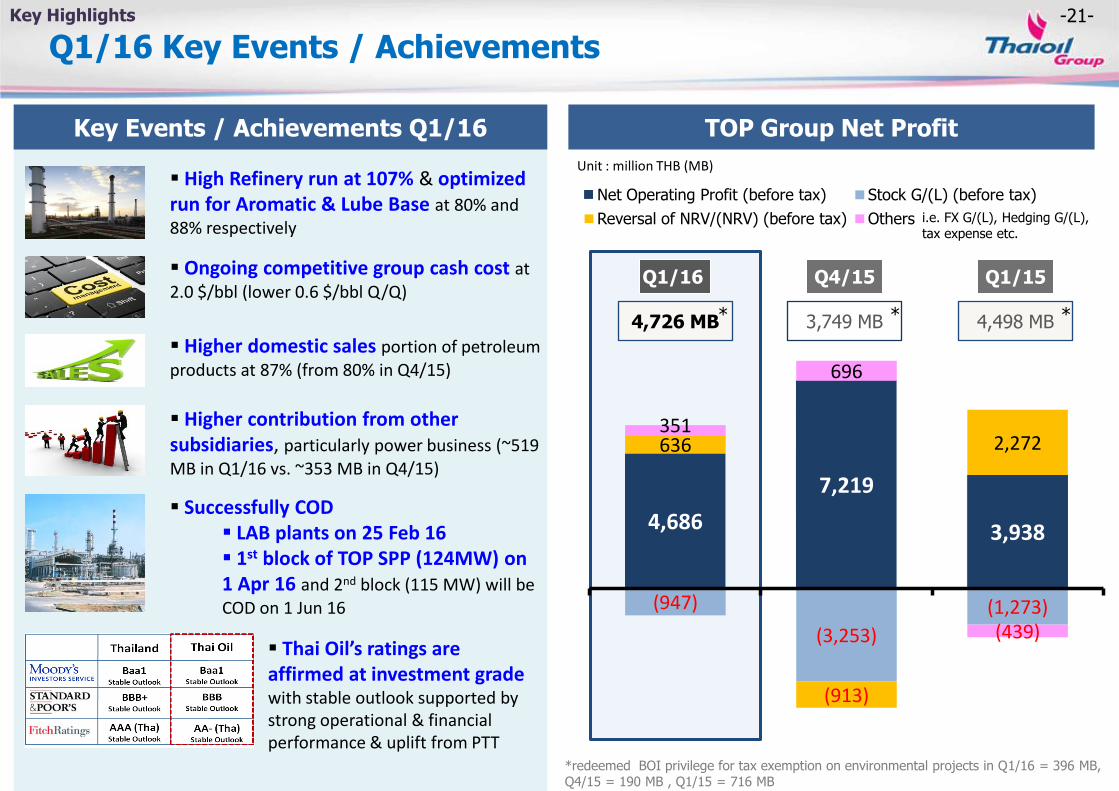
Q1/16 Key Events / Achievements
Key Events / Achievements Q1/16
Key Highlights
TOP Group Net Profit
*redeemed BOI privilege for tax exemption on environmental projects in Q1/16 = 396 MB, Q4/15 = 190 MB , Q1/15 = 716 MB
High Refinery run at 107% & optimized run for Aromatic & Lube Base at 80% and 88% respectively
Ongoing competitive group cash cost at 2.0 $/bbl (lower 0.6 $/bbl Q/Q)
Higher contribution from other subsidiaries, particularly power business (~519 MB in Q1/16 vs. ~353 MB in Q4/15)
Unit : million THB (MB)
Q4/15
3,749 MB
Q1/16
4,726 MB * * 4,498 MB
Q1/15
*
i.e. FX G/(L), Hedging G/(L), tax expense etc.
Successfully COD LAB plants on 25 Feb 16 1st block of TOP SPP (124MW) on 1 Apr 16 and 2nd block (115 MW) will be COD on 1 Jun 16
Higher domestic sales portion of petroleum products at 87% (from 80% in Q4/15)
Thai Oil’s ratings are affirmed at investment grade with stable outlook supported by strong operational & financial performance & uplift from PTT

6.1
2.6 1.1
2.9 3.1 3.9 4.4
5.9 5.1 4.3 4.1 4.9 5.4
1.1
7.6 5.8 6.0
5.0
1.1
1.1 2.6
2.6 1.5 1.5
2.1
2.1 1.7
1.7 1.8 1.8
0.1
0.1
0.6
0.6 1.4
1.4
0.7
0.7 0.7
0.7 1.0
1.0
1.3
1.3
0.9 0.9 0.9
0.9
0.7
0.7
0.9
0.9
0.9
0.9
7.9
4.3 5.6
7.8 7.6
6.8 6.2
9.1 8.3
4.3
6.1 6.3
9.3
6.9 7.6
1.9
7.2 7.3
2008 2009 2010 2011 2012 2013 2014 2015 Q1/16
TOP TPX TLB
6.4
1.1
3.3
4.6 5.3
4.3
5.7
7.8 6.1
2.2
3.4 4.1
6.2
4.5 5.1
1.2
5.9 5.1
2008 2009 2010 2011 2012 2013 2014 2015 Q1/16
0.9 0.9 1.0 1.1 1.2 1.4 1.5 1.3 1.2 0.4 0.5 0.5 0.4 0.4 0.7 0.8 0.6 0.6 1.4 1.4 1.5 1.5 1.6 2.1 2.3
1.9 1.8
2008 2009 2010 2011 2012 2013 2014 2015 Q1/16
Operating Cost Interest Expense (Net)
Integrated Margin & Competitive Cash Cost
(Unit: US$/bbl)
Market GIM Accounting GIM (Market GIM + Stock G/L)
Market GRM Accounting GRM (Market GRM + Stock G/L)
Gross Refining Margin
Gross Integrated Margin
(Unit: US$/bbl)
1.1 1.1 1.2 1.4 1.4 1.7 1.8 1.7 1.5 1.5 0.5 0.5 0.5 0.4 0.4 0.6 0.7 0.7 0.6 0.5 1.6 1.7 1.8 1.8 1.8
2.3 2.5 2.4
2.1 2.0
2008 2009 2010 2011 2012 2013 2014 2014 2015 Q1/16
Operating Cost Interest Expense (Net)
Refinery’s Cash Cost
(Unit: US$/bbl)
Group’s Cash Cost
(Unit: US$/bbl)
*Including MTA cost in MTA period since mid Jun-late July 2014 for 46 days (TOP MTA cost in 2014 = 436 MB/ 0.14 $/bbl)
*
*Including MTA cost in MTA period since mid Jun-late July 2014 for 46 days ( TOP group MTA cost in 2014 = 609 MB/ 0.20 $/bbl)
*
(excl. one-time non-operating item)
(excl. one-time non-operating item)

-23-
22,897
12,846 14,585
23,868 22,808
19,713 19,541
31,099
6,964 7,949
21,393 17,381
28,760
20,350 22,337
2,651
25,492
6,653
2008 2009 2010 2011 2012 2013R 2014R 2015 Q1/16
EBITDA (excl stk G/L & NRV) EBITDA (incl stk G/L & NRV)
2,157
14,035 10,349
13,753 16,946
3,801 5,767
20,878
7,818
2008 2009 2010 2011 2012 2013 2014 2015 Q1/16
399,125
284,123 318,391
446,241 447,432
414,575 390,090
293,569
56,790
2008 2009 2010 2011 2012 2013R 2014R 2015 Q1/16
Financial Performance
11,435
5,652 6,999
9,961 14,777
6,692
12,750
17,789
5,037
224
12,062
8,956
14,853
12,320 9,316
(4,140)
12,181
4,726
2008 2009 2010 2011 2012 2013R 2014R 2015 Q1/16
NP (excl stk G/L & NRV before tax) NP (incl stk G/L & NRV)
Unit: Million THB
Sales Revenue EBITDA
Unit: Million THB
Net Profit
Unit: Million THB
Free Cash Flow*
R Restated financial statement
Unit: Million THB
* Free Cash Flow (FCF) = Operating cash flow – CAPEX(PP&E)-Net
CAPEX (PP&E)-Net
Financial
6,284 1,300 3,187 3,850 6,103 12,330
18,666
10,830
1,946

-24-
1.7
0.7 0.6
31-Dec-14 31-Dec-15 31-Mar-16
0.4 0.2 0.2
31-Dec-14 31-Dec-15 31-Mar-16
1) Including current portion of Long-Term Debt
Financial Ratios
Net Debt / adj. EBITDA** Net Debt / Equity
101,676
104,398
37,361 38,245
53,129 60,041
97,009
101,631
75,093 74,915
20,064 26,138
Statements of Financial Position
(Unit: million THB)
Trade Payable / Others
LT Debt1)
Equities
Current Assets
Non-Current Assets
Cash & ST investment
202,684 192,166
31 Dec 15 31 Mar 16
** Annualized EBITDA (excl stock gain/loss & Reversal of NRV/(NRV))
Q1/16 TOP Group Strong Financial Position & Financial Ratios Financial
Cost of Debt
TOP Group (Net***) 3.77%
TOP Group (Gross) 4.80%
BBB Stable Outlook
Baa1 Stable Outlook
AA- (tha) Stable Outlook
Interest Rate Portion
Float 12%
Fixed 88%
TOP avg.debt life 12.8 Yrs
Consolidated Long-Term Debt as at 31 Mar 16 1)
74,915 million THB
(US$ 2,116 million
equivalence)
Total Long-Term Debt Net Debt
As at 31 Mar 16 (35.41 THB/US$)
***Calculated by interest expense net off interest income as per FS as at 31 Mar 16
Value (Million) Portion
US$ Bond & US$ Loan USD 1,156 55%
THB Bond THB 25,500 34%
THB Loan THB 8,502 11%
15,981 million THB
(US$ 451 million equivalence)
ROE 13.2% 12.5%
ROIC 12.6% 13.3%
*
* Based on actual performance in the past 12 months
*

-25-
Annual DPS (Baht/share)
1.80 3.50 3.50 4.50 2.75 2.55 2.00 3.30 2.70 2.30 1.16 2.70
Dividend Payout 25% 40% 45% 48% n.a. 43% 45% 45% 45% 50% n.a. 45%
Dividend Yield* 4.0% 5.6% 5.6% 6.2% 5.2% 7.1% 4.0% 4.7% 4.2% 3.6% 2.3% 5.0%
7.82
9.19
8.13
9.40
0.11
5.91
4.39
7.28
6.04
4.57
-2.03
5.97
FY/04 FY/05 FY/06 FY/07 FY/08 FY/09 FY/10 FY/11 FY/12 FY/13 FY/14 FY/15
1.50 1.75 1.75
1.05 0.60
1.30 0.50 0.80 0.56 0.90
2.00
2.75
1.00 1.50
1.40
2.00
2.20 1.50 0.60
1.80
1.80
3.50
Dividend Policy : Not less than 25% of consolidated net profit after deducting reserves, subject to cash flow and investment plan
Unit : THB/Share
TOP price 44.7 63.0 62.7 72.7 53.3 35.9 49.9 69.8 65.1 64.6 50.4 53.5
EPSR
1H dividend
* Based on average TOP share price in each year
2H dividend
Year Dividend
Financial
2015 Dividend Payment
R Based on restated financial statement
**
** Dividend payout before restated = 45%

-26-
Strategic Investment Plans

-27-
Broadening Growth, Capturing Step Out ,Pursuing Sustainability
A Leading fully integrated refining and petrochemical company in Asia Pacific
Vision
Core Strategies
Financial discipline Manpower readiness Process/System
Vision Measurement by 2021
WA
Y
END
Enables
MEA
N
• Operational excellence (Safety, Reliability, Efficiency,
Flexibility)
• Margin improvement
• Cost management
• Complete projects i.e. LABIX, TOP SPP
• Organic growth i.e. CFP
• PTT Group collaboration in Sriracha area/ International business
• Value chain enhancement & Integrated downstream
• New business
• R&D
• Portfolio master plan
Review external environments / scenarios & stress test
Top quartile performer DJSI
(Sustainability)
Top Qrt ROIC & NP Growth
Way Forward

-28-
Thaioil Group Investment Matrix
Refinery Downstream
AEC
Thailand
Core Business Growth
New Geography
Myanmar, Vietnam, Indonesia
Integrated Downstream
(B2B, B2C/retail, logistics, trading)
Specialties
Integrated Refinery
New Business
(Technology driven)
Solvent, Marine, Power, Ethanol
-29-
Remaining capital investment
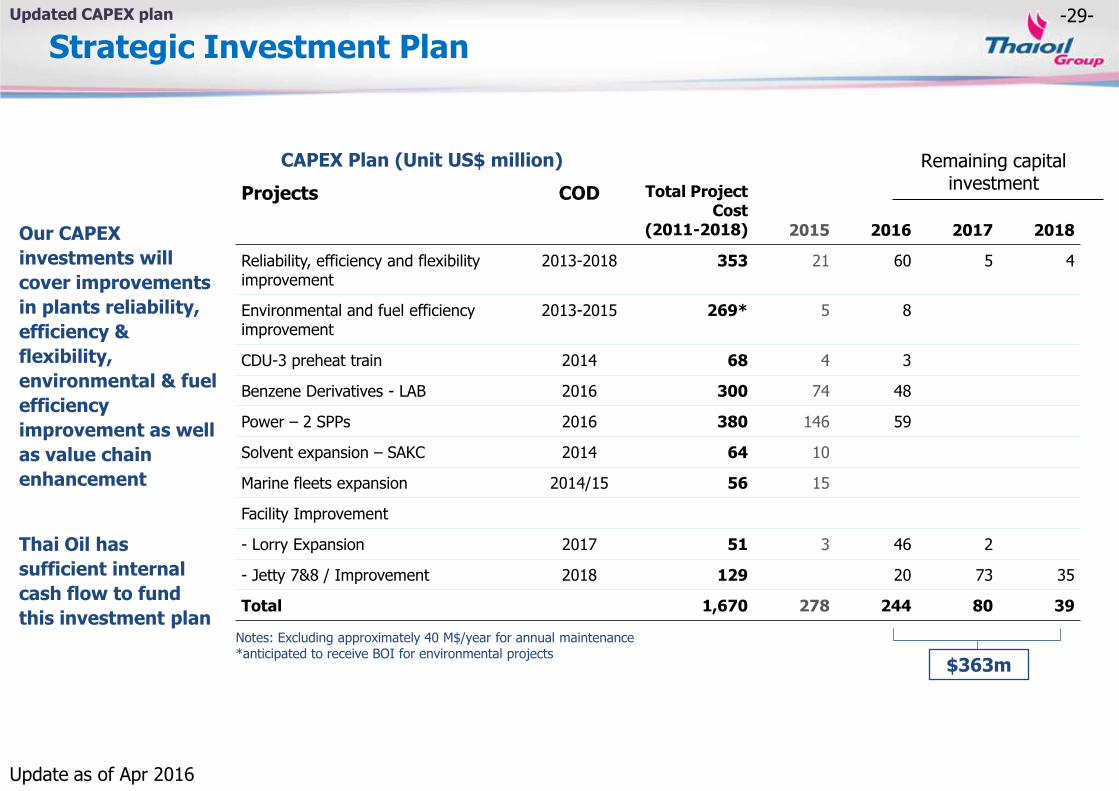
Strategic Investment Plan
Projects COD Total Project Cost
(2011-2018) 2015 2016 2017 2018
Reliability, efficiency and flexibility improvement
2013-2018 353 21 60 5 4
Environmental and fuel efficiency improvement
2013-2015 269* 5 8
CDU-3 preheat train 2014 68 4 3
Benzene Derivatives - LAB 2016 300 74 48
Power – 2 SPPs 2016 380 146 59
Solvent expansion – SAKC 2014 64 10
Marine fleets expansion 2014/15 56 15
Facility Improvement
- Lorry Expansion 2017 51 3 46 2
- Jetty 7&8 / Improvement 2018 129 20 73 35
Total 1,670 278 244 80 39
CAPEX Plan (Unit US$ million)
Notes: Excluding approximately 40 M$/year for annual maintenance *anticipated to receive BOI for environmental projects
Our CAPEX
investments will
cover improvements
in plants reliability,
efficiency &
flexibility,
environmental & fuel
efficiency
improvement as well
as value chain
enhancement
Thai Oil has
sufficient internal
cash flow to fund
this investment plan
$363m
Updated CAPEX plan
Update as of Apr 2016

-30-
Key Project Completion / Progress Update Ongoing Project Update
Project Detail / Progress
Linear Alkyl Benzene (LAB)
•CAPEX = 400 M$
• Successfully COD on 25 Feb 2016
•On technical aspect, plant is successfully test run and capable to run up to 120% (at 120 KTA)
•On commercial aspect, trial cargo has been delivered to customers for quality testing
Operate on
25 Feb 16
Project Detail / Progress
TOP SPP (2 blocks of SPP)
•CAPEX = 380 M$ •COD = Q2 2016
• Successfully COD 1st block of TOP SPP (124MW) on 1 Apr 2016
• 2nd block (115 MW):
• Trial run in late Apr 2016
•Will be COD on 1 Jun 2016
•Overall progress at 99.9%

-31-
Study Project : Clean Fuel Project (CFP)
2015 2016 2017 2018 2019 2020 2021
BDP
FEED
EPC (Engineering Procurement Construction)
EPC Bidding
COD CFP Study Time line
Main objectives of CFP
Enhance competitive advantage of the refinery and maintain 1st quartile performer Enhance capability to upgrade lower value product into higher value product and ability to process heavier (cheaper) crude oil
(Basic Design Package)
(Front-End Engineering and Design)
FID (Final Investment Decision)
CAPEX +/- 10%
Project Update
-32-
2H-16 & 2016 MARKET OUTLOOK
• Crude Oil
• Petroleum Products
• Aromatics
• Base Oil & Bitumen
• LAB

-33-
CRUDE OIL

-34- -34-
Sources: (1) IMF Apr‘16 (2) IMF Jan’15 (3) BOT Mar, 2016 (4) BOT Dec, 2015
(5)ASEAN-5 includes Thailand, Malaysia, Indonesia, Vietnam, Philippines
IMF estimated the 2016’s Global GDP growth at 3.2%
3.0
-0.1
5.4
4.23.5 3.3 3.4 3.1 3.2
3.5
-6
-4
-2
0
2
4
6
8
10
12
Growth
(%YoY) China US EU World
2015 2016 2017
Apr-16(1) Jan-16(2) Apr-16(1) Jan-16(2) Apr-16(1)
USA 2.4% 2.6% 2.4% 2.6% 2.5%
EU 1.6% 1.7% 1.5% 1.7% 1.6%
China 6.9% 6.3% 6.5% 6.0% 6.2%
Japan 0.5% 1.0% 0.5% 0.3% -0.1%
India 7.3% 7.5% 7.5% 7.5% 7.5%
ASEAN-5(5) 4.7% 4.9% 4.8% 4.9% 5.1%
Thailand 2.8%(3) 3.5%(4) 3.1%(3) N/A 3.3%(3)
World 3.1% 3.4% 3.2% 3.6% 3.5%
Macroeconomics & Crude Prices
2016 Global GDP Growth by IMF
-35- -35-
IEA Demand (MBD)
Growth (MBD)
9 .9 .9
5 9 .7 .
95.9 .
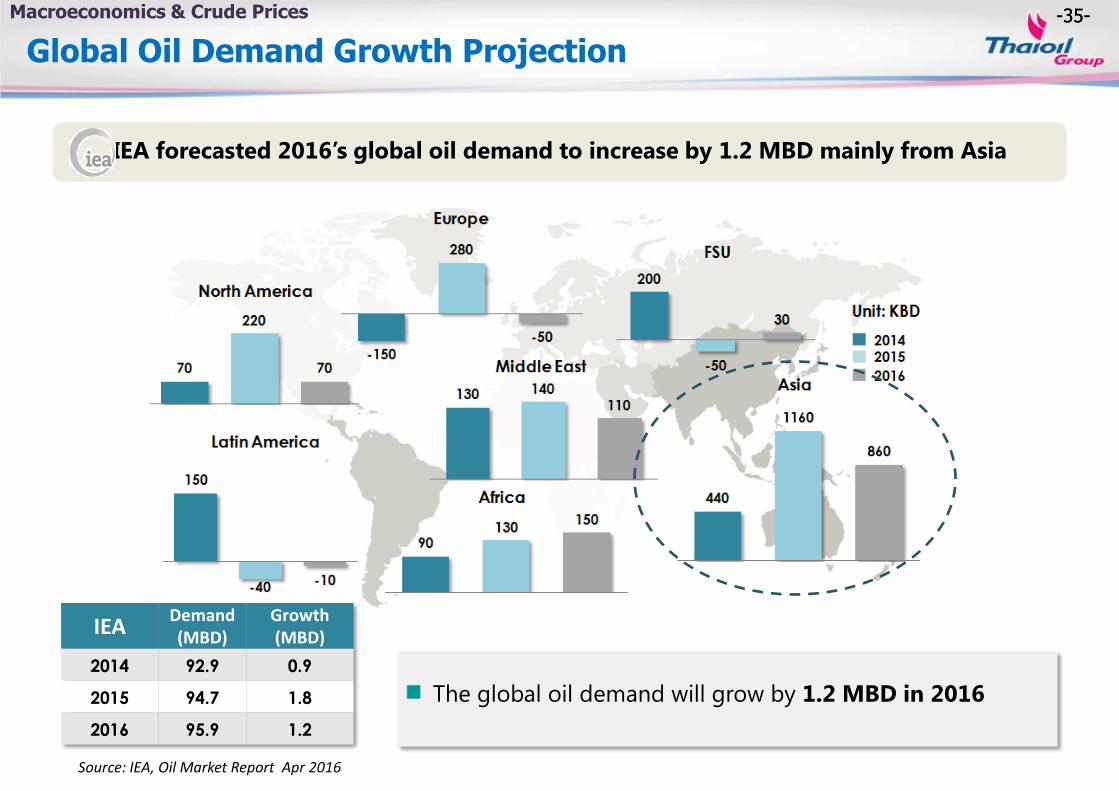
IEA forecasted 2016’s global oil demand to increase by 1.2 MBD mainly from Asia
Source: IEA, Oil Market Report Apr 2016
The global oil demand will grow by 1.2 MBD in 2016
Macroeconomics & Crude Prices
Global Oil Demand Growth Projection

-36- -36-
IEA estimated 2016’s Non-OPEC oil supply growth to contract by 700 KBD
IEA Non OPEC
Supply (MBD)
Growth (MBD)
5 .3 .
5 57.7 .
57. - .7
Source: IEA, Oil Market Report Apr 2016
As lower prices and reduced spending take their toll, non-OPEC supply growth is expected to decline in 2016 – with US growth hit hardest.
Remarks: Regional Non-OPEC Supply excl. Biofuels/Processing G/(L)
Macroeconomics & Crude Prices
Non-OPEC Supply Growth Projection

-37-
0
20
40
60
80
Jan-15 Apr-15 Jul-15 Oct-15 Jan-16 Apr-16 Jul-16 Oct-16
$/BBL
Dubai Price Movement
• Strong buying interest on expectations of tighter supply in 2H-16
• Full price recovery is still at risk, limited by ample supply
Declining US Oil Rigs
Conflict in Yemen
Iran’s Nuclear Deal Done
Greek Debt Default
China’s Stock Market Crash
Refinery
Crude Oil Market: Oil Market Rebalance is Still at Risk
Fed Rate Hike
Key Highlights: *Q2TD (as of 9th May): $39.7/BBL
OPEC failed to agree on an
output ceiling
Iran’s Nuclear Sanction Lifted
No consensus on output
freeze
Next OPEC Meeting on 2nd Jun
1
2
1 2

-38-
0
1
2
3
4
5
6
2011 2012 2013 2014 2015 2016 2017
MBD
U.S. Shale Oil Production by Field
Permian Eagle Ford Bakken Niobrara Others
0
1
2
3
88
90
92
94
96
98
1Q14 3Q14 1Q15 3Q15 1Q16 3Q16
MBD MBD Oil Market Balance
Demand Supply
0
20
40
60
80
100
120
0
100
200
300
400
500
2014 2015 2016
$/BBL Contracts
('000)
ICE Brent Managed Money Positions
Net Long* ICE BRENT (RHS)
250
350
450
550
Jan Feb Mar Apr May Jun Jul Aug Oct Nov Dec
MBBL U.S. Commercial Crude Inventory
5yr-range 2013 2014 2015 5-yr Average 2016
U.S. Crude Stocks Expected to Draw in 2H-16
Strong Buying Interest On Expectations of Tighter Supply in 2H-16
U.S. Shale Oil Output Sets to Decline
1 Refinery
A
- 0.4 MBD YoY
in 2016
Sources: EIA (Apr’16), TOP’s estimate
Surplus (RHS) Sources: IEA (Apr’16) , TOP’s estimate
2016 Demand: + 1.2 MBD YoY Supply: + 0.6 MBD YoY
B
Lower Crude Oil Surplus in 2H-16 Expectation of Tighter Supply Drives Speculation C
Increased Bullish Speculation And Higher Buying Interest
D
Source: Reuters
Q2: Summer Demand
Q4: Winter Demand
Source: EIA
*Net Long = Long positions – Short positions. Investors who are net long will benefit when the price of the asset increases.
May-16

-39-
0
50
100
150
0
1000
2000
3000
4000
5000
2013 2014 2015 2016 2017
Resumed U.S. Supply from DUCs*
Others Permian Bakken Eagle Ford WTI [RHS]
No. of DUCs*
2
3
4
5
2011 2012 2013 2014 2015 2016 2017
MBD
Iran’s Oil Production
28
30
32
34
Jan-14 Jul-14 Jan-15 Jul-15 Jan-16 Jul-16 Jan-17
MBD
OPEC Production 30 MBD Quota Forecast
Higher Prices Could Bring DUCs Online
Full Price Recovery is Still At Risk, Limited By Ample Supply
Refinery
C
Sources: IEA (April’16), PIRA
2
OPEC to Continue Defending Market Share
Record-High OPEC Production
OPEC failed to agree on quota
A Faster-than-Expected Return of Iranian Oil
Sources: IEA (April’16), PIRA
Output freeze deal failed
B
International Sanctions Sanctions Lifted
Source: Wall Street Journal (Apr’16) $/BBL
Source: Bloomberg *DUCs: : Drilled but Uncompleted Wells (U.S. Shale Oil) 0 10 20 30 40
Brazil Canada
U.S. Shale U.S. non-shale
Russia Iraq Iran
Saudi Arabia
US Shale Oil: Slower-than-Expected Decline
Note : Cash cost = Production costs + Selling, General and Administration Expenses
Average 2016 Cash Cost of Production (ICE BRENT $/BBL)
D
Government’s Target ≈ 4 MBD
Shale oil' short-
term production remains viable
Indonesia rejoined OPEC
+ 0.5 MBD (Apr’16 vs. Dec’15)
PETROLEUM PRODUCTS
-40-

-41-
5.8 6.3 5.8
4.8 5.3
8.5 7.9
6.1
8.0 7.6 7.7
5.1
Y2014 1Q14 2Q14 3Q14 4Q14 1Q15 2Q15 3Q15 4Q15 Y2015 1Q16 2Q16TD 2016
Actual Forecast
Key Highlights in 2H-16
Singapore Cracking GRM ($/BBL)
($/BBL) Q4-15 2015 Q1-16 Q2TD-16* 2H-16(F)**
ULG95-DB 18.7 18.3 18.8 15.3
JET-DB 14.1 13.9 11.7 10.3
GO-DB 13.8 13.7 9.6 9.1
HSFO-DB (6.5) (5.0) (5.2) (8.7)
Sources: Reuters, TOP’s estimate
Stable gasoline cracks on summer demand
1
Remarks: *Q2TD-16 as of 9 May 16, **Compared to 1H-16
Refinery
Middle distillate cracks hit the bottom in Q3/16 and recover in Q4/16 on cold weather
2
Steady Refinery Margin in 2H-16 on Recovered Middle Distillate Cracks

-42-
5
10
15
20
25
30
Jan Mar May Jul Sep Nov
5yr-range 2015 2016 avg 11-15
Refinery
Stable Gasoline Cracks on Summer Demand 1
8.0
8.5
9.0
9.5
10.0
Jan Feb Mar Apr May Jun Jul Aug Sep Oct Nov Dec
2016 2015
US Gasoline Demand Y2016 : +167 KBD (+1.8%)
Driving Season
Source : EIA Short-term Energy Outlook (May’16)
MBD
US Gasoline Stocks
Softer Gasoline now on Pre-Building Stocks
Fundamentally, Demand Growth Remain Solid B
US Market to Support by Driving Demand A C
MBBL ARA and Singapore Gasoline Stocks
Source : Reuters Note : ARA = Amsterdam Rotterdam Antwerp
MBBL
180
200
220
240
260
280
Jan Mar May Jul Sep Nov
5yr-range 2015 2016 avg 11-15 2016
Stock drawdown more than 15 MBBL since the peak on solid demand
0%
5%
10%
15%
China India Asia Pacific
2014 2015 YTD 2016 (4M)
Asia Pacific Gasoline Demand Growth YoY
Sources: FACTs (Apr’16), Reuters
Refiners have built up Gasoline stocks since Jan’16 for summer

-43- Refinery
Middle Distillate Cracks Hit the Bottom in Q3/16 and Will Recover in Q4/16 on Cold Weather 2
Source : FACTs (Apr’16)
Surplus on High Refinery Run Rates
China Exports Keep Pressure on Market B
70 percent of La Nina in Q4/16 A C
Asia Pacific Refinery Run
10.0
10.5
11.0
11.5
12.0
12.5
Jan Feb Mar Apr May Jun Jul Aug Sep Oct Nov Dec
2016 2015 La Nina Effect
Asia Pacific Gasoil and Jet Demand
Y2016(Neutral) : +268 KBD (+2.4%) MBD
25.0
25.5
26.0
26.5
27.0
27.5
28.0
28.5
29.0
Jan Feb Mar Apr May Jun Jul Aug Sep Oct Nov Dec
2016 2015
MBD
KBD Chinese Gasoil Export
Source : FACTs (Apr’16)
Elevated refinery run to meet Gasoline demand
Percent of La Nina in the next winter
(Nov’15 – Jan’16) following a El Nino
El Nino
0
200
400
600
800
Jan-15 Apr-15 Jul-15 Oct-15 Jan-16 Apr-16 Jul-16
Export Export Quota
May-Aug’16 Fishing Ban
Quota 1 : 726 KBD
Quota 2 : 467 KBD
Source : FACTs (Apr’16)
Y2016 : +680 KBD (+2.5%)
30%
70%
Neutral
La Nina
El Nino
Sources : National Oceanic and Atmospheric Administration (May’16), PIRA
(La Nina) : +328 KBD (+2.9%)
-44-
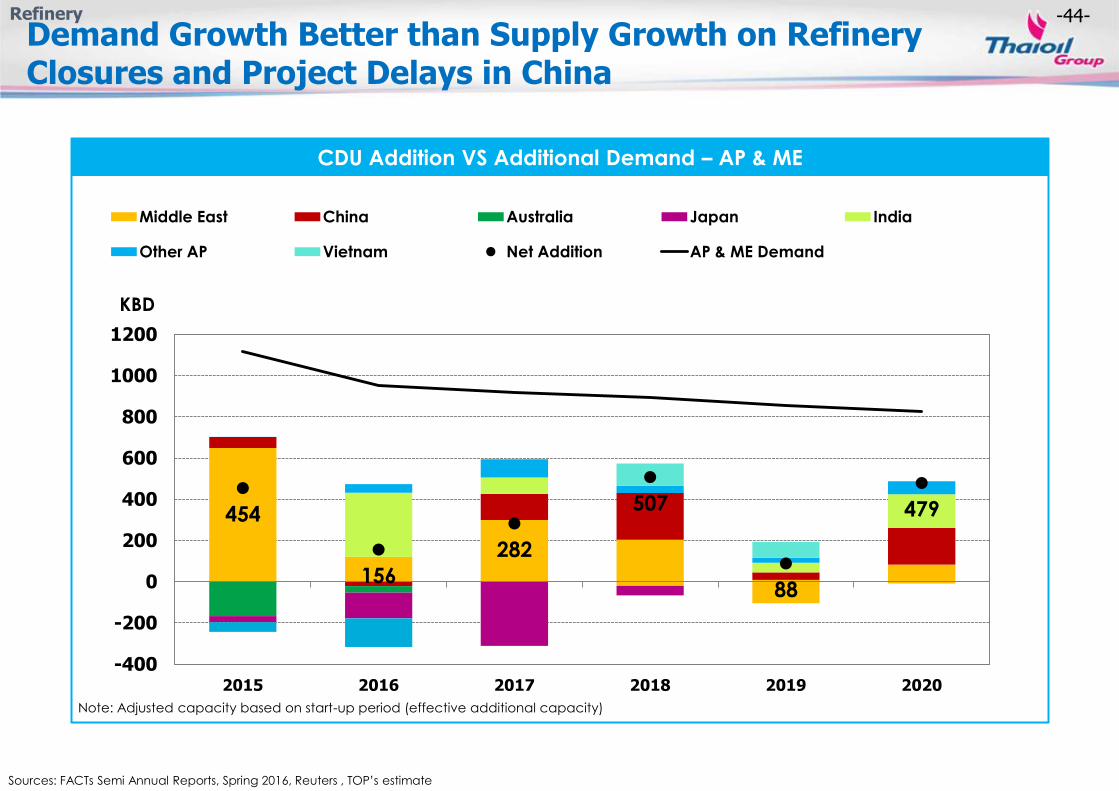
Note: Adjusted capacity based on start-up period (effective additional capacity)
454
156
282
507
88
479
-400
-200
0
200
400
600
800
1000
1200
2015 2016 2017 2018 2019 2020
KBD
Middle East China Australia Japan India
Other AP Vietnam Net Addition AP & ME Demand
CDU Addition VS Additional Demand – AP & ME
Refinery
Sources: FACTs Semi Annual Reports, Spring 2016, Reuters , TOP’s estimate
Demand Growth Better than Supply Growth on Refinery Closures and Project Delays in China

-45-
Year on Year Y 2015(B) YTD 3M 2016(B)
(vs. 3M 2015) Y 2016(C)
Mogas (A) +13.3% +11.0% +7.1%
Jet/Kero +9.7% +4.9% +4.4%
Diesel (A) +4.0% +4.9% +2.2%
Fuel Oil -1.4% +28.4% +14.7%
Total +6.6% +7.4% +4.4%
GDP +2.8% N.A. +3.1%(D)
Thailand’s Oil Demand
Remarks:
(A) Mogas and Diesel includes Ethanol and Biodiesel, respectively
(B) DOEB
(C) PTT Estimation (as of Mar 2016)
(D) BOT Estimation (BOT Monetary Report as of Mar 2016)
Thailand Petroleum Demand Growth
Thailand’s oil demand growth at 4.4% YoY in 2016
Gasoline and Diesel demand in 2016 are supported by low oil prices and improved Thai economy.
Robust tourism sector pushes Jet demand to grow persistently.
Thailand’s Oil Demand in 2016

-46-
AROMATICS

-47-
($/TON) Q4-15 2015 Q1-16 Q2TD-16* 2H-16 (F)**
PX-ULG95 288 256 332 331
BZ-ULG95 101 97 156 176
Key Highlights in 2H-2016
Aromatics Market
Remarks: *Q2TD-16 as of 9 May 16, **Compared to 1H-16
Source: TOP’s Estimate
Slightly softer PX market due to new capacity
Slightly softer BZ market due to new capacity but limited by derivative demand
1
2
Aromatics
279 273
220
371
252 255 246 233
288 256
332 331
Y2
01
4
1Q
14
2Q
14
3Q
14
4Q
14
1Q
15
2Q
15
3Q
15
4Q
15
Y2
01
5
1Q
16
2Q
16
TD
20
16
PX-ULG95 ($/TON)
Actual Forecast
268 285 254
327
207
98 115 74
101 97
156 176
Y2
01
4
1Q
14
2Q
14
3Q
14
4Q
14
1Q
15
2Q
15
3Q
15
4Q
15
Y2
01
5
1Q
16
2Q
16
TD
20
16
BZ-ULG95 ($/TON)
Actual Forecast
Slightly Softer Aromatics Market on New Capacity in 2H-16 Capped by New Derivative Demand

-48-
New PX Capacity will Pressure Market in 2H-16 Lower PX Plants Turnaround in 2H-16
Rising PX Supply Growth Balances with Demand
Sources: PCI (Feb’16), HIS (Mar’16)
Slightly Softer PX Market due to New Capacity 1
Chinese Demand Outpaces Capacity C
A
D
B
7.9 8.6 8.8 9.0
34.3
10.5 10.5 11.1 11.1
43.2
50%
60%
70%
80%
90%
0
10
20
30
40
50
Q1-16 Q2-16 Q3-16 Q4-16 2016
Utilization Mil TON AP/ME PX Demand and Capacity
Demand Effective Capacity Utilization
0
1
2
3
4
5
Q1-16 Q2-16 Q3-16 Q4-16 2016
Mil TON
AP Nameplate PX Capacity Turnaround
China Japan S. Korea Taiwan
Malaysia Singapore India
Unplanned Shutdown in
China and Singapore (2.1
MTA) in Q1-16
5.0 5.5 5.6 5.6
21.8
3.4 3.4 3.5 3.5
13.8
50%
60%
70%
80%
90%
0
5
10
15
20
25
Q1-16 Q2-16 Q3-16 Q4-16 2016
Utilization Mil TON Chinese PX Demand and Capacity
Demand Effective Capacity Utilization
Aromatics
2016 Demand: + 4.9% YoY Capacity: + 4.9% YoY
2016 Demand: + 5.3% YoY Capacity: + 7.8% YoY
0
1
2
Q1-16 Q2-16 Q3-16 Q4-16 2016
Mil TON
AP/ME Effective PTA & PX Capacity Addition
PTA (PX equivalent) Effective Capacity PX Effective Capacity
Reliance Industries No.4 startup
in Q3-16 resulting in rising PX spot cargoes in Asia

-49-
313 545 471 485 279 259
24 26 27
30 31
33 34 36 37
39 41
29 30 31
33
38 41
43 46 47
49 51
60%
70%
80%
90%
100%
0
10
20
30
40
50
60
2010 2012 2014 2016 2018 2020
Utilization Rate (%) Mil Ton
Demand Effective Capacity Utilization Rate (%)
Forecast
2010-2015
Dem: 7.0%
Cap: 8.4%
2016-2020
Dem: 4.2%
Cap: 4.5%
Aromatics
Source: PCI as of Sep’15
PX-ULG95
AP/ME PX Demand and Capacity Outlook
-50-
0
1
2
3
4
5
Q1-16 Q2-16 Q3-16 Q4-16 2016
Mil TON
China Japan S. Korea Taiwan Malaysia Singapore India
AP Nameplate BZ Capacity Turnaround
No Additional BZ Capacity in China AP/ME BZ Capacity Remains Long
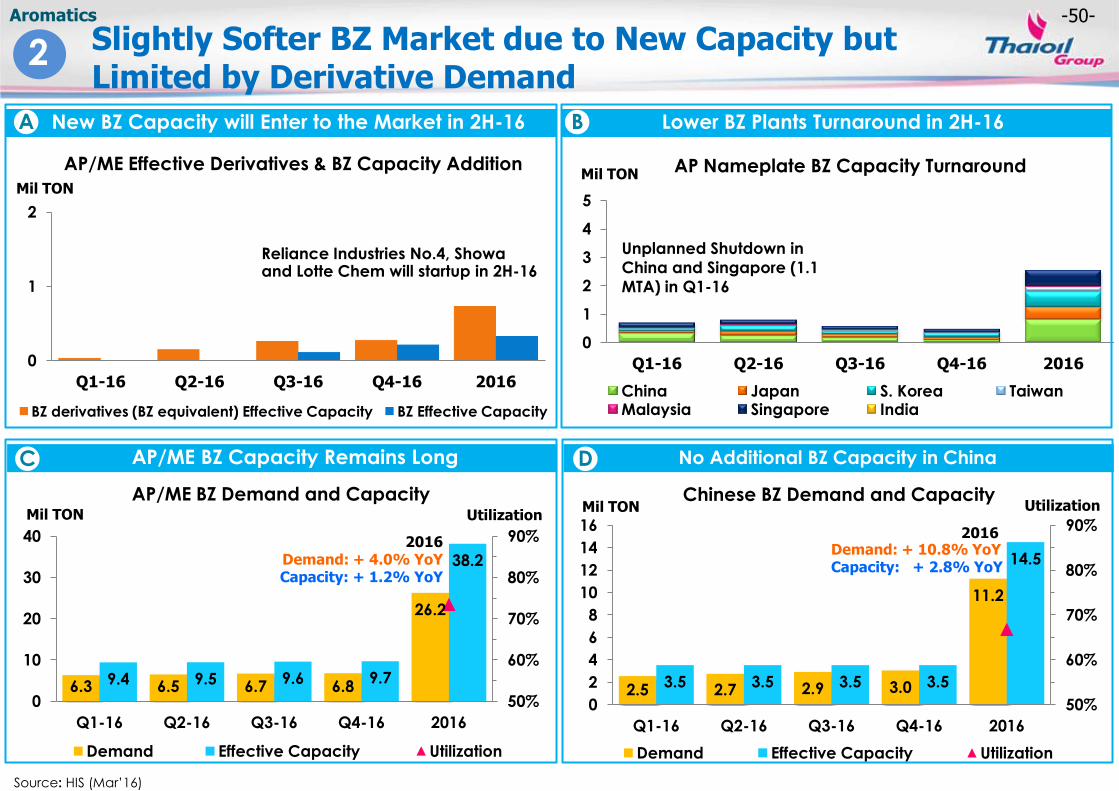
Lower BZ Plants Turnaround in 2H-16 New BZ Capacity will Enter to the Market in 2H-16
Source: HIS (Mar’16)
Aromatics
2 Slightly Softer BZ Market due to New Capacity but Limited by Derivative Demand
C
A
D
B
Unplanned Shutdown in
China and Singapore (1.1
MTA) in Q1-16
6.3 6.5 6.7 6.8
26.2
9.4 9.5 9.6 9.7
38.2
50%
60%
70%
80%
90%
0
10
20
30
40
Q1-16 Q2-16 Q3-16 Q4-16 2016
Utilization Mil TON
AP/ME BZ Demand and Capacity
Demand Effective Capacity Utilization
2.5 2.7 2.9 3.0
11.2
3.5 3.5 3.5 3.5
14.5
50%
60%
70%
80%
90%
0
2
4
6
8
10
12
14
16
Q1-16 Q2-16 Q3-16 Q4-16 2016
Utilization Mil TON Chinese BZ Demand and Capacity
Demand Effective Capacity Utilization
2016 Demand: + 4.0% YoY Capacity: + 1.2% YoY
Demand: + 10.8% YoY Capacity: + 2.8% YoY
0
1
2
Q1-16 Q2-16 Q3-16 Q4-16 2016
Mil TON
BZ derivatives (BZ equivalent) Effective Capacity BZ Effective Capacity
2016
Reliance Industries No.4, Showa and Lotte Chem will startup in 2H-16
AP/ME Effective Derivatives & BZ Capacity Addition

-51-
165 87 157 288 268 100
22 22 23 24 25 25 26 27 28 29 30 31 33 33
34 37 38 38 39 40 41 42
60%
70%
80%
90%
0
10
20
30
40
50
60
2010 2012 2014 2016 2018 2020
Utilization Rate (%) Mil Ton
Demand Effective Capacity Utilization Rate (%)
2010-2015
Dem: 4.7%
Cap: 5.0%
2016-2020
Dem: 3.8%
Cap: 2.2%
Forecast
Aromatics
Sources: IHS as of Oct’15
BZ-ULG95
AP/ME BZ Demand and Capacity Outlook

-52-
BASE OIL & BITUMEN

-53-
($/TON) Q4-15 2015 Q1-16 Q2TD-16* 2H-16(F)**
500SN-
HSFO 450 431 427 392
Sources: ICIS Publication and TOP’s Estimate
New Gr.II planned to start up in 2H to pressure market Regional Gr.I plant maintenance in 2H to limit spot supply especially for heavy viscosity grades
Base Oil & Bitumen
Key Highlights in 2H-16
Remarks: *As of 9 May 16, **Compared to 1H-16
Base Oil Benchmark Spread ($/TON) Global Additional Nameplate Capacity
Asian Pacific Plant Maintenance in 2016 2
1
Sources: Argus 2016 and TOP Estimate
Million TON/MONTH
Sources: Argus 2016 and TOP Estimate
0.0
0.1
0.2
0.3
1H-16 2H-16
Group 1 Group 2 Group 3
Million TON
Soft Base Oil Spread in 2H-16 due to Weak Demand amid Additional Supply
2
1
4.8
0.0 0.4 0.9
-2.0
0.0
2.0
4.0
6.0
8.0
2014 2015 1H-2016 2H-2016 Group 1 Group 2 Group 3 Net Capacity
495 486 501 500 493
369 399 506
450 431 427 392
Y2
01
4
1Q
14
2Q
14
3Q
14
4Q
14
1Q
15
2Q
15
3Q
15
4Q
15
Y2
01
5
1Q
16
2Q
16
TD
Y2
01
6
500SN-HSFO (Actual) Forecast

-54-
1.7 1.1
4.8
0.0 1.3
0.7
2.9
0.0 0.0
-2.0
0.0
2.0
4.0
6.0
8.0
2012 2013 2014 2015 2016 2017 2018 2019 2020
Million TON
Group I Group II Group III Net Capacity Change
Base Oil & Bitumen
Net Announced Capacity Addition A
2016: Capacity grows at normal rate
Source: Argus Report 2012-2016, ICIS Base Oil London Conference in 2016 and TOP Estimate
Peak Capacity Addition
Delay Capacity from 2015 to 2016
and 2017
Period Type Company Location Group Capacity
1Q-16 New Sinopec Maoming China Gr.II 250
1Q-16 Closure Shandong Quinyuan China Gr.I+ -400
1Q-16 New Shandong Quinyuan China Gr.II 600
1Q-16 Closure Nynas Germany Gr.I -170
1Q-16 Closure KPC Netherlands Gr.I -235
2Q-16 New Adnoc (Ruwais) UAE Gr.II 120
2Q-16 New Adnoc (Ruwais) UAE Gr.III 500
2Q-16 New CNOOC Taizhou China Gr.II 600
1H-16 Closure Exxon Mobil (Beaumont)
US Gr.I -510
3Q-16 New Luberef Saudi Arabia
Gr.II 715
3Q-16 New Ergon Refining US Gr.I (BS) 150
3Q-16 New VN Oil Vietnam Gr.II 50
2016 Closure Rosneft
(Novokuibyshevsk) Russia Gr.I -224
2016 Conversion Rosneft
(Novokuibyshevsk) Russia Gr.II 200
2016 New Paijin Northern
asphalt China Naphthanics 300
1Q-17 New Puralube Germany Gr.III 50
1Q-17 Closure Puralube Germany Gr.II -50
1Q-17 New Slaveft (Yaroslavl) Russia Gr.III 100
2017 Expansion Neste Finland Gr.III 200
2017 New Petrobras (Comperj) Brazil Gr.II 355
Global Nameplate Capacity vs Demand B
50.70 55.48 55.52 56.79 57.45 60.33 60.33 60.33
32.20 32.22 32.20 32.12 32.05 32.08 32.15 32.16
0
10
20
30
40
50
60
70
2013* 2014 2015 2016 2017 2018 2019 2020
Million Ton
Group I Group II Group III Net Capacity Demand
Delayed from
Q1 to Q2
Delayed from
Q1 to Q3
Supply Overhang Lower demand in 2015-2017 on soft Global GDP
Soft Base Oil Spread in 2H 2016 due to Weak Demand amid Addition Supply

-55-
Sources: ICIS Publication, TOP’s Estimate
Base Oil & Bitumen
Remarks: *As of 9 May 16, **Compared to 1H-16
Bitumen Market
($/TON) Q4-15 2015 Q1-16 Q2TD-16* 2H-16(F)**
Bitumen-
HSFO 98 56 (7) (36)
Rainy season in Q3 limits paving demand
Accumulated imports since Q4-15 limit import interest especially from Vietnam and Indonesia
Key Highlights in 2H-16
Bitumen Benchmark Spread ($/TON) Average Import Volume of Major
Asian Players
0
100
200
300
400
500
Q1-15 Q2-15 Q3-15 Q4-15 Q1-16*
China Indonesia India Vietnam
KTON/MONTH
Lower Bitumen Spread in 2H-16 on Lull Seasonal Demand amid High Inventories
Source: Bitumart Report (2015-2016) *Remarks: YTD2016 as of Jan-16
-32 -69 -77 -66
85
23 20
82 98
56
-7 -36
Y2
01
4
1Q
14
2Q
14
3Q
14
4Q
14
1Q
15
2Q
15
3Q
15
4Q
15
Y2
01
5
1Q
16
2Q
16
TD
20
16
Bitumen-HSFO (Actual) Forecast
1
2
-56-
LAB

-57-
($/TON) Q4-15 2015 Q1-16 Q2TD-16* 2H-16 (F)**
LAB - BZ 544 569 513 505
Key Highlights in 2H-16
Slower demand in Q3 due to rainy
season
South East Asia remains net importer
LAB Market
Source: ICIS Publication (2013-2015), TOP’s Estimate
LAB - BZ ($/TON)
LAB
Remarks: *As of 9 May 16, **Compared to 1H-16
549 532 504 505
655 591 557 582 544 569
513 505
Y2
01
4
1Q
14
2Q
14
3Q
14
4Q
14
1Q
15
2Q
15
3Q
15
4Q
15
Y2
01
5
1Q
16
2Q
16
TD
Y2
01
6
LAB-BZ Forecast
South East Asia
LAB Demand and Supply
0
100
200
300
400
500
2014 2015 2016
Demand Capacity
KTA
1
2
Steady LAB Spread in 2H-16 on Stable LAB market

-58-
CONCLUSION
-59-
Refinery
Aromatics
Lube Base
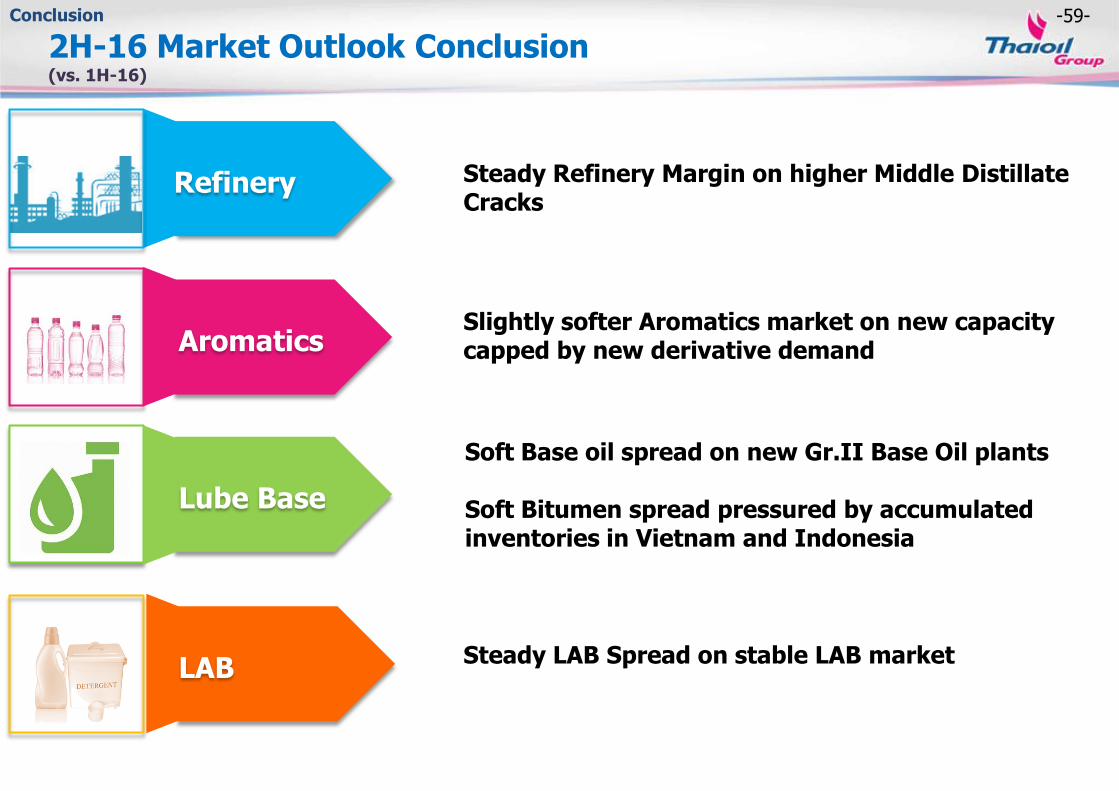
Steady Refinery Margin on higher Middle Distillate Cracks
Soft Base oil spread on new Gr.II Base Oil plants Soft Bitumen spread pressured by accumulated inventories in Vietnam and Indonesia
Conclusion
2H-16 Market Outlook Conclusion
LAB Steady LAB Spread on stable LAB market
Slightly softer Aromatics market on new capacity capped by new derivative demand
(vs. 1H-16)
-60-
APPENDIX
• Q1/16 Performance analysis
• CDU Addition VS Additional Demand – AP & ME
• World GRM / Inventories
• Thailand petroleum demand by products

-61-
Total Thailand Crude Refining Capacity 1,252 kbd1
Market Shares for Refined Petroleum Product3
Note: 1. Source: Energy Policy and Planning Office (EPPO), Ministry of Energy Thailand
2. PTT holds a 38.51% interest in IRPC, a 48.9% interest in PTTGC, and a 5.41% interest in SPRC as at 3 Dec 15
3. Calculate by total domestic sales of refined petroleum products of Thai Oil divided by total sales of petroleum
products in Thailand excl LPG as a feedstock and own used. Source from EPPO
4. Source: Department of Energy Business, Ministry of Energy
Thai Oil (275 kbd)
PTT’s Principal Refiner
Esso
(177 kbd)
IRPC2
(215 kbd)
SPRC2
(165 kbd)
BCP
(120 kbd)
Fang
(3 kbd)
PTTGC2
(280kbd)
Thai Oil 22% Share Nameplate Capacity
RPCG
(17 kbd)
Thailand Leading Refinery : Superior Utilization/ Commercial
107% 110%
106%
91% 95% 94%
Q1/16 Q4/15 Q1/15
TOP’s Refinery Utilization vs. Industry4
TOP Refinery Overall Industry (Thailand)
87% 86% 80%
79%
81% 82%
13% 14% 20% 21% 19% 18%
TOP’s Domestic Sale vs Industry4
Q4/15
TOP Industry Thailand
TOP Industry Thailand
Q1/15
TOP Industry Thailand
Q1/16
Refining
Export Q1/16 Q4/15 Q1/15
TOP Ind. TOP Ind. TOP Ind.
CLMV 10% 4% 13% 11% 8% 6%
Others 3% 10% 7% 10% 11% 12%
Domestic
Export
33% market shares
Q1/16
30% market shares
Q4/15

-62-
46 55 55 59
64 62 56
48 45 46 42
35 27 29
35 39 42
20
40
60
80
Jan Feb Mar Apr May Jun Jul Aug Sep Oct Nov Dec Jan Feb Mar Apr May
2015 2016
2015 2016 2015
$/bbl Q1 Q2 Q3 Q4 Q1 FY15
Market GRM 8.8 7.4 6.6 8.5 6.1 7.8
Stock G/(L) (1.5) 2.5 (4.9) (3.3) (1.0) (1.9)
Accounting GRM 7.3 9.9 1.7 5.2 5.1 5.9
Q1/16: Soften GRM Pressured by Declined Middle Distillate
2015 2016 2015
$/bbl Q1 Q2 Q3 Q4 Q1 Q2TD* FY15
DUBAI (DB) 51.9 61.3 49.7 40.7 30.4 39.7 50.9
ULG95 - DB 15.3 19.8 19.3 18.7 18.8 15.3 18.3
JET - DB 17.1 13.5 10.9 14.1 11.7 10.4 13.9
GO - DB 16.3 13.7 10.8 13.8 9.6 9.1 13.7
HSFO - DB (1.8) (3.5) (8.1) (6.5) (5.2) (8.7) (5.0)
Refining
Dubai Crude Price & Key Petroleum Product Spreads Refinery Utilization
Q1/16 Q4/15 Q1/15
107% 110% 106%
Gross Refinery Margins - GRM
- Soften middle distillate spread as surplus in market and high inventory
- Higher MB Premium pressured GRM
Dubai Price
(US$/bbl)
Market GRM Highlight
Performance Highlight
+ High run at 107% in Q1 to capture domestic market
+ Higher domestic sales of petroleum products at 87% contributed good margins
+ Lower fuel & loss tracking DB price
% MB Intake/OSP*
51%/ 3.3
50%/ 2.0
51%/ 1.1
*Murban OSP over Dubai ($/bbl)
* As of 9 May 16

-63-
2015 2016 2015
$/ton Q1 Q2 Q3 Q4 Q1 Q2TD* FY15
PX*-ULG95 255 246 233 288 332 331 256
BZ-ULG95 98 115 74 101 156 176 97
290 251 224
277 238 224
266 235 235
270 295 299 290
360 347 339 322
120 56
119 184
66 94
164
70 25 59
125 119 121 167 180 181 182
-30
120
270
420
+ Improved PX/BZ margins driven by lower supply as unplanned shut down in China(PX 1.6MTA, BZ 0.5 MTA) & in SG (PX 0.5MTA, BZ 0.6 MTA) and higher demand from new PTA plant in China (2.2MTA) & good SM margins
Aromatics
Aromatics Spreads and Margins
TPX’s Sales (excluding byproduct) & Product-To-Feed Margin (P2F)
Aromatics Production
Q1/16 Q4/15 Q1/15
80% 85% 66%
(Unit : KTon)
(US$/Ton)
PX-ULG95
BZ-ULG95
Market Highlight
*CFR Taiwan
Performance Highlight
2015 total sales (Kton)
TL 59
BZ 185
PX 442 + Optimized run between
aromatics & refinery to maximize group margins
+ Improved P2F supported by higher spreads
+ Lower utility cost tracking
drop in oil price help further support GIM contribution
* As of 9 May 16
2015 2016 2015
$/ton Q1 Q2 Q3 Q4 Q1 FY15
P2F -$/ton 11 76 54 93 98 63
P2F -$/bbl 1.4 9.9 7.1 12.2 12.8 8.2
GIM contribution (0.4) 0.8 0.5 1.3 1.4 0.6
103 108 126 106 104
48 44 51
42 38 5
32 21 20
TL
BZ
MX
PX
Q1/16: Higher Margins Supported by Supply Outages

-64-
2015 2016 2015
$/ton Q1 Q2 Q3 Q4 Q1 FY15
P2F -$/ton 108 139 119 131 126 124
P2F -$/bbl 16.3 21.1 18.0 19.9 19.2 18.9
GIM contribution 0.7 1.0 0.9 1.1 0.9 0.9
2015 2016 2015
$/ton Q1 Q2 Q3 Q4 Q1 Q2TD* FY15
500SN-HSFO 369 399 506 450 427 392 431
BITUMEN-HSFO 23 20 82 98 (7) (36) 56
430 312 366 390 383 424
491 551
477 444 428 477 453 426 403 388 396
73 (22) 19 27 6 28 58 96 91 94 96 104
38 (20) (39) (34) (39)
-200
0
200
400
600
800
Lube Base Oil
64 59 55 60 63 31 36 37 36 37 98 84 117 106 97
Base Oil & Bitumen Spreads & Margins
TLB’s Sales (excluding byproduct) & Product-To-Feed Margin (P2F)
Base oil Production
Q1/16 Q4/15 Q1/15
88% 90% 79%
500SN-HSFO
Bitumen-HSFO
(Unit : KTon)
(US$/Ton)
Performance Highlight
Bitumen
Specialty
Base Oil
2015 total sales (Kton)
+ Higher domestic sales (86% in Q1/16 vs 81% in Q4/15)
+ Higher portion of specialty sales to partially offset soften base oil/bitumen spreads
Bitumen 406 KT
Specialty 141 KT
Base Oil 238 KT
* As of 9 May 16
Q1/16: Lower Base Oil Margins Pressured by Concern on New Supply
23% 22% 24%
10% 13% 14%
2014 2015 Q1/16
Base Oil Specialty
% Base Oil & Specialty Sale Volume

-65-
Q1/15 Q2 Q3 Q4 Q1/16 FY/15 FY/14 Q1/15 Q2 Q3 Q4 Q1/16 FY/15 FY/14
1.4 9.9 7.1 12.2 12.8 8.2 6.1
Q1/15 Q2 Q3 Q4 Q1/16 FY/15 FY/14
8.6 7.2 6.4 8.3
6.0 7.6
5.4
(0.4)
0.8 0.5
1.3
1.4 0.6
0.1
0.7 1.0 0.9
1.1
0.9 0.9
0.7
8.9 9.0 7.8
10.7
8.3 9.1
6.2
TOP TPX TLB GIM
7.1 9.6
1.7 5.1 5.0 5.8
1.1 (0.4)
0.8
0.5
1.3 1.4 0.6
0.1
0.7
1.0
0.9
1.1 0.9 0.9
0.7
7.4
11.4
3.1
7.5 7.3 7.2
1.9
TOP TPX TLB GIM
16.3 21.1 18.0 19.9 19.2 18.9 17.1
Q1/15 Q2 Q3 Q4 Q1/16 FY/15 FY/14
Beauty of Integration…Sustainable GIM
(Unit: US$/bbl)
Marketing GIM Accounting GIM
Crude
Product to Feed
Product to Feed
Marketing GRM (excluded stock gain / loss)
(Unit: US$/bbl) (Unit: US$/bbl)
Performance Breakdown
8.8 7.4 6.6 8.5 6.1 7.8 5.7
Q1/15 Q2 Q3 Q4 Q1/16 FY/15 FY/14

-66-
*Since Q3/14 onwards, 2014 SAKC capacity = 141 KTA / 2013 SAKC capacity = 76 KTA ** Apply on an equity accounted basis in the consolidated financial statement.(GPSC has been held by TOP 8.9% and TP 20.8% since 18 May 15) ***TP performance are based on TOP’s equity portion (excluding shares of profit from the investment in GPSC). TOP hold TP 74% since 4 Dec 12
Q1/16: Performance Breakdown
Q1/15 4,497 (742) 322 34 47 45 90 173 4,498 999 3,499
Q4/15 1,938 713 684 57 54 2 74 81 3,749 (4,166) 7,915
Q1/16
2,788 881 502 27 48 24 119 211 4,726 (311) 5,037
107%
80% 88%
120%
99% 103% 95% 110%
85% 90% 90%
100% 94%
87%
Q1/16 Q4/15
Refinery Aromatic Lube Solvents Marine Ethanol Power
Performance Breakdown
Consol
*
** 24.29% holding
Utilization/Production (%) & Net Profit (million THB)
*** 74% holding
StkG/(L)&Reversal of NRV/ (NRV)
Consol Excl Stock G/(L) & Reversal of NRV/(NRV)
Key Points • TOP: high run to capture domestic
market and good GRM
• TPX: optimized run and improved contribution from higher spread & lower energy cost
• TLB: soften contribution from lower spread
• TP: better contribution as higher utilization & more contribution from GPSC
• TS: soften contribution pressured by lower selling price per unit & weaken gross profit margin
• TM: soften contribution as lower vessel utilization especially from TMS
• TET: improved production rate and better gross profit margin from lower feed cost
-67-
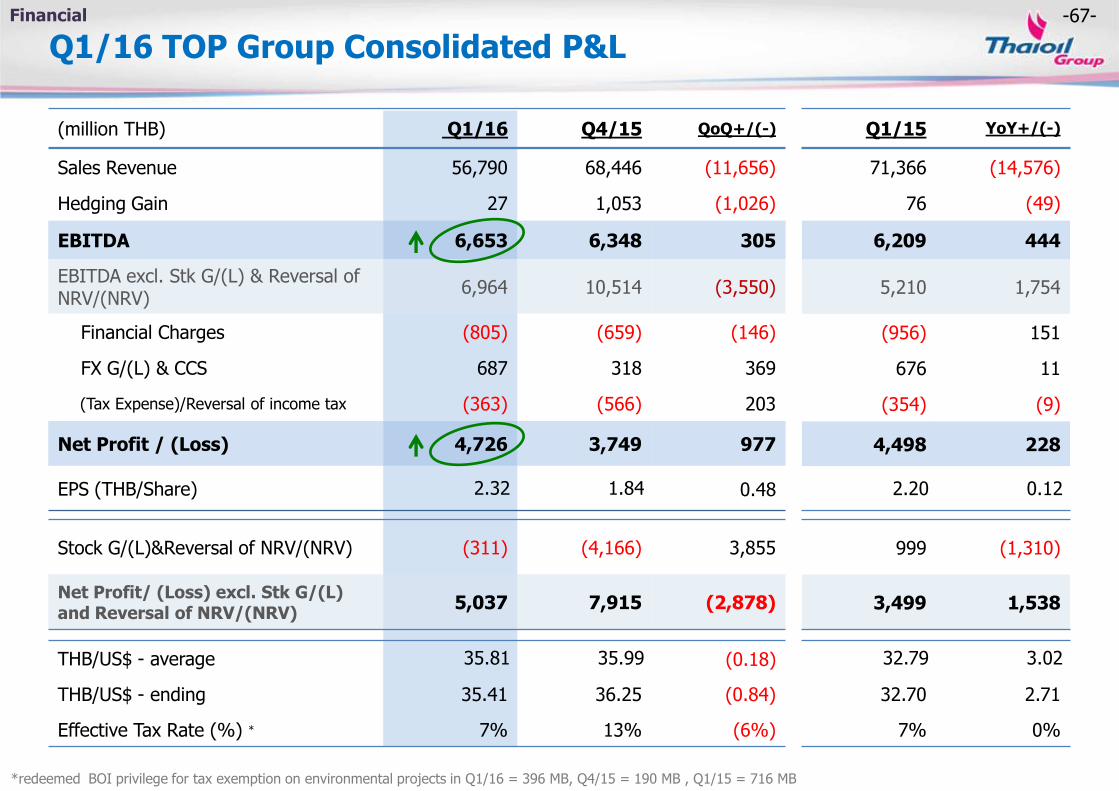
THB/US$ - average 35.81 35.99 (0.18)
THB/US$ - ending 35.41 36.25 (0.84)
Effective Tax Rate (%) * 7% 13% (6%)
(million THB) Q1/16 Q4/15 QoQ+/(-)
Stock G/(L)&Reversal of NRV/(NRV) (311) (4,166) 3,855
Net Profit/ (Loss) excl. Stk G/(L) and Reversal of NRV/(NRV)
5,037 7,915 (2,878)
Sales Revenue 56,790 68,446 (11,656)
Hedging Gain 27 1,053 (1,026)
EBITDA 6,653 6,348 305
EBITDA excl. Stk G/(L) & Reversal of NRV/(NRV)
6,964 10,514 (3,550)
Financial Charges (805) (659) (146)
FX G/(L) & CCS 687 318 369
(Tax Expense)/Reversal of income tax (363) (566) 203
Net Profit / (Loss) 4,726 3,749 977
EPS (THB/Share) 2.32 1.84 0.48
32.79 3.02
32.70 2.71
7% 0%
999 (1,310)
3,499 1,538
Q1/16 TOP Group Consolidated P&L
Q1/15 YoY+/(-)
71,366 (14,576)
76 (49)
6,209 444
5,210 1,754
(956) 151
676 11
(354) (9)
4,498 228
2.20 0.12
Financial
*redeemed BOI privilege for tax exemption on environmental projects in Q1/16 = 396 MB, Q4/15 = 190 MB , Q1/15 = 716 MB

-68-
Financing (12) 141
Loans proceeding 1,653 1,721
Loans repayment (164) (137)
Interest (1,501) (1,443)
Free Cash Flow (8,962) 1,667
Q1/16 TOP Group Consolidated Cash Flow
Beginning
cash 35,764
S/T investment 17,364
53,129
Q1/16 Q1/15
Operating Cash Flow 9,763 9,413
Net income & non-cash adj. 6,378 4,232
Change in working capital 3,385 5,181
+
+ =
+
Q1/16 Q1/15
Investments (18,725) (7,746)
ST investments (16,293) (5,128)
CAPEX (PP&E) & other (2,432) (2,618)
Ending
26,384
33,657
60,041
Effect of FCD
(406) + Change
(8,974)
16,293
Operating Cash Flow Investments
Financing
(Unit: Million THB) (Unit: Million THB)
Financial
-69-
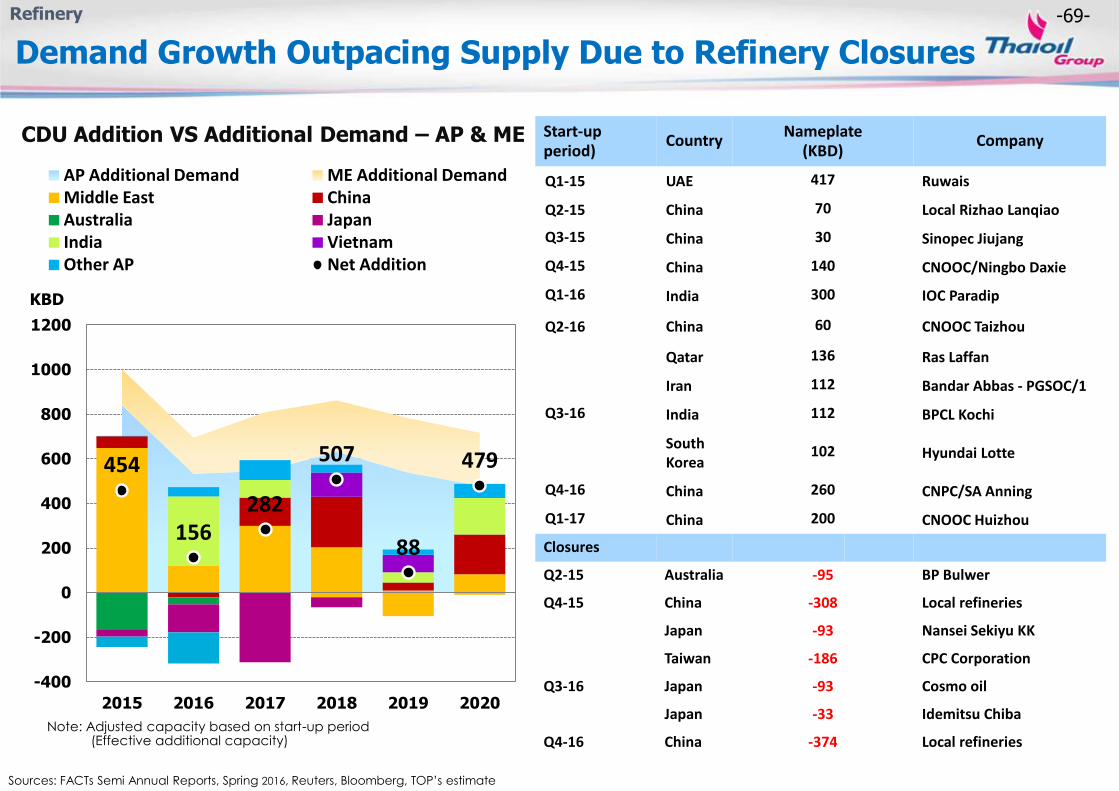
Sources: FACTs Semi Annual Reports, Spring 2016, Reuters, Bloomberg, TOP’s estimate
Note: Adjusted capacity based on start-up period (Effective additional capacity)
CDU Addition VS Additional Demand – AP & ME
454
156 282
507
88
479
-400
-200
0
200
400
600
800
1000
1200
2015 2016 2017 2018 2019 2020
KBD
AP Additional Demand ME Additional Demand Middle East China Australia Japan India Vietnam Other AP Net Addition
Refinery
Demand Growth Outpacing Supply Due to Refinery Closures
Start-up period)
Country Nameplate (KBD)
Company
Q1-15 UAE 417 Ruwais
Q2-15 China 70 Local Rizhao Lanqiao
Q3-15 China 30 Sinopec Jiujang
Q4-15 China 140 CNOOC/Ningbo Daxie
Q1-16 India 300 IOC Paradip
Q2-16 China 60 CNOOC Taizhou
Qatar 136 Ras Laffan
Iran 112 Bandar Abbas - PGSOC/1
Q3-16 India 112 BPCL Kochi
South Korea
102 Hyundai Lotte
Q4-16 China 260 CNPC/SA Anning
Q1-17 China 200 CNOOC Huizhou
Closures
Q2-15 Australia -95 BP Bulwer
Q4-15 China -308 Local refineries
Japan -93 Nansei Sekiyu KK
Taiwan -186 CPC Corporation
Q3-16 Japan -93 Cosmo oil
Japan -33 Idemitsu Chiba
Q4-16 China -374 Local refineries
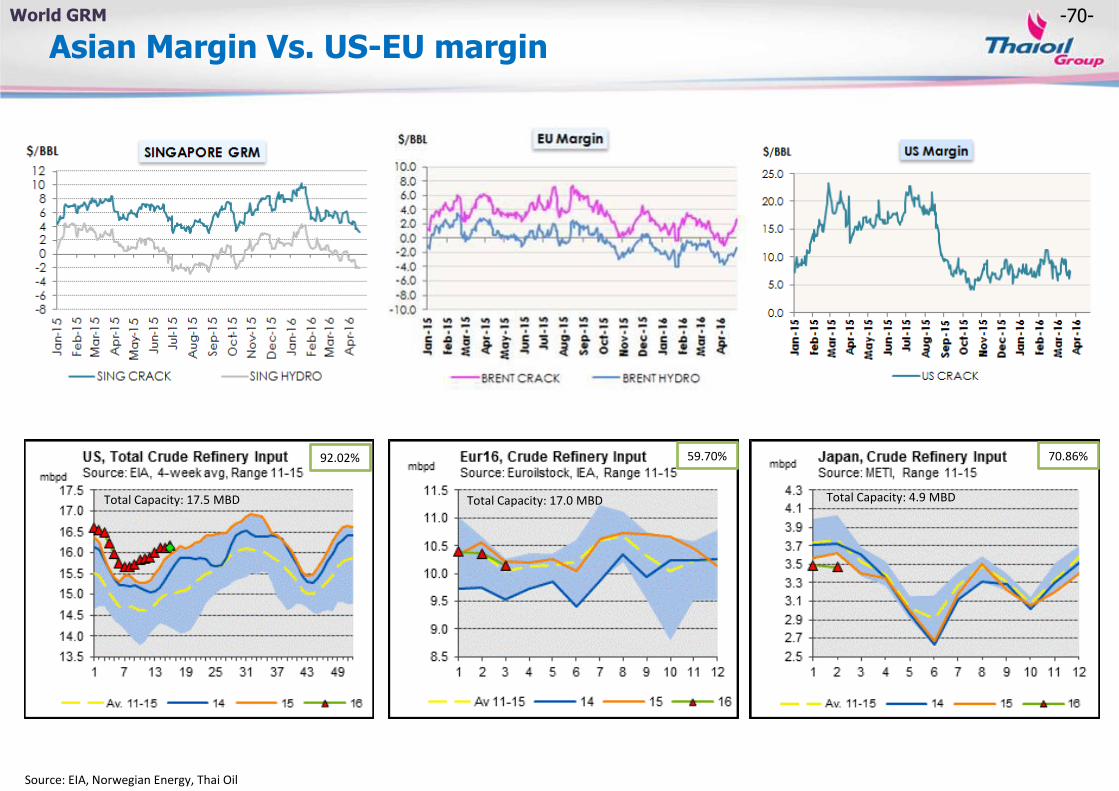
-70-
Asian Margin Vs. US-EU margin
Source: EIA, Norwegian Energy, Thai Oil
World GRM
Total Capacity: 4.9 MBD
92.02% 59.70% 70.86%
Total Capacity: 17.5 MBD Total Capacity: 17.0 MBD
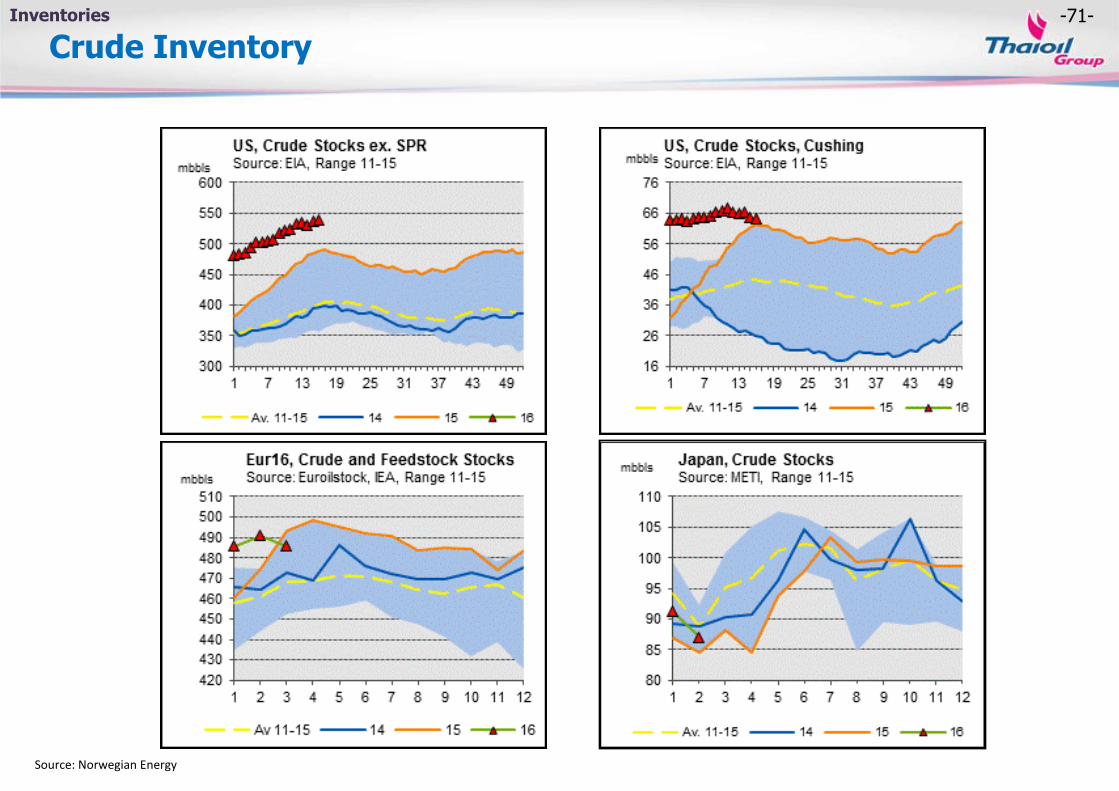
-71-
Crude Inventory
Source: Norwegian Energy
Inventories

-72-
Global Distillate Inventory
Source: Norwegian Energy
Inventories

-73-
Fuel Oil Inventory
Source: Norwegian Energy
Inventories
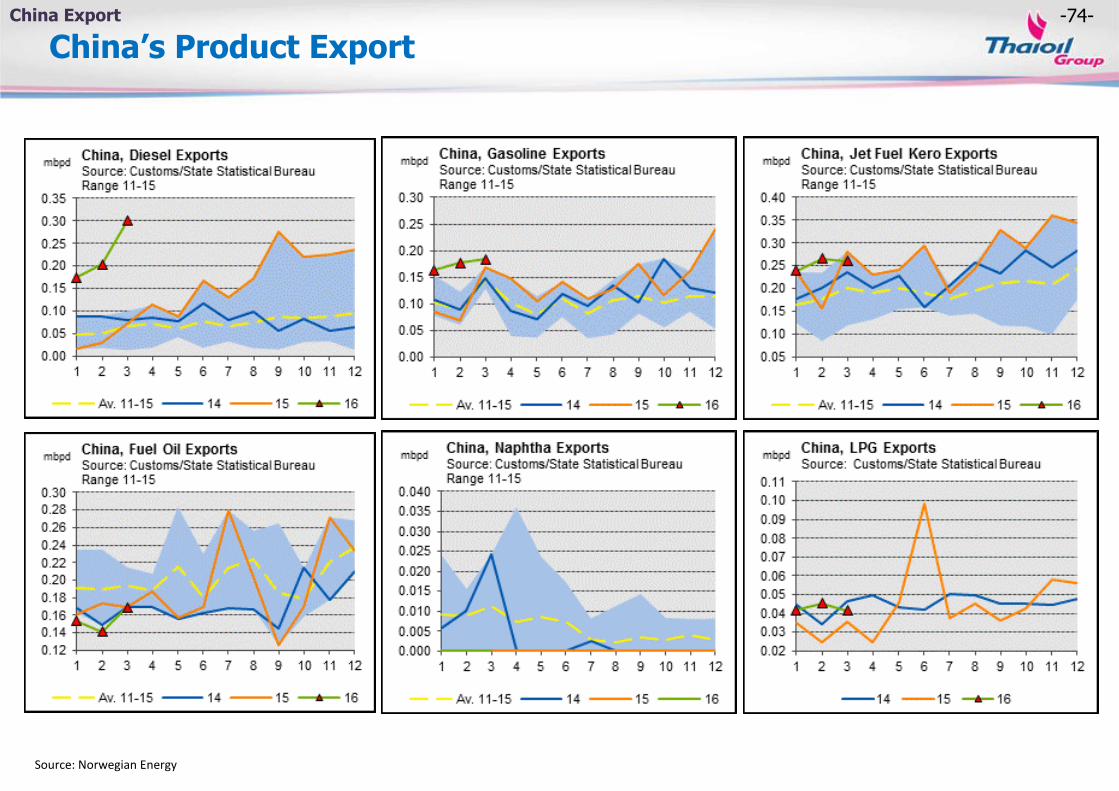
-74-
China’s Product Export
Source: Norwegian Energy
China Export

-75-
Domestic LPG Demand
LPG Demand by Sector
LPG Demand Highlight
• In Q1/2016, LPG demand fell significantly by 10.3%YoY on account of lower usages in all sectors. Most of the decline came from petrochemical sector which its feedstock switching from LPG to Naphtha leading to 20.9%YoY drop in this sector. Furthermore, LPG demand in automobile fell harshly by 16.2%, as a result of fuel switching from LPG to Mogas due to lower price of Mogas.
Outlook for 2016
• LPG demand is expected to dropped by 2.9% YoY pressured by the expectation of more fuel switching from LPG to Mogas, due to low oil price.
• However, the slowdown of LPG demand was expected to be limited by higher usage in industry sector as lower price compared to previous year.
Thailand LPG Demand
Remark : LPG demand includes Petrochemical and own used consumption
Source: EPPO (As of 21 April 2016) *Remark: TOP Estimation

-76-
Domestic Gasoline Demand
Gasoline Demand by Grade
GASOLINE Demand Highlight
• In Q1/2016, Mogas demand jumped sharply by 11.0%YoY to an average 28.22 mml/day. This was mainly due to lower retail prices and higher number of passenger cars since the end of the last year, as a result of avoiding new tax implementation. In fact, the gasohol portion increase significantly to 95.3% of total gasoline as a result of lower proportion of ULG95 from 5.4% to 4.7%, according to more attractive price gap of ULG95 and GSH.
• The level of domestic ethanol demand, in Jan-16, rose significantly by 8.7% YoY from 3.46 mml/day to 3.76 mml/day following the rising of Mogas demand. Additionally, this was also because of higher demand in GSH-91, GSH-95, and E20 backed by increasing in the number of new registered personal car and E20 gas station.
Outlook for 2016
• Mogas consumption is predicted to grow by 7.1% YoY supported by low level of retail price, higher passenger cars and Thai economic recovery.
Thailand Gasoline Demand
Source: DOEB (As of May 2016)

-77-
Domestic Jet Demand
JET-A1 demand and # of flights
JET Demand Highlight
• In Q1/2016, Jet consumption increased significantly by 5.0% over the corresponding period last year mainly owning to booming tourism industry. The expansion in tourism sector was a result of the 31.2%YoY and 8.6%YoY increasing number of Chinese and European tourists, pushing the number of flight movements higher both international and domestic aircrafts.
Outlook for 2016
• Jet demand growth is expected to grow by 4.4%YoY as a result of rapid tourist number growth, especially from China and ASEAN.
Thailand JET-A1 Demand
Source: DOEB, AOT, Department of Tourism (As of May 2016)

-78-
Domestic Gasoil and NGV Demand
NGV Demand
Diesel Demand Highlight
• In Q1/2016, Diesel demand rose gradually by 4.9% YoY as relatively low retail prices boosted the consumption amidst higher number of accumulated commercial vehicles. Nevertheless, demand growth was curbed by the lowest level of export activity, as a result of decelerated global economy.
Outlook for 2016
• Diesel demand in 2016 is expected to expand by 2.2% YoY supported by reducing retail price and Thailand economic improvement.
NGV Demand Highlight
• In Q1/2016, NGV demand declined significantly by 7.5%YoY. This was mainly because of higher NGV retail price, which has increased to hit the record high at 13.5 baht/kg, and lower oil prices which reduced the fuel switching from old cars.
Thailand Gasoil Demand
Source: DOEB (As of May 2016)

-79-
Domestic Fuel Oil Demand
Thailand Fuel Oil Demand by Sector
FUEL OIL Demand Highlight
• In Q1/2016, Fuel Oil consumption jumped rapidly by 28.8%YoY, as a result of sharply increase by 27.3%YoY in transportation demand. Last year, transport activity in Thai fishery was pressured by EU warning of the concerning in illegal, unreported and unregulated fishing (IUU) of Thai seafood industry. Furthermore, the demand in industrial sector also increased by 35.0%YoY, as a result of lower price of fuel oil.
Outlook for 2016
• Fuel oil demand is expected to rise by 14.7%YoY, as a result of higher transportation sector from lower price and reviving in industrial sector.
Thailand Fuel Oil Demand
Source: DOEB (As of May 2016)

-80-
Thank You
Any queries, please contact:
at email: [email protected]
Tel: 662-797-2999 / 662-797-2961
Fax: 662-797-2976


