2015/2/15 1 Effect of intensity of heavy rainfall on infiltration of rainwater into slope through numerical simulations Yohei USUKI Osaka University, Osaka, Japan Kazuhiro ODA Osaka University, Osaka, Japan Keigo KOIZUMI Osaka University, Osaka, Japan Kyohei UMEMURA Osaka University, Osaka, Japan Takayuki ONISHI Osaka University, Osaka, Japan The 14 th International Conference of the International Association for Computer Method and Advances in Geomechanics September 24, 2014 ○ Contents 2. Numerical method for analysis 3. Analytical model 5. Conclusion 4. Analysis results 1. Introduction Four Cases (except for Case-S) Case-S Background 1/4 [Climate in Japan] Slope disasters happen every year In Japan Typhoon Rainy season L It rains frequently over the entire area Background 2/4 [Infiltration of rainwater into slope] Bedrock Surface runoff Infiltration It’s a key component for slope disasters that amount of rainwater infiltrate into slope
Transcript
2015/2/15
1
Effect of intensity of heavy rainfall on infiltration of rainwater into slope through numerical simulations
Yohei USUKI Osaka University, Osaka, JapanKazuhiro ODA Osaka University, Osaka, Japan Keigo KOIZUMI Osaka University, Osaka, JapanKyohei UMEMURA Osaka University, Osaka, JapanTakayuki ONISHI Osaka University, Osaka, Japan
The 14th International Conference of the International Association for Computer Method and Advances in Geomechanics
September 24, 2014
○
Contents
2. Numerical method for analysis
3. Analytical model
5. Conclusion
4. Analysis results
1. Introduction
Four Cases (except for Case-S)
Case-S
Background 1/4 [Climate in Japan]
Slope disasters happen every year In Japan
TyphoonRainy season
L
It rains frequently over the entire area
Background 2/4 [Infiltration of rainwater into slope]
Bedrock
Surface runoff
InfiltrationIt’s a key component for slope disastersthat amount of rainwater infiltrate into slope
2015/2/15
2
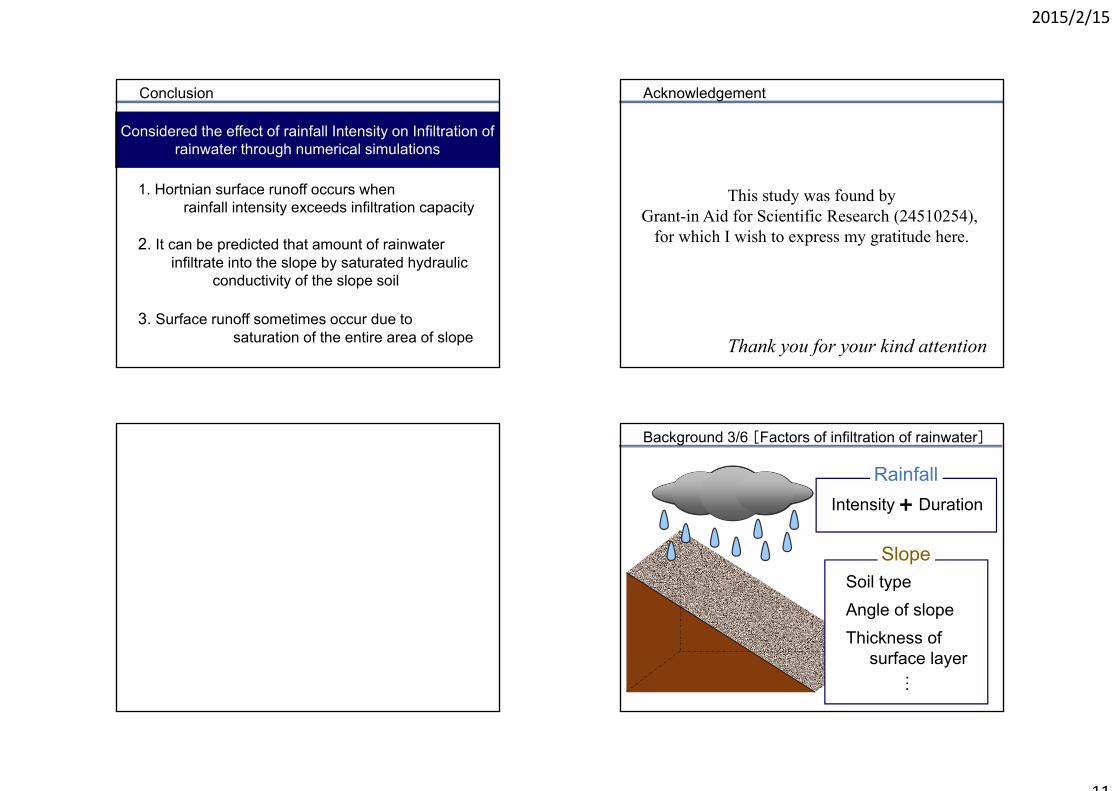
Background 3/4 [Two factors of rainfall]
Bedrock
Intensity DurationRainfall
Long spell of rain
Background 4/4 [Typical heavy rainfall]
High intensityShort duration
Middle intensityLong duration
Time
Inte
nsity
Typical heavy rainfall
Inte
nsity
Time
Localized torrential rain
Purpose
Consideration of effect of rainfall intensity on infiltration of rainwater
Purpose
Plain slope modelChange : Soil types only
Localized torrential rainLong spell of rain
Slope
Rainfall
Contents
1. Introduction
2. Numerical method for analysis
3. Analytical model
5. Conclusion
Four Cases (except for Case-S)
Case-S
4. Analysis results
2015/2/15
3
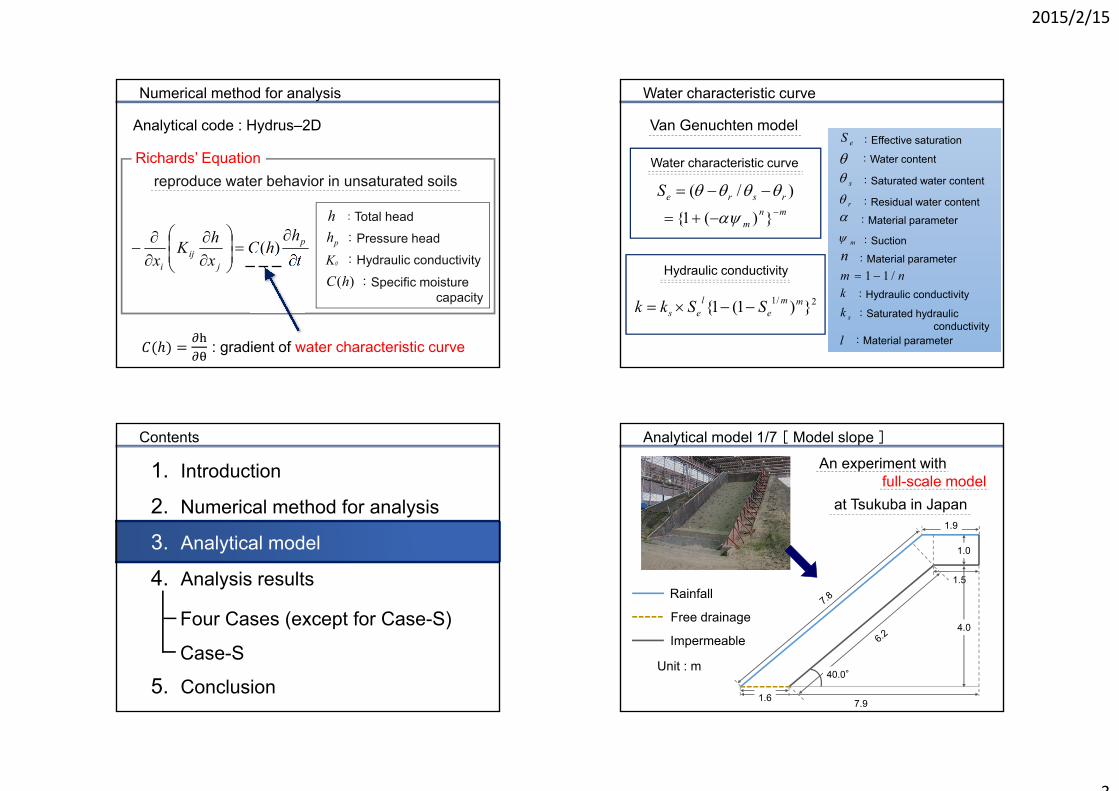
Numerical method for analysis
Analytical code : Hydrus–2D
reproduce water behavior in unsaturated soils
th
hCxhK
xp
jij
i
)(
Richards’ Equation
h :Total head
ph :Pressure head
)(hC :Specific moisturecapacity
ijK :Hydraulic conductivity
: gradient of water characteristic curve
Water characteristic curve
Van Genuchten model
nm /11
eS :Effective saturation
:Water content
s :Saturated water content
r :Residual water content :Material parameter
m :Suctionn :Material parameter
k :Hydraulic conductivity
sk :Saturated hydraulicconductivity
l :Material parameter
2/1 })1(1{ mme
les SSkk
)/( rsreS
Water characteristic curve
Hydraulic conductivity
mnm
})(1{
Contents
1. Introduction
2. Numerical method for analysis
3. Analytical model
5. Conclusion
Four Cases (except for Case-S)
Case-S
4. Analysis results
Analytical model 1/7 [ Model slope ]
Rainfall
Free drainage
Impermeable
Unit : m
1.0
1.9
7.9
1.5
4.0
1.6
40.0°
An experiment withfull-scale model
at Tsukuba in Japan
2015/2/15
4
Analytical model 2/7 [ Model slope ]
1.0
1.9
7.9
1.5
4.0
1.6
40.0°
0.3m each
Observation points(output VWC)
Rainfall
Free drainage
Impermeable
Unit : m
Analytical model 3/7 [ Model slope ]
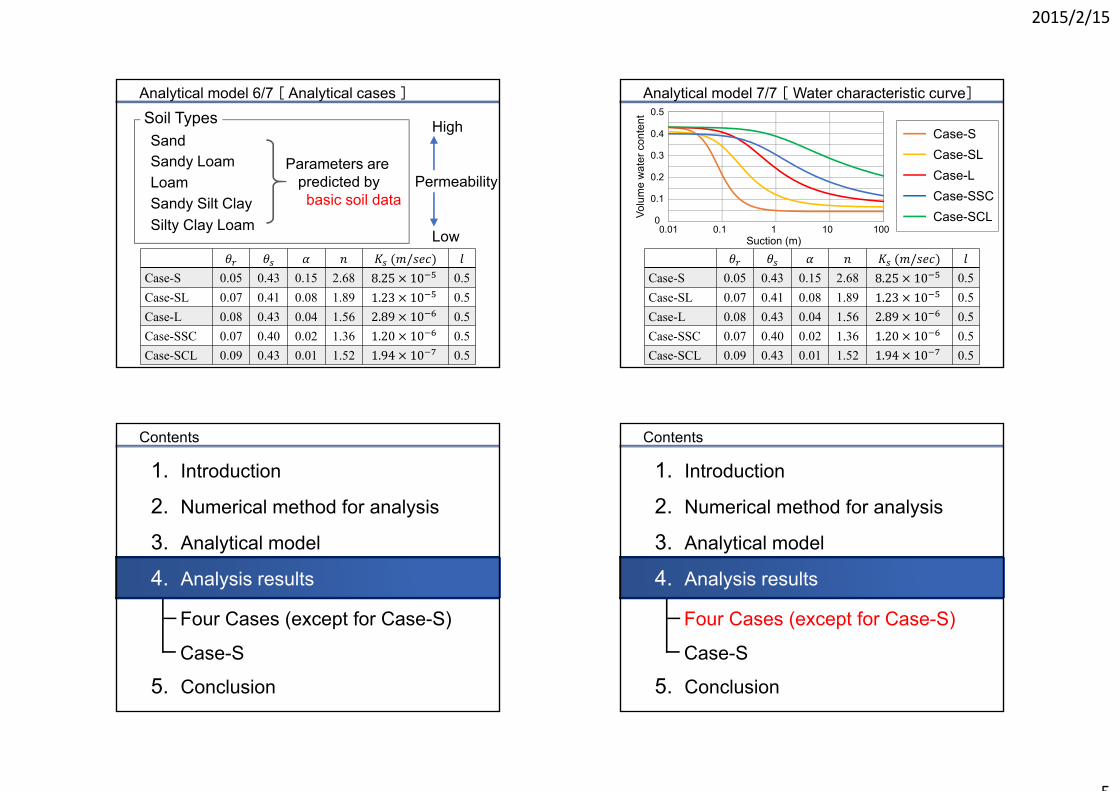
Soil condition : Homogeneous
Initial condition (VWC) : θ 0.15
ChangeSoil type
Fix
Rainfall
Free drainage
Impermeable
Unit : m
1.0
1.9
7.9
1.5
4.0
1.6
40.0°
Analytical model 4/7 [ Localized torrential rain ]