38
Public Attitudes Toward Education in Ontario 2012 OISE Ontario Institute for Studies in Education THE UNIVERSITY OF TORONTO Doug Hart The 18th OISE Survey of Educational Issues
| Date post: | 09-Jun-2018 |
| Category: |
Documents |
| Upload: | phungduong |
| View: | 215 times |
| Download: | 0 times |

Public Attitudes Toward Education in Ontario 2012
OISE Ontario Institute for Studies in EducationThe UniversiTy of ToronTo
Doug Hart
The 18th OISE Survey of Educational Issues

PublISHED by The Ontario Institute for Studies in Education of the University of Toronto (OISE)
Copyright © 2012
Ontario Institute for Studies in Education of the University of Toronto (OISE) 252 Bloor Street West Toronto, Ontario M5V 1V6 416-978-1110
AuTHOrS Doug Hart
EDITOr Carolyn Jongeward
DESIgn Brent Logan www.brentjlogan.com
WEb EDITOr Eileen Thomas
www.oise.utoronto.ca www.oise.utoronto.ca/oise/About_OISE/OISE_Survey
AcknOWlEDgEmEnTS The 2012 OISE Survey was largely funded by the Office of the Dean at the Ontario Institute for Studies in Education of the University of Toronto. Additional financial support was provided by the Ontario Ministry of Education and by the Education Quality and Accountability Office. The Institute for Social Research at York University provided valuable assistance in the design of the questionnaire, and administered the survey. The OISE Survey remains solely responsible for the final design of questions and the interpretation of findings presented in this report.
Doug HartDoug Hart is an Institutional Researcher at the Ontario Institute for Studies in Education of the University of Toronto. He was formerly a Senior Research Officer at OISE and has been involved in a large number of program evaluation projects, primarily in the areas of second language education and professional education. He has been associated with the OISE Survey of Educational Issues since 1978 when it was established by D.W. Livingstone, who directed the Survey until, 2009.

1
Table of Contents <Highlights 2
Introduction 4 Survey Design 4 Acknowledgements 4
Findings 5 General Perceptions of Schools 5 Grades Awarded Schools 5 Satisfaction 7 Confidence 8 School Ratings and Purchasing Private Tutoring 8 Educational Finance 9 Spending and Taxation 9 Satisfaction and Spending 10 Funding for Private Schools 11 Popular Participation in School Governance 13 Popular Influence 13 Policy Initiatives and Student Achievement at the Elementary Level 15 Student Assessment in Elementary and Secondary Schools 16 Testing Elementary School Students 17 Testing Secondary School Students 17 Testing and Curriculum 18 The Education Quality and Accountability Office (EQAO) 19 Awareness of EQAO and Province-wide Testing 19 Perceived Usefulness of EQAO Activities 20 Equity, Accommodations and School Outcomes 22 Accommodations 22 Africentric and Gender-Segregated Schools 23 Africentric Schools 24 Gender-Segregated Schools 25 School Outcomes: Likelihood of Attending University or College by Social Group 26 Equity and Outcomes of Postsecondary Education 27 Education and Economy 28 Educational Outcomes: Personal Employment Experiences 29
Endnotes 32

Public Attitudes Toward Education In Ontario, 2012
2
Highlights> > Most Ontarians continue to hold a generally positive view of schools. General perceptions of Ontario schools have changed little since 2009.
> Fifty-four percent award Ontario schools an A or B grade. In the case of local community schools, almost 60% of the public and 66% of parents award an A or B grade; 81% of parents give an A or B grade to the school their eldest child attends.
> Satisfaction with schools continues at record levels; 65% are somewhat or very satisfied with the school system in general. Satisfaction with the job teachers are doing is slightly higher.
> Confidence ratings of public schools remain comparatively low. Less than half report having a great deal or quite a lot of confidence.
> About a quarter of parents report hiring tutors for their children at some point over the past three years. Parents who have hired tutors are no less positive about public schools than those who have not.
> While a majority continue to want increased spending on schools, support is less widespread than five years ago. Willingness to pay higher taxes for education has held up much better. Currently, most of those supporting higher educational spending are also willing to pay higher taxes to fund the increase.
> Most Ontarians think a 5% cut in funding for publicly funded schools would have significant impact on their operations.
> There is very little support for extending government funding to all faith-based schools but Ontarians remain deeply divided between limiting funding to a single public system, continuing current funding of public and Catholic systems, and extending funding to all private schools.
> Sixty percent think that the public has too little influence over how schools are run; however, less than half show personal willingness to serve on a local school council if asked.
> As in previous OISE Surveys, increased Special Education is the only intervention that ranks with greater parental involvement in terms of improving student achievement at the elementary level. Three-quarters of the public and almost 80% of parents thought increasing the number of special education teachers would have a great deal or quite a lot of impact on achievement. Results are similar regarding getting parents more involved in reading to their children and helping with homework.
> Over 60% think reducing class size in the early grades of elementary school will substantially increase student achievement. This is well below the 75% who put their faith in greater numbers of special education teachers. But it is well above the approximately 40% who think universal junior kindergarten and province-wide testing will make a great deal or quite a lot of difference to student progress.

The 18th OISE Survey of Educational Issues
3
> About half (49%) think lengthening initial teacher education will have a substantial impact on student achievement at the elementary level. However, this rises to 63% if the amount of practice teaching that teachers-in-training do before getting their teaching certificate is increased.
> Almost two-thirds support province-wide testing in elementary schools in some form. Just over half (53%) favour the current program of every student testing; a further 11% would support testing only a sample of students.
> Province-wide testing at the secondary level continues to enjoy strong support (70%). However, most want teachers’ assessments (67%), not province-wide test results, to determine students’ grades.
> A large majority (75%) think that testing does cause teachers to devote at least somewhat more attention to subjects tested.
> Less than a third of the public (29%) and less than half of parents (42%) could identify the main role of EQAO — to conduct province-wide tests and provide information on student achievement. However, 45% of the public and 63% of parents reported that they had read or heard about province-wide test results over the past year. Over 70% of the public and 80% of parents correctly identified English language skills as a tested subject; views were even more accurate in the case of mathematics - over 80% for the public and 90% for parents. Less than 40% mistakenly identified other subjects as tested when they were not.
> Sixty-four percent agreed that EQAO testing helps keep the educational system account- able to parents and taxpayers. Two-thirds agreed that province-wide testing can be used to improve the quality of education in Ontario.
> About half support accommodations of religious minority students that include not scheduling tests on religious holidays, allowing students to wear religious symbols at school and allowing students to meet learning objectives in culturally appropriate ways. A little over a third (38%) would support prayer sessions during school hours but only 22% would allow separate classes for boys and girls.
> Few (23%) support the creation of Africentric alternate schools. There is similarly little support for gender segregated schools (27%). This suggests that there is a general public antipathy to what are perceived as segregated schools for any social group.
> A large majority (74%) of the public see students from low-income families as less likely to continue to university or college than those from high income homes. Just over half (54%) now see Aboriginal students as disadvantaged compared to white students. In contrast, only 24% think Black students are less likely than white students to continue to college or university. Few (10%) see Muslim students as disadvantaged compared to Christians.
> There is no consensus that we can educate ourselves back to full employment. About half think that there won’t be enough jobs no matter how much education and training people obtain.
> Almost half think (erroneously) that a university graduate is as likely to be unemployed as a high school graduate.
> Just under 30% of working respondents report educational credentials above entry level requirements for their positions. Twenty percent think they are overqualified for their jobs in terms of their education.

Public Attitudes Toward Education In Ontario, 2012
4
Introduction>The OISE Surveys of Educational Issues have been conducted regularly since 1978. Each survey provides a snapshot of public opinion at a particular moment in time; but taken together the surveys are akin to time lapse photography, revealing how public opinion has responded to changing circumstances.i The Principal Investigators for the 2012 Survey are Ben Levin, Professor, Department of Leadership, Adult and Higher Education, and Doug Hart, Institutional Researcher, both at the Ontario Institute for Studies in Education of the University of Toronto.
Opinion polls are not referendums on the policy issues they address. The role of the OISE Survey is to provide information on public predispositions (often on matters to which many respondents may have given little thought), to inform both the conduct of public discussion and decision-making on policy. In particular, the Survey is an attempt to level the playing field between well and poorly resourced groups by providing a common body of poll results from a nonpartisan source as a basis for public debate.
Each Survey Report presents trends on basic dimensions of public attitudes toward educa-tion, such as satisfaction with schools and the job teachers are doing, views on the adequacy of funding for schools, and views on aspects of school governance. Each survey also contains sections on currently topical issues. Full reports on the findings of all OISE surveys as well as an archive of the respective questionnaires and data sets can be found at the survey website: www.oise.utoronto.ca/oise/About_oise/oise_survey.
Survey Design
The 2012 OISE Survey involved a representative random sample of 1016 adults, 18 years of age and over, who were interviewed by telephone in their residences across Ontario between December 2011 and March 2012. The survey was administered by the Institute for Social Research at York University. Respondents entered the survey through a two stage sam-pling procedure. Random digit dialling procedures were used to produce a sample of phone numbers. Within the households contacted, the adult resident was selected who was next to have a birthday. A response rate of 35.5% was obtained. As in previous OISE Surveys, the 2012 sample of respondents has been weighted to remedy slight imbalances in age and sex groups. The weighted sample continues to somewhat under-represent those with less than high school com-pletion, and over-represents those with post-secondary education. Results should be accurate to within three to four percentage points, 95% of the time based on estimated sampling error.ii
The 18th OISE Survey of Educational Issues
5
General Perceptions of Schools
> Most Ontarians continue to hold a generally positive view of schools. General perceptions of Ontario schools have changed little since 2009.
> Fifty-four percent award Ontario schools an A or B grade. In the case of local community schools, almost 60% of the public and 66% of parents award an A or B grade; 81% of parents give an A or B grade to the school their eldest child attends.
> Satisfaction with schools continues at record levels; 61% are somewhat or very satisfied with the school system in general. Satisfaction with the job teachers are doing is slightly higher.
> Confidence ratings of the public schools remain comparatively low. Less than half report having a great deal or quite a lot of confidence.
> About a quarter of parents report hiring tutors for their children at some point over the past three years. Parents who have hired tutors are no less positive about public schools than those who have not.
grades Awarded Schools
Just over half of the public (54%) award Ontario schools an A or B grade for the quality of their work; 58% offer similar ratings for schools in their local communities (see Table 1.1). These percentages are higher among parents with children in public or Catholic schools - 59% for provincial schools and 66% for local schools. When asked about the school their eldest child attends, public school parents are considerably more positive – almost one in three (31%) give these schools an A grade; 50% a B grade. Failing grades are rare for Ontario or local schools; most not assigning an A or B grade, opt for Cs. Grades assigned to community schools are basically unchanged since 2009 (see Table 1.2).
Ratings of Ontario schools and local community schools are similar to those obtained nationally by the Canadian Teachers’ Federation’s National Issues in Education Poll in 2010. In the CTF poll 51% gave their provincial schools an A or B grade compared to 63% for their community schools. Both national and Ontario ratings of community schools are notably higher than American ratings obtained by the Phi Delta Kappa Gallup Poll. In 2011, 51% of American respondents awarded their community schools an A or B grade.iii
Findings <

Public Attitudes Toward Education In Ontario, 2012
6
A
B
C
D
Fail
Not stated
Total
count
Schools in Your Community
Public Parents
1984* 2007** 2009 2012 2007** 2009 2012
% % % % % % %
A 10 5 10 14 18 11 18
B 38 40 45 44 47 50 48
C 26 32 23 23 22 22 21
D 5 8 6 6 6 7 6
Fail 4 4 2 3 2 3 2
Not stated 17 11 14 10 4 7 5
Total 100 100 100 100 99 100 100
count 753 747 1001 1016 206 266 284
*Survey question: Students are often given the grades A, B, C, D, or Fail to indicate the quality of their work. If the public schools ... were graded in the same way, what grade would you give them: A, B, C, D or Fail?
**Excludes home-schooled.
Sources:
*Speaking Out 1984 CEA Poll
**CEA-OISE Survey of Educational Issues, (Jan./Feb.) 2007
Table 1.1 Grading Public Schools*
Table 1.2 Grades Over Time
Public
In Ontario
%
8
46
27
7
3
9
100
1016
Parents
In Ontario
%
7
52
24
5
3
8
99
284
In Your Community
%
14
44
23
6
3
10
100
1016
In Your Community
%
18
48
21
6
2
5
100
284
School your eldest child attends**
%
31
50
13
3
1
1
99
281

The 18th OISE Survey of Educational Issues
7
Satisfaction
The OISE Survey has tracked satisfaction with the school system in general for almost three decades. Currently satisfaction among both the public and parents is at record levels (65%), reflecting a dramatic recovery from the years of the Harris government (see Table 1.3). Since 2002, the proportion indicating satisfaction with schools has increased from 43% to 65%. Over the same period, satisfaction with teachers’ work has remained generally high. In fact, ratings for the school system in general have only approached those of teachers in the past five years (see Table 1.4).
Public Parents
Satisfied with Satisfied with Satsified with job teachers Satisfied with job teachers schools are doing schools are doing
% % % %
Very satisfied 15 23 18 27
Somewhat satisfied 50 47 59 49
Neither 8 8 5 6
Somewhat dissatisfied 15 11 12 13
Very dissatisfied 5 3 6 1
Not stated 7 9 1 4
Total 100 101 101 100
count 1016 1016 284 284
*Survey questions: How satisfied you are with the current situation in elementary and high schools in this province? First, how satisfied are you with the school system in general? How satisfied are you with Ontario elementary and high schools when it comes to the job teachers are doing?
Table 1.3 Amount of Satisfaction With School System*
Satisfied with job Satisfied with schools teachers are doing Year % % Count
1980 51 1108 1982 55 1050 1986 42 1042 1988 36 1011 1990 47 1032 1996 50 1000 1998 44 62 1007 2000 44 63 1002 2002 43 67 1054 2004 56 69 1002 2007 61 68 1001 2009 63 67 747 2012 65 70 1016
Table 1.4 Satisfaction Over Time

Public Attitudes Toward Education In Ontario, 2012
8
confidence
Despite the improvement in satisfaction levels and, more recently, grades given to schools, public confidence in schools remains relatively low; 44% in 2012 (see Table 1.5). The contrast with satisfaction levels suggests that in the midst of positive views of the current situation, uncertainty about future directions persists. That said there is evidence of some growth in confidence over the past five years (see Table 1.6).
School ratings and Purchasing Private Tutoring
In 2012 and the previous three surveys, we asked parents of public school students whether they had purchased supplementary tutoring services for their child(ren) in the past three years. In each survey about a quarter of public school parents reported doing so. Do parents purchase tutoring services as a supplement to public schooling or to compensate for perceived failings of the system? Comparing school ratings of parents who purchased tutoring services to those who did not, suggests that both groups hold mainly positive views of publicly funded schools in their communities and schools their children attend (see Table 1.7). Differences in ratings of community schools found in 2007 for those purchasing tutoring have not reappeared in subsequent years.
Public Parents
% %
Great deal 17 19
Quite a lot 27 29
Some 41 36
Very little 11 12
None at all 2 2
Not stated 3 2
Total 100 100
count 1016 284
% indicating a great deal or quite a lot of confidence
% Count
2004 38 1002
2007 36 1001
2009 37 747
2012 44 1016
*Survey question: How much respect and confidence do you have in Ontario public schools?
Table 1.5 Amount of Confidence* Table 1.6 Confidence in Schools Over Time
% awarding A or B Grade to Community Schools Purchased Tutoring 2007 2009 2012 % Count % Count % Count Yes 40 53 64 47 68 74 No 59 168 64 129 65 208 % awarding A or B Grade to school eldest child attents Yes 74 58 77 47 77 74 No 73 171 75 124 83 208
Table 1.7 Grades Awarded Local Schools by Whether Parents Purchased Tutoring for Children
The 18th OISE Survey of Educational Issues
9
Educational Finance > While a majority continue to want increased spending on schools, support is less widespread than five years ago. Willingness to pay higher taxes for education has held up much better. Currently, most of those supporting higher educational spending are also willing to pay higher taxes to fund the increase.
> Most Ontarians think a 5% cut in funding for publicly funded schools would have significant impact on their operations.
> There is very little support for extending government funding to all faith-based schools but Ontarians remain deeply divided between limiting funding to a single public system, continuing current funding of public and Catholic systems, and extending funding to all private schools.
Spending and Taxation
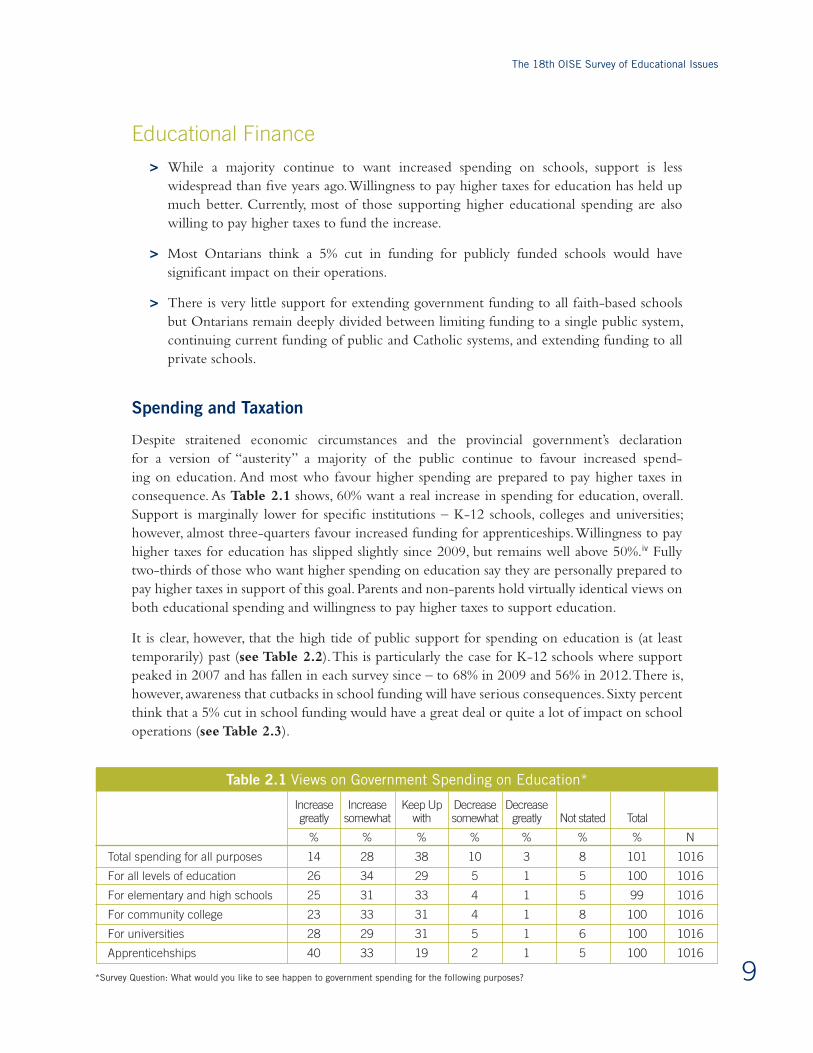
Despite straitened economic circumstances and the provincial government’s declaration for a version of “austerity” a majority of the public continue to favour increased spend-ing on education. And most who favour higher spending are prepared to pay higher taxes in consequence. As Table 2.1 shows, 60% want a real increase in spending for education, overall. Support is marginally lower for specific institutions – K-12 schools, colleges and universities; however, almost three-quarters favour increased funding for apprenticeships. Willingness to pay higher taxes for education has slipped slightly since 2009, but remains well above 50%.iv Fully two-thirds of those who want higher spending on education say they are personally prepared to pay higher taxes in support of this goal. Parents and non-parents hold virtually identical views on both educational spending and willingness to pay higher taxes to support education.
It is clear, however, that the high tide of public support for spending on education is (at least temporarily) past (see Table 2.2). This is particularly the case for K-12 schools where support peaked in 2007 and has fallen in each survey since – to 68% in 2009 and 56% in 2012. There is, however, awareness that cutbacks in school funding will have serious consequences. Sixty percent think that a 5% cut in school funding would have a great deal or quite a lot of impact on school operations (see Table 2.3).
Increase Increase Keep Up Decrease Decrease greatly somewhat with somewhat greatly Not stated Total
% % % % % % % N
Total spending for all purposes 14 28 38 10 3 8 101 1016
For all levels of education 26 34 29 5 1 5 100 1016
For elementary and high schools 25 31 33 4 1 5 99 1016
For community college 23 33 31 4 1 8 100 1016
For universities 28 29 31 5 1 6 100 1016
Apprenticehships 40 33 19 2 1 5 100 1016
*Survey Question: What would you like to see happen to government spending for the following purposes?
Table 2.1 Views on Government Spending on Education*

Public Attitudes Toward Education In Ontario, 2012
10
Willingness to Favour increase in pay more taxes Year spending for schools for education Count % % 1980 38 1108 1982 37 1050 1984 45 45 1046 1986 50 1042 1988 61 48 1011 1990 51 49 1032 1992 55 1000 1994 53 51 1052 1996 47 50 1000 1998 61 49 1007 2000 71 52 1002 2002 70 55 1054 2004 73 57 1002 2007 76 62 747 2009 68 62 1001 2012 56 57 1016
%
Great deal 38
Quite a lot 22
Some 22
Very little 9
None at all 3
Not stated 7
Total 101
count 1016
*Survey question: If government funding for public schools were cut by 5%, how much impact would this have on school and classroom activities?
*Survey question: Would you be willing to pay more taxes to support education in Ontario?
Table 2.2 Spending Preferences and Willingness to Pay More Taxes for Education Over Time
Table 2.3 Impact of 5% cut in Government Funding*
Satisfaction and Spending
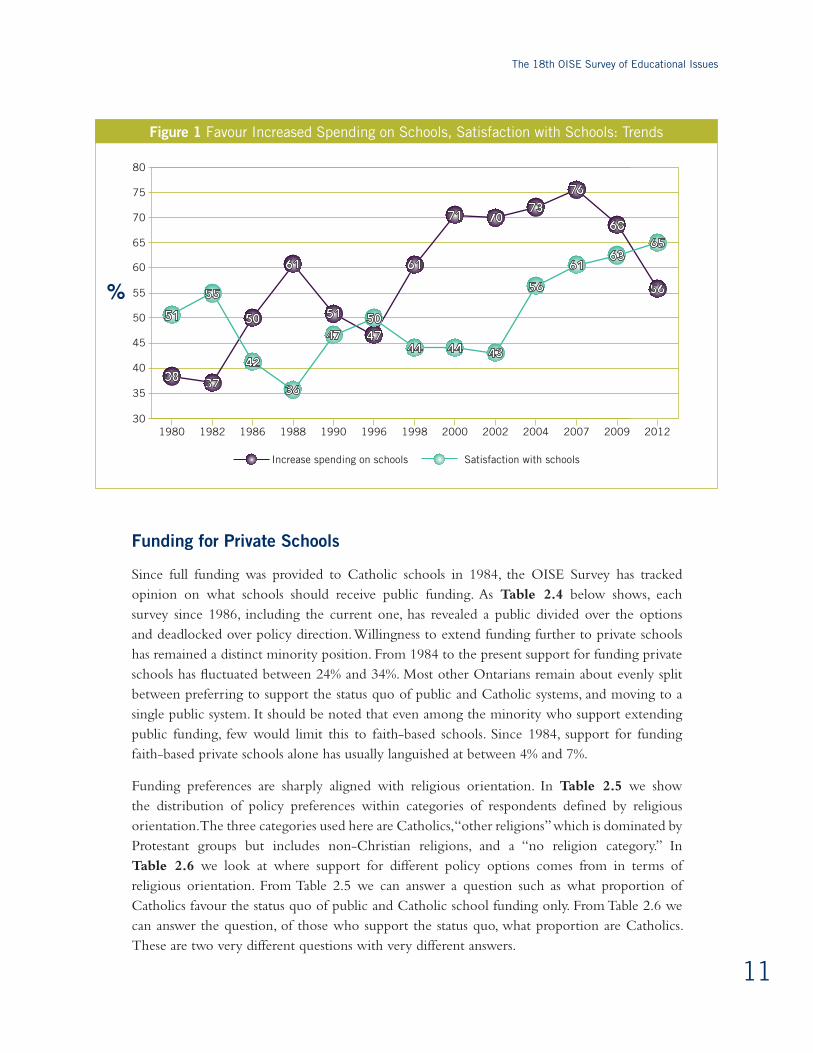
Over the past three decades, preference for higher spending on schools and satisfaction with schools has generally moved in opposite directions (see figure 1). Between 1982 and 1988, satisfaction declined while the proportion favouring higher spending increased. Both trends then reversed themselves with satisfaction peaking in 1996 while the percentage favouring increased spending bottomed out. The pattern after 1996 is more complex. From 1996 to 2002, satisfaction declined though much less sharply than in the early period. At the same time support for higher spending increased sharply until 2000, and then levelled off. From 2002 to 2007, both satisfaction and spending preferences increased together. After 2007, however, satisfaction continues to grow while support for increased spending on schools drops off.
While opinion trends on increasing spending and satisfaction have moved in opposite directions, this does not reflect a tendency for those dissatisfied with schools to favour higher spending. Rather in an environment where dissatisfaction is more widespread, both the satisfied and the unsatisfied are more likely to favour increased spending – and vice versa. The correlation is thus environmental not individual.
The 18th OISE Survey of Educational Issues
11
Funding for Private Schools
Since full funding was provided to Catholic schools in 1984, the OISE Survey has tracked opinion on what schools should receive public funding. As Table 2.4 below shows, each survey since 1986, including the current one, has revealed a public divided over the options and deadlocked over policy direction. Willingness to extend funding further to private schools has remained a distinct minority position. From 1984 to the present support for funding private schools has fluctuated between 24% and 34%. Most other Ontarians remain about evenly split between preferring to support the status quo of public and Catholic systems, and moving to a single public system. It should be noted that even among the minority who support extending public funding, few would limit this to faith-based schools. Since 1984, support for funding faith-based private schools alone has usually languished at between 4% and 7%.
Funding preferences are sharply aligned with religious orientation. In Table 2.5 we show the distribution of policy preferences within categories of respondents defined by religious orientation. The three categories used here are Catholics, “other religions” which is dominated by Protestant groups but includes non-Christian religions, and a “no religion category.” In Table 2.6 we look at where support for different policy options comes from in terms of religious orientation. From Table 2.5 we can answer a question such as what proportion of Catholics favour the status quo of public and Catholic school funding only. From Table 2.6 we can answer the question, of those who support the status quo, what proportion are Catholics. These are two very different questions with very different answers.
Figure 1 Favour Increased Spending on Schools, Satisfaction with Schools: Trends
30
35
40
45
50
55
60
65
Satisfaction with schools
70
80
75
1980 19861982 1988 1990 1996 1998 20022000 2004 2007 20122009
Increase spending on schools
%
38 37
50
61
56
51
47
61
71 7073
76
68
42
47
36
44 44
5051
43
55 56
6163
65

Public Attitudes Toward Education In Ontario, 2012
12
Few Catholics (15%) favour a single public system (see Table 2.5); over half (56%) support the status quo of public and Catholic school systems while most others favour extending funding to all private schools (not just religious schools). In contrast, a majority (59%) of those claiming no religion prefer a single public system while only 22% support the status quo, and only 17%, the extension of funding to private religious or all private schools. Those whose religious orientation is other than Catholic are divided between a single public system (39%) and the status quo (31%); most others would extend funding to all private schools.
Public/Catholic Public and and all religious Public only Catholic as now and/or all private** Don’t know
Year % % % % % Count
1984 21 51 26 2 100 1046
1986 28 40 30 2 100 1042
1988 24 41 28 8 101 1011
1992 33 36 28 3 100 1000
1994 36 31 28 5 100 1052
1996 38 33 27 3 101 1000
1998 26 39 31 4 100 1007
2000 31 35 31 3 100 1002
2002 29 37 34 2 102 1054
2004 30 40 26 3 99 1002
2009 35 36 27 2 100 1001
2012 37 36 24 3 100 1016
*Survey question: What schools do you think should be given government funding, provided that they meet province-wide standards?
**Respondents were offered the options of funding, in additional to public and Catholic schools, either all religious private schools or all private schools. The option of funding only all religious schools rather than all private schools was chosen by 6% of respondents in 2012; three times as many respondents would fund all private schools.
Table 2.4 Views on Which Schools Should Receive Government Funding*
Religious Orientation
Other No Not Catholic Religions Religion Stated All
Only Public schools 15 39 59 30 37
Public and Catholic schools as now 56 31 22 48 37
Public, Catholic and private RELIGIOUS schools 5 7 3 4 6
Public, Catholic and ALL private schools 21 19 14 9 18
Not stated 4 3 1 9 3
Total 100 100 100 100 100
count 286 466 241 23 1016
Table 2.5 Views on Public Funding by Relgious Orientation
The 18th OISE Survey of Educational Issues
13
Religious Orientation
Other No Not Catholic Religions Religion stated Total Count
Only Public schools 11 49 38 2 100 376
Public and Catholic schools as now 43 39 15 3 100 371
Public, Catholic and private RELIGIOUS schools 23 61 14 2 100 56
Public, Catholic and ALL private schools 32 48 18 1 100 182
Not stated 37 47 10 7 100 31
All 28 46 24 2 100 1016
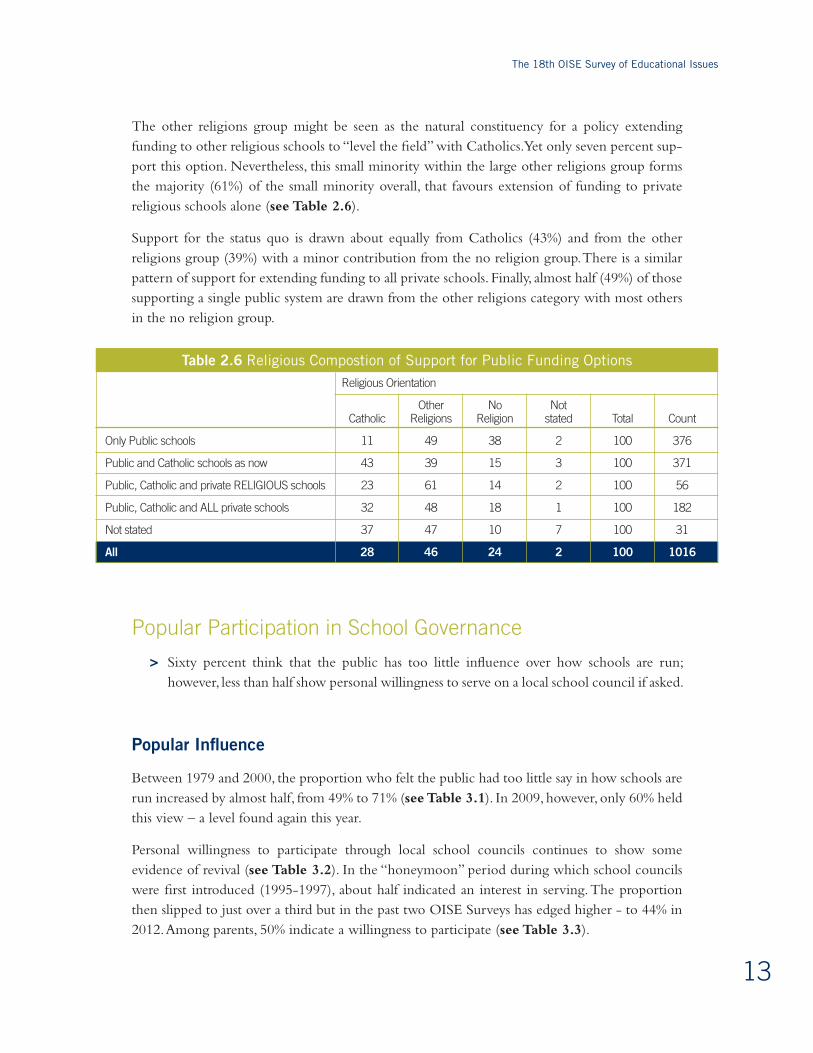
Table 2.6 Religious Compostion of Support for Public Funding Options
The other religions group might be seen as the natural constituency for a policy extending funding to other religious schools to “level the field” with Catholics. Yet only seven percent sup-port this option. Nevertheless, this small minority within the large other religions group forms the majority (61%) of the small minority overall, that favours extension of funding to private religious schools alone (see Table 2.6).
Support for the status quo is drawn about equally from Catholics (43%) and from the other religions group (39%) with a minor contribution from the no religion group. There is a similar pattern of support for extending funding to all private schools. Finally, almost half (49%) of those supporting a single public system are drawn from the other religions category with most others in the no religion group.
Popular Participation in School Governance
> Sixty percent think that the public has too little influence over how schools are run; however, less than half show personal willingness to serve on a local school council if asked.
Popular Influence
Between 1979 and 2000, the proportion who felt the public had too little say in how schools are run increased by almost half, from 49% to 71% (see Table 3.1). In 2009, however, only 60% held this view – a level found again this year.
Personal willingness to participate through local school councils continues to show some evidence of revival (see Table 3.2). In the “honeymoon” period during which school councils were first introduced (1995-1997), about half indicated an interest in serving. The proportion then slipped to just over a third but in the past two OISE Surveys has edged higher - to 44% in 2012. Among parents, 50% indicate a willingness to participate (see Table 3.3).

Public Attitudes Toward Education In Ontario, 2012
14
Don’t know/ Too much Enough say Too little not stated Total
% % % % % Count
1979** 6 41 49 5 101 758
1984** 6 32 53 10 101 753
1990 6 29 60 5 100 1032
1994 5 25 64 6 100 1070
1996 7 23 64 6 100 1000
2000 7 16 71 7 101 1002
2002 8 22 68 3 101 1054
2004 7 22 66 5 100 1002
2007 8 20 66 5 99 747
2009 10 22 60 8 100 1001
2012 8 24 60 8 100 1016
Table 3.1 Amount of Public Control Over Education*
*Survey question: Do you feel the public has, overall, too little, about the right amount, or too much control over how schools are run?
**From 1979 and 1984 Canadian Education Association (CEA) polls of Canadian opinion on education.
*Survey question: If asked today, would you or would you not serve on a local school parent council?
Definitely Probably Probably not Definitely not Not stated Total
% % % % % % N
1994 17 32 28 22 2 101 1070
1996 18 34 23 21 3 99 1000
2000 12 28 27 29 4 100 1002
2002 12 24 34 29 2 101 1054
2004 12 24 34 28 3 100 1002
2007 14 27 32 25 2 100 747
2009 14 29 31 25 2 100 1001
2012 16 28 32 21 3 100 1016
Table 3.2 Willingness to Serve on a Local School Parent Council Over Time
Public Parents
% %
Definitely 16 22
Probably 28 28
Probably not 32 34
Definitely not 21 13
Not stated 3 4
Total 100 101
count 1016 284
Table 3.3 Willingness to Serve on a Local School Parent Council*
The 18th OISE Survey of Educational Issues
15
Policy Initiatives and Student Achievement at the Elementary Level
> As in previous OISE Surveys, increased Special Education is the only intervention that ranks with greater parental involvement in terms of improving student achievement at the elementary level. Three-quarters of the public and almost 80% of parents thought increasing the number of special education teachers would have a great deal or quite a lot of impact on achievement. Results are similar regarding getting parents more involved in reading to their children and helping with homework.
> Over 60% think reducing class size in the early grades of elementary school will substantially increase student achievement. This is well below the 75% who put their faith in greater numbers of special education teachers. But it is well above the approximately 40% who think universal junior kindergarten and province-wide testing will make a great deal or quite a lot of difference to student progress.
> About half (49%) think lengthening initial teacher education will have a substantial impact on student achievement at the elementary level. However, this rises to 63% if the amount of practice teaching that teachers in training do before getting their teaching certificate is increased.
In 2009 and again this year, we have revived a question initially asked in 1998 about factors that might improve student achievement at the elementary level. The list of factors offered respon-dents in 1998 included recent and future areas of policy intervention. EQAO province-wide testing was then two years old, mandated reduction of class size in the early elementary grades was six years in the future (2004), mandated universal junior kindergarten, 12 years away (2010), and the recently announced lengthening of teacher education programs, even further in the future (announced 2012 for implementation in 2015). Table 4.1 presents public assessments at different points in time of the likely impact of initiatives in these areas on the achievement of elementary students.
Since we first asked our question in 1998, two factors have anchored public assessments of how to improve elementary students’ achievement. The first is greater parental involvement, the second, special education. At each administration, three-quarters or more have cited these factors as likely to have a great deal or quite a lot of impact on student achievement. They have become, in effect, the benchmark against which other factors can be assessed.
Province-wide testing enjoys widespread public support (see section below); however, the belief that it has a major impact on achievement is much less widespread. In 2012 only 40% thought it had a great deal or quite a lot of impact on achievement. Parents and non-parents held similar views. Reducing class sizes in the first years of elementary school is much more widely (62%) viewed as improving student achievement. Moreover, in contrast to views on testing, parents offer more positive views than non-parents on the impact of class size.

Public Attitudes Toward Education In Ontario, 2012
16
Public assessments of the likely impact of universal junior kindergarten on achievement parallel those for testing. In 2012, 42% thought this initiative would have a substantial impact on achieve-ment. Parental views appear, however, slightly more positive. Of course, unlike testing, there has been little opportunity yet for the impact of universal JK to be felt.
Public views in 2012 on lengthening teacher education programs are unchanged from 2000 when the question was first asked. Just under half think that graduating teachers from a longer program would have a great deal or quite a lot of impact on student achievement. However, when the issue is not simply lengthening the program but increasing the amount of practice teaching by teacher candidates, 63% think this would have a substantial effect on achievement. Again, this is similar to what we found in 2000.
% indicating great deal or quite a lot
Elementary Public Parents school parents
1998 2000 2009 2012 2012 2012
% % % % % %
Getting parents more involved in reading to their children and helping with homework. 83 84 79 76 75 75
Providing more special education teachers to help students with learning difficulties. 76 79 79 75 79 81
Reducing class sizes in the first few years of elementary school. 58 68 66 62 69 70
Using province-wide tests to measure how students are doing. 50 48 48 40 39 39
Starting all children in junior kindergarten. 46 48 48 42 49 52
Lengthening teacher education programs from one to two years 49 49 53 56
Increasing the amount of practice teaching that teachers in training do before getting their teaching certificate 59 63 63 65
count 1007 1002 779 826 284 215
Table 4.1 Ways to Improve Elementary Student Achievement*
*Survey question: There are many ideas for how we can help Ontario elementary students do better at school. How much do you think each of the following would improve student achievement?
Note: List in 1998 and 2000 included additional items. In 2000 the item on lengthening teacher education programs did not specify two years.
Student Assessment in Elementary and Secondary Schools
> Almost two-thirds support province-wide testing in elementary schools in some form. Just over half (53%) favour the current program of every student testing; a further 11% would support testing only a sample of students.
> Province-wide testing at the secondary level continues to enjoy strong support (70%). However, most want teachers’ assessments (67%), not province-wide test results, to determine students’ grades.

The 18th OISE Survey of Educational Issues
17
Elementary Public Public Parents parents
2009 2012 2012 2012
% % % %
Province-wide tests should not be used in elementary schools 11 12 12 13
A sample of students should be tested 11 11 12 13
Every student should be tested 54 53 54 54
Not sure about this/Not stated 24 23 22 20
Total 100 99 100 100
count 1001 1001 284 215
Table 5.1 Views on Province-wide Testing for Elementary School Students*
*Survey question: Which of the following is closest to your view about province-wide testing for elementary school students?
> A large majority (75%) think that testing does cause teachers to devote at least somewhat more attention to subjects tested.
Testing Elementary School Students
While there is no consensus that province-wide testing has a strong impact on student achieve-ment, nevertheless a majority would continue testing in elementary schools (see Table 5.1). Just over half (53%) favour the current program of every student testing; a further 11% would support testing only a sample of students (the option supported by the Elementary Teachers Federation of Ontario). An exceptionally high proportion of respondents (23%) indicated they were unsure or could not state an opinion on this issue. Views on province-wide testing at the elementary level are unchanged from 2009. There are no substantial differences in views between parents and non-parents.
Testing Secondary School Students
Over the past two and a half decades, successive OISE Surveys have documented continuing strong public support for testing secondary level students (see Table 5.2). In 2012, 70% of the public and two-thirds of parents thought province-wide tests should be used to assess the perfor-mance of each high school student. The percentage taking this position has never fallen below 60%. Yet beneath the consensus on every student testing, there has been a significant change in views on what test results should be used for.
In 1994, the public was almost evenly divided on the issue of whether high school students’ final grades should mainly reflect their teachers’ assessments rather than the results of province-wide tests (see Table 5.3). By 2007, however, the balance had shifted; two-thirds now agreed that teachers’ assessments should prevail while only 25% disagreed. In 2009 and again this year, we find the same pattern. The majority view has come to accord with actual practice in the use of province-wide test results in Ontario.

Public Attitudes Toward Education In Ontario, 2012
18
Neither/ Agree Disagree Not stated Total % % % % count 1984 66 20 14 100 1046 1988 62 23 16 101 1011 1994 76 19 5 100 1070 2007 72 22 6 100 1002 2009 69 23 8 100 1001 2012 70 20 10 100 1016 2012-Parents 66 23 12 101 284 2012-High school parents 65 22 13 100 115
Neither/ Agree Disagree Not stated Total % % % % count 1994 45 47 8 100 1070 2000 50 38 12 100 1002 2007 66 25 9 100 1002 2009 65 25 10 100 779 2012 67 20 12 99 1016 2012-Parents 74 18 9 101 282 2012-High school parents** 77 13 10 100 115
Table 5.2 Views on Province-wide Testing to Assess High School Student Performance*
Table 5.3 Views on Final Grade Assessment of High School Students*
The 2010 CTF National Issues in Education Poll asked a similar question on testing with a similar result. Two-thirds of a national sample thought that teachers’ evaluations of students’ work was the best way of determining student achievement; one third cited province-wide tests.vi
Testing and curriculum
A majority (75%) think that testing does cause teachers to devote at least somewhat more attention to subjects tested; 41% think tested subjects receive a lot more attention (see Table 5.4). Parents and non-parents hold similar views on this issue. A common criticism of province-wide testing has been that it narrows the curriculum as teachers “teach to the test”; some supporters have seen testing as a means of concentrating efforts on the “basics”. Among the public, views on this issue bear little relationship to positions on testing. Those who think tested subjects receive a lot more attention are no more or less likely to support province-wide testing, than those think this is not the case.
*Survey question: Should high school students’ final grades mainly reflect their teachers’ assessments, not the results of province-wide tests?
**Those with child(ren) in junior high or high school, including private.
*Survey question: Should province-wide tests be used to assess the performance of each high school student?

The 18th OISE Survey of Educational Issues
19
*Survey question: How much attention do subjects that have a province-wide test get compared to subjects that are not tested?
Public Public Parents
2009 2012 2012
% % %
A lot more attention 30 41 42
Somewhat more attention 33 34 37
Same amount of attention 18 14 14
Not stated 20 11 7
Total 100 100 100
count 1001 1016 284
Table 5.4 Amount of Attention Given to Tested as Compared to Non-tested Subjects*
The Education Quality and Accountability Office (EQAO)
> Less than a third of the public (29%) and less than half of parents (42%) could identify the main role of EQAO — to conduct province-wide tests and provide information on student achievement. However, 45% of the public and 63% of parents reported that they had read or heard about province-wide test results over the past year. Over 70% of the public and 80% of parents correctly identified English language skills; as a tested subject; views were even more accurate in the case of mathematics - over 80% for the public and 90% for parents. Less than 40% mistakenly identified other subjects as tested when they were not.
> Sixty-four percent agreed that EQAO testing helps keep the educational system account- able to parents and taxpayers. Two-thirds agreed that province-wide testing can be used to improve the quality of education in Ontario.
The Education Quality and Accountability Office (EQAO) was a participant in the 2012 OISE Survey, sponsoring a small number of questions specific to public views of the Agency’s work.vii Two types of questions were asked. The first dealt with awareness of EQAO and its testing pro-gram; the second about the usefulness of the use of EQAO results for system accountability and improvement.
Awareness of EQAO and Province-wide Testing
It is evident that both parents and the public as a whole are more aware of the province-wide testing program that the Agency that stands behind it. Respondents were asked to select the official mandate of EQAO from a list of options, only one of which was correct (see Table 5.5). Less than a third of the public (29%) and less than half of parents (42%) could identify the main role of EQAO — to conduct province-wide tests and provide information on student achieve-ment. A majority of the public (57%) and large plurality of parents (46%) declined to answer the question.

Public Attitudes Toward Education In Ontario, 2012
20
There was, however, more widespread awareness of the province-wide testing EQAO conducts. Forty-five percent of the public and 63% of parents reported that they had read or heard about province-wide test results over the past year (see Table 5.6). Over 70% of the public and over 80% of parents correctly identified English language skills and mathematics as subjects tested (see Table 5.7). Less than 40% mistakenly identified other subjects as tested when they were not. However, most, incorrectly, believed French language skills were not tested in minority French language schools. This is, in fact, part of the EQAO testing program (as most francophone parents would likely know).
*Survey question: The Education Quality and Accountability Office [EQAO] is an independent agency of the Ontario government. Which of the following, to your knowledge, is the MAIN role of this agency?
Public Parents
% %
To audit the budgets of school boards in Ontario. 2 3
To review provincial educational policies. 5 3
To conduct province-wide tests of students and provide information on student achievement. 29 42
To regulate the teaching profession in Ontario. 6 7
Not sure 57 46
Total 99 101
count 1016 284
Table 5.5 Knowledge of the MAIN Role of the EQAO*
*Survey question: Do you remember reading or hearing about reports of EQAO’s province-wide test results over the last year?
Public Parents
% %
Yes 45 63
No 52 34
Don’t know 3 3
Total 100 100
count 1016 284
Table 5.6 Awareness of the EQAO’s Province-wide Test Results*
Perceived usefulness of EQAO Activities
Two evaluative questions were asked about EQAO activities. Sixty four percent agreed that EQAO testing helps keep the educational system accountable to parents and taxpayers (see Table 5.8). Two-thirds agreed that province-wide testing can be used to improve the quality of education in Ontario (see Table 5.9).

The 18th OISE Survey of Educational Issues
21
*Survey question: Is there a province-wide test for …?
% indicating yes
2009 2012 2012
Public Public Parents
English language skills? 71 73 83
French language skills in French schools? 39 36 34
Mathematics? 79 82 93
Science? 39 40 39
Canadian history? 29 32 27
count 1001 1016 284
Table 5.7 Knowledge of Province-wide Tests*
*Survey question: EQAO’s provincial testing program helps keep the education system accountable to parents and taxpayers.
*Survey question: The results of EQAO’s provincial testing program are [can be] being used to improve the quality of education in Ontario.
Public Parents
% %
Strongly agree 14 15
Somewhat agree 50 45
Somewhat disagree 14 18
Strongly disagree 12 15
Don’t know 10 8
Total 100 101
count 1016 284
Public Parents
% %
Strongly agree 16 17
Somewhat agree 51 46
Somewhat disagree 12 15
Strongly disagree 10 13
Don’t know 11 10
Total 100 101
count 1016 284
Table 5.8 Views on EQAO Testing as Improving Accountability of Education*
Table 5.9 Views on EQAO Testing as Improving Quality of Education*

Public Attitudes Toward Education In Ontario, 2012
22
Equity, Accommodations and School Outcomes
> About half support accommodations of religious minority students that include not scheduling tests on religious holidays, allowing students to wear religious symbols at school and allowing students to meet learning objectives in culturally appropriate ways. A little over a third (38%) would support prayer sessions during school hours but only 22% would allow separate classes for boys and girls.
> Few (23%) support the creation of Africentric alternate schools. There is similarly little support for gender segregated schools (27%). This suggests that there is a general public antipathy to what are perceived as segregated schools for any social group.
> A large majority (74%) of the public see students from low-income families as less likely to continue to university or college than those from high income homes. Just over half (54%) now see Aboriginal students as disadvantaged compared to white students. In contrast, only 24% think Black students are less likely than white students to continue to college or university. Few (10%) see Muslim students as disadvantaged compared to Christians.
Accommodations
The OISE Survey has a long history of exploring public opinion on equity issues. The 2012 Survey broke new ground in asking about school accommodations for cultural and religious minority students. The immediate context was the eruption of controversy in summer 2011 over the allowance of Islamic prayer sessions at a Toronto middle school. As often acrimoni-ous debates over the school’s actions appeared in the media and online, we realized we had no accurate reading of public opinion on such accommodation issues. The result was the question set shown in Table 6.1.
Respondents were asked whether they favoured or opposed six specific accommodation measures. These were intended to represent a range of practices from minor to more significant adjustments. The first three practices: scheduling tests to avoid minority religious holidays, allowing students to wear religious symbols, and permitting them to meet learning objectives in culturally appropriate ways were viewed by the public in similar ways. A majority or near-majority (49-55%) favoured the measures; about a third (30-34%) were opposed. The balance changes on the issue of allowing students to attend prayer sessions during school hours. Only 38% favoured this measure, while a near majority (47%) rejected it. The practice most strongly opposed, however, was allowing separate classes for boys and girls. In this case, only 22% were supportive, while almost two-thirds (65%) were opposed. It should be noted that views of parents and non-parents are virtually identical on these questions.

The 18th OISE Survey of Educational Issues
23
There is evidence of a polarization of views among those who oppose accommodation mea-sures. By this we mean that those who strongly oppose a measure outnumber those who only somewhat do so. The more widespread the opposition to a measure, the more polarized opinion tends to be. For example, on the question of scheduling tests to avoid religious holidays, 11% are somewhat opposed and 19%, strongly opposed. In the case of gender segregated classes, 19% are somewhat opposed compared to 46% who are strongly opposed. This is a pattern we will see repeated in the case of views on Africentric and girls only schools.
*Survey question: In many Ontario schools, students from minority cultural and religious groups form a large part of the student body. We would like to know what measures you think these schools should take to accommodate these minoirity students. Would you favour or oppose each of the following?
Neither Strongly Somewhat favour nor Somewhat Strongly Not favour favour oppose oppose oppose stated Total N
Scheduling tests and major assignments so they don’t fall on main religious holidays when many minority students will be away. 31 24 12 11 19 3 100 1016
Allowing students to wear religious symbols such as head scarves, skull caps or medallions at school. 25 25 13 11 23 3 100 1016
Allowing students to meet learning objectives in subjects such as health and physical education in ways that are appropriate to their culture or religion. 22 27 13 13 19 6 100 1016
Allowing students to attend prayer sessions during school hours. 18 20 12 13 34 3 100 1016
Allowing separate classes for boys and girls. 9 13 11 19 46 2 100 1016
Table 6.1 Views on Accommodating Minority Students*
Africentric and gender-Segregated Schools
Issues of schools segregated by social group have also received extensive media attention as a result of polices of the Toronto District School Board. In 2009, after much debate in the community, in the media and within the board itself, the Toronto District School Board authorized the establishment of an Africentric alternate elementary school. This local initiative gained broader attention when the provincial government announced its opposition to such schools. The school was, in fact, established. In 2011 further controversy arose over the Board’s approval of an Africentric high school particularly when there was local resistance to the designated school site.
In addition to Africentric schools, the Board has pursued a policy of specialty schools including all-boy, all-girl, sports and music oriented elementary schools. The initiative is intended to buttress public school enrolment in the board, but generated renewed debate over the desirability of gender-segregated education (and in the case of the sports and music academies, issues of potential social class segregation).

Public Attitudes Toward Education In Ontario, 2012
24
Africentric Schools
Africentric schools are defined by their mandate to educate within an Africentric environment rather than by racial segregation. However, in practice they are essentially also racially segregated schools. The issues surrounding Africentric schools were preceded by, and overlap with, those that attended earlier calls for Blacks-only schools. In our 2009 survey we attempted to bridge this history by repeating a question reflecting the older debate drawn from our 1996 survey, followed later in the survey by a new item on Africentric schools. In 2012, only the later question was included.
In 1996, only 12% agreed that boards should establish Blacks-only high schools where enough parents were interested; 82% were opposed, most strongly (see Table 6.2). We repeated the question in 2009 with similar results. In 2009, Africentric schools garnered somewhat higher levels of support at 29%. However, 56% were opposed. This result was generally consistent with the findings of a February 2008 Angus Reidviii poll which found 59% strongly opposed to the Toronto District School Board’s plan to create an Africentric alternate schools, 20% moderately opposed, and only 15% moderately or strongly supportive. Most respondents to the Angus Reid poll also agreed with the Ontario government’s pledge not to provide funds for such schools. The 2012 OISE Survey found opinion on Africentric schools essentially unchanged from 2009.
Neither Strongly Somewhat agree nor Somewhat Strongly Not agree agree disagree disagree disagree stated Total
% % % % % % % Count
School boards should allow separate high schools for Black students where there are enough interested students.
1996 3 9 4 16 66 3 100 1000
2009 5 9 6 12 65 3 100 1001
There should be Africentric Alternative Schools, that is public schools with a focus on knowledge and experience of people of African descent, where there are enough interested students.
2009 8 21 8 18 36 8 100 1001
2012 7 16 12 18 41 6 100 1016
Table 6.2 Alternative Blacks-only and Africentric Schools

The 18th OISE Survey of Educational Issues
25
gender-Segregated Schools
In 1996 we also asked about separate high schools for girls. Support was higher than for Blacks-only schools but remained a minority position (25%). Over a decade later, opinions are largely unchanged (see Table 6.3). These are surprising results. Blacks-only schools had raised for many people the spectre of resurrected segregation. In the 2008 Angus Reid poll 80% of respondents agreed that the policy “... amounts to segregation and is a step backwards in our culture, which traditionally advocates for integration.” In contrast, girls’ schools have a long history in Canada, one not generally linked to disadvantage; the best well known are, in fact, elite schools. Moreover, potential benefits of gender segregated education have been subject of serious and often public debate among educators.ix It is plausible to associate the strong resistance to gender-segregation as a religious accommodation to concerns about gender equality. The same interpretation, how-ever, is much less plausible in the case of girls only schools in a secular context. (It should be noted that the question on girls only schooling was asked before the question on segregated classes for boys and girls as a religious accommodation.)
The 2008 Angus Reid poll asked respondents if they would support creation of alternate schools that used a curriculum focused on any specific ethnic group or community; 11% were supportive while 83% were opposed, 64%, strongly. This finding, together with the opposition to gender-based schooling suggests that the public values integration in general, across the range of social divisions.
Neither Strongly Somewhat agree nor Somewhat Strongly Not agree agree disagree disagree disagree stated Total
% % % % % % % Count
1996 8 17 5 19 47 3 99 1000
2012 10 17 10 22 38 4 101 1016
Table 6.3 Separate High Schools for Girls*
*Survey question: Should school boards allow separate high schools for girls where there are enough interested students?

Public Attitudes Toward Education In Ontario, 2012
26
School Outcomes: likelihood of Attending university or college by Social group
In the 2000 OISE Survey we asked three parallel questions on outcomes of K to 12 schooling - specifically, the likelihood that students will go on to pursue postsecondary education. The first question asked whether students from low income families had a better, worse or about the same chance of gaining a postsecondary education as students from high income families. The second question asked about the chances of Black compared to white students, and the third about Aboriginal compared to white students.
The results suggested that in the public mind, disadvantage was associated almost exclusively with material disadvantage. Two-thirds recognized the disadvantages of low income students, but only about a third thought Aboriginals were less likely to undertake postsecondary education. Less than 15% thought Black students were disadvantaged (see Table 6.4).
In 2004, we repeated these three questions. Views on income disadvantage remained unchanged; however, there was some increase in the proportions of respondents who thought that Aboriginal and Black students were disadvantaged. In 2009, the percentage of respondents recognizing disadvantage was higher on all three questions. Over three-quarters saw low income students as disadvantaged and over half considered Aboriginal students to be disadvan-taged. However, Black students were still only seen as disadvantaged by just over a quarter of respondents. This pattern is repeated in 2012 (see Table 6.5 for details). Also in 2012, only 10% thought Muslim students were disadvantaged compared to Christians.
Lower participation rates for university (but not college) are, in fact, well documented for low-income, Black and Aboriginal students.x In the case of Muslim students, there is little research at present.
% who think low income, Black and Aboriginal students have worse chance of a postsecondary education:
Students from low income families compared to those Black students compared Aboriginal students compared from high income families to white students to white students
% % % Count
1996 67 1000
1998 68 37 1007
2000 68 13 31 1002
2002 63 1054
2004 66 21 40 1002
2009 76 28 55 1001
2012 74 24 54 1016
Table 6.4 Access to Postsecondary Education: Who is Disadvantaged?
The 18th OISE Survey of Educational Issues
27
Much Somewhat About Somewhat Much better better same worse worse Not chance chance chance chance chance stated Total
% % % % % % % N
Do you think students from low-income families have a much better, somewhat better, the same, somewhat worse or much worse chance of getting a postsecondary education than students from upper-income families? 1 4 19 44 30 3 101 1016
Do you think aboriginal, that is First Nations, North American Indian and Inuit students have a much better, somewhat better, the same, somewhat worse, or much worse chance of getting a post secondary education than white students? 9 9 20 28 26 8 100 1016
Do Black students have a much better, somewhat better, the same, somewhat worse or much worse chance of getting a post secondary education than White students? 1 4 64 19 5 7 100 1016
Do Muslim students have a much better, somewhat better, the same, somewhat worse or much worse chance of getting a post secondary education than Christian students? 3 7 66 9 2 14 101 1016
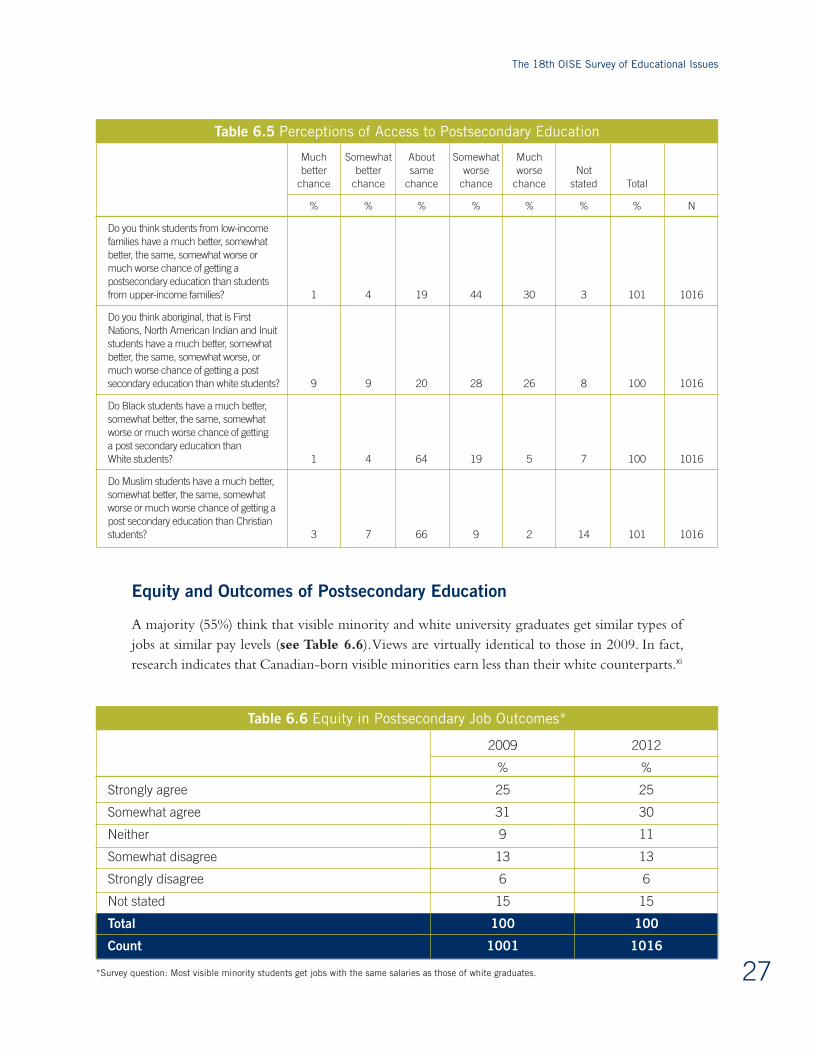
Table 6.5 Perceptions of Access to Postsecondary Education
Equity and Outcomes of Postsecondary Education
A majority (55%) think that visible minority and white university graduates get similar types of jobs at similar pay levels (see Table 6.6). Views are virtually identical to those in 2009. In fact, research indicates that Canadian-born visible minorities earn less than their white counterparts.xi
2009 2012
% %
Strongly agree 25 25
Somewhat agree 31 30
Neither 9 11
Somewhat disagree 13 13
Strongly disagree 6 6
Not stated 15 15
Total 100 100
count 1001 1016
Table 6.6 Equity in Postsecondary Job Outcomes*
*Survey question: Most visible minority students get jobs with the same salaries as those of white graduates.

Public Attitudes Toward Education In Ontario, 2012
28
Education and Economy
> There is no consensus that we can educate ourselves back to full employment. About half think that there won’t be enough jobs no matter how much education and training people obtain.
> Almost half think (erroneously) that a university graduate is as likely to be unemployed as a high school graduate.
> Just under 30% of working respondents report educational credentials above entry level requirements for their positions. Twenty percent think they are overqualified for their jobs in terms of their education.
The OISE Surveys have found consistent public support for broadening access to postsecondary education. This is expressed in support for increased funding and rejection of rationing access to programs in response to labour market demand. Postsecondary education is seen as key to social mobility for individuals. Yet the public is also skeptical – on occasion, overly skeptical – about claims made for the capacity of higher education to bring about full employment. xii
Public support for broad accessibility to postsecondary education is not based on the premise that an increased supply of highly educated workers will create its own demand. In 2012, almost half (49%) agreed with the statement that over the next five years there would not be enough jobs, no matter how much training and education people get (see Table 7.1); 39% disagreed. We found a similar division of opinion in 1996, when the question was first asked, and in 2009.
1996 2009 2012
% % %
Strongly agree 28 20 23
Somewhat agree 27 27 26
Neither 5 6 6
Somewhat disagree 17 20 20
Strongly disagree 16 24 19
Not stated 6 4 5
Total 100 100 99
count 1000 1001 1016
Table 7.1 Job Availability for Trained Workers*
*Survey question: Over the next five years there won’t be enough jobs no matter how much training and education people get.

The 18th OISE Survey of Educational Issues
29
Moreover, the public underestimates, on one dimension at least, the economic benefits of higher education to individuals. In 2012, respondents were almost equally divided over whether a university graduate was as likely to be unemployed as a high school graduate (see Table 7.2). When we first asked this question in 1982 almost two-thirds thought a university education conveyed no special advantage in avoiding unemployment. This occurred in the midst of a deep recession that provided an abundance of evidence to the contrary. In the economic downturn the existing gap between unemployment rates for university and high school graduates widened substantially. Since 1996, public perceptions have changed to be more in line with the actual situation.
Agree Disagree Neither/not stated Total
% % % % Count
1982 63 31 6 100 1050
1994 62 34 4 100 1070
1996 60 34 5 99 1000
2002 51 41 8 100 1054
2009 56 38 7 100 1001
2012 47 44 8 99 1016
Table 7.2 Unemployment of University Graduates
Educational Outcomes: Personal Employment Experiences
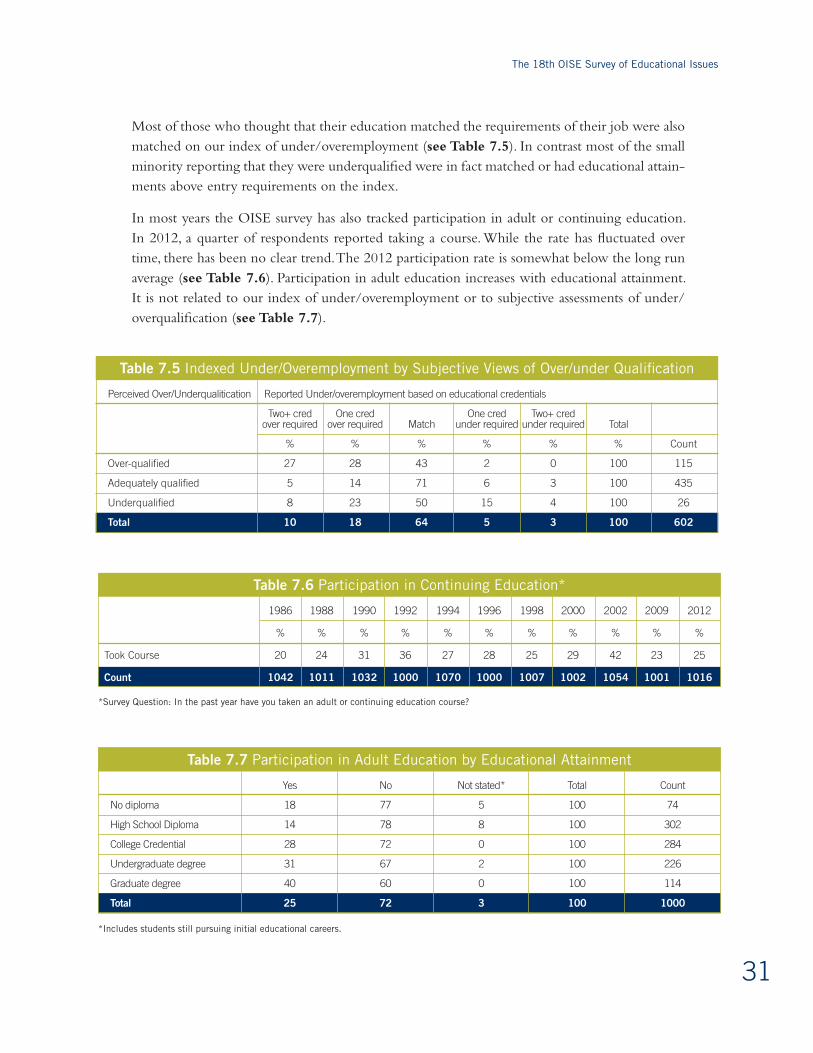
Since 1986, the OISE Surveys have asked employed respondents about both their own educational attainment and the educational credentials required of new applicants for positions like theirs. This information has been used to construct an index of under-employment or over-education. In the over two decades that we have tracked this index, there have been fluctuations but no real trend (see Table 7.3). Between 1986 and 2009, just over half reported a match between their highest educational credential and the credential required for their job. Of the remainder, in all years except 1986, those reporting having more education than required outnumber those reporting less education than their jobs required. If there is any trend in the series, it is that this gap seems to have increased over the period. This is not, however, a consistent trend.
In 2012, however, an exceptionally high proportion of employed respondents (64%) cited educational attainments that matched the credentials they reported as job entry requirements. Fewer than 10% reported that they did not have the entry-level education for their jobs com-pared to 28% who reported a higher level credential than required.
*Survey question: A university graduate is as likely to be unemployed as a high school graduate.

Public Attitudes Toward Education In Ontario, 2012
30
1986 1988 1990 1992 1994 1996 1998 2000 2002 2009 2012
% % % % % % % % % % %
Overemployed • Two or more credentials over required 5 5 9 7 6 8 10 7 9 10 10 • One credential over required 17 21 20 24 18 17 23 19 16 23 18
Match 54 51 51 52 55 55 53 58 55 51 64
Underemployed •One credendial under required 19 17 16 14 16 14 8 10 13 11 6 •Two or more credential under required 5 6 5 3 5 7 6 6 7 5 3
Total 100 100 100 100 100 100 100 100 100 100 100
count 606 599 620 568 645 594 563 608 522 601 588
Table 7.3 Under/overemployment Based on Self-Reported Educational Requirements for Job*
*Excludes missing data. Credentials: none, high school diploma, college credential, university degree. Employed ans self-employed respondents.
Since 1994 we have also asked working respondents whether they thought they were over-qualified, underqualified or matched for their jobs in terms of their education. (Note that the reference here is not specifically to entry requirements.) There has been even less variation in responses to this question than in the index constructed from self-reports of own education and education required (see Table 7.4). Moreover, in contrast to our index measure, respondents’ self-assessments of under/overemployment in 2012 are in no way exceptional.
1994 1998 2002 2009 2012
% % % % %
Overqualified 21 19 23 23 20
Adequately qualified 71 72 69 70 74
Underqualified 5 7 7 5 5
Not stated 3 3 2 1 2
Total 100 100 101 100 100
count 717 602 653 641 650
Table 7.4 Personal Experience of Educational Qualification for Current Job*
* Survey question: In terms of your schooling, do you feel you are overqualified, adequately qualified, or underqualified for your current job?
Currently employed and self-employed only.
In all years respondents have been much more likely to report that their qualifications match actual job requirements, than our measure using educational attainment and entry requirements indicates. In 2012, 74% felt their educational qualifications matched job requirements. As with the index, among those who do not see a match, the overqualified outnumber the underqualified.
The 18th OISE Survey of Educational Issues
31
Perceived Over/Underqualitication Reported Under/overemployment based on educational credentials
Two+ cred One cred One cred Two+ cred over required over required Match under required under required Total
% % % % % % Count
Over-qualified 27 28 43 2 0 100 115
Adequately qualified 5 14 71 6 3 100 435
Underqualified 8 23 50 15 4 100 26
Total 10 18 64 5 3 100 602
Table 7.5 Indexed Under/Overemployment by Subjective Views of Over/under Qualification
Most of those who thought that their education matched the requirements of their job were also matched on our index of under/overemployment (see Table 7.5). In contrast most of the small minority reporting that they were underqualified were in fact matched or had educational attain-ments above entry requirements on the index.
In most years the OISE survey has also tracked participation in adult or continuing education. In 2012, a quarter of respondents reported taking a course. While the rate has fluctuated over time, there has been no clear trend. The 2012 participation rate is somewhat below the long run average (see Table 7.6). Participation in adult education increases with educational attainment. It is not related to our index of under/overemployment or to subjective assessments of under/overqualification (see Table 7.7).
1986 1988 1990 1992 1994 1996 1998 2000 2002 2009 2012
% % % % % % % % % % %
Took Course 20 24 31 36 27 28 25 29 42 23 25
count 1042 1011 1032 1000 1070 1000 1007 1002 1054 1001 1016
Table 7.6 Participation in Continuing Education*
*Survey Question: In the past year have you taken an adult or continuing education course?
*Includes students still pursuing initial educational careers.
Yes No Not stated* Total Count
No diploma 18 77 5 100 74
High School Diploma 14 78 8 100 302
College Credential 28 72 0 100 284
Undergraduate degree 31 67 2 100 226
Graduate degree 40 60 0 100 114
Total 25 72 3 100 1000
Table 7.7 Participation in Adult Education by Educational Attainment

Public Attitudes Toward Education In Ontario, 2012
32
Endnotes>i Most of the prior surveys have been published and distributed by OISE Press. They are as follows: D.W. Livingstone.
Public Attitudes Toward Education in Ontario (1978); Livingstone and D. Hart. Public Attitudes Toward Education in
Ontario (1979 and 1980); Livingstone, Hart and L.D. McLean. Public Attitudes Toward Education in Ontario (1982);
Livingstone, Hart and L.E. Davie. Public Attitudes Toward Education in Ontario (1984, 1986, 1988, 1990, 1992 and
1994). The 1996 and 1998 surveys were published by University of Toronto Press: see Livingstone, Hart and. Davie.
Public Attitudes Toward Education in Ontario (1996, 1998).The 2000, 2002, and 2004 surveys by Livingstone, Hart
and Davie were again published by OISE Press as Orbit Monographs. The 2007 survey by Hart and Livingstone is also
published by OISE Press. The 2009 survey is only available on our website.
ii Response rates to telephone surveys have been dropping for at least a decade as caller-ID and voice-mail options
are increasingly used by subscribers to filter calls. Most polls appearing in the media no longer state response rates but
indicate only the number of actual respondents and the sampling error. The response rate to the OISE Surveys are likely
considerably higher than for most published polls because we are willing to extend the survey over several months in
order to allow multiple call backs to non-respondents.
Most published polls – including this one – provide the number of respondents and the sampling error. For the current
OISE Survey the sample size is 1016 and the sampling error is +/-3-4%. Sampling error is the difference between a
sample result and the result that would have been obtained if every eligible person in the population had been
interviewed, that is due to the “luck of the draw” in picking a sample. What is usually not stated in most published polls
is that this is the error that might be expected if nearly everyone called had responded – that is, if the response rate was
near 100%. No survey obtains this so all surveys are also subject to non-sampling error as well as sampling error.
Non-sampling error arises where those who participated in the survey have somewhat different views in aggregate from
those who did not participate either because they refused or could not be reached. There is no mathematical formula to
quantify non-sampling error.
iii Canadian Teachers Federation (CTF) National Issues in Education Poll, 2011. Highlights available at:
http://www.ctf-fce.ca/Documents/FinalPollhighlights-E.pdf; The 43rd annual Phi Delta Kappa/Gallup Poll of the
Public’s Attitudes Toward the Public Schools available at http://www.kappanmagazine.org/content/93/1/8.abstract.
iv A number of recent polls have documented public support for higher taxes in the service of preserving social services
and reducing social inequality. See Tonda MacCharles. Poll Challenges view that Canadians oppose higher taxes.
Toronto Star April 9, 2012, reporting on an Environics Poll for the Broadbent Institute. Almost two-thirds (64%)
indicated a willingness to pay “slightly higher” taxes to protect social services such as health care, pensions and access
to postsecondary education. In the same vein, a Forum poll in mid-April, 2012 found 75% support for NDP leader
Andrea Horwath’s proposal for a surtax on people with incomes above $500,000. See Robert Benzie. Ontario budget:
Andrea Horwath’s tax-the-rich scheme “hugely popular,” poll suggests. Toronto Star April 19, 2002. In addition both
Forum and Angus Reid polls on cost-cutting measures proposed in the Drummond Report, indicated substantial
resistance to reduced spending on social programs. Forum found 53% opposed to eliminating full-day kindergarten
with 39% in favour, and 57% opposed to cancelling the 30% university and college tuition rebate while 30% were in
favour. (See Robert Benzie. Drummond report: Ontarians not eager for harsh medicine, poll suggests. Toronto Star
Feb. 17, 2012.) A later Forum poll after the Budget was tabled, found support for retaining the tuition rebate as 60%.

The 18th OISE Survey of Educational Issues
33
(See Robert Benzie and Rob Ferguson. Ontario Budget: Poll suggests Ontarians welcome wage freeze. Toronto Star
March 30, 2012.) Angus Reid found 49% thought eliminating full-day kindergarten was a bad idea while 40% said
it was a good idea. (See Angus Reid Public Opinion. Ontario Budget: Ontarians Expect Tough Budget, But Are Split on
Expected Measures. (Toronto: March 26, 2012.) Both polls showed support for measures that (as with the Horwarth
surtax proposal) increased revenues by targeting wealthier groups. The Forum poll fund 79% favoured a freeze on
compensation of executives in the public sector, while 57% would support a general two year pay freeze for teachers,
doctors and the public service and only 47 supported a legislated freeze. Angus Reid found 60% thought cutting
corporate taxes was a bad idea, 26%, a good idea.
v While this report was in preparation, Forum Research released poll results showing 53% disagreed with continuing to
fund Catholic Schools. See Forum Research Inc. News Release Majority disagree with public funding for Catholics
schools in Ontario, May 15, 2012. See Robert Benzie Majority of Ontarians favour gay-straight alliances and
oppose Catholic school funding poll finds. Toronto Star May 16, 2012 http://www.thestar.com/news/canada/politics/
article/1178936--majority-of-ontarians-favour-gay-straight-alliances-and-oppose-catholic-school-funding-poll-finds
The Forum question did not include the option of extended funding to currently private schools.
vi See CTF reference above. CTF appears to interpret the result as public rejection of “…the heightened emphasis on
test-driven accountability” (http://www.newswire.ca/en/story/663161/national-poll-canadians-favour-increased-
education-funding-and-evaluations-by-teachers-over-standardized-tests). However, as the OISE Survey shows, the
public continues to support testing despite the shift to giving clear priority to teachers’ assessments.
vii EQAO sponsored three questions, two of which were drawn (slightly modified) from a prior survey after review by OISE
Survey staff.
viii Angus Reid Strategies. Ontarians Clearly Reject Initiative to Create Africentric School. Media Release February 9, 2008.
The question on Africentric schools read “The Toronto District School Board is planning to create an Africentric
Alternative School – a public school with a focus on the knowledge and experience of people of African descent. From
what you have seen, read or heard, do you support or oppose the creation of this Africentric Alternative School?”
ix See the review of research studies on single sex schools produced by the Toronto District School Board research unit:
Sally Erling and Jan O’Reilly Single-Sex Schools: A Review of the Literature, TDSB: October 2009; available at
http://www.tdsb.on.ca/wwwdocuments/about_us/external_research_application/docs/SingleSexEducation
AreviewoftheliteratureFInAl.pdf.
x Ross Finnie, Stephen Childs, and Andrew Wismer. Under-Represented Groups in Postsecondary Education in Ontario:
Evidence from the Youth in Transition Survey. Higher Education Quality Council of Ontario, 2011; Teresa Arada,
Feng Hou and Baji Ram. Ethnic Differences in Educational Attainment Among Children of Canadian Immigrants.
Canadian Journal of Sociology 34 (1) 2009, pp.1-28; Paul Ansief, Robert S. Brown, Kelli Phythian, Robert Sweet and
David Walters. Early School Leaving among Immigrants in Toronto Secondary Schools. Canadian Review of Sociology
47(2) 2009, pp103-128.
xi See John Samuel and Koglur Basabarajappa. The Visible Minority Population in Canada: A Review of Numbers, Growth
and Labour Force Issues. Canadian Studies in Population, Vol. 32, 2006, pp.257-258.
xii See particularly the 14th (2002) and 17th (2009) OISE Survey reports, and Livingstone and Hart (2009) Rising
Educational Expectations: Trends and Limits in Times of Economic Downturn. Education Canada 49 (3)4-7.


Public Attitudes Toward Education in Ontario 2012
The 18th OISE Survey of Educational Issues


