56
THE 2016 HOME SHOPPING A COMPREHENSIVE REVIEW OF 2015 HOME SHOPPING TRENDS TRENDS REPORT
| Date post: | 28-Jul-2016 |
| Category: |
Documents |
| Upload: | epsilon-abacus |
| View: | 220 times |
| Download: | 0 times |

THE 2016 HOME SHOPPING
A COMPREHENSIVE REVIEW OF 2015 HOME SHOPPING TRENDS
TRENDS REPORT

Executive Summary
How This Report Was Compiled
Home Shopping Overview
Spending Patterns by Acorn Category
Clothing Overview
Interview: Dara O’Malley, JD Williams
Clothing: High-End & Contemporary
Interview: Rob McMahon, Madeleine
Clothing: Mature
Interview: Lynn Cordall, Damart
Clothing: Mid Market
Food & Wine
Gardening
Generalist Retail
Interview: Arun Mundle, Easylife
Gifts, Gadgets & Entertainment
Home Interiors & Household Goods
Interview: Jo Whitworth, Plumbs
Positive Uk Economy Creating Retail Success by Mark Pragnell
How Weather Influences Customers Demand
Consumer Indicators
How We Consume Entertainment In The Home
About Us: Epsilon
About Us: The Abacus Alliance
How To Get More Insight
04-05
06-07
08-09
10-11
12-13
14-15
16-17
18-19
20-21
22-23
24-25
26-27
28-29
30-31
32-33
34-35
36-37
38-39
42-43
44-45
46-47
48-49
50
51
52-53
CONTENTS

EXECUTIVESUMMARY
04

05
Introduction & Executive Summary Lara Bonney, UK Country Director Epsilon Abacus Welcome to the 2016 Epsilon Abacus Annual Trends
report, which reviews consumer spending patterns
across the home shopping sector in 2015. This report is
now in its sixth year and for six years running we see
overall growth in the market year on year. It shows a
vibrant, well established sector that is firmly embedded
in the retail landscape. Many home shopping businesses
have worked hard to put the customer at the forefront
of everything they do and are seeing the return in the
form of revenue growth. This report is made possible
by Abacus Alliance members sharing transactional
information on their customers. It is their willingness
to provide monthly updates of new purchases that
creates a dataset unparalleled in depth and breadth,
making it a reliable and robust platform for research that
can be trusted. To give value back to the contributing
members and their marketing partners, we invest our
analytical time and expertise to give relevant insight into
specific home shopping sectors to help future planning.
Key trends in 2015 were an overall revenue growth
of 11.9% year on year, with a highlight of 18.1% revenue
growth in September. The spike in September is possibly
due to a delay in sales from August and an exaggeration
in comparison to the year on year revenue decline we
saw in September 2014 due to unseasonably warm
weather. Despite minimal UK price inflation, the Average
Order Value across the Home Shopping Sector grew by
3.0% from £57.10 in 2014 to £58.80 in 2015.
In addition to showing revenue trends, we include
monthly direct mail volumes provided by Ebiquity to add
insight into some of the marketing activity that went
into generating the revenue. This of course just reports
on one part of the marketing spectrum but gives a little
perspective. Mailing volumes were down year on year
according to Ebiquity by 7.1% in 2015. An overview
of the economy and wider UK retail market in 2015
adds context to the home shopping revenue trends
in this report so we are delighted to include
Consumer Indicators created by Step Solutions
and commentary from Mark Pragnell from Capital
Economics. While postal catalogues still play a vital
role in driving sales, having a seamlessly integrated
online and offline marketing strategy is the foundation
for successful Home Shopping businesses. To shed light
on how online devices compete for attention in the
modern living room, we are pleased to showcase the
Real Living research from the Internet Advertising Bureau
(IAB). Many home shopping businesses reported that
in recent years unusual weather patterns impacted
spending trends so in this report we include research
from Planalytics. This adds some science to the
speculation that weather has an influence on sales. For
an extra dimension, we asked business owners and
senior directors for their views on the trends they saw
in their own home shopping businesses and the sector as
a whole in 2015. Our thanks go to Lynn Cordall (Damart),
Arun Mundle (Easylife), Jo Whitworth (Plumbs), Dara
O’Malley (JD Williams) and Robert McMahon (Madeleine)
for their time and contributions.
I hope you find something in this report that resonates
and gives insight that can help you better understand
consumer trends in the home shopping market. I’m keen
to hear your feedback on our findings so please email me
directly at [email protected].
Executive Summary Key Findings: • Sales in the home shopping market
increased by 11.9% YOY
• Q2 growth rate was highest of year at 14.8% YOY
• Highest growth in a single month was September at 18.1% YOY
• 3.0% growth in Ave Order Value, from £57.10 in 2014 to £58.80 in 2015
EXECUTIVE SUMMARY
06
HOW THIS REPORT WAS COMPILED
In order to qualify for this analysis sample, the selected
members had to be trading actively throughout the
calendar years of 2014 and 2015, and have provided
up-to-date transactional information to the end of
December 2015. For ease of presentation we have
aggregated Abacus merchandise categories into six
macro categories; Clothing, Food and Wine, Gardening,
Generalist Retail, Gifts Gadgets & Entertainment and
Home Interiors & Household Goods. The following
clothing sub-categories are large enough to allow
independent analysis and have been presented
separately: Contemporary & High-End, Mature and
Mid-Market. Trends are presented using indices to the
two-year monthly average. The revenue in each month
of 2014/2015 is compared to the average monthly
revenue for the analysis period. This allows us to
examine seasonal trends, as well as year on year
growth or decline. Mailing volume data for the industry
was supplied by Ebiquity (www.ebiquity.com) who collect
information monthly from their UK panel. This content has
been reproduced with their kind permission. Throughout
this report we will present mailing volume trends by
macro category and the overall home shopping sample.
We reconfigured Ebiquity’s mailing volume figures to
produce indices to the two-year monthly average. Please
note that only mailing volumes for the Alliance members
selected for this year’s Annual Trends Report sample
have been included in the mailing trends analysis. The
allocation of a member and the related Ebiquity mailing
volumes to a specific macro category was conducted by
Abacus. Mailing trends are not presented for the Food
& Wine category due to insufficient coverage.
Over 500 multi-channel retail brands have joined the Abacus Alliance, contributing 500 million transactions and approximately £20 billion spend. We identified a sample of members from each of the categories listed opposite:
“The revenue in each month of 2014/2015 is compared to the average monthly revenue for the analysis period.
This allows us to examine seasonal trends, as well as year on year growth or decline”
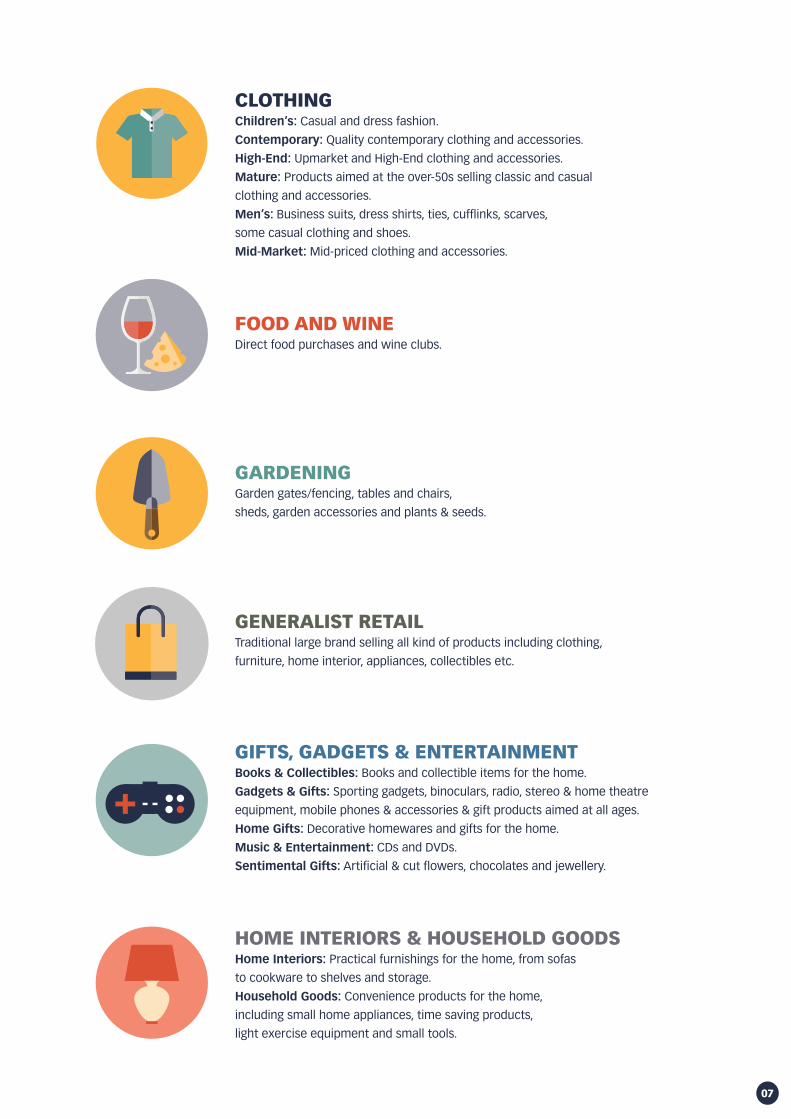
CLOTHINGChildren’s: Casual and dress fashion.
Contemporary: Quality contemporary clothing and accessories.
High-End: Upmarket and High-End clothing and accessories.
Mature: Products aimed at the over-50s selling classic and casual
clothing and accessories.
Men’s: Business suits, dress shirts, ties, cufflinks, scarves,
some casual clothing and shoes.
Mid-Market: Mid-priced clothing and accessories.
FOOD AND WINE Direct food purchases and wine clubs.
GARDENING Garden gates/fencing, tables and chairs,
sheds, garden accessories and plants & seeds.
GENERALIST RETAIL
Traditional large brand selling all kind of products including clothing,
furniture, home interior, appliances, collectibles etc.
GIFTS, GADGETS & ENTERTAINMENTBooks & Collectibles: Books and collectible items for the home.
Gadgets & Gifts: Sporting gadgets, binoculars, radio, stereo & home theatre
equipment, mobile phones & accessories & gift products aimed at all ages.
Home Gifts: Decorative homewares and gifts for the home.
Music & Entertainment: CDs and DVDs.
Sentimental Gifts: Artificial & cut flowers, chocolates and jewellery.
HOME INTERIORS & HOUSEHOLD GOODSHome Interiors: Practical furnishings for the home, from sofas
to cookware to shelves and storage.
Household Goods: Convenience products for the home,
including small home appliances, time saving products,
light exercise equipment and small tools.
07

08
Sales in the sample covered by the Annual Trends
Report grew 11.9% year-on-year (YOY) in 2015. This
follows three years of growth at an average rate of
10.4%, showing the continued strength in the sector.
The growth rate for the home shopping brands covered
by this report is in-line with the 15.7% increase in
non-store retail sales repored by Office for National
Statistics. The year got off to a good start with January
and February both exhibiting strong growth (+12.6%
and +13.1% YOY respectively).
Growth slowed somewhat in March (+8.4% YOY)
resulting in Q1 growth of 11.2%. April (+15.9% YOY)
and May (+15.1% YOY) were stronger than June
(+13.4% YOY) replicating the pattern seen in the first
quarter. The growth rate of 14.8% in Q2 was the
highest of the year. Q3 started with growth just below the
annual average in July (+11.2% YOY) before slowing
substantially in August (+5.9% YOY), the lowest point
of the year for sales growth. There was a strong
recovery in September (+18.1% YOY), resulting in overall
Q3 growth of 12.1%. Q4 started with above average
growth in October (+12.3%) before slowing slightly in
the final two months of the year (November +10.3%;
December +8.6%). Average Order Value (AOV was
up 3.0% compared to the previous year, going from
£57.1 in 2014 to £58.8 in 2015. The year started
with a substantial increase in AOV (+6.9% YOY in
January). This was predominantly driven by the
Gifts, Gadgets & Entertainment category (+22.1%
YOY in January) and may be the result of consumers
delaying larger purchases until after Christmas to
take advantage of January sales. The AOV growth rate
gradually reduced in February and March reaching
+0.8% in April, which showed the lowest increase
for the year. In June the AOV growth rate picked-up
again (+3.3% YOY) and remained around the annual
average until October. AOV growth accelerated in
November (+4.7% YOY), and then slowed
substantially in the last month of the year (+0.8%
YOY). Mailing Volumes were down 7.1% YOY
in 2015. This follows a decline of 8.1% in 2014.
REVENUE AND MAILING VOLUMES, 2014-2015
HOME SHOPPING OVERVIEW

09
The year started with increased mailing volumes in
both January (+11.9% YOY) and February (+12.0%
YOY) before declining in March (-13.4% YOY). As March
is the largest mailing month in Q1, this resulted in
mailing volumes increasing by 1.7% in Q1. The trend
for declining mailing volumes continued into Q2 with
a drop of 26.3% in April. This was the biggest decline
throughout the year, and with a drop in May (-16.3%
YOY) and a flat June (+0.0% YOY) Q2 was down 15.1%
YOY. The trend continued into Q3 with a decline of 17.1%.
October saw a decline of 7.8% YOY before an increase
towards the end of the year (November +5.2% YOY;
December +17.5% YOY). This resulted in an overall
increase of 2.2% in Q4.
AOV YEAR-ON-YEAR CHANGE, 2014-2015
REVENUE-ON-YEAR CHANGE, 2014-2015

SPENDING PATTERNS BY ACORN CATEGORY
10
Acorn, created by CACI, is a geodemographic segmentation of the UK’s population. It segments households, postcodes and neighbourhoods into 6 categories, 18 groups and 62 types. By analysing significant social factors and population behaviour, it provides precise information and an in-depth understanding of the different types of people. For the purposes of this report we have excluded the sixth category, Not Private Households. Below you can find descriptions for each Acorn category.
Affluent AchieversThese are some of the most financially successful people in the UK. They live in wealthy, high status rural, semi-rural and suburban areas of the country. Middle aged or older people, the ‘baby-boomer’ generation, predominate with many empty nesters and wealthy retired. Some neighbourhoods contain large numbers of well-off families with school age children, particularly the more suburban locations. Usually confident with new technology and managing their finances, these people are established at the top of the social ladder. They are healthy, wealthy and confident consumers.
Rising ProsperityThese are generally younger, well educated, and mostly prosperous people living in our major towns and cities. Most are singles or couples, some yet to start a family, others with younger children. Often these are highly educated younger professionals moving up the career ladder. Most live in converted or modern flats, with a significant proportion of these being recently built executive city flats. Some will live in terraced town houses. While some are buying their home, occasionally through some form of shared equity scheme, others will be renting. These people have a cosmopolitan outlook and enjoy their urban lifestyle. They like to eat out in restaurants, go to the theatre and cinema and make the most of the culture and nightlife of the big city.
Comfortable CommunitiesThis category contains much of middle-of-the-road Britain, whether in the suburbs, smaller towns or the countryside. All lifestages are represented in this category. Many areas have mostly stable families and empty nesters, especially in suburban or semi-rural locations. There are also comfortably off pensioners, living in retirement areas around the coast or in the countryside and sometimes younger couples just starting out on their lives together. Generally people own their own home. Most houses are semi-detached or detached, overall of average value
for the region. Incomes overall are average, some will earn more, the younger people a bit less than average. Those better established might have built up a degree of savings or investments. Most people are comfortably off. They may not be very wealthy, but they have few major financial worries.
Financially StretchedThis category contains a mix of traditional areas of Britain. Housing is often terraced or semi-detached, a mix of lower value owner occupied housing and homes rented from the council or housing associations, including social housing developments specifically for the elderly. This category also includes student term-time areas. There tends to be fewer traditional married couples than usual and more single parents, single, separated and divorced people than average. These people are less likely than average to use new technology or to shop online or research using the internet, although will use the internet socially. Overall, while many people in this category are just getting by with modest lifestyles a significant minority are experiencing some degree of financial pressure.
Urban AdversityThis category contains the most deprived areas of large and small towns and cities across the UK. Household incomes are low, nearly always below the national average. The level of people having difficulties with debt or having been refused credit approaches double the national average. The numbers claiming Jobseeker’s Allowance and other benefits is well above the national average. Levels of qualifications are low and those in work are likely to be employed in semi-skilled or unskilled occupations. The housing is a mix of low rise estates, with terraced and semi-detached houses, and purpose built flats, including high rise blocks. These are the people who are finding life the hardest and experiencing the most difficult social and financial conditions.

SPENDING PATTERNS BY ACORN CATEGORY
11
SPEND GROWTH BY ACORN CATEGORY, 2014-2015
SPENDING PATTERNS BY ACORN CATEGORY, 2014-2015REV TOTAL CH
70
90
110
130
150
170
Affluent Achievers Rising Prosperity Comfortable Commnunities Financially Stretched Urban Adversity
16.5%15.9%
13.2%12.7%
10.2%
0.0%
2.0%
4.0%
6.0%
8.0%
10.0%
12.0%
14.0%
16.0%
18.0%
Urban Adversity Financially Stretched Comfortable Communities Affluent Achievers Rising Prosperity
As in the previous two years, in 2015 growth was higher in the less-affluent Acorn categories with both Urban Adversity and Financially Stretched showing an increase in spend of over 15% compared to 2014. Consumers in these categories tend to spend more of their annual budget in the pre-Christmas period (July to November), while consumers in more affluent categories spend proportionally more in the first six months of the year.

CLOTHINGOVERVIEW
12

Clothing has been one of the most successful
categories in home shopping over the last five years,
with an astonishing average growth rate of 13.3% per
annum. The trend continued in 2015, with the category
up 10.7% Year-On-Year (YOY) making this the sixth year
of continuous growth. The year kicked-off with sales up
9.7% YOY in Q1 led by a very positive January (+11.0%
YOY). The pace of growth increased going into Q2
(+13.1% YOY) with the strongest performance in April
(+14.0% YOY) and June (+13.4% YOY). Growth slowed
going into Q3, with July (+7.4% YOY) and August (+7.0%
YOY) both below the average for the year. September
was particularly strong (+17.2% YOY), possibly due to
a poor September in 2014. As this is the largest month
of Q3 in terms of revenue, the strong growth in sales in
September resulted in Q3 being up 12.1% overall. Q4 grew
in-line with the annual rate (+9.2% YOY) led by a strong
performance in November (+12.1%). December was the
worst performing month of the quarter with a growth of
“just” 5.2%. The Average Order Value (AOV) in the category
declined compared to the previous year, although
very marginally (-0.1% YOY). This is the third year in
a row that the AOV has declined in Clothing (-2.7%
in 2013 and -0.5% in 2014). However, the rate of
decline has now slowed significantly. This means
that the growth experienced in the category in 2015
and the previous two years was driven by existing
customers placing more transactions and/or more
consumers coming to the marketplace. Mailing
volumes were down quite significantly in 2015 (-14.5% YOY)
There were particular declines in May (-29.4% YOY), August
(-27.3%) and September (-31.1%). The biggest increase
was in November (+14.1% YOY), possibly indicating that
retailers are pushing larger campaigns “deeper” into
the Autumn/Winter season. In the following
pages we will examine trends for the main
Clothing sub-categories: High-End & Contemporary,
Mid-Market and Mature.
CLOTHING OVERVIEW
13
REVENUE AND MAILING VOLUMES, 2014-2015

0000
Over time we are starting to see changing patterns in
customer loyalty. Older age customers are more loyal
than new younger age customers so when older age
customers move on, we have to work harder to get new
younger age customers to become loyal. To respond to
this, we have put a stronger focus on segmentation so we
can treat and talk to customers differently. It is becoming
apparent that we have to become much more shrewd
and knowledgeable in the way we segment, communicate
with and promote to our customer. Our aim is one to one
customer marketing but until we can truly make this
happen, clever segmentation is the next best thing. We
want to think of our customers as individuals and not a
number. For us, getting contact frequency right, product
customisation and making everything we do relevant to
the customer is key.
Dara O’Malley, Head of Marketing at JD Williams
In 2015 we saw our more mature customers continuing
to become more digitally aware with the online channel
becoming more important. We found that the tablet was
the fastest growing online order device for our older
customers (age 55 – 75), whilst for those under 50s
the fastest growing device is mobile. Whilst the digital
channel was strong for us and it is becoming increasingly
more important, we are conscious not to take our eye
off the more traditional channels such as direct mail and
press which have been the bedrock of our marketing. We
believe that whatever channel we use, we need to give a
consistent experience for the customer.
We were more promotional in 2015 because we feel we
have to work harder to get the older customer to spend
money with us. We seem to be competing with spend
on experience activity such as eating out and travel as
well as spend on products and we found that we had to
generate more orders per customer to gain the same
value as previous years. Promotions are not responding
as well as they used to, and I think it’s because there is
so much choice and noise in the market. The customer is
exposed to a variety of style, price and promotion offered
by specialist retailers as well as traditional retailers. We
have more to compete against and need to respond
by adding variety to our product and making our brand
something that our customers really connect with.
INTERVIEW WITH…
14
“Our aim is one to one customer marketing but until we can
truly make this happen, clever
segmentation is the next best thing”

000015
This calendar year has been challenging for our market
and our impression is that consumer confidence in the
mature market, especially from those who rely on fixed
incomes from stocks and shares has been affected by
the recent stock market downturn and the uncertainty
created by the EU Referendum. Some older customers
seem to be reigning in spend as a result.
In 2015, Black Friday and Cyber Monday had the effect
of pulling Christmas sales forward for us so going into
the future we will plan our business slightly differently
to accommodate it. The use of digital gives a window
of opportunity to get extra sales before Christmas from
those people who order during the promotional period.
Last year Cyber Monday immediately followed Black
Friday but there is a separation in 2016 so it would be
interesting to see if this affects spending patterns.
In my view, the biggest thing for multi channel retailers
to focus on going into 2016 is to put customers at the
heart of their marketing strategy, make sure they are
being relevant to customers and ensure that they are
maximising the ROI on marketing spend. If you can get
the right mix of traditional higher cost paper led marketing
activities with lower cost digital activity, you have more
chance of communicating with customers in the right
way for them and giving them a personalised experience
of your brand.
“The use of digital gives a window of opportunity to get extra sales before
Christmas from those people who order during the Black Friday and Cyber
Monday promotional period”

CLOTHINGHIGH END & CONTEMPORARYThe High-End & Contemporary Clothing category grew 13.4% Year-On-Year (YOY) in 2015. This follows growth of 8.5% YOY in 2014, showing that demand in this sector continues to be very robust. There was strong growth across all quarters, with Q4 showing the biggest increase in sales YOY (+17.5%). The biggest month of the year for the category is November and there was very strong growth during this month (+24.5%). September was the best performing month in terms of growth (+30.9% YOY). This might be due to the month performing poorly in 2014 (-8.4% YOY compared to 2013). The Average
Order Value (AOV) in the High-End & Contemporary Clothing category was marginally higher in 2015 (+0.7%) compared to the previous year. This indicates that the majority of the revenue growth was driven by a higher number of transactions in the category rather than an increase in spend per order. Mailing volumes were very similar to the previous year with a very slight decline (-1.2% YOY). There was a significant decline in mailings between April and June (-56.9% YOY), but this was contrasted by significant increases in February (+61.5% YOY) and December (+120.2% YOY).
16

REVENUE AND MAILING VOLUMES, 2014-2015
HIGH-END & CONTEMPORARY: Clothing
17
0%
2%
4%
6%
8%
10%
12%
18-24 25-29 30-34 35-39 40-44 45-49 50-54 55-59 60-64 65-69 70-74 75-79 80-84 85+0%
10%
20%
30%
40%
50%
60%
Less than £10,000
£10,000 -£14,999
£15,000 -£19,999
£20,000 -£24,999
£25,000 -£29,999
£30,000 -£39,999
£40,000 -£49,999
£50,000 -£59,999
£60,000 & Over
HIGH-END & CONTEMPORARY CLOTHING GREW
BY 13.4% YOY IN 2015
Contemporary & High End Clothing UK Contemporary & High End Clothing UK
AGE DISTRIBUTION INCOME DISTRIBUTION
30.9GROWTH%YOY
SEPTEMBER SHOWED

00
segmentation to understand what our customers buy
across the home shopping sector. We were able to
use the share of wallet information to tailor customer
vouchers and targeted incentives in a more intelligent
way for more impact and a greater return. When offering
incentives and promotions to customers, we are always
mindful of the impact they have on brand perception and
identity. It’s important to maintain our brand values, while
understanding that we need to offer relevant and targeted
incentives and promotions to remain competitive and
provide what customers would like and expect. We are
very engaged with Black Friday promotions and we will
continue to use this as an activity to gain market share.
We believe that we would lose out if we didn’t run any
promotions during this time; anyone in our sector who
ignores this opportunity would find themselves left out
in the cold. By developing these offers we have managed
to carve out a better level of customer service, including
a dedicated free-phone line, which has resulted in our
customers becoming more loyal. We provide free returns
on all orders – this is no longer seen as an offer, but
just an expectation by consumers who are now used to
Rob McMahon, Director UK, Marketing and Sales at Madeleine
The main purchasing trend we saw in 2015 was an
increase in seasonal buying. Customers continued
to buy products from our spring and summer
collection well into autumn due to the delay of the
colder weather. It seems that people buy for the
weather at the moment rather than planning ahead
for the next season. 2015 saw the continued shift
towards people buying online, we’re not alone in
saying that online is becoming the order channel of
choice. However, we understand the importance of
the catalogue in getting people onsite and because
of this the catalogue remains an integral part of our
marketing strategy, enabling us to convey the quality
of our brand effectively and it is a strong motivator
to purchase. By making our catalogue a high end
printed item with coffee table appeal, it stays in
the home much longer and serves as a continuing
reminder of our brand. We often receive orders
four or five months after someone has received the
catalogue. In terms of sending the catalogue to the
right people to attract new customers, we have had
great success through our work with Abacus.
We had an explosive growth year through a
combination of using Abacus solutions to target
catalogues at high quality prospective customers
and then making it simple for them to order online.
We also used Abacus customer segmentation
solutions such as data tagging and share of wallet
18
“We provide free returns on all orders.
This is no longer seen as an offer,
but an expectation by consumers
who are used to seeing this across clothing retailers”
INTERVIEW WITH…
seeing this across clothing retailers. We saw a positive
performance across most of our marketing channels
in 2015 and this led to year on year revenue growth.
Online advertising, banner adverts and classic DR
adverts all continued to work well for us. We strive to
speak to our customers with a single voice, making sure
that at every touch point the messages are consistent.
We adapt our messages appropriately to the different
channels to ensure we are communicating in the best
way to the customer. The main challenge we face is
attribution. It is difficult to understand the role that each
channel played in driving a customer to order and to
know how we allocate response to each channel. This
is something we will continue to work on in 2016 and
beyond. In 2016 we will focus our efforts on a greater
push for cross channel and cross platform marketing with
the goal to become more specialised in the marketing
we use to reach our customers. We would like to create
mobile and online advertising messaging consistent
with our offline messaging to ensure that the brand is
communicated cohesively to maintain the brand offering.
The main challenge is to stay up to date with the trends
and technology and continuing to communicate well
with our customer. Our long term aim is for Madeleine
to be a quality brand that is not perceived as a fad or
passing trend. Our mantra is “Fashion is the challenge of
standing out of the crowd whilst staying on trend”.
“By making our catalogue a high end printed item with coffee table appeal, it stays in the
home much longer and serves as a continuing reminder of our brand”
19

CLOTHINGMATUREThe Mature Clothing category grew by 6.8% in 2015, a lower rate compared to 2014 which saw sales growth of 12.1% Year-On-Year (YOY). Growth was consistent in the first half of the year (+8.3% in Q1 and +8.4% in Q2) before it accelerated in Q3 (+10.4% YOY). The worst performing quarter was Q4, with growth of just 1.0% YOY. The best performing month was September which saw growth of 20.2% whilst December was particularly poor with a decline of 11.9%. This is in stark contrast to 2014 which had seen September growth below the average for the year (+7.7 YOY v 12.1% for 2014 overall) and
very strong growth in December 2014 (+19.1% YOY). These changes may be caused by unusually warm weather depressing winter clothing sales in September 2014 and December 2015. The Average Order Value (AOV) in the category was marginally higher than in the 2014 (+0.7% YOY). This indicates that the majority of the revenue growth was driven by a higher number of transactions rather than an increase in spend per order. Mailing volumes were significantly lower than in the previous year (-24.2% YOY), with the biggest decline being in May (-42.5% YOY).
20

MATURE: Clothing
21
REVENUE AND MAILING VOLUMES, 2014-2015
IN 20156.8% YOY GROWTH
SEPTEMBERYOY GROWTH IN
Mature Clothing UK Mature Clothing UK
AGE DISTRIBUTION INCOME DISTRIBUTION
0%
2%
4%
6%
8%
10%
12%
14%
16%
18-24 25-29 30-34 35-39 40-44 45-49 50-54 55-59 60-64 65-69 70-74 75-79 80-84 85+0%
5%
10%
15%
20%
25%
Less than £10,000
£10,000 -£14,999
£15,000 -£19,999
£20,000 -£24,999
£25,000 -£29,999
£30,000 -£39,999
£40,000 -£49,999
£50,000 -£59,999
£60,000 & Over

22
grew and media inserts performed exceptionally well.
“Off the Page ads” performed a little more patchily over
the year but are still strong. A key focus for us in 2015
was to reduce our lead-time to market and get quicker at
doing things. It’s no longer acceptable to take 18 weeks
to put a catalogue out like it was years ago so we are
shaving time from all parts of the process. We are also
trying to be more effective with our marketing by using
more segmentation and differentiated contact plans to
give the customers what they really want while reducing
paper and postage costs.
The biggest initiative that we invested in is our customer
service. We invested in our people by carrying out
extensive customer service training. We went through
accreditation for customer service and we compared well
against John Lewis.
A big challenge we faced in 2015 was the discounting
mentality across the board. Customers shopping any
channel now expect a deal or to be incentivised. How
the market has traded online has trained the customers
to expect this, whether it’s online or offline, distance
or store.
Lynn Cordall, Commercial Director at Damart
As a home shopping clothing retailer aimed at the
older age customer, we saw a few interesting trends
in 2015. While in the past customers used to order
early in the season, we saw the “buy now, wear now”
concept speeding up; I think due to commoditisation
on the high street for some product areas, but also
due to the uncertain weather patterns we have
seen in recent years. Customers don’t really want to
spend until they need it. This presented a challenge
around service and delivery expectations because
customers want things to arrive much more quickly,
so we are offering more flexible options. Our
customers with an average age of 70 are becoming
more comfortable with online purchasing because
we saw an acceleration of orders coming through
on tablets and mobiles. The dominant device is the
tablet but mobile purchasing is growing rapidly and
while our overall percentage of online sales is still
small, I think mobile sales may catch up or exceed
tablet sales in the next few years.
With regard to marketing channels, most of them
worked well in 2015. Catalogues have always
performed well for us, our online channel activity
“We understand that a customer aged 55 will have a different
outlook to a customer who is 80”
INTERVIEW WITH…

It’s an established habit now, not just a recession impact
behaviour that we think will continue. This doesn’t
necessarily mean money off so we have to be more
creative with our offers. We found high street retailers
gaining ground into the home shopping space by offering
discounts. Black Friday and Cyber Monday had a big
impact on sales; we noticed 87% of similar companies
to ours were offering an average of 30% discount over
this period. We felt that the impact of Black Friday
brought the sales forwards which then effected the
last 4 weeks of the year. After testing we found that
some of our customers did not like Black Friday so next
year we will group our customers to ensure that we
tailor these offers in a different way. It is important for
Home Shopping companies to look at promotions and
incentives that work across different channels.
The future for us is personalisation, as one size doesn’t
fit all. We are doing a lot of research into how customers
react to incentives and promotions. For example, we
understand that a customer aged 55 will have a different
outlook to a customer who is 80. We would like to
automate the personalisation process in the future
and building a Single Customer View database is key to
helping us to understand and segment our customers
for a one to one experience. We plan to test everything.
Small changes can have big impacts.
Going into 2016 we understand that while differentiation
and personalisation is something we want to focus on in
2016, we mustn’t lose sight that people are buying the
product and brand and we need to get this right. We will
be ramping up testing around differentiated content and
focusing on a contact strategy for different customer
segmentations. We want to remove the fact that price
or promotion is the determining factor, we want the
customer to buy because of the brand. Buying online
is very much about price and there is always someone
who can undercut you. Differentiation is crucial.
“Black Friday and Cyber Monday had
a big impact on sales; we noticed
87% of similar companies to
ours were offering an average of 30%
discount over this period”
23

CLOTHINGMID MARKETThe Mid-Market Clothing category grew by 12.5%
Year-On-Year (YOY) in 2015. This was a similar rate of
growth to the previous year (+12.9% YOY in 2014). There
was growth across all months of the year, with June
exhibiting the strongest YOY growth (+21.1%) followed
by September and November (both at +17.0% compared
to 2014). This makes it the second year in a row that
November has had strong growth (+16.1% YOY in 2014).
The weakest sales growth was in July, with revenue up
“just”+4.0% YOY. The Average Order Value (AOV) in the
Mid-Market Clothing category was exactly the same YOY.
This indicates that the revenue growth was driven by a
higher number of transactions rather than an increase in
spend per order. Mailing volumes were down 11.6% YOY.
At the beginning of the year mailing volumes increased,
with January and February volumes up 33.5%, but from
March until October there was a decline in every month,
resulting in a drop of 24.5% during this period. There was
a significant increase in November (+48.9% YOY), but this
didn’t continue in December as mailing volumes were up
only marginally in that month (+0.5% YOY).
24

MID MARKET: Clothing
25
REVENUE AND MAILING VOLUMES, 2014-2015
12.5% GROWTH
IN 2015
YO
Y
JUNE HAD THE GROWTH OFSTRONGEST
21.1%YOY
Mid Market Clothing UK Mid Market Clothing UK
AGE DISTRIBUTION INCOME DISTRIBUTION
0%
2%
4%
6%
8%
10%
12%
18-24 25-29 30-34 35-39 40-44 45-49 50-54 55-59 60-64 65-69 70-74 75-79 80-84 85+0%
5%
10%
15%
20%
25%
30%
Less than £10,000
£10,000 -£14,999
£15,000 -£19,999
£20,000 -£24,999
£25,000 -£29,999
£30,000 -£39,999
£40,000 -£49,999
£50,000 -£59,999
£60,000 & Over
FOOD & WINEThe Food & Wine category had a very strong 2015 with sales growth of 17.5% Year-On-Year (YOY). As you can see in the graph, the category is heavily weighted towards the end of the year due to increased demand during the pre-Christmas period. November, the second biggest month of the year behind December, saw exceptional sales growth of 28.4% YOY. December also exhibited very strong growth (+18.0% YOY) which contributed to Q4 being the strongest quarter of the year (+22.0% YOY). Q4 makes up nearly 40% of the annual revenue in
the Food & Wine category, so the performance during this quarter deeply affects (in this case positively) the performance of the entire year. The first three quarters of the year saw fairly consistent YOY growth of around 15% (+14.6% in Q1, +14.7% in Q2 and +15.5% in Q3). The Average Order Value (AOV) in the Food & Wine category was marginally higher in 2015 compared to the previous year (+1.3% YOY). This indicates that the majority of the revenue growth was generated by a higher number of transactions rather than an increase in spend per order.
26

FOOD & WINE
27
REVENUE AND MAILING VOLUMES, 2014-2015
17.5%
GROWTHYOY
28.4YOY
PE
RC
EN
T
DECEMBERGROWTH IN
Food & Wine UK Food & Wine UK
AGE DISTRIBUTION INCOME DISTRIBUTION
0%
2%
4%
6%
8%
10%
12%
14%
18-24 25-29 30-34 35-39 40-44 45-49 50-54 55-59 60-64 65-69 70-74 75-79 80-84 85+0%
5%
10%
15%
20%
25%
30%
35%
40%
45%
50%
Less than £10,000
£10,000 -£14,999
£15,000 -£19,999
£20,000 -£24,999
£25,000 -£29,999
£30,000 -£39,999
£40,000 -£49,999
£50,000 -£59,999
£60,000 & Over

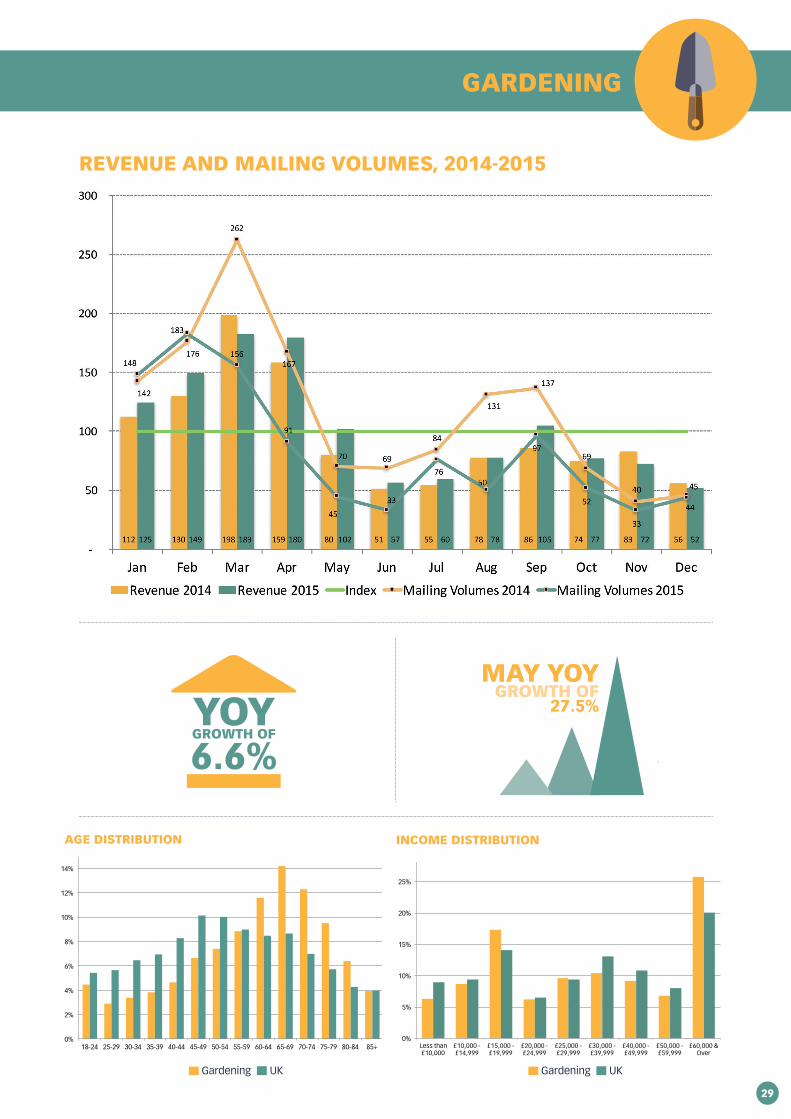
GARDENINGSales in the Gardening category grew by 6.6% Year-On-Year (YOY) in 2015. This represented a marked improvement over the previous two years which had seen declines in revenue (-9.4% YOY in 2013 and -0.3% in 2014). The growth was concentrated in the first nine months of the year (Q1 +3.7% YOY, Q2 +16.7% YOY and Q3 +11.2%) whereas the end of the year was more of a struggle with revenue down 5.7% in Q4. May saw the strongest annual growth (+27.5% YOY) while November saw the biggest decline (-13.3% YOY). The YOY decline we saw in November might be due to the seasonal pattern reverting to the
long term average after the exceptionally strong growth we saw in that month the previous year (+17.4% YOY in November 2014). There was a small increase in Average Order Value (AOV) in 2015 compared to the previous year (+2.1% YOY) which indicates that the revenue growth was mostly due to a greater number of transactions being made in the category. Mailing volumes were up in January (+4.2% YOY) and February (+4.0% YOY) but down significantly in the March to June period. This translated in an overall decline of -27.8% YOY in 2015.
28
GARDENING
29
YOYGROWTH OF
6.6%
REVENUE AND MAILING VOLUMES, 2014-2015
MAY YOY GROWTH OF
27.5%
Gardening UK Gardening UK
AGE DISTRIBUTION INCOME DISTRIBUTION
0%
2%
4%
6%
8%
10%
12%
14%
16%
18-24 25-29 30-34 35-39 40-44 45-49 50-54 55-59 60-64 65-69 70-74 75-79 80-84 85+0%
5%
10%
15%
20%
25%
30%
Less than £10,000
£10,000 -£14,999
£15,000 -£19,999
£20,000 -£24,999
£25,000 -£29,999
£30,000 -£39,999
£40,000 -£49,999
£50,000 -£59,999
£60,000 & Over
GENERALIST RETAILThe Generalist Retail category grew by 7.5% in 2015. This makes it the fifth year in a row of increased revenue in the category. There was growth across all quarters, although the first half of the year was stronger than the second half. Q2 had the biggest Year-On-Year (YOY) growth at 15.3% whilst the weakest growth was in Q4 (+2.2% YOY). The strongest month was April (+28.8% YOY) but there was growth across all months with the exception of August (-5.7% YOY) and November (-3.1% YOY). In 2014 November had 18.3% growth so this slight decline may be
the result of returning to normal revenue levels. The Average Order Value (AOV) in the Generalist Retail category was quite significantly higher in 2015 (+7.2% YOY). This can explain a large part of the YOY growth in this category. Mailing volumes grew by 6.9% YOY. The timing of mailing campaigns changed quite significantly, with more being mailed towards the end of the year than in 2014. Between July and October there was a decline of 36.7% in mailing volumes but in the final two months of the year mailings more than double (+102.3% YOY).
30

GENERALIST RETAIL
31
REVENUE AND MAILING VOLUMES, 2014-2015
7.5% YOY GROWTH
IN 2015
APRIL HAD THE
GROWTH OFSTRONGEST
28.8%YOY
Generalist Retail UK Generalist Retail UK
AGE DISTRIBUTION INCOME DISTRIBUTION
0%
2%
4%
6%
8%
10%
12%
18-24 25-29 30-34 35-39 40-44 45-49 50-54 55-59 60-64 65-69 70-74 75-79 80-84 85+0%
5%
10%
15%
20%
25%
Less than £10,000
£10,000 -£14,999
£15,000 -£19,999
£20,000 -£24,999
£25,000 -£29,999
£30,000 -£39,999
£40,000 -£49,999
£50,000 -£59,999
£60,000 & Over

0000
and this worked with a fairly high degree of success. This
success, as well as new customer recruitment mailings
using Abacus Alliance data, grew our customer file
exponentially and we saw a clean profit on our campaigns
as a result.
We explored a lot more dynamic and analytical targeting
in 2015 and this led to significant increases in conversion.
We wanted to increase website conversion without
negating the appeal for digitally recruited customers
from channels such as organic search, PPC and affiliates.
This process involved singling out individual segments
based on source and customer type and giving each
one its unique dynamic proposition and journey. New
customers who were labelled as not digitally savvy
would get more confidence statements and slightly more
clicks to checkout. The returning customer would have a
reduced path to checkout with product selections based
on previous viewing history. By combining these tactics,
we improved our overall conversion rate by 30%.
National press insertions are still the heart of our media
buying for the business. In 2015 this channel seemed
to be erratic which without close supervision could
have affected us badly. Managing our media booking in-
house provided us with the critical relationship with the
publications and insights to navigate successfully through
these pendulum swings of distribution.
We saw consumer spend dip in the run up to the
general election, but we recovered well with very good
performance in quarter three. The suspicion is that the
Arun Mundle, Managing Director at Easylife
In 2015 we saw consumer spending make a significant
recovery compared to the past 5 years, in terms of
physical demand and average spend which improved
significantly across all sectors. The overall increase was
not quite back to pre-recession response, but a great leap
forward. We saw a growth in online trade, however, our
proportionate organic traffic remained static; ultimately
our offline activity is still the driving force behind the sales.
The website is simply being used more as the channel
of preference to make the purchase. With consumer
spending on the increase, we altered our customer direct
mail strategy by putting more emphasis on contacting
customers with recent purchases rather than focusing on
how much they spent. We assumed the general increase
in consumer confidence and increased spending power
would naturally increase the average order value anyway
32
“In 2015 we saw consumers spending
make a significant recovery compared to the past 5 years”
INTERVIEW WITH…

00000033
demand was merely delayed. Cold weather is one of
the critical ingredients in increasing the propensity to
spend and the warm autumn did have a huge effect on
demand. Overall demand was lower than anticipated,
but it did create a healthy spread across the quarter.
Normally, we see a big scramble for weather related
products in a condensed period of time as soon as the
weather turns. This puts a lot of pressure on stock control
and fulfilment operations. As this didn’t happen it gave
us a better opportunity to spread resources across the
period, achieving better efficiency to counter balance the
reduction in demand. It was these events or lack of them
in early October that led us not to put too much emphasis
on Black Friday/Cyber Monday or flash sales generally.
The need for promotions seems self-fulfilling. Once
consumers get used to a promotion, the expectation is
set. On that basis, we tend to stay away from clearance
or knocked down prices unless we are clearing obsolete
stock. I would say that promotions do work, but you must
be committed to a long-term strategy because dipping
in and out can have a negative effect on the overall
bottom line.
In 2016 we will continue to focus on our core business,
making it work harder and more efficiently. While
consumer demand has been on the rise, the last five
years of lean trade has taught us to continue the same
strict monitoring but benefit from an increased response
to generate an increased net operating profit. We have
been quite ruthless in removing all the activities that
were “nice to have” but added no real value to the
business, as this was creating unnecessary distractions.
We will be looking to revisit everything we do well and do
it even better.
“The website is simply being used as the channel of
preference to make the purchase”

GIFTS, GADGETS & ENTERTAINMENT
The Gifts, Gadgets and Entertainment category grew by 12.8% in 2015. There was increased sales growth across the first three quarters of the year (+25.3% in Q1; +25.5% in Q2; +18.0% in Q3) but there was a small decline in Q4 (-0.5% Year-On-Year), the biggest revenue quarter of the year and accounting for over 40% of 2015 sales. This was driven by a decline in November (-7.5% YOY), the biggest month of the year in terms of revenue. The largest growth was in May (+35.7% YOY). The first half of the year in 2014 saw a decline in revenues, so the 2015 increase during this period may in part be a
recovery from then. The Average Order Value (AOV) in the Gifts, Gadgets & Entertainment category was significantly higher in 2015 than in 2014 (+16.6% YOY). This indicates that there were actually fewer transactions in 2015 than the previous year, and that revenue growth was driven entirely by the increased spend per order. Mailing volumes were up 10.7% YOY. There were significant increases in mailing volumes in June (+47.1% YOY) and July (+55.5% YOY), but also some declines in April (-12.0% YOY) and November (-10.0% YOY).
34

GIFTS, GADGETS & ENTERTAINMENT
35
REVENUE AND MAILING VOLUMES, 2014-2015
35.7%YOY
IN MAYGROWTH
Gadgets, Gifts and Entertainment UK Gadgets, Gifts and Entertainment UK
AGE DISTRIBUTION INCOME DISTRIBUTION
YOYGROWTH
12.8PERCENT
IN 2015
0%
2%
4%
6%
8%
10%
12%
18-24 25-29 30-34 35-39 40-44 45-49 50-54 55-59 60-64 65-69 70-74 75-79 80-84 85+0%
5%
10%
15%
20%
25%
30%
Less than £10,000
£10,000 -£14,999
£15,000 -£19,999
£20,000 -£24,999
£25,000 -£29,999
£30,000 -£39,999
£40,000 -£49,999
£50,000 -£59,999
£60,000 & Over

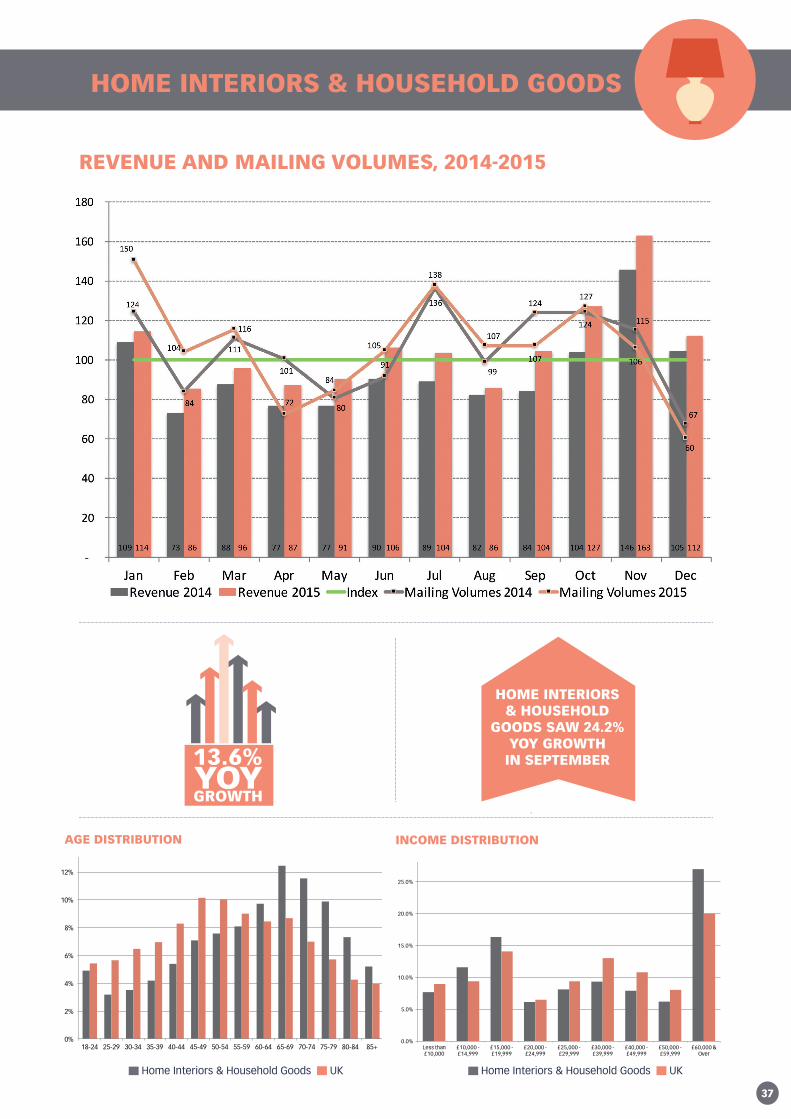
HOME INTERIORS & HOUSEHOLD GOODSThe Home Interiors & Household Goods category grew by 13.6% in 2015. This is slightly lower than the previous year (+15.1% Year-On-Year) and is the fifth successive year of category growth. There was growth across all months, with the biggest growth seen in September (+24.2% YOY) and October (+22.2% YOY.) The lowest level of growth was in August (+4.5% YOY) and January (+5.0% YOY.) In 2014 there was exceptional growth in January (+27.2% YOY,) which may explain why the growth in January 2015 was
more restrained compared to other months. There was a decline in the Average Order Value (AOV) for the Home Interiors & Household Goods category of 2.8%. This indicates that the revenue growth was a result of an increase in the volume of transactions rather than a higher spend per order. Mailing volumes were marginally higher in 2015 (+1.6% YOY.) The biggest decline in mailings was in April (-28.0% YOY), whilst the biggest increase was in February (+24.3% YOY) closely followed by January (+21.1% YOY).
HOME INTERIORS & HOUSEHOLD GOODS
36
HOME INTERIORS & HOUSEHOLD GOODS
37
REVENUE AND MAILING VOLUMES, 2014-2015
HOME INTERIORS & HOUSEHOLD
GOODS SAW 24.2% YOY GROWTH
IN SEPTEMBER13.6%
GROWTHYOY
Home Interiors & Household Goods UK Home Interiors & Household Goods UK
AGE DISTRIBUTION INCOME DISTRIBUTION
0%
2%
4%
6%
8%
10%
12%
14%
18-24 25-29 30-34 35-39 40-44 45-49 50-54 55-59 60-64 65-69 70-74 75-79 80-84 85+0.0%
5.0%
10.0%
15.0%
20.0%
25.0%
30.0%
Less than £10,000
£10,000 -£14,999
£15,000 -£19,999
£20,000 -£24,999
£25,000 -£29,999
£30,000 -£39,999
£40,000 -£49,999
£50,000 -£59,999
£60,000 & Over

0000000038
has been positive we are also taking part in one hour
programmes on a TV shopping channel that explains the
process of the re-upholstering. We are also testing some
video marketing which is proving to be a good way to
communicate a more involved product. Going into 2016,
the digital channels will be a focus for us with tests via
Affiliate and Facebook advertising.
To support our service objectives, in 2015 we used data
to understand and communicate with our customers
more frequently through the buying cycle and after
dispatch. We called more customers to talk them through
the ordering process and afterwards sent them a thank
you pack with incentives to order again, coupled with a
phone call to ask how the order process was for them.
We find that our customers really appreciate this more
Jo Whitworth, Marketing Development Manager at Plumbs
A recent trend I have seen is that more people seem to
be looking for personalised and niche items and I believe
that home shopping businesses are in a good position
to offer those things. As a bespoke furniture covers and
re-upholstery business, we offer a very hands-on, face–to-
face service which gives us a positive point of difference.
For our target market, which is the over 50’s, the
emphasis on giving friendly advice and having someone
to help you through the buying process can create a good
buying experience for the customer and consequently
good advocacy.
We recently reviewed our processes and found that our
customers value service and quality above everything
when deciding on a large item purchase. There is a lot
of good brand imagery from furniture home shopping
businesses in the market at the moment which makes
things look high quality, fresh and easy to purchase. This is
attractive to consumers and is good for all of us in raising
awareness that quality products are available from home
shopping businesses at affordable prices.
Bespoke furniture covers aren’t something you usually
just order through the website, so our marketing objective
is to get people to ask for a home visit. Our best channel
in 2015 to achieve this was PPC (pay per click) but we
know there was a halo effect from other marketing
activity. We tried TV sponsorship last year for the first
time and we believe this had a positive effect on
response from all media channels. As a direct marketing
company we usually look at every pound and try to work
out how many leads we got from it. TV sponsorship
is more brand awareness orientated but because it
“We tried TV sponsorship last year for the first time and we believe this had a positive effect on response from all media channels”
INTERVIEW WITH…

000000000039
personalised service. Customers often refer us to their
friends and encouraging this is at the forefront of our
thinking. “Recommend a friend” is very important for us
and simple incentives like vouchers for recommending a
friend work well.
Customers still expect incentives and promotion is still
king in the home shopping world. We are competing with
high street furniture retailers who regularly have half
price sales so we have to give some sort of offer. Over
the years we have tested many type of incentives as well
as testing giving an offer versus giving no offer. Giving an
offer works every time and if you want instant response,
a time limit to the offer works even better. Added value
order incentives are effective such as M&S vouchers. The
Brand people say that the brand should speak for itself but
I don’t think there is anything like a promotion or an offer
to make someone act there and then.
Going into 2016, we would like to be more adventurous
and creative with our marketing by testing new media
and approaches. To stimulate ideas and mitigate the
risks, we plan to network with other companies, as often
it is not what you are doing but how you are doing it
that can be critical for success. Understanding what has
worked and what hasn’t for similar businesses could
give us the confidence to try things. Also, knowing the
right agencies and third parties to work with for each
marketing discipline can make all the difference for
strong campaign execution and performance.
“Giving an offer works every time and if you want instant response, a time limit to the offer
works even better”

40

OTHER THINGSTO KEEP IN MIND
41

By Mark Pragnell Head of Commissioned Projects at Capital Economics Ltd
The British economic recovery is on the right track, largely
because of consumers, and Brexit is unlikely to derail it.
Britain’s economy grew by its fastest pace since the
global financial crisis and was the fastest growing G7
economy in 2014. Last year, it lost out on first place to
the United States. But despite a soft first quarter, the
economy still expanded by a respectable 2.2 per cent in
2015 as a whole. While some areas of the economy lost
momentum in 2015, the consumer recovery gained pace.
Although in the early phase of the recovery retail sales
led the way, 2015 saw strong growth in spending on and
off the high street.
Consumers benefitted from falling oil prices which have
plunged since their peak in mid-2014. The slump in
energy prices has saved consumers the equivalent of 0.2
per cent of Gross Domestic Product on their fuel bills.
This increased households’ annual real income.
Falling gas and electricity prices and food prices have
also boosted households’ income. Indeed, real disposable
income rose by an average of 3.5 per cent in the
first three quarters of the year after contracting in both
2013 and 2014. This was one of the main reasons why
household spending rose by its fastest pace in over
a decade last year. Households were also given by a fillip
by the continued improvement in the labour market.
The number of people employed is currently at a record
high and the unemployment rate has continued its slide.
It fell from 5.6 per cent in January 2015 to just 5.1 per
cent at the end of the year. This led to a rise in pay growth
whilst inflation remained subdued boosting household’s
real earnings which rose by 2.4 per cent.
There are concerns that the consumer recovery is
unsustainable because it is in part being driven by
unsecured credit growth. However, debt and interest
payments as a share of incomes are well below their
previous peaks. In 2016 downward pressure on inflation
from lower oil prices and sterling’s previous appreciation
is set to fade.
“The economy expanded by a respectable
2.2% in 2015”
42
POSITIVE UK ECONOMY CREATING RETAIL SUCCESS

43
What’s more, employment growth is slowing now that
the labour market is nearing full employment and we
expect the Bank of England to hike interest rates for the
first time in nine years later in the year. However, the
tightening cycle is set to be very gradual and is unlikely
to deter spending. The British economy should still grow
strongly this year, by about 2.2 per cent in 2016, similar
to last year’s rate.
Admittedly, a number of factors threaten to undermine
the recovery including the resumption of the fiscal
squeeze and the uncertainty ahead of the European
Union referendum. But we think that the economy should
weather these relatively well. The Chancellor managed to
soften the pace of fiscal tightening in his latest Budget,
but the big picture remains that fiscal policy will be
tightened more this year than last. That said, rising real
earnings leaves households far better placed to deal with
this stage of austerity than the last one.
There are few signs yet that the referendum on Brexit
is having any adverse impact on firms’ investment
intentions and we do not think the vote will have a major
impact on consumer spending either way. Unlike firms,
we doubt that households would delay their spending.
Consumers may be affected by Brexit if it hits domestic
firms hard, but we doubt this would be the case. We
continue to think that the United Kingdom’s prospects
are good whether in or outside the European Union. As
such, whatever happens, consumers won’t be flustered.
“Household spending rose at its fastest
pace in over a decade last year”

HOW WEATHER INFLUENCES CUSTOMERS DEMAND
44
Weather is a critically important external factor for
consumer-focused businesses. This is because no other
outside variable shifts consumer buying behaviour as
frequently, directly, immediately, or meaningfully as the
weather. The climate outside affects decisions every day:
from the clothing people wear to their food and drink
choices, from the leisure activities they pursue to the
chores that need to be done in their homes, gardens, and
garages. The challenge for businesses is that the weather
is always changing and the trends rarely seem to be the
same from one year to the next. As the conditions change
so does the consumer response and 2015 proved to be
another year with glaringly different weather and sales
patterns. The following summary highlights how the
year-on-year weather changes affected retail businesses
and the demand for specific product categories.
Planalytics’ Weather-Driven Demand values are
measurements of how much the weather (and only the
weather) positively or negatively impacted demand for a
product or overall transactions.
The first half of 2015 was stubbornly cooler in comparison
to both “normal” and the prior year. Whilst the chillier
temperatures helped clear some winter merchandise in
January and in early February, the trend did businesses
no favours during the important spring selling season.
March is a particularly important period for fashion
retailers along with DIY chains and garden stores as
springtime officially arrives and the focus of consumer
activities and shopping changes. These retailers were
already facing strong turnover comparisons produced
by a very warm March 2014 (7th warmest in 54 years)
and Mother Nature was decidedly less generous
in 2015. Cooler temperatures throughout the UK
delayed the start of spring purchases and stormy
weather across the north in the first half of the month
made things even worse. Weather-Driven Demand
(March 2015 v March 2014): Lawn Mowers -25%,
Gardening Products -9%, Skirts -11%, and Casual
Trousers -6%. The less than favourable trend continued
into April and into the run up to Easter, but warmer
weather did arrive over the two weeks after Easter.
Although this is not apparent on the monthly map, the
long awaited warmup along with much drier conditions
for Wales and the southern half of England finally
helped kickoff spring spending in earnest and resulted
in stronger demand for seasonal categories. Weather-
Driven Demand (April 2015 v April 2014): Garden Hoses
+10%, Beer +3%, and Shorts +5%. The conditions were
not as good for some categories such as Sleeveless
Tops, which were down 11%. May turned less favourable
YEAR-TO-YEAR TEMPERATURE VARIATION (JAN-JUN)

45
The year-on-year weather volatility continued in the
second half of 2015. The core of summer featured a much
colder July that hurt seasonal businesses followed by a
warmer August that helped some companies rebound.
As autumn arrived, clothing and department stores were
greeted by weather that encouraged consumers to think
about updating the fall-winter wardrobes. October’s cooler
temperatures and clear skies supported footfall on high
street and stimulated seasonal buying. Weather-Driven
Demand (October 2015 v October 2014): Knitwear +5%,
Outerwear +11%, Soup +3%, and Cough-Cold Products
+4%. It is said all good things must come to an end and
from a weather standpoint that definitely happened as
the calendar flipped to November. Overall, November
2015 ended up being the 4th warmest in 55 years and
this significantly slowed demand for winter items.
Weather-Driven Demand (November 2015 v November
2014): Hats, Scarves & Gloves -15%, Fleece -11%, and
Long-Sleeve Shirts -13%. The month also registered as
the 7th wettest November, hurting footfall for many
retailers. Clothing Store Transactions fell 2% due to
weather. December proved to be even worse for fashion
and winter-focused businesses. It was the warmest
December on record and this coming on the heels of a
challenging November led to heavy discounting as retailers
faced mountains of winter stocks that needed to be moved.
Making matters worse, many locations in Ireland, Scotland,
and northern England faced record-breaking rainfall and
flooding, further altering typical purchasing patterns.
Weather-Driven Demand (December 2015 v December
2014): Heaters -38%, Women’s Boots -13%, and Winter
Coats -18%. For several winter clothing categories
it was the worst demand environment for the
November-December period in at least 10 years.
Planalytics calculated that the unfavourable weather
hurt topline sales by £-83 million at clothing store chains
during the last two months.
David Frieberg, [email protected],
http://www.planalytics.com/
overall with the UK overall experiencing an even stronger
cold variance to 2014 than the first two spring months.
London and other locations in southern England fared
better with temperatures closer to normal and less
rainfall. A couple of Weather-Driven Demand examples
(May 2015 v May 2014) highlight the regional differences
– Women’s Sandals were -36% in Manchester whilst only
-1% in London, Exterior Paint was -19% in Glasgow versus
+14% in Bournemouth.
YEAR-TO-YEAR TEMPERATURE VARIATION (JUL-DEC)
By Tim Morris Managing Director, Planalytics Europe
CONSUMER INDICATORS
2015 - review of the year
Digest of Consumer Behaviour
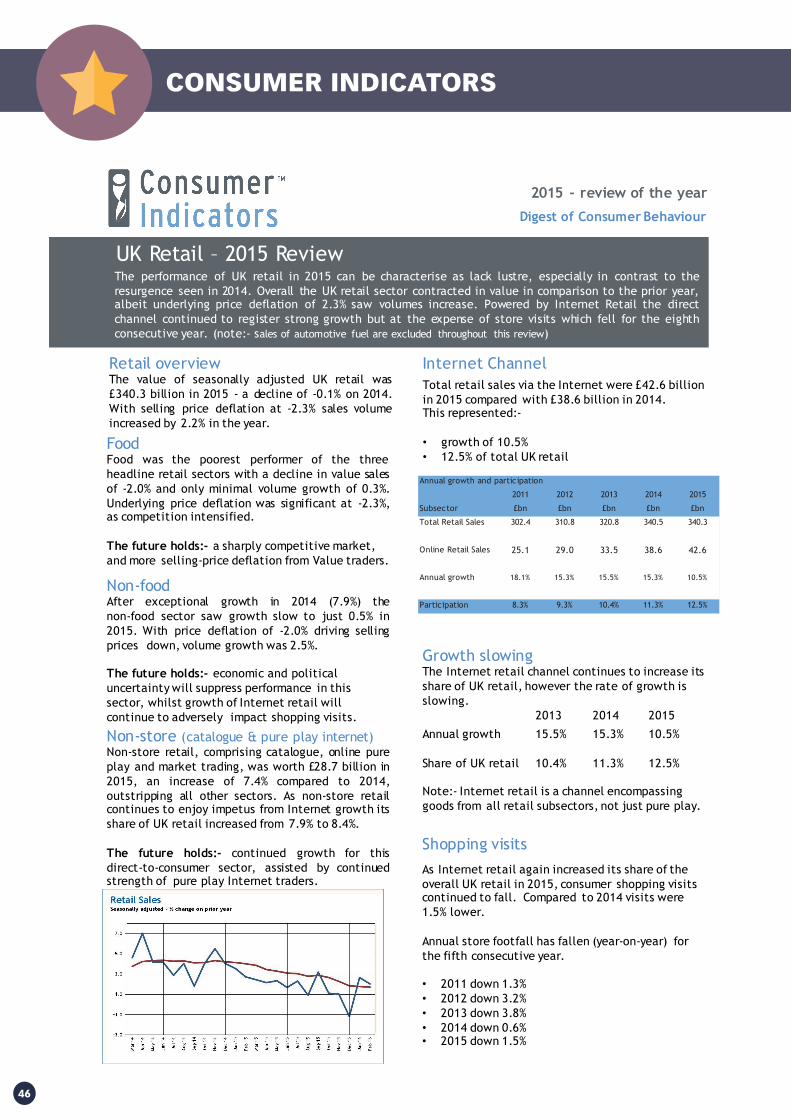
Retail overviewThe value of seasonally adjusted UK retail was£340.3 billion in 2015 - a decline of -0.1% on 2014.With selling price deflation at -2.3% sales volumeincreased by 2.2% in the year.
UK Retail – 2015 ReviewThe performance of UK retail in 2015 can be characterise as lack lustre, especially in contrast to theresurgence seen in 2014. Overall the UK retail sector contracted in value in comparison to the prior year,albeit underlying price deflation of 2.3% saw volumes increase. Powered by Internet Retail the directchannel continued to register strong growth but at the expense of store visits which fell for the eighthconsecutive year. (note:- sales of automotive fuel are excluded throughout this review)
Growth slowing The Internet retail channel continues to increase its share of UK retail, however the rate of growth is slowing.
2013 2014 2015
Annual growth 15.5% 15.3% 10.5%
Share of UK retail 10.4% 11.3% 12.5%
Note:- Internet retail is a channel encompassinggoods from all retail subsectors, not just pure play.
Published by Step Solutions www.stepsolutions.co.uk
FoodFood was the poorest performer of the threeheadline retail sectors with a decline in value salesof -2.0% and only minimal volume growth of 0.3%.Underlying price deflation was significant at -2.3%,as competition intensified.
The future holds:- a sharply competitive market,and more selling-price deflation from Value traders.
Non-foodAfter exceptional growth in 2014 (7.9%) thenon-food sector saw growth slow to just 0.5% in2015. With price deflation of -2.0% driving sellingprices down, volume growth was 2.5%.
The future holds:- economic and politicaluncertainty will suppress performance in thissector, whilst growth of Internet retail willcontinue to adversely impact shopping visits.
Non-store (catalogue & pure play internet)Non-store retail, comprising catalogue, online pureplay and market trading, was worth £28.7 billion in2015, an increase of 7.4% compared to 2014,outstripping all other sectors. As non-store retailcontinues to enjoy impetus from Internet growth itsshare of UK retail increased from 7.9% to 8.4%.
The future holds:- continued growth for thisdirect-to-consumer sector, assisted by continuedstrength of pure play Internet traders.
Total retail sales via the Internet were £42.6 billion in 2015 compared with £38.6 billion in 2014. This represented:-
• growth of 10.5% • 12.5% of total UK retail
Internet Channel
Annual growth and participation
2011 2012 2013 2014 2015
Subsector £bn £bn £bn £bn £bn
Total Retail Sales 302.4 310.8 320.8 340.5 340.3
Online Retail Sales 25.1 29.0 33.5 38.6 42.6
Annual growth 18.1% 15.3% 15.5% 15.3% 10.5%
Participation 8.3% 9.3% 10.4% 11.3% 12.5%
As Internet retail again increased its share of the overall UK retail in 2015, consumer shopping visits continued to fall. Compared to 2014 visits were 1.5% lower.
Annual store footfall has fallen (year-on-year) for the fifth consecutive year.
• 2011 down 1.3%• 2012 down 3.2%• 2013 down 3.8%• 2014 down 0.6%• 2015 down 1.5%
Shopping visits
46
By Tony Lahert Managing Director at ‘Step solutions’
www.stepsolutions.co .uk
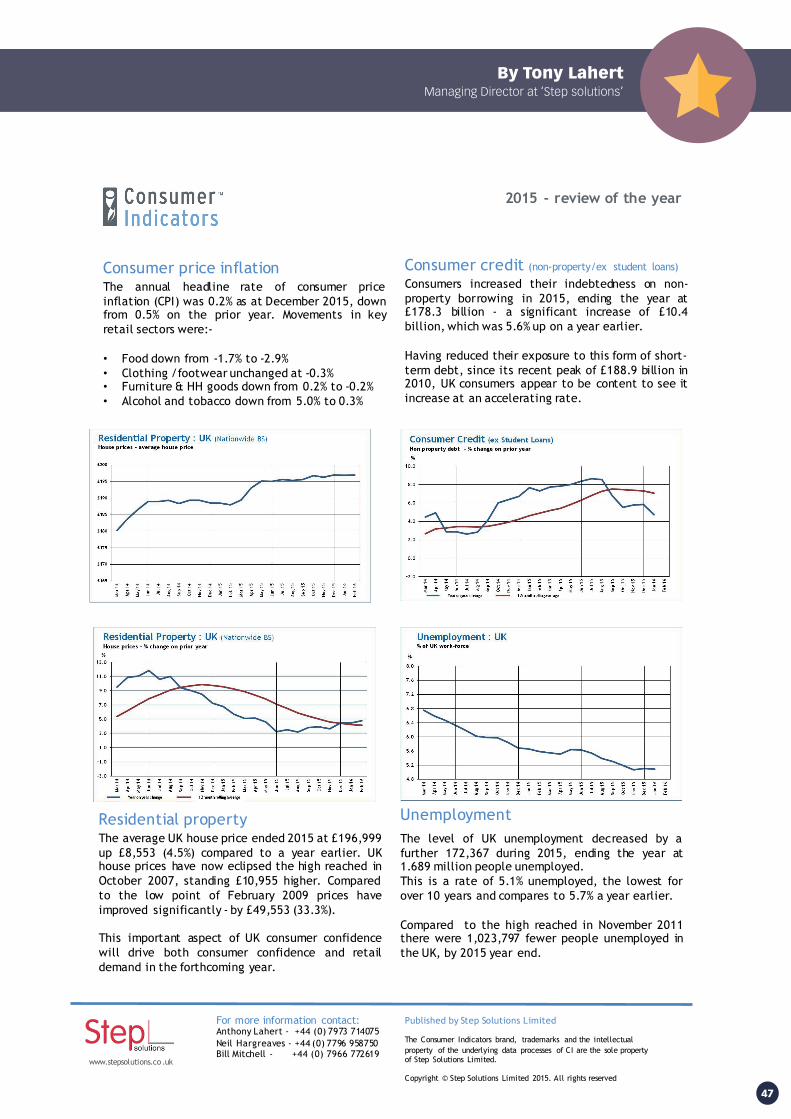
The annual headline rate of consumer priceinflation (CPI) was 0.2% as at December 2015, downfrom 0.5% on the prior year. Movements in keyretail sectors were:-
• Food down from -1.7% to -2.9%• Clothing /footwear unchanged at -0.3% • Furniture & HH goods down from 0.2% to -0.2% • Alcohol and tobacco down from 5.0% to 0.3%
Consumer price inflation
The average UK house price ended 2015 at £196,999up £8,553 (4.5%) compared to a year earlier. UKhouse prices have now eclipsed the high reached inOctober 2007, standing £10,955 higher. Comparedto the low point of February 2009 prices haveimproved significantly - by £49,553 (33.3%).
This important aspect of UK consumer confidencewill drive both consumer confidence and retaildemand in the forthcoming year.
Residential propertyThe level of UK unemployment decreased by afurther 172,367 during 2015, ending the year at1.689 million people unemployed.This is a rate of 5.1% unemployed, the lowest forover 10 years and compares to 5.7% a year earlier.
Compared to the high reached in November 2011there were 1,023,797 fewer people unemployed inthe UK, by 2015 year end.
Unemployment
For more information contact:Anthony Lahert - +44 (0) 7973 714075Neil Hargreaves - +44 (0) 7796 958750Bill Mitchell - +44 (0) 7966 772619
Published by Step Solutions Limited
The Consumer Indicators brand, trademarks and the intellectual property of the underlying data processes of CI are the sole property of Step Solutions Limited.
Copyright © Step Solutions Limited 2015. All rights reserved
2015 - review of the year
Consumers increased their indebtedness on non-property borrowing in 2015, ending the year at£178.3 billion - a significant increase of £10.4billion, which was 5.6% up on a year earlier.
Having reduced their exposure to this form of short-term debt, since its recent peak of £188.9 billion in2010, UK consumers appear to be content to see itincrease at an accelerating rate.
Consumer credit (non-property/ex student loans)
47

HOW WE CONSUME ENTERTAINMENT IN THE HOME
48
The average UK home contains 8.3 connected devices (smart phones, TVs, tablets
laptops etc). This is 12% more than a year ago according to YouGov (Omnibus,
Feb 2016). And with time spent online about 3 hours and TV viewing about 3 and
a half hours, how does the average household, divide its screen time?
78%57% 50%
Mobile technology has changed the way we consume entertainment in the home
…agree that mobile technology has changed the way they consume entertainment in
the home
…of people would now say their TV set is the main focal point of their living room
Total 16-34’s Only
To gain a picture of this new media world in the living room,
the IAB (Internet Advertising Bureau) commissioned its
Real Living research, conducted by Sparkler in November
2015. The research combined a quantitative online study
with passive monitoring of app and online usage with
in-home ethnography. This short abstract draws on data
from the quantitative and passive monitoring elements to
shed light on how devices compete for attention in the
modern living room.
How do they really divide this attention between different screens?
What really happens in the modern living room?
But people only have a finite amount of attention
People use devices for 2 hours, 59 minutes a day*
People watch TV for 3 hours, 35 minutes a day**
Research Objectives:
*UKOM data provided by comScore H2 2015
**BARB - Average daily viewing calculated by total weekly viewing figures sourced from http://www.barb.co.uk/whats-new/monthly-viewing-summary
Source: Quantitative Survey, Question Q13 “Please read the following staments about watching TV or online video content in this context and tick any that you personally agree with” and Q23 “Thinking more generally about the role of technology in your life, which of the following do you agree or disagree with?”
Base: Total–n=1010, 16-34’s–n=323.

HOW WE CONSUME ENTERTAINMENT IN THE HOME
49
Over half (57%) of those surveyed agreed that ‘mobile
technology has changed the way that I consume
entertainment in the home’. This increased to over
three quarters (78%) of 16 – 34 year olds. These changes
mean that only half (50%) of those surveyed now think
of the TV as the main focal point in the living room.The
use of connected devices at home whilst watching TV is
so prevalent that access to multiple screens should be
considered the norm. 70% of online UK adults said they
ordinarily use a connected device whilst watching TV
content at home. This increases to almost nine out of ten
(87%) of 16 – 34 year olds.
87%70%
Access to multi-screens is now the norm
…of people claim to ordinarily use a second screen whilst watching their
television set
…of those aged 16-34 years old claim to ordinarily use a second screen while watching their television set
Source: Quantitave Survey, Question Q14 “Over the course of the evening, would you ordinarily use one of your mobile devices whilst watching TV or online video content at home?”. Base: Total–n=1010, 16-34s–n=323.
The Full Real Living resultsThe full results available from www.iabuk.net/real_living
also include bio-metric data gathered two respondents
over two evenings and emphasise the variety of sources
that account for ‘high attention’ moments in the living
room – for example from connected devices – smart-
phones, tablets and laptops – in addition to the TV.
Recommendations Given the massive changes in consumer behaviour and
the disruption to the way we consume entertainment
in the home it’s vital that advertisers think about the
implications that these finding have, for example:
• There is no hierarchy of screens in the living room, only
fragmentation of attention. Connected devices should
be regarded as equals to TV when trying to connect
with highly attentive people in the home.
• The constant availability of multiple screens means
it’s vital to grab people’s attention quickly and then
hold on to it to convey your message; failure to do
so will make them turn to more compelling content on
a different screen.
For more information email:
[email protected] or visit www.iabuk.net/real_living
“There is no hierarchy of screens in the living
room, only fragmentation of attention”
By Clare O’Brien, Senior Industry Programmes Manager, IAB UK

50
ABOUT US: EPSILON
Epsilon is the global leader in creating connections between people and brands. An all-encompassing global marketing company, we harness the power of rich data and groundbreaking technologies, engaging creative and transformative ideas to get the results our clients require. We employ over 7,000 associates in 70 offices worldwide.
How can we help you?
Our hard work is reflected in the results we achieve for our clients. Their trust means we continue to grow and gain recognition from the industry.
Marketing dataUnderstand your customers’ lifestyles, attitudes and behaviours, and connect with them on
a deeper level.
Insights & strategyStep into your customers’ lives and see things as your customers see them.
Marketing technologyMake smarter, more effective connections between your brand and your customers.
Creative servicesEngage your customers with fresh, intelligent creative that connects them to your brand at an
emotional level.
Media reachWe source and select the right media, so you know that you’re reaching your audience in the right way.
51
ABOUT US: THE ABACUS ALLIANCE
The Abacus Alliance is the UK’s largest transactional data cooperative. Multi-channel retail members share and regularly update their transactional customer databases to create a combined view of what households are buying across the market. This shared database gives access to precise insight and targeting across direct mail, email, online and telemarketing channels for deeper engagement with current customers or to reach new prospects.
Over 500 multi-channel retailers contribute their customer and transactional database to the Abacus
Alliance, totalling 18m households, 26m individuals, 576m transactions and £20bn spend.
How can we help you?
Contact Us:
web: www.epsilonabacus.com
email: [email protected]
twitter: @abacusalliance
LinkedIn: Epsilon Abacus
You Tube: abacusalliance
RecruitMaximise the return on investment on your customer acquisition campaign by targeting new
customers who look like your best customers.
RetainReactivate lapsed customers and enquirers by identifying those who are likely to buy again.
RealiseTrack customer performance, benchmark against your competitive category and
measure share of wallet.

Business intelligence is becoming ever more important in a fast moving, multichannel environment. Understanding
consumers’ buying patterns can give you the competitive edge when allocating your marketing spend and planning
for the year ahead. The Annual Trends Report provides a valuable overview of revenue and marketing activity trends in
your category. However, more tailored insights are available through our Market Insight Report.
Market Share & Transaction Trends Module
Compares the purchases customers have made with your business to their spending within your competitive category. The analysis also shows how your market share changes over time and can be used to measure effectiveness of past strategies, as well as to identify opportunities for business growth.
Opportunities:
• Develop strategic plans and forecasts by studying the historical growth in the industry.
• Plan merchandising and marketing strategies for the upcoming year.• Perform due diligence when assessing most viable opportunities for
mergers, acquisitions and investments.
Seasonality Module
Identifies months with the highest potential in which to increase market share, by sending more promotions to your customer database and prospects. The information can be used to optimise a circulation plan, adjust timing of promotional offers and determine allocation of marketing resources.
Opportunities:
• Plan budget by determining optimal mail frequencies and circulation quantities by month, quarter or season.
• Determine the prime campaign dates by pinpointing when the season peaks for your business and your competitive category.
MARKET INSIGHT REPORT
52

Merchandise Category Module
Confirms what other product types your customer is purchasing across the Abacus Alliance. This analysis will identify how your customers penetrate our 21 consumer merchandise categories and will help to identify opportunities for new product lines that appeal to your buyers.
Opportunities:
• Determine customer loyalty and discretionary spending power by analysing the total amount your households are allocating to your category versus other categories.
• Identify new merchandise lines, partnerships, acquisitions, or spin-off opportunities.
Demographic Profile Module
Provides a profile of your buyers compared with your competitive category and the Alliance as a whole. The report covers key demographic variables such as age, household income and presence of children, along with lifestyle interests, online purchase activity and newspaper readership.
Opportunities:
• Formulate advertising and creative strategies for each marketing channel.
• Develop niches and/or expand into broader markets by identifying demographic differences between your company and the competitive category.
• Identify most valuable and loyal customer markets by profiling those households that account for a majority of your sales amount.
53

54
CONTACT US
Find out more about membership
Ben and his team introduce new members to the Abacus Alliance, helping to
grow the depth and breadth of data whilst ensuring it is constantly refreshed
with new and varied transactional and web browsing data information. Fifty-five
retail brands joined us in 2015, adding new transactions for over 5 million UK
households. Please speak to him to learn more about how the Alliance database
and contributing data works.
Ben CollierBusiness Development Director
t: +44 (0)20 8943 8011m: +44 (0)7717 767 [email protected]
Want to discuss our solutions and innovations?
Dylan is responsible for overall leadership of the Business Development and
Client Management teams. His experience and knowledge ensures that Abacus
is constantly providing new, relevant services that keep Alliance members ahead
of their competition. Please contact him if you’d like to provide feedback about
our solutions or discuss ideas for future innovation.Dylan JenkinsSales Director
t: +44 (0)20 8943 8023m: +44 (0)7919 534 799 [email protected]
Customer retention and insight products
Michele is responsible for Abacus’ strategic services team. He overseas the
suite of bespoke analysis and reports to help members understand more about
their customers, which in turn maximizes revenue and return on investment.
Please contact him if you would like further information on our customer
retention or insight products. Michele Masnaghetti Strategic Services Director
t: +44 (0) 20 8943 8036 m: +44 (0)7500 049 171 [email protected]

TRUSTED BY:
55

telephone: +44 (0) 20 8943 8000web: www.epsilonabacus.comtwitter: @abacusalliance LinkedIn: Epsilon AbacusYou Tube: abacusalliance
Find out more


![The Main Shopping Season Trends [Infographic]](https://static.documents.pub/doc/80x56/559f26421a28ab48578b475a/the-main-shopping-season-trends-infographic.jpg)


