36
The 2016 Report Card on Parks: Spotlight on the Community Parks Initiative

THE 2016 REPORT C ARD ON PARKS ❁ i
The 2016 Report Card on Parks: Spotlight on the Community Parks Initiative

i i ✿ NEW YORKERS FOR PARKS
Orchard Beach, the Bronx

THE 2016 REPORT C ARD ON PARKS ❁ 1
2 Introduction to the Report Card on Parks
3 Map of Survey Sites
4 Report Card on Parks Survey
6 Scores
6 Feature Scores
10 Feature Findings
12 The Bronx
14 Brooklyn
16 Manhattan
18 Queens
20 Staten Island
22 Park Findings
24 Recommendations
28 Appendices
28 Park Exterior Scores
28 Weekend Scores
29 Detailed Methodology
Table of Contents

2 ✿ NEW YORKERS FOR PARKS
In 2003, New Yorkers for Parks (NY4P) released the first Report Card on Parks, an award-winning, data-driven evaluation of the maintenance conditions of play-grounds, small and large parks, beaches, and turf fields. Over the past fourteen years, we have published thirteen Report Cards, evaluating almost 300 parks, and covering thousands of acres of parkland.
The Report Card on Parks was designed to achieve the following goals:
• Provide an independent assessment of park performance against defined maintenance benchmarks.
• Highlight high-performing parks, drawing attention to the lessons we can learn from their successful maintenance and upkeep.
• Shine a spotlight on low-performing parks, drawing attention to immediate maintenance issues and encouraging a more efficient and equitable distribution of limited resources towards the parks that are most in need.
For the latest Report Card on Parks: Spotlight on the Community Parks Initiative, NY4P returns to evaluating neighborhood parks, sized between 1 and 20 acres, for the first time since 2008. Unlike the larger, high-profile parks in New York City, neighborhood parks are often solely dependent on public fund-ing and, as previous Report Cards have documented, often receive inadequate maintenance attention.
Neighborhood parks in New York City are the subject of renewed attention and reinvestment under the administration of Mayor Bill DeBlasio. NYC Parks Com-missioner Mitchell Silver announced the administration’s commitment to equity in parks, the Community Parks Initiative (CPI), in 2014. CPI identifies 55 priority park investment zones across New York City’s five boroughs, and has funded the redesign and reconstruction of 47 parks within the first two years of the program. NYC Parks followed a data-driven process to determine which parks to invest in. The agency analyzed 20 years of capital invest-ment data for parks citywide, identifying 215 parks across the city that received less than a quarter million dollars ($250,000)
between 1992 and 2013. Additionally, the agency identified priority zones: 55 neighborhoods that are densely pop-ulated, growing, and home to a high-er-than-average percentage of families with incomes below the poverty line. In all, 134 parks were identified as having extreme capital, or big-budget, needs within the priority zones.1 To date, invest-ment commitments made in CPI zones has been limited to parks that are small in size – less than five acres, on average.
1 “NYC Parks: Framework for an Equitable Future,” 2014, pp 12, 14.
NY4P designed the 2016 Report Card to focus on the maintenance conditions of the neighborhood parks, between 5 and 20 acres in size, in priority zones. These parks were too large to be included in CPI’s transformative model. 35 parks meet NY4P’s criteria for inclusion, and were surveyed for this report. Trained field researchers visited and assessed these parks, collecting thousands of data points on conditions and maintenance. NY4P’s analysis of these true neighborhood parks in CPI priority zones will help agency and elected officials continue to prioritize maintenance and capital improvements in the communities that need them the most.
Introduction to the Report Card on ParksThe Report Card on Parks is the only independent, citywide evaluation of the maintenance and conditions of New York City’s public parks.

THE 2016 REPORT C ARD ON PARKS ❁ 3
Introduction to the Report Card on Parks
BRONX
1. Aqueduct Walk2. Barretto Point Park3. Bridge Park4. Concrete Plant Park5. Mill Pond Park6. Rainey Park7. Starlight Park8. Tremont Park
BROOKLYN
9. Betsy Head Park10. Breukelen Ballfields11. Brower Park12. Bushwick Inlet Park13. Cooper Park14. Herbert Von King Park15. Lincoln Terrace Park16. Lindower Park17. Maria Hernandez Park18. St. John’s Recreation Center
MANHATTAN
19. Col. Young Playground20. Harlem River Park21. Jackie Robinson Park22. J. Hood Wright Park23. Riverside Park (135th to
153rd Streets)24. Sara D. Roosevelt Park25. Thomas Jefferson Park26. Tompkins Square Park
QUEENS
27. Beach 9 Playground28. Beach 17 Playground29. Beach 30th Street Playground30. Elmhurst Park31. Hallets Cove Playground
STATEN iSLAND
32. Cpl. Thompson Park33. Heritage Park34. Von Briesen Park35. Walker Park
2016 Report Card on Parks: Map of Survey Sites
34
35
3332
31
2928 27
30
20
23
24
26
22
25
19
21
12
10
13
17
16
14
15
119
18
47
3 8
62
1
5
LEGEND
• Survey sitesn New York City Parksn Community Parks Initiative Zones

4 ✿ NEW YORKERS FOR PARKS
In 2005, the Report Card on Parks received a Community Indicators Award from the Community Indicators Con-sortium, a program of the Brookings Institution’s Urban Markets Initiative. A full discussion of the methodology can be found in the Detailed Methodology section of this report.
PARK SELECTiON
The Report Card on Parks: Spotlight on the Community Parks Initiative surveys NYC Department of Parks and Recreation (NYC Parks) properties between 5 and 20 acres in size in the 55 CPI zones. The following types of properties were removed from the study: highway properties, un-developed parkland, islands, golf courses, marshes, beaches, and forests. The final survey universe includes 35 parks, listed on the previous page.
SURVEY SCHEDULE
Survey work was conducted in the summer months of 2015, beginning in late June of 2015, and concluded in late August. Surveyors, working in teams of at least two, visited parks between 10am and 5pm on Tuesdays, Wednesdays, and Thursdays. Surveyors did not visit parks the day after the Fourth of July to allow NYC Parks staff time to clean after holiday celebrations. A subset of parks was re-sur-veyed on Saturdays, between 10 a.m. and 5 p.m. The results of those evaluations can be found in the Appendix of this report, on page 28.
SURVEY PROTOCOL
The Report Card on Parks examines 12 categories of park features: athletic fields, bathrooms, courts, drinking fountains, immediate environment, lawns, natural areas, pathways, playgrounds, sitting areas, trees, and water bodies. Each feature is evaluated for performance in four cate-gories: maintenance, cleanliness, safety, and structural integrity. Surveyors record feature assessments on tablet computers and provide photographic documentation for each unique feature evaluation.
LETTER GRADES
Each park received a feature score (0 to 100) for each of the 12 features present in the survey zones. Parks were not penalized if they did not contain all 12 features. Feature scores were then aggregated and weighted to arrive at an overall park score of 0 to 100. A detailed accounting of the scoring methodology can be found in the Appendix. Overall park numerical scores correspond to the following letter grade conversions:
The Survey
Grades Raw Numerical Grade Letter Grade97-100 A+93-96 A90-92 A-87-89 B+83-86 B80-82 B-77-79 C+73-76 C70-72 C-60-69 D59 and below F
This report builds on New Yorkers for Parks’ award- winning Report Card on Parks survey methodology, first implemented in 2003.

THE 2016 REPORT C ARD ON PARKS ❁ 5
Scores

6 ❀ NEW YORKERS FOR PARKS
This section discusses the performance of park features across the 35 parks surveyed, citing the conditions and areas that scored poorly, and that are therefore in greatest need of attention. These scores consider each feature form individually, providing a system-wide grade for each park feature. As combined scores, these figures mask considerable variability in the performance of features from park to park. Nonethe-less, they provide a high-level view of the systemic conditions in parks, whether good or bad.
Athletic Fields
69 Harlem River Park Bushwick Inlet Park
The athletic fields score reflects the conditions found at natural grass, asphalt, and synthetic fields for sports like soccer, football, and baseball.
The most common problems with athletic fields were general maintenance needs. Nearly a quarter of natural grass fields had unacceptable bench and bleacher conditions. Two thirds of asphalt fields had extensive cracking and weed growth on the playing surfaces. Almost half of synthetic turf fields exhibited maintenance needs like loose seams or areas where the surfacing has worn away.
Bathrooms
76 Lindower Park Mill Pond Park
The bathrooms score reflects the conditions found at each bathroom, often called comfort stations by NYC Parks.
Two out of every five bathrooms evaluated had stall doors that could not lock. Bath-rooms had clear day-to-day maintenance issues, as well. One in five bathrooms did not have sufficient toilet paper. One third of all bathrooms did not have sufficient hand soap or sanitizer present. One in five bathrooms had unacceptable foul odors and/or dirty conditions.
Feature Scores
The Report Card on Parks assesses the conditions of 12 features within each of the 35 parks in our survey. During a typical field visit, surveyors evaluate the condition of each bathroom, court, drinking fountain, field, lawn, natural area, playground, and sitting area. Surveyors evaluate the park-wide condition of trees, pathways, and water bodies.
Grades Raw Numerical Grade Letter Grade97-100 A+93-96 A90-92 A-87-89 B+83-86 B80-82 B-77-79 C+73-76 C70-72 C-60-69 D59 and below F

THE 2016 REPORT C ARD ON PARKS ✾ 7
Courts
84 Maria Hernandez Park Harlem River Park
The courts score reflects the conditions found at all outdoor basketball, handball, tennis, bocce, volleyball and hockey facilities.
Half of the courts surveyed showed poor general maintenance conditions. Cracked surfaces and holes, creating dangerous trip hazards, affected 16% of the courts. A third of all courts lacked basic equipment such as basketball nets.
Drinking Fountains
55 Col. Young Park Breukelen Ballfields
The drinking fountains score reflects the con-ditions found at each drinking fountain.
Two out of every five drinking fountains autofailed due to thoroughly unsafe, unclean, or inoperable conditions. Some drinking fountains had multiple negative conditions that would independently cause the feature to autofail. 17% of the fountain basins showed evidence of algae or other unsanitary substances. 15% of the fountains were blocked by standing water or other debris. One in five foun-tains showed signs of needing mainte-nance attention for less egregious condi-tions, such as having deteriorated paint.
immediate Environment
90 Bridge Park Tompkins Square Park
The immediate environment score reflects surveyor evaluations of how well a park is in-sulated from potential negative impacts from its surroundings. Intrusive odors, emissions, exhaust, and excessive noise are monitored, and park access is taken into consideration.
One in five parks was found to be negatively affected by disruptive noise emanating from the park’s exterior, such as highway, truck, train, or construction noise pollution. Surveyors noticed noxious odors surrounding almost 20% of the parks surveyed.
Lawns
76 Tompkins Square Park Barretto Point Park
The lawns score reflects conditions found at all lawns, landscaped areas, and gardens, as well as the conditions of trees found within lawns, landscaped areas, and gardens.
28% of the areas surveyed had unaccept-able conditions, such as patches of over-grown grass, discolored grass, or bare earth. One in five areas was infested with weeds, had trees that were not in good condi-tion, and/or was impaired by dangerous amounts of broken glass. Two in five areas had general unresolved maintenance issues, such as poor plant maintenance.

8 ❀ NEW YORKERS FOR PARKS
Natural Areas
85 Bridge Park Riverside Park
The natural areas score reflects conditions found in spaces that retain some degree of wild nature and native ecosystems, providing habitat for native plants and animals. These are non-manicured spaces such as wetlands, forests, and meadows.
A third of the natural areas in the parks were infested by invasive plant species, and two in five of them had unresolved maintenance issues like needing litter to be picked up.
Pathways
88 Aqueduct Walk Beach 17 Playground
The pathways score reflects conditions found in park walkways made of asphalt, dirt, turf, pavers, brick and concrete. The pathways score includes benches along pathways, as well as fencing lining pathways.
Ten percent of the pathways in parks had cracks or holes that were significant enough to affect a user’s ability to navigate the path. Fifteen percent were suffering from structural deterioration, including spalling paving stones or missing segments. A third of pathways had some unresolved maintenance issue, such as needing new paint on benches.
Playgrounds
88 Sara D. Roosevelt Park Walker Park
The playgrounds score reflects conditions found at all playground areas and for all playground equipment.
The most consistent challenges to safety and clean conditions at playgrounds were degraded safety surfacing and the pres-ence of litter. One in ten playgrounds was found to have safety surfacing that was cracked, peeling, or wearing away, and/or significant amounts of litter.
Sitting Areas
87 Lindower Park Starlight Park
The sitting areas score reflects conditions found at places in parks that contain a grouping of benches, picnic tables, chess tables, and other discrete areas for sitting, including barbeque areas.
Persistent maintenance issues negatively affected the scores of sitting areas in many parks. Although one in ten sitting areas had benches showing significant damage, more persistent were incidences of litter and general maintenance needs such as paint and repairs.
Feature Scores (continued)

THE 2016 REPORT C ARD ON PARKS ✾ 9
Trees
90 St. John’s Recreation Center J. Hood Wright Park
The trees score reflects conditions found for trees contained within tree pits in the park. Trees on lawns are evaluated in the lawns score.
The most significant problems identified for trees in tree pits were consistently related to the health and status of the trees themselves. 15% of the parks had dead or low-hanging branches, and one out of five parks had stumps or dead trees requiring removal. In addition, tree pits were often in poor physical shape: one out of five parks had tree pits with disrupted pavers, weed growth, or general mainte-nance problems like poor mulching or the presence of litter.
Water Bodies
77 Hallets Cove Park Starlight Park
The water bodies score reflects conditions found on inland water bodies, such as lakes and creeks, as well as shoreline areas along the harbor and rivers.
Litter and general maintenance needs were consistent challenges to clean and well-maintained water bodies and water-front areas. Over half of the water bodies surveyed were affected by man-made litter and/or undesirable natural debris.
10 ❀ NEW YORKERS FOR PARKS
Feature Findings
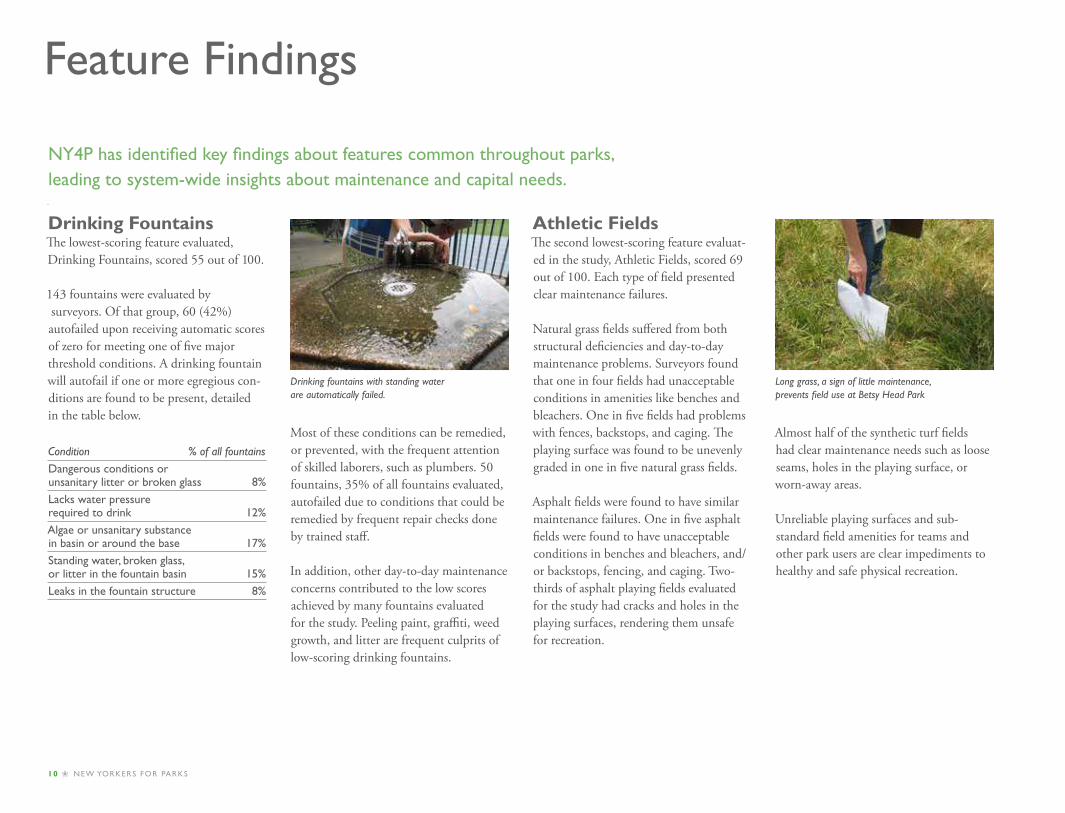
Drinking FountainsThe lowest-scoring feature evaluated, Drinking Fountains, scored 55 out of 100.
143 fountains were evaluated by surveyors. Of that group, 60 (42%) autofailed upon receiving automatic scores of zero for meeting one of five major threshold conditions. A drinking fountain will autofail if one or more egregious con-ditions are found to be present, detailed in the table below.
Condition % of all fountainsDangerous conditions or unsanitary litter or broken glass 8%Lacks water pressure required to drink 12%Algae or unsanitary substance in basin or around the base 17%Standing water, broken glass, or litter in the fountain basin 15%Leaks in the fountain structure 8%
Most of these conditions can be remedied, or prevented, with the frequent attention of skilled laborers, such as plumbers. 50 fountains, 35% of all fountains evaluated, autofailed due to conditions that could be remedied by frequent repair checks done by trained staff.
In addition, other day-to-day maintenance concerns contributed to the low scores achieved by many fountains evaluated for the study. Peeling paint, graffiti, weed growth, and litter are frequent culprits of low-scoring drinking fountains.
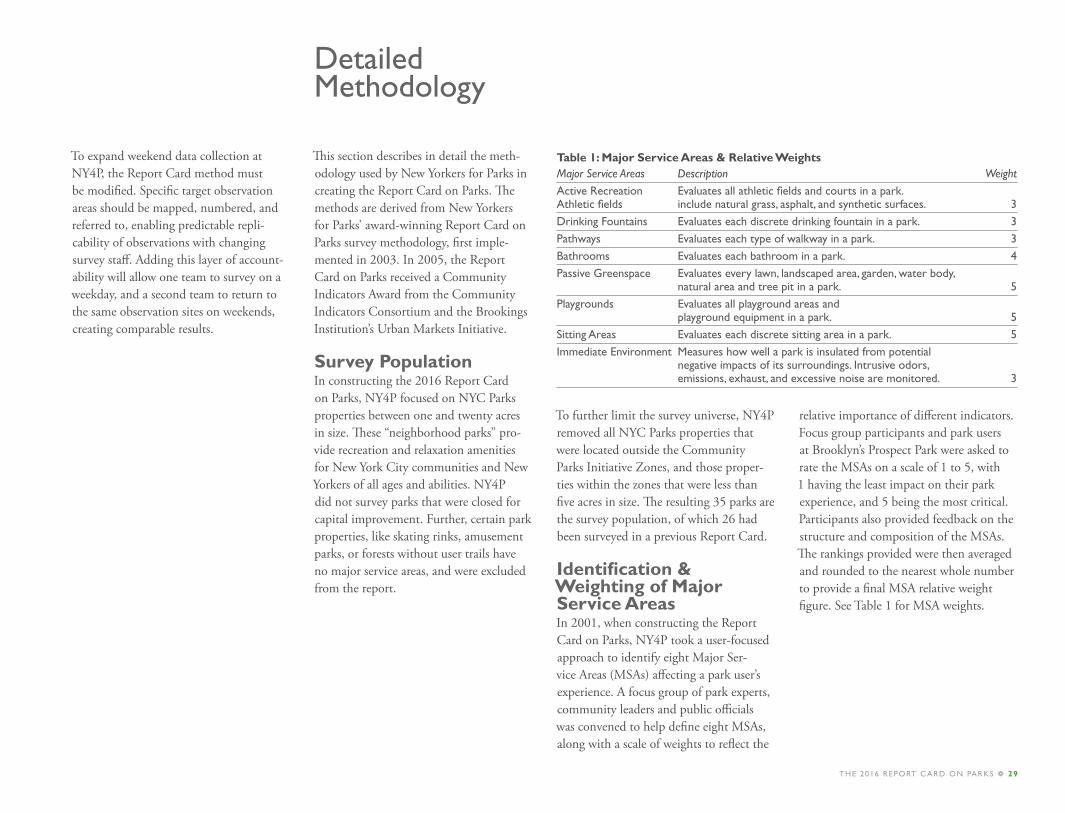
Athletic FieldsThe second lowest-scoring feature evaluat-ed in the study, Athletic Fields, scored 69 out of 100. Each type of field presented clear maintenance failures.
Natural grass fields suffered from both structural deficiencies and day-to-day maintenance problems. Surveyors found that one in four fields had unacceptable conditions in amenities like benches and bleachers. One in five fields had problems with fences, backstops, and caging. The playing surface was found to be unevenly graded in one in five natural grass fields.
Asphalt fields were found to have similar maintenance failures. One in five asphalt fields were found to have unacceptable conditions in benches and bleachers, and/or backstops, fencing, and caging. Two-thirds of asphalt playing fields evaluated for the study had cracks and holes in the playing surfaces, rendering them unsafe for recreation.
Almost half of the synthetic turf fields had clear maintenance needs such as loose seams, holes in the playing surface, or worn-away areas.
Unreliable playing surfaces and sub-standard field amenities for teams and other park users are clear impediments to healthy and safe physical recreation.
NY4P has identified key findings about features common throughout parks, leading to system-wide insights about maintenance and capital needs.
Drinking fountains with standing water are automatically failed.
Long grass, a sign of little maintenance, prevents field use at Betsy Head Park

THE 2016 REPORT C ARD ON PARKS ✾ 11
BathroomsBathrooms scored 76 out of 100 when examined across all parks.
The low scores received by bathrooms are largely due to day-to-day maintenance failures. 40% of the bathrooms surveyed had stall doors that did not lock, effec-tively taking those stalls out of service for users concerned with privacy. One in five bathrooms were found to lack toilet paper. One third of all bathrooms did not have soap and/or hand sanitizer. When comfort stations persistently lack basic supplies, they pose a threat to public health condi-tions. Hand-in-hand with this distressing absence of supplies were unacceptable dirty and unsanitary conditions found in bathrooms. One in five bathrooms was found to have foul odors and/or dirty conditions.
To be useful and inviting to park users, bathrooms must be clean and safe. They must also be on site and accessible. One in four parks evaluated for this study does not have a permanent bathroom that is re-liably open to the public. Of the 35 parks evaluated, three (9%) have bathrooms inside recreation centers, which close when the recreation center closes – as early as 4:00 pm on some weekend days. Seven parks (20%) have no permanent bath-rooms whatsoever, including two parks (6%) which are only served by portable toilets that are frequently plagued by un-sanitary conditions or locked altogether.
Portable toilets are often locked and inaccessible, like these at Lincoln Terrace Park.

12 ❀ NEW YORKERS FOR PARKS
The Bronx
Average Bronx Park Score
80
4
7
3 8
6
2
1
5
Survey Sites
• Survey Siten Bronx Parks n Community Parks
Initiative Zones
1. Aqueduct Walk2. Barretto Point Park3. Bridge Park4. Concrete Plant Park5. Mill Pond Park6. Rainey Park7. Starlight Park8. Tremont Park

THE 2016 REPORT C ARD ON PARKS ✾ 13
BronxPark Scores
Aqueduct Walk
83B
-
-
82
84
100
60
-
90
91
85
-
-
University Heights
14
Bronx 7
8
Barretto Point Park
82B-
-
96
91
100
18
59
84
90
88
90
-
82
Hunts Point
17
Bronx 2
11
Bridge Park
90A-
-
-
-
100
64
92
-
89
-
100
100
83
Highbridge
16
Bronx 4 & 5
7
Concrete Plant Park
78C+
-
71
-
50
86
63
87
100
-
95
-
45
Hunts Point North
17
Bronx 2
6
Mill Pond Park
88B+
-
97
100
50
100
91
-
100
100
73
100
65
Harlem River
8
Bronx 4
15
Rainey Park
74C
42
75
-
71
100
67
-
83
-
-
89
-
Longwood
17
Bronx 2
8
Starlight Park
70C-
0
0
89
0
100
100
83
100
100
97
78
94
West Farms
17
Bronx 9
12
Tremont Park
79C+
56
87
89
33
100
64
90
54
94
91
-
-
Tremont
15
Bronx 6
15
GRADING CATEGORIES n EXCELLENT 97-90 n VERY GOOD 89-80 n SATISFACTORY 79-70 n CHALLENGED 69-60 n UNSATISFACTORY 59 and below
SCORE
GRADE
ATHLETIC FIELDS
BATHROOMS
COURTS
DRINKING FOUNTAINS
IMMEDIATE ENVIRONMENT
LAWNS
NATURAL AREAS
PATHWAYS
PLAYGROUNDS
SITTING AREAS
TREES
WATER BODIES
NEIGHBORHOOD
COUNCIL DISTRICT
COMMUNITY BOARD
ACRES

14 ❀ NEW YORKERS FOR PARKS
Brooklyn
83Survey Sites
• Survey Siten Brooklyn Parks n Community Parks
Initiative Zones
1. Betsy Head Park2. Breukelen Ballfields3. Brower Park4. Bushwick Inlet Park5. Cooper Park6. Herbert Von King Park7. Lincoln Terrace Park8. Lindower Park9. Maria Hernandez Park10. St. John’s Recreation Center
4
2
5
9
8
6
7
3
1
10
Average Brooklyn Park Score

THE 2016 REPORT C ARD ON PARKS ✾ 15
SCORE
GRADE
ATHLETIC FIELDS
BATHROOMS
COURTS
DRINKING FOUNTAINS
IMMEDIATE ENVIRONMENT
LAWNS
NATURAL AREAS
PATHWAYS
PLAYGROUNDS
SITTING AREAS
TREES
WATER BODIES
NEIGHBORHOOD
COUNCIL DISTRICT
COMMUNITY BOARD
ACRES
Betsy Head Park
73C
45
81
72
75
64
91
-
55
-
-
93
-
Brownsville
41
Brooklyn 16
11
Brower Park
90A-
100
92
96
50
100
86
-
89
92
100
100
-
Crown Heights
36
Brooklyn 8
7
Breukelen Ballfields
87B+
86
97
84
84
100
69
-
83
88
-
89
-
East New York
42
Brooklyn 18
16
Bushwick Inlet Park
87B+
90
95
-
55
100
81
-
90
85
90
100
85
Williamsburg
33
Brooklyn 1
9
Cooper Park
92A-
-
88
-
100
100
89
-
100
92
79
100
-
Williamsburg
34
Brooklyn 1
6
Herbert Von King
Park
73C
0
90
66
0
100
70
-
88
94
76
86
-
Bedford Stuyvesant
36
Brooklyn 3
8
Lincoln Terrace
Park
73C
45
59
92
59
100
49
-
87
82
73
81
-
Weeksville
41
Brooklyn 8
20
Lindower Park
88B+
-
79
81
100
77
95
-
100
96
75
-
-
Mill Basin
46
Brooklyn 18
7
Maria Hernandez
Park
77C+
74
46
87
33
100
85
-
100
86
-
100
-
Bushwick
34
Brooklyn 4
7
St. John’s Recreation
Center
93A
91
-
93
96
100
76
-
97
100
100
67
-
Crown Heights
36
Brooklyn 8
9
GRADING CATEGORIES n EXCELLENT 97-90 n VERY GOOD 89-80 n SATISFACTORY 79-70 n CHALLENGED 69-60 n UNSATISFACTORY 59 and below
BrooklynPark Scores

16 ❀ NEW YORKERS FOR PARKS
Manhattan
72Survey Sites
• Survey Siten Manhattan Parks n Community Parks
Initiative Zones
1. Col. Young Playground2. Harlem River Park3. Jackie Robinson Park4. J. Hood Wright Park5. Riverside Park6. Sara D. Roosevelt Park7. Thomas Jefferson Park8. Tompkins Square Park
Average Manhattan Park Score
2
5
6
8
4
7
1
3

THE 2016 REPORT C ARD ON PARKS ✾ 17
SCORE
GRADE
ATHLETIC FIELDS
BATHROOMS
COURTS
DRINKING FOUNTAINS
IMMEDIATE ENVIRONMENT
LAWNS
NATURAL AREAS
PATHWAYS
PLAYGROUNDS
SITTING AREAS
TREES
WATER BODIES
NEIGHBORHOOD
COUNCIL DISTRICT
COMMUNITY BOARD
ACRES
Col. Young Playground
74C
81
89
87
0
100
89
-
-
59
86
-
-
Harlem
9
Manhattan 10
7
Harlem River Park
51F67
-
89
31
64
38
-
0
-
85
-
-
Harlem
8, 9
Manhattan 11
6
J. Hood Wright Park
75C
40
-
76
50
100
54
-
83
88
78
89
-
Washington Heights
10
Manhattan 12
7
Jackie Robinson Park
72C-
67
40
91
50
77
84
81
79
73
87
89
-
Sugar Hill
9
Manhattan 9, 10
13
Riverside Park
87B+
-
100
-
60
100
93
88
86
92
74
100
-
Hamilton Heights
7
Manhattan 9
13
Sara D. Roosevelt
Park
63D
44
60
74
22
64
70
-
90
58
83
75
-
Lower East Side
1
Manhattan 3
8
Thomas Jefferson Park
71C-
94
40
81
0
100
90
-
96
86
62
92
-
East Harlem
8
Manhattan 11
13
Tompkins Square Park
79C+
79
61
82
71
77
85
-
80
82
87
89
-
East Village
2
Manhattan 3
11
GRADING CATEGORIES n EXCELLENT 97-90 n VERY GOOD 89-80 n SATISFACTORY 79-70 n CHALLENGED 69-60 n UNSATISFACTORY 59 and below
Manhattan Park Scores

18 ❀ NEW YORKERS FOR PARKS
Queens
88Survey Sites
• Survey Siten Queens Parks n Community Parks
Initiative Zones
1. Beach 9 Playground2. Beach 17 Playground3. Beach 30th Street Playground4. Elmhurst Park5. Hallets Cove Playground
5
3 21
4
Average Queens Park Score

THE 2016 REPORT C ARD ON PARKS ✾ 19
SCORE
GRADE
ATHLETIC FIELDS
BATHROOMS
COURTS
DRINKING FOUNTAINS
IMMEDIATE ENVIRONMENT
LAWNS
NATURAL AREAS
PATHWAYS
PLAYGROUNDS
SITTING AREAS
TREES
WATER BODIES
NEIGHBORHOOD
COUNCIL DISTRICT
COMMUNITY BOARD
ACRES
Beach 9 Playground
89B+
-
100
83
68
100
78
-
100
94
87
86
-
Far Rockaway
31
Queens 14
6
Beach 17 Playground
83B79
92
-
32
77
84
-
100
96
90
86
-
Far Rockaway
31
Queens 14
14
Beach 30th St. Playground
97A+
100
100
-
95
100
85
-
100
97
100
-
-
Wave Crest
31
Queens 14
7
Elmhurst Park
97A+
100
77
-
100
100
95
100
100
100
100
100
-
Elmhurst
25
Queens 4
6
Hallets Cove Playground
74C
75
-
81
0
100
84
-
89
87
-
86
67
Astoria
22
Queens 1
6
GRADING CATEGORIES n EXCELLENT 97-90 n VERY GOOD 89-80 n SATISFACTORY 79-70 n CHALLENGED 69-60 n UNSATISFACTORY 59 and below
QueensPark Scores

20 ❀ NEW YORKERS FOR PARKS
Staten Island
84Survey Sites
• Survey Siten Staten Island Parks n Community Parks
Initiative Zones
1. Cpl. Thompson Park2. Heritage Park3. Von Briesen Park4. Walker Park
3
4
21
Average Staten island Park Score

THE 2016 REPORT C ARD ON PARKS ✾ 21
SCORE
GRADE
ATHLETIC FIELDS
BATHROOMS
COURTS
DRINKING FOUNTAINS
IMMEDIATE ENVIRONMENT
LAWNS
NATURAL AREAS
PATHWAYS
PLAYGROUNDS
SITTING AREAS
TREES
WATER BODIES
NEIGHBORHOOD
COUNCIL DISTRICT
COMMUNITY BOARD
ACRES
Cpl. Thompson Park
79C+
90
93
78
43
100
49
-
95
88
-
67
-
West New Brighton
49
Staten Island 1
11
Heritage Park
89B+
-
-
-
-
86
86
83
100
-
-
-
-
West New Brighton
49
Staten Island 1
10
Von Briesen Park
83B
-
-
-
86
86
66
78
91
-
85
-
-
Fort Wadsworth
50
Staten Island 1
14
Walker Park
86B90
83
75
29
100
85
-
100
88
100
100
-
Randall Manor
49
Staten Island 1
5
GRADING CATEGORIES n EXCELLENT 97-90 n VERY GOOD 89-80 n SATISFACTORY 79-70 n CHALLENGED 69-60 n UNSATISFACTORY 59 and below
Staten island Park Scores

22 ✿ NEW YORKERS FOR PARKS
Harlem River ParkSurveyors documented poor day-to-day maintenance throughout Harlem River Park. Drinking Fountains in the park were found in particularly poor condition, and scored a mere 31 out of 100. Four of the six fountains were automatically failed due to maintenance conditions including hav-ing no water flow, standing water in basins, and general uncleanliness. Several lawns in the park received poor scores due to litter and maintenance issues. Some features in Harlem River Park were automatically failed due to particularly dangerous and unsanitary conditions: park pathways, and half of the lawns, were automatically failed due to the presence of human feces and used condoms.
Yet maintenance attention alone cannot solve the poor conditions present at Har-lem River Park. The athletic fields are in need of special synthetic turf maintenance: surveyors found multiple uneven sections,
and many gaps and holes in the playing surfaces. Fences and bleachers were also found to be in poor condition in this park. Perhaps most importantly, Harlem River Park has no bathroom. It was not penal-ized for not having one, but the effects from the absence of this vital amenity are reflected in the dangerous and unsanitary conditions found elsewhere in the park.
Sara D. Roosevelt ParkPoor maintenance practices contributed to several low-scoring park features in Sara D. Roosevelt Park. Bathrooms in the park scored 60 out of 100, because of dirty conditions and graffiti observed within the facilities. In addition, several key amenities within the bathrooms did not work, including stall doors that did not close, and toilets that did not operate. Drinking Fountains in the park scored 22 out of 100. Four out of the six fountains automatically failed due to conditions stemming from poor maintenance, such as the presence of algae and standing water in the fountain basins.
Capital problems also contributed to poor scores in the Sara D. Roosevelt Park evaluation. One field was under construction when NY4P surveyed Sara D. Roosevelt Park, however a second asphalt athletic field within the park was automatically failed, as the playing surface has significant structural deterioration. Playgrounds in the park
scored 48 out of 100, with one play-ground automatically failing due to missing play equipment, dangerous areas in need of repair, and haphazard safety surfacing that creates slip and trip hazards.
Park Findings
Very poor conditions, comprised of maintenance and capital failures, were observed by surveyors at two neighborhood parks in particular. Sara D. Roosevelt and Harlem River Parks, the only sites to achieve grades below “C,” are clear candidates for a targeted renewal approach.
Harlem River Park is cut off from the neighborhood by streets and highway bridges.
This popular neighborhood park is aging and does not have adequate maintenance.

THE 2016 REPORT C ARD ON PARKS ❁ 23
Park Findings Recommendations

24 ✿ NEW YORKERS FOR PARKS
1. Expand Park investment Programs NY4P recommends that NYC Parks ex-pand the scope and reach of the Commu-nity Parks Initiative to prioritize invest-ment and steer resources to all park within the CPI zones, regardless of size.
NYC Parks has two terrific programs intended to prioritize parks with the highest needs and greatest reach for capital investment: the Anchor Parks program and CPI. The Anchor Parks program, which was announced in August 2016, identified one park in each borough to receive $30 million for a complete capital transformation. CPI has targeted 60 parks and playgrounds located in 55 under-served neighborhoods for improvement since launching in 2014. In reaching for greater equity in how public resources are allocated, these programs are bring-ing much-needed attention to the right communities, but by only including small parks and playgrounds in CPI, the city is leaving more important parks out of the picture. We know that larger-sized parks – what we are calling neighborhood parks – really strengthen a community, providing
spaces for active play, sports, and family gatherings, as well as places to be quiet, contemplative, and connected to the natu-ral world all at once. Despite their impor-tance, these critical neighborhood parks are often overlooked in New York City’s parks system: while they are large enough to serve diverse groups of park users, they are often too small to be a borough-wide or city-wide draw.
In neighborhood parks throughout the CPI priority zones, NY4P found consis-tent maintenance issues and aging, worn infrastructure in need of renovation or replacement. Too many of New York City’s neighborhood parks in these zones will continue to languish unless they are awarded transformative capital change. The de Blasio administration has created very successful models for that change, and should seize the opportunity to expand them.
2. Hire Maintenance Staff To keep our parks clean and well cared-for, NYC Parks must add more full-time main-tenance and operations staff for day-to-day work in parks.
NY4P commends the recent efforts by NYC Parks to manage staffing through innovative techniques that improve the efficiency and timeliness of staff deploy-ment; however we believe that the agency needs more full-time, on the ground staff to be permanent resources in our city parks. For example, NYC Parks is studying the proven best practice of zone manage-ment, but that will only work with enough permanent, trained employees.
The conditions found by NY4P field sur-veyors show that current levels of service are not keeping all of our parks clean and safe. However, many of the noted conditions can be resolved by daily service crews working for NYC parks in mainte-nance and operations titles. Adding more City Park Workers (CPWs) for neighbor-hood park maintenance will ensure more frequent and more responsive attention is available throughout the city. Seasonal workers were added to the agency’s payroll in the past fiscal year, which greatly helped with the annual shortage of workers in neighborhood parks staff that is created by
the openings of the beaches and pools, but there is a real need for permanent, trained maintenance & operations staff through-out the city.
Expanding the NYC Parks workforce at this level dovetails with several goals and initiatives outlined in the de Blasio administration’s long-range policy plan, OneNYC, which lays out goals for quali-ty-of-life measures, including close access to open spaces, and stronger community socio-economic resiliency. NY4P believes that the full-time employment opportu-nities that could be created through NYC Parks are just the kind of well-paying, stable and green jobs that policy-mak-ers across the board have an interest in creating to close the equity gap and create resilience in communities.
Recommendations
Only small parks like Astoria Health Playground in Queens have been the focus of CPI.
Skilled park workers like Haywood Lige are key to clean and safe parks.

THE 2016 REPORT C ARD ON PARKS ❁ 25
3.improve Parks Access by Fixing Key infrastructure NYC Parks must improve the critical park infrastructure needed in neighborhood parks to makes parks useable for residents of all ages and abilities: drinking fountains and bathrooms.
Adding bathrooms to parks that lack permanent facilities will improve condi-tions in neighborhood parks across the city, and make the sites more friendly and accessible for seniors, families, and every-one else in between. Seven of the 35 parks in this report do not have permanent bathroom facilities and three additional parks are only served by restricted-access bathroom facilities, such as recreation center bathrooms.
The City is planning to improve the exist-ing comfort stations at one of the parks surveyed, Betsy Head Park in Brooklyn, but nearly a third of the parks surveyed for this report lack permanent public bathroom facilities. In some parks without permanent bathroom facilities, NY4P surveyors documented the presence of human waste. This unsanitary condition, in addition to being a public health hazard,
affects overall usership and lowers visitor numbers. Park bathrooms are maintained by daily service crews, but also need specially trained plumbing professionals in-house, or contracted independent plumbers to keep these everyday park features in good working order. Addition-al plumbing staff is also needed to keep seasonal fixtures like spray showers and drinking fountains in good repair. With clean, functional bathrooms, all of our parks can be true community resources to users of ages and abilities.
NY4P supports the de Blasio administra-tion’s goal to install or repair 500 water fountains citywide, and we suggest using a Requirements Contract to replace the aging water fountains found in our city parks. Throughout our years of producing report cards, NY4P has found an unac-ceptable number of fountains with little or no water pressure, but also an unaccept-
able amount of water fountains with conditions that repel users – from flooding in basins and on nearby ground, to the presence of algae and graffiti. NYC Parks has a new design for water fountains that eliminates many of the persistent conditions that keep parks visitors from using older fountains that have been suc-cessfully installed at several beaches, and we recommend that the city replace older fountains with new models adapted for ADA accessibility.
4. Renew Sara D. Roosevelt Park Sara D. Roosevelt Park needs significant capital improvements, as well as increased maintenance attention.
At over 80 years old, Sara D. Roosevelt Park is an incredibly successful, well-loved urban park. With multiple playgrounds, athletic areas, passive recreational space, and community gardens, “Sara D.” is highly popular and heavily used. The low score the park received in this Report Card points to the day-to-day consequences of its popularity and to the need for addi-tional maintenance as well as comprehen-sive capital renewal.
Recent small-scale improvements have transformed sections of Sara D. Roosevelt Park, creating vibrant, multi-generational spaces. These success stories include the renovated Hester Street Playground, a new synthetic turf field in partnership with Nike at Stanton Street , and a restored park building at Delancey Street which houses the BRC Senior Center. The popularity of these features proves that any improvement made to Sara D. Roosevelt Park will have a tremendous value for the neighborhood.
However, not all parts of Sara D. Roos-evelt Park shine. Remaining athletic fields, playgrounds, and many pathways show wear-and-tear signs of heavy use, and are in need of refurbishment. It is clear that the current maintenance capacity of NYC
Not all parks have accessible, clean, permanent bathrooms.
Aging infrastructure, like this synthetic turf, are not living up to park usage at Sara D. Roosevelt Park.
1 The Stanton Street field was under construction at the time of this survey, and is not included as part of Sara D. Roosevelt Park’s evaluation.

26 ✿ NEW YORKERS FOR PARKS
Parks is not meeting the operational needs of this property. Adding maintenance staff and plumbers will improve daily conditions of critical features, like comfort stations and spray showers. The remaining park buildings should be restored to uses by the public. Sara D. Roosevelt Park is a perfect site for capital improvements: it is a very heavily used neighborhood park serving several high-needs communities, providing much-needed open space in a dense area of the city.
5. invest in Harlem River ParkThe City must commit both increased maintenance staff hours to Harlem River Park, as well as capital funds to construct a much-needed bathroom in addition to connecting the park to the nearby Harlem River Esplanade.
Though the park dates from 1867, recent multi-million-dollar capital projects renovated the property within the last decade, converting the park athletic fields to synthetic turf. The ballfields and other athletic facilities at Harlem River Park are very popular and attract very heavy use, which NY4P surveyors noted in wear-and-tear evidence on drinking fountains, lawns, and athletic fields. Despite having
popularity, Harlem River Park lacks a comfort station on site. This inconve-niences the thousands of park visitors, including citywide leagues, who depend on this popular park for organized sports and active recreation.
When the section of parkland along the waterfront from 132nd Street to 125th Street is built and connected to the exist-ing northern sections of the Harlem River Esplanade and to Harlem River Park, the joined open spaces will encourage more visitors and discourage homelessness, an ongoing problem for both parks. The City must follow through with the commit-ment made to the East Harlem commu-nity, where more residential development is being contemplated by the Department of City Planning, and build the missing section of the park.
This pitcher’s mound shows the severe maintenance needs present at Harlem River Park.
Recommendations (continued)

THE 2016 REPORT C ARD ON PARKS ❁ 27
AppendicesRecommendations (continued)

28 ✿ NEW YORKERS FOR PARKS
As seen in the oldest parks in New York City to the most recently designed public plazas, sidewalks and fences have been used to create a clear division of space, separating the retreat offered by our shared open spaces from the streets and neigh-borhoods that surround them. That design philosophy is changing as more planners and designers recognize that for residents and users, the city’s parks do not end at the sidewalk. Drawing on best practices in urban design, NYC Parks is blurring this spatial division, seeking to create more welcoming liminal spaces by redesign-ing entrances and allowing passive uses to blend into the surrounding sidewalk spaces. This strategy will inform future park designs, and is the impetus behind eight park entrance renovations targeted for capital improvement under the “Parks Without Borders” program.
Regardless of their design, all sidewalks adjacent to New York City park properties are the maintenance responsibility of NYC Parks. Often consisting of no more than pavers and trees, park sidewalks are cared for by the same daily maintenance crews which service the park proper. As such, these sections should be included in the inspection protocol for future Report Cards.
To test data collection in these exterior park spaces, NY4P surveyors collected data for park-adjacent sidewalks at each park property bounded by a traversable sidewalk. Two Major Service areas were included, where relevant: Pathways and Trees. Data on park exteriors was collected at 26 sites.
Major Service Area ScoreTrees 81Sidewalks (Pathways) 95
For future surveys, park exteriors must be counted towards the parks’ overall score. It is imperative to keep the data collection separate, as these areas are in a time of transition in the public eye.
The data collection for this Report Card has been restricted to weekdays, mirroring the inspection program conducted by NYC Parks. Anecdotal evidence suggests that conditions at most neighborhood parks are very poor during high-season weekends. To test this hypothesis, NY4P surveyors conducted a pilot project to collect data on weekend days during the summer survey season. Surveyors revisited nine parks on Saturdays during the data collection period, using the standard Re-port Card method to evaluate the parks.
Surveyors successfully collected data at each of the nine parks, finding conditions that were similar to those found upon each park’s initial, weekday visit.
Major Service Area ScoreAthletic Fields 82Bathrooms 50Courts 85Drinking Fountains 52Immediate Environment 83Lawns 74Natural Areas 88Pathways 86Playgrounds 77Sitting Areas 74Trees 76Water Bodies 43
Major Service Areas with the lowest scores included bathrooms and drinking fountains, which are consistently found in Report Card analyses to have mainte-nance and cleanliness needs. Water Bodies were the lowest-scoring major service area surveyed on weekends: because of the small sample size of this analysis, certain water bodies with very poor maintenance affected the score greatly.
The scores revealed by this data collection and analysis do not suggest a marked difference in park condition between weekdays and weekends. However, the small sample size prevents a clear conclu-sion from being drawn. NY4P surveyors were able to successfully collect data among weekend visitation conditions at nine parks, suggesting that NYC Parks In-spection staff would also be able to collect data on weekends. Expanding the Parks Inspection Program to weekend data col-lection will generate data on a much larger scale than NY4P is capable of undertaking. Additionally, it will enable NYC Parks to accurately shift maintenance schedules to accommodate the levels of use, and the conditions created by, weekend visitorship.
Park Exterior Scores
Weekend Scores
THE 2016 REPORT C ARD ON PARKS ❁ 29
To expand weekend data collection at NY4P, the Report Card method must be modified. Specific target observation areas should be mapped, numbered, and referred to, enabling predictable repli-cability of observations with changing survey staff. Adding this layer of account-ability will allow one team to survey on a weekday, and a second team to return to the same observation sites on weekends, creating comparable results.
This section describes in detail the meth-odology used by New Yorkers for Parks in creating the Report Card on Parks. The methods are derived from New Yorkers for Parks’ award-winning Report Card on Parks survey methodology, first imple-mented in 2003. In 2005, the Report Card on Parks received a Community Indicators Award from the Community Indicators Consortium and the Brookings Institution’s Urban Markets Initiative.
Survey PopulationIn constructing the 2016 Report Card on Parks, NY4P focused on NYC Parks properties between one and twenty acres in size. These “neighborhood parks” pro-vide recreation and relaxation amenities for New York City communities and New Yorkers of all ages and abilities. NY4P did not survey parks that were closed for capital improvement. Further, certain park properties, like skating rinks, amusement parks, or forests without user trails have no major service areas, and were excluded from the report.
To further limit the survey universe, NY4P removed all NYC Parks properties that were located outside the Community Parks Initiative Zones, and those proper-ties within the zones that were less than five acres in size. The resulting 35 parks are the survey population, of which 26 had been surveyed in a previous Report Card.
identification & Weighting of Major Service AreasIn 2001, when constructing the Report Card on Parks, NY4P took a user-focused approach to identify eight Major Ser-vice Areas (MSAs) affecting a park user’s experience. A focus group of park experts, community leaders and public officials was convened to help define eight MSAs, along with a scale of weights to reflect the
relative importance of different indicators. Focus group participants and park users at Brooklyn’s Prospect Park were asked to rate the MSAs on a scale of 1 to 5, with 1 having the least impact on their park experience, and 5 being the most critical. Participants also provided feedback on the structure and composition of the MSAs. The rankings provided were then averaged and rounded to the nearest whole number to provide a final MSA relative weight figure. See Table 1 for MSA weights.
Detailed Methodology
Table 1: Major Service Areas & Relative WeightsMajor Service Areas Description WeightActive Recreation Evaluates all athletic fields and courts in a park. Athletic fields include natural grass, asphalt, and synthetic surfaces. 3Drinking Fountains Evaluates each discrete drinking fountain in a park. 3Pathways Evaluates each type of walkway in a park. 3Bathrooms Evaluates each bathroom in a park. 4Passive Greenspace Evaluates every lawn, landscaped area, garden, water body, natural area and tree pit in a park. 5Playgrounds Evaluates all playground areas and playground equipment in a park. 5Sitting Areas Evaluates each discrete sitting area in a park. 5Immediate Environment Measures how well a park is insulated from potential negative impacts of its surroundings. Intrusive odors, emissions, exhaust, and excessive noise are monitored. 3

30 ✿ NEW YORKERS FOR PARKS
Feature FormsIn 2001, NY4P staff, in cooperation with statistical consultants from the firm of Ernst & Young, developed question forms for the Report Card on Parks with which to evaluate the MSAs found in each park. Individual questions were designed to measure the performance of the features in each MSA in the following categories:
• Maintenance• Cleanliness• Safety• Structural Integrity.
Whenever possible, feature form ques-tions were adapted from NYC Parks’ own internal evaluation mechanism, the Parks Inspection Program (PIP). During the de-velopment of the Report Card on Parks, a second focus group was asked to designate each of the individual form questions as ‘priority’ or ‘routine.’ Priority ratings refer to those conditions of a park feature nec-essary for its safe use. Secondly, the focus group rated questions tagged as routine on a scale from 1 to 5.
Numerical ScoresEach completed feature form was assigned a numerical grade between 0 and 100. Any park feature receiving an ‘unaccept-able’ rating on any priority question was automatically assigned a form grade of zero. However, in the large majority of completed forms, park features received ‘acceptable’ ratings on priority questions. In these cases, all non-priority questions were scored as acceptable, not acceptable or not applicable. Following the guidelines of the focus group, each applicable form question was assigned a weight of 1 through 5.
Form scores were calculated as the weight-ed ratio of questions scored acceptable to those scored acceptable or unacceptable. This number was then multiplied by 100 to give a final form score.
Once each form is scored, MSA rat-ings were calculated. Scored forms were grouped by MSA. Those MSAs with exact-ly one corresponding completed form type were allotted the numerical score of that single form. For example, the “Drinking Fountain” MSA is comprised solely of the “Drinking Fountain” feature form. Thus, the “Drinking Fountain” MSA score is identical to the “Drinking Fountain” feature form score. MSAs comprised of more than one feature form were scored according to a weighted average of the corresponding form scores, as follows:
Suppose C1, Cs,…,Cn are the n-many form scores corresponding to a given MSA. Let D1, Ds,…,Dn be those forms’ corre-sponding relative weights. MSA numerical scores wre calculated as the following quotient:
(C1 * D1 + Cs * Ds + … + Cn * Dn) / (D1 + Ds + … + Dn)
Each park’s raw score was calculated in a similar fashion. Suppose E1, E2,…,Em were a park’s MSA scores with correspond-ing weights F1, F2,…,Fm. Final raw scores were then calculated as the follow-ing quotient:
(E1 * F1 + Es * Fs + … + Em * Fm) / (F1 + Fs + … + Fm)
The raw score for each beach was calcu-lated in a similar fashion to MSA scores. MSAs present for any given beach were weighted following the guidelines of the focus groups. These weighted figures were then averaged to give an overall beach score.
The survey is designed to fairly rate all features that are or should be available to a user visiting a particular park. For example, if a park’s bathroom is locked or closed without explanation, it would receive a “0” score for the Bathroom rating. However, if the park does not have a bathroom, it would not receive any score for Bathrooms, so no park will be penalized for not having a particular major service area.
Applying this numerical score to the letter grades listed in Table 5, it can be seen that a score of 83 corresponds to a grade of “B”.

THE 2016 REPORT C ARD ON PARKS ❁ 31
Converting Numerical Scores to Letter GradesDuring the creation of the Report Card on Parks, a fourth focus group of park managers and open space experts was convened to determine the assignment of letter grades to raw scores. Participants were brought to three parks and asked to provide a letter grade for the park based on a brief description of the MSAs and a tour of the park. These letter grades were consistent with the raw number scores for the parks and resulted in the raw score/grade assignment chart.
Table 5: Converting Raw Scores to Letter GradesRaw Numerical Grade Letter Grade Category97-100 A+ EXCELLENT93-96 A 90-92 A- 87-89 B+ VERY GOOD83-86 B 80-82 B- 77-79 C+ SATISFACTORY73-76 C 70-72 C- 60-69 D CHALLENGED59 and below F UNSATISFACTORY
Survey Data CollectionSurvey work for the 2016 Report Card on Parks took place Tuesdays through Thursdays in July and August 2015 from the hours of 10 AM to 4 PM. NY4P senior staff held a full-day training session to train surveyors in the following tech-niques: use of the tablets; delineation of beach features and transects; use of maps, measuring wheels, survey forms and stan-dards manual; and procedures for docu-menting features with digital cameras. The training session included a step-by-step review of park surveying, collection of data according to defined standards, proper photo documentation, safety procedures, and procedures for storing data in the Report Card database upon completion of survey.
In the field, surveyors used tablet com-puters to complete a feature form for each feature found in a given park. For example, for reach drinking fountain in a park, a
“Drinking Fountain” form was completed so that in a park with three fountains, a surveyor would complete three “Drinking Fountain” feature forms. Additionally, surveyors would complete a form for every playground space within natural and/or constructed boundaries, for every bath-room, for every naturally bounded lawn or landscaped area, etc.
Sample Calculation—Beach 17 Playground, Queens
Table 2: Summary of Beach 17 Playground Form DataForm Form Scores Form Score AveragePlaygrounds 100, 100, 100, 83 96Immediate Environment 77 77Lawns and Landscaped Areas 84 84Park Trees 86 86Sitting Areas 100, 100, 100, 87, 81, 73 90Bathrooms 100, 83 92Drinking Fountains 100, 100, 100, 82, 0, 0, 0, 0, 0, 0, 0, 0 32Athletic Fields (grass) 79 79Pathways 100 100
Table 3: Summary of Beach 17 Playground MSA DataMSA Calculation MSA ScorePlaygrounds Form score average from Table 3 96Immediate Environment Form score from Table 3 77Passive Greenspace (Lawns, Landscaped Areas*2 + Park Trees*1) / 3 85Sitting Areas Form score average from Table 3 90Bathrooms Form score average from Table 3 92Drinking Fountains Form score average from Table 3 32Active Recreation Form score from Table 3 79Pathways Form score from Table 3 100
Table 3: Calculation of Raw Score and Letter Grade—Beach 17 PlaygroundMSA MSA Score times WeightPlaygrounds 96 * 5 = 478 (with rounding)Immediate Environment 77 * 3 = 232 (with rounding) Passive Greenspace 85 * 5 = 425 Sitting Areas 90 * 5 = 451 (with rounding)Bathrooms 92 * 4 = 366 (with rounding) Drinking Fountains 32 * 3 = 96Active Recreation 79 * 3 = 236 (with rounding) Pathways 100 * 3 = 300Total 2583 (with rounding)
This total, 2583, was then divided by the sum of the weights of the eight MSAs. This sum is 31, so that the raw park score for Beach 17 Playground is 2583/31 = 83.3.
Applying this numerical score to the letter grades listed in Table 5, it can be seen that a score of 83 corresponds to a grade of “B”.

32 ✿ NEW YORKERS FOR PARKS
In addition to completing the survey forms, surveyors took extensive digital photographs to support and complement survey results. All survey findings and feature forms receive an identification number and are correlated to a series of photographs documenting conditions for each beach in the survey. Survey results and photo documentation are stored in a central database. When photo documen-tation did not correlate with results or did not adequately illustrate park conditions, the park was re-visited and re-evaluated by surveyors.
NY4P designed the Report Card on Parks methodology in 2003 to serve two func-tions. First, the report provided a mecha-nism to provide an instantaneous snapshot of the conditions of New York City parks. This allows for real-time comparison among parks to identify those that show-case best practices, as well as in-need parks that require attention. In addition, the methodology was designed to be replicat-ed annually, so that trends at the individu-al level, as well as borough- and city-wide, could be documented and addressed.
This document is the first Report Card on Parks for neighborhood-sized parks since 2007. At the time of data collection for the 2007 Report Card, Bathroom and Athletic Field feature forms were modified significantly from earlier iterations of the methodology. In constructing the method-ology for the 2016 Report Card on Parks, NY4P staff sought to fine-tune the survey mechanism. Minor clarification and word-ing changes were made to feature forms, and no major modifications were made.
Other inspections of NYC ParksNYC Parks evaluates its properties using the Parks Inspection Program (PIP). While PIP rates sites from a park man-agement perspective, the survey used in the Report Card was designed from the park user’s perspective. By listing ratings and feature performance by park, NY4P’s Report Card is intended to provide a comparative analysis of park conditions as an easy-to-use tool for communities and park users.
In addition, the two inspection programs evaluate park properties in different ways. For example, the Report Card evaluates and scores Bathrooms and Drinking Fountains. Although NYC Parks tracks those features through PIP, they do not influence a park’s PIP score.

THE 2016 REPORT C ARD ON PARKS ❁ 33

34 ✿ NEW YORKERS FOR PARKS
NEW YORKERS FOR PARKS
The Arthur Ross Center for Parks and Open Spaces55 Broad Street, 23rd FloorNew York, NY 10004(212) 838-9410www.ny4p.org
New Yorkers for Parks is the citywide independent organization championing quality parks and open spaces for all New Yorkers in all neighborhoods.
Parks are essential to the health of residents, the livability of neighborhoods, and the economic development of the city. Through our integrated approach of research, advocacy and strategic partnerships, we drive immediate actions and long-term policies that protect and enhance the city’s vast network of parks, ensure equitable access to quality open spaces for all neighborhoods, and inform and empower communities throughout New York City. Information on New Yorkers for Parks’ research and projects is available at www.ny4p.org
STAFF
Tupper Thomas, Executive Director
Beth Bingham, Director of Research & Planning
Megan Douglas, Director of Communications
Julia Marra, Senior Development Associate
Sam Mei, Fiscal Manager
Laura Montross, Outreach Coordinator
Lucy Robson, Senior Project Manager, Research & Planning
Emily Walker, Director of Outreach & Programs
Bethany Wall, Director of Development
Robin Weinstein, Director of Operations & Finance
PROJECT STAFF
Lucy Robson, Project Manager
Matt Glomski, Project Statistician
Nikhil Goyal, Project Database Manager
Keith Welch, Project Application Developer
Charlie McCabe, Graduate Research Fellow
Alisha Beatty, Graduate Research & Planning Intern
Marcel Negret, Graduate Research & Planning Intern
Caroline Todd, Graduate Research & Planning Intern
Victorio Matias, Field Surveyor
David Olea, Field Surveyor
Chhime Sherpa, Field Surveyor
Margaret Randall, Field Surveyor
Demani Williams, Field Surveyor
Design: Michael Bierman
Photos: Copyright © 2016. New Yorkers for Parks. All Rights Reserved.
Map Data: NYC Department of Parks and Recreation, CUNY Mapping Service at the Center for Urban Research, ESRI, NYC Department of City Planning.
Cover: Sara D. Roosevelt Park
Copyright © 2016. New Yorkers for Parks. All Rights Reserved.


