26
THE 50+ MOVIEGOER An exclusive research for AARP by An Industry Segment That Should Not Be Ignored https://doi.org/10.26419/res.00160.001
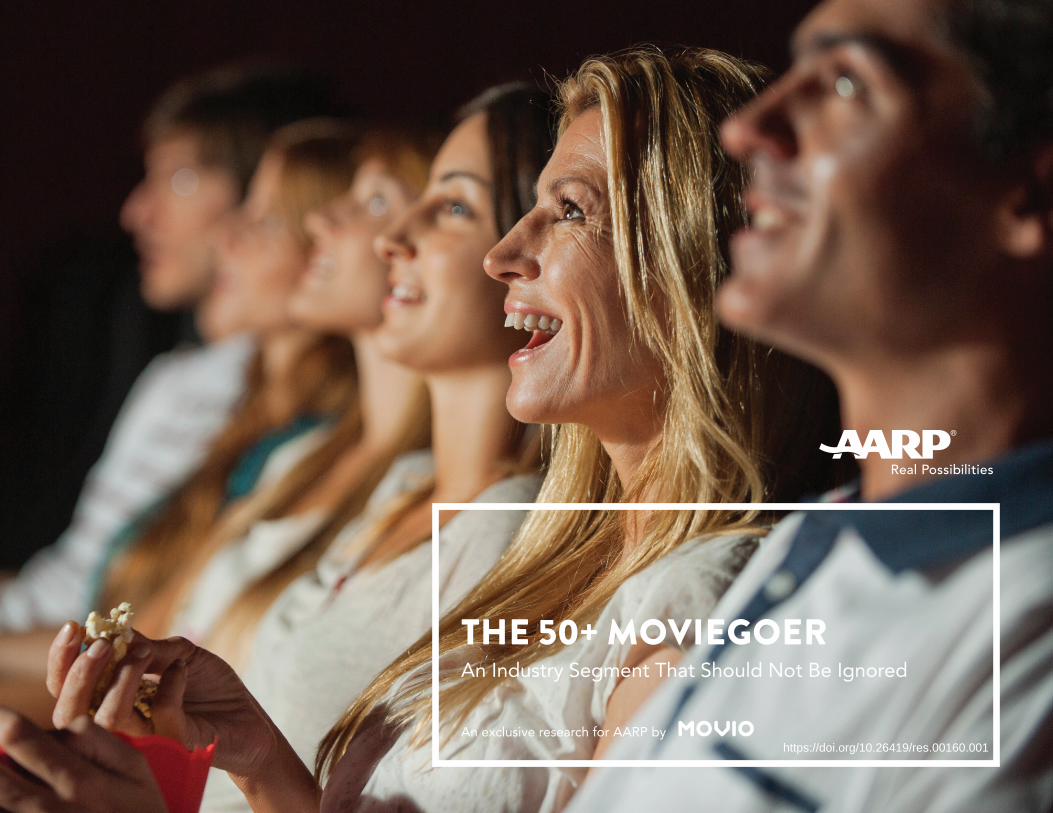
THE 50+ MOVIEGOER
An exclusive research for AARP by
An Industry Segment That Should Not Be Ignored
https://doi.org/10.26419/res.00160.001
AARP is a nonprofit, nonpartisan organization, with a membership of nearly 38 million that helps people turn their goals and dreams into ‘Real Possibilities’ by changing the way America defines aging. With staffed offices in all 50 states, the District of Columbia, Puerto Rico, and the U.S. Virgin Islands, AARP works to strengthen communities and promote the issues that matter most to families such as healthcare security, financial security and personal fulfillment. AARP also advocates for individuals in the marketplace by selecting products and services of high quality and value to carry the AARP name. As a trusted source for news and information, AARP produces the world’s largest circulation magazine, AARP The Magazine and AARP Bulletin. AARP does not endorse candidates for public office or make contributions to political campaigns or candidates. To learn more, visit www.aarp.org or follow @aarp and our CEO @JoAnn_Jenkins on Twitter.
ABOUT AARP ABOUT MOVIO
Movio is the global leader in marketing data analytics and campaign management software for cinema exhibitors, film distributors and studios. A company of Vista Group International Ltd (NZX/ASX:VGL), Movio’s mission is to revolutionize the way the film industry interacts with moviegoers. Movio maintains real-time, authoritative data on the loyalty activity and transactions for many of the world’s biggest cinema chains and captures the behavior of over 37 million active cinema loyalty members worldwide. Learn more at www.movio.co and follow @MovioHQ on Twitter.
About the author
Bryan Smith, Chief Data Scientist. Dr. Smith has a B.S.E. degree in Biomedical Engineering and Mathematics from Tulane University and Masters’ and Ph.D. degrees in Applied Mathematics from Northwestern University in Chicago. He heads research in statistics, science, and analytics at Movio, concentrating on the development of new products that utilize Movio’s global moviegoer database to generate analytical insights.
Copyright © 2017 AARP, All rights reserved. Reprinting with permission only.

TABLE OF CONTENTS
Executive Summary 04Research Analysis 06Methodology 20Appendix 21
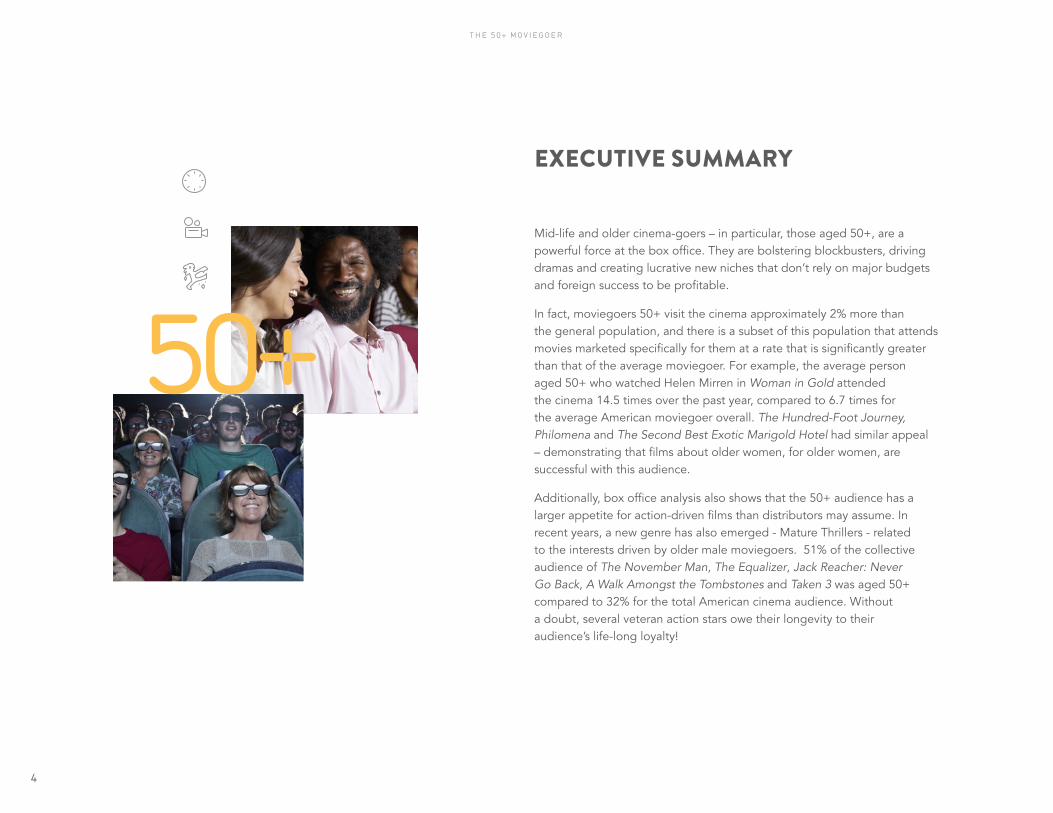
Mid-life and older cinema-goers – in particular, those aged 50+, are a powerful force at the box office. They are bolstering blockbusters, driving dramas and creating lucrative new niches that don’t rely on major budgets and foreign success to be profitable.
In fact, moviegoers 50+ visit the cinema approximately 2% more than the general population, and there is a subset of this population that attends movies marketed specifically for them at a rate that is significantly greater than that of the average moviegoer. For example, the average person aged 50+ who watched Helen Mirren in Woman in Gold attended the cinema 14.5 times over the past year, compared to 6.7 times for the average American moviegoer overall. The Hundred-Foot Journey, Philomena and The Second Best Exotic Marigold Hotel had similar appeal – demonstrating that films about older women, for older women, are successful with this audience.
Additionally, box office analysis also shows that the 50+ audience has a larger appetite for action-driven films than distributors may assume. In recent years, a new genre has also emerged - Mature Thrillers - related to the interests driven by older male moviegoers. 51% of the collective audience of The November Man, The Equalizer, Jack Reacher: Never Go Back, A Walk Amongst the Tombstones and Taken 3 was aged 50+ compared to 32% for the total American cinema audience. Without a doubt, several veteran action stars owe their longevity to their audience’s life-long loyalty!
EXECUTIVE SUMMARY
50+
4
T H E 5 0 + M O V I E G O E R
Predictably, older moviegoers make up a much larger portion of Art-House, Indie and Drama audiences, but they also contribute significantly to Tentpoles. For instance, 27% of the total audience for Star Wars: The Force Awakens was aged 50+. Older adult audiences can create genuine blockbusters too. This phenomena was most recently seen when 86-year-old Clint Eastwood teamed up with 60-year-old Tom Hanks to tell the story of then 58-year-old Chesley “Sully” Sullenberger’s miracle landing on the Hudson. Sully generated $124 million at the domestic box office to date on a production budget of $60 million from an audience that was 57% aged 50+.
The evolution of older audience’s behavior over the opening weeks of the theatrical run of a film is also worth noting. For instance, the 50+ audience of Star Wars: The Force Awakens grew from 17% on Star Wars’ opening weekend to 34% by the end of week two. Data analysis confirms this general tendency for older moviegoers to see movies later in their release, on weekdays and earlier in the day. This presents flexible counter-programming opportunities: it is less important to play older-skewing movies on all sessions every day from release but instead target key sessions throughout the week in return for a longer season.
These are just a few of the signficant revelations about the older movie-going audience presented in this white paper. The white paper has been prepared using the actual ticket-buying behavior of more than 14.7 million Americans normalized to reflect general movie-going behavior, which was then analyzed by Movio’s data scientists and cinema industry experts. The 50+ audience loves the movies, has the disposable cash in their pockets, and a lifelong habit of going the movies. These factors, along with the statistical evidence presented here, demonstrate why moviegoers 50+ should be proactively marketed to and served by the film industry.
STAR WARS VII AUDIENCE
27%27% of the total audience for Star Wars:
The Force Awakens was aged 50+
5
T H E 5 0 + M O V I E G O E R
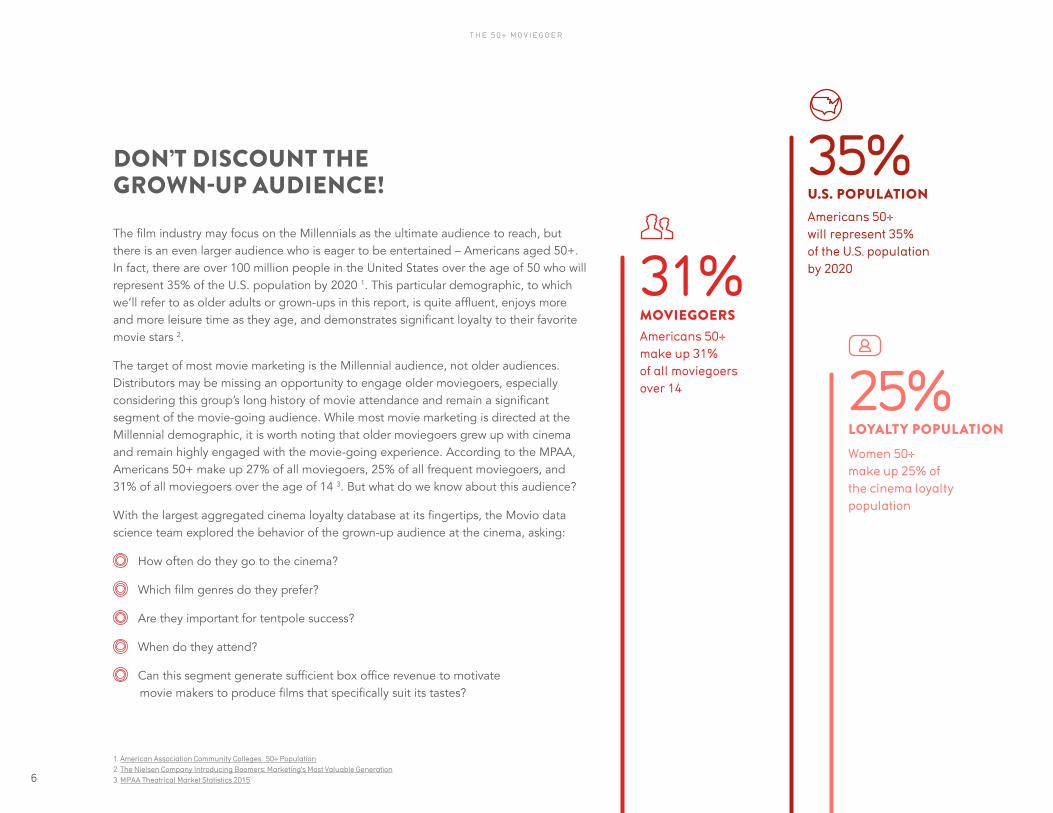
The film industry may focus on the Millennials as the ultimate audience to reach, but there is an even larger audience who is eager to be entertained – Americans aged 50+. In fact, there are over 100 million people in the United States over the age of 50 who will represent 35% of the U.S. population by 2020 1. This particular demographic, to which we’ll refer to as older adults or grown-ups in this report, is quite affluent, enjoys more and more leisure time as they age, and demonstrates significant loyalty to their favorite movie stars 2.
The target of most movie marketing is the Millennial audience, not older audiences. Distributors may be missing an opportunity to engage older moviegoers, especially considering this group’s long history of movie attendance and remain a significant segment of the movie-going audience. While most movie marketing is directed at the Millennial demographic, it is worth noting that older moviegoers grew up with cinema and remain highly engaged with the movie-going experience. According to the MPAA, Americans 50+ make up 27% of all moviegoers, 25% of all frequent moviegoers, and 31% of all moviegoers over the age of 14 3. But what do we know about this audience?
With the largest aggregated cinema loyalty database at its fingertips, the Movio data science team explored the behavior of the grown-up audience at the cinema, asking:
How often do they go to the cinema?
Which film genres do they prefer?
Are they important for tentpole success?
When do they attend?
Can this segment generate sufficient box office revenue to motivate movie makers to produce films that specifically suit its tastes?
1. American Association Community Colleges. 50+ Population 2. The Nielsen Company Introducing Boomers: Marketing’s Most Valuable Generation3. MPAA Theatrical Market Statistics 2015
DON’T DISCOUNT THE GROWN-UP AUDIENCE!
LOYALTY POPULATION25%Women 50+ make up 25% of the cinema loyalty population
U.S. POPULATION35%Americans 50+ will represent 35% of the U.S. population by 2020
MOVIEGOERS
31%Americans 50+ make up 31% of all moviegoers over 14
6
T H E 5 0 + M O V I E G O E R
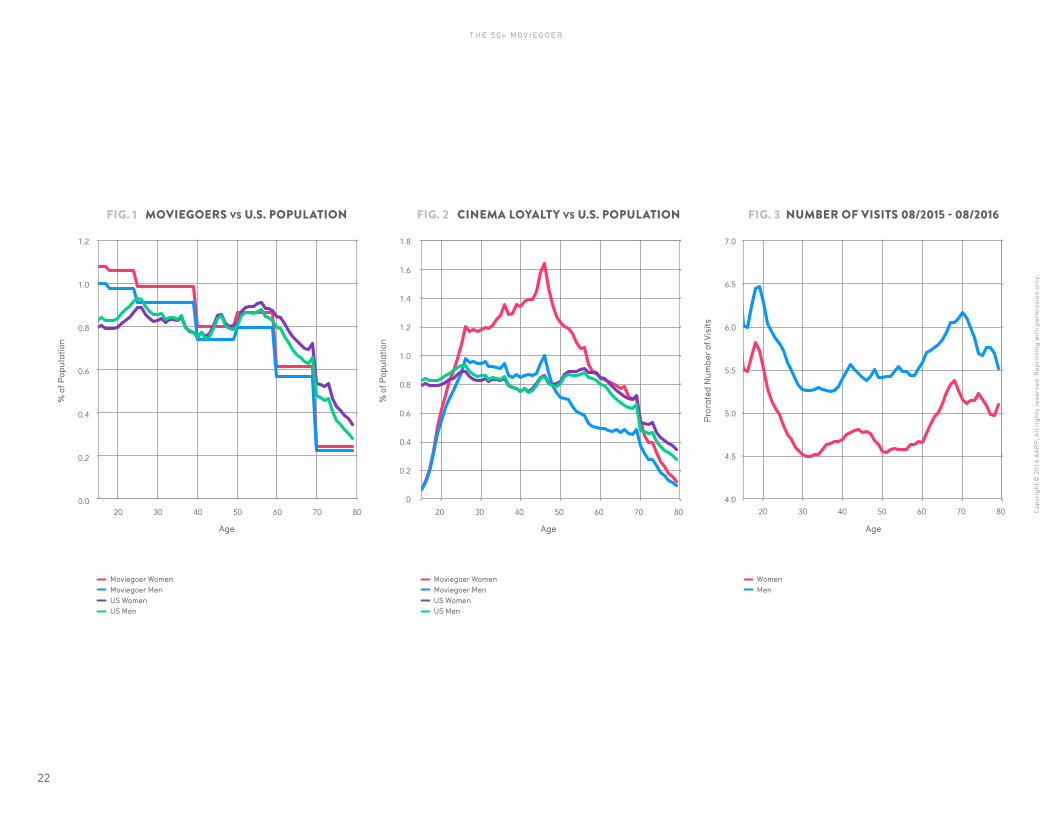
To compare the behavior of moviegoers 50+ with the entire movie-going audience, we selected a sample of 500,000 cinema loyalty members aged between 14 and 80 from across the United States. These individuals were members of loyalty programs between August 1, 2015 and August 1, 2016 and attended at least one movie during this period. This sample was selected so that the resulting age and gender distribution reflected the population of moviegoers described in the MPAA report.
Figure 1 shows how this distribution compares with the population of the United States. While it is true that older adults are under-represented compared to the population as a whole, it is worth noting that this is largely due to a lower rate of cinema attendance by those over 70. Comparatively, adults between the ages of 50 and 60 attend the cinema at approximately the same rate as the general population.
Figure 2 shows the unweighted demographic distribution of cinema loyalty members. While loyalty members are not representative of all moviegoers, they do represent a sizable proportion of frequent moviegoers, and also represent an audience that is particularly
accessible to both cinema and studio marketers. Here we note that women 50+ are significantly over-represented by 20% relative to the population as a whole, making up 25% of loyalty members vs 21% of the total population.
Next we consider the viewing frequency of this audience. Figure 3 shows the number of visits by age and gender for the period of August 1, 2015 to August 1, 2016. Moviegoers 50+ visited on average 6.8 times during this period, which is in line with the overall sample average of 6.7, and 5% more than Millennials who see on average 6.5 movies annually. However, in a similar pattern to the one we highlighted in ‘Understanding Millennial Moviegoers: A Data-Driven Playbook’ 4, this group does not behave like a homogeneous block, but exhibits a shift in behavior as they transition from one age cluster to another. Moviegoers between the ages of 50 and 64 visited 6.6 times, whereas moviegoers 65+ attended 7.3 times, an increase of 10%. So while fewer people aged 65+ attend the movies, those who do go do so much more frequently than most younger demographics. We will continue to revisit this effect throughout this white paper.
EAGER TO WATCH FILMS AT THE CINEMA
4. ‘Understanding Millennial Moviegoers: A Data-Driven Playbook’, Movio, June 2016
MOVIES ANNUALLY
6.8Moviegoers 50+ see
on average 6.8 movies annually
7
T H E 5 0 + M O V I E G O E R
Animation
Art-House
Christian
Drama
Dystopian
Horror
Indie
Tentpole
Thriller
Urban
Young-Adult Comedy
KEEPING THE ART ALIVE
5. Animation: Finding Dory, The Secret Life of Pets, The Jungle Book, Zootopia, Kung Fu Panda 3 Art-House: Hello My Name is Doris, Love & Friendship, Queen of Katwe, Cafe Society, The Lady in the Van Christian: Miracles from Heaven, Risen, God’s Not Dead 2, The Young Messiah Drama: Sully, The Girl on the Train, My Big Fat Greek Wedding 2, The Second Best Exotic Marigold Hotel, Woman in Gold Dystopian: The Huntsman: Winter’s War, Warcraft, The 5th Wave, Ben-Hur, Gods of Egypt Horror: The Conjuring 2, Don’t Breathe, The Purge: Election Year, The Shallows, Lights Out Indie: The Big Short, The Nice Guys, The Hateful Eight, Hail Caesar!, Hell or High Water Tentpole/Blockbuster: Star Wars: Episode VII: The Force Awakens, Captain America: Civil War, Deadpool, Suicide Squad, Batman v Superman: Dawn of Justice Thriller: The Revenant, The Accountant, 10 Cloverfield Lane, 13 Hours: The Secret Soldiers of Benghazi, Deepwater Horizon Urban: Ride Along 2, Boo! A Madea Halloween, Barbershop: The Next Cut, When the Bough Breaks, Kevin Hart: What Now? Young-Adult Comedy:Central Intelligence, Bad Moms, Daddy’s Home, Sausage Party, The Boss
AnimationArt-HouseChristianDramaDystopianHorrorIndieTentpoleThrillerUrbanYoung-Adult Comedy
AnimationArt-HouseChristianDramaDystopianHorrorIndieTentpoleThrillerUrbanYoung-Adult Comedy
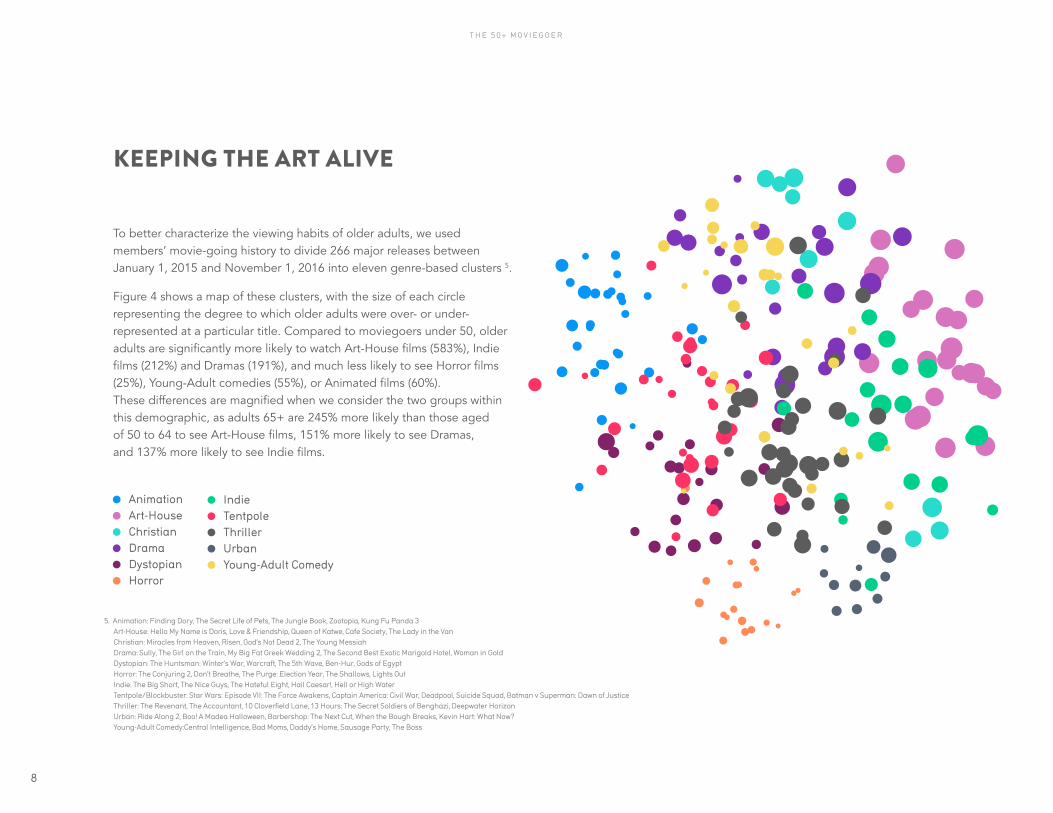
To better characterize the viewing habits of older adults, we used members’ movie-going history to divide 266 major releases between January 1, 2015 and November 1, 2016 into eleven genre-based clusters 5.
Figure 4 shows a map of these clusters, with the size of each circle representing the degree to which older adults were over- or under-represented at a particular title. Compared to moviegoers under 50, older adults are significantly more likely to watch Art-House films (583%), Indie films (212%) and Dramas (191%), and much less likely to see Horror films (25%), Young-Adult comedies (55%), or Animated films (60%). These differences are magnified when we consider the two groups within this demographic, as adults 65+ are 245% more likely than those aged of 50 to 64 to see Art-House films, 151% more likely to see Dramas, and 137% more likely to see Indie films.
8
T H E 5 0 + M O V I E G O E R
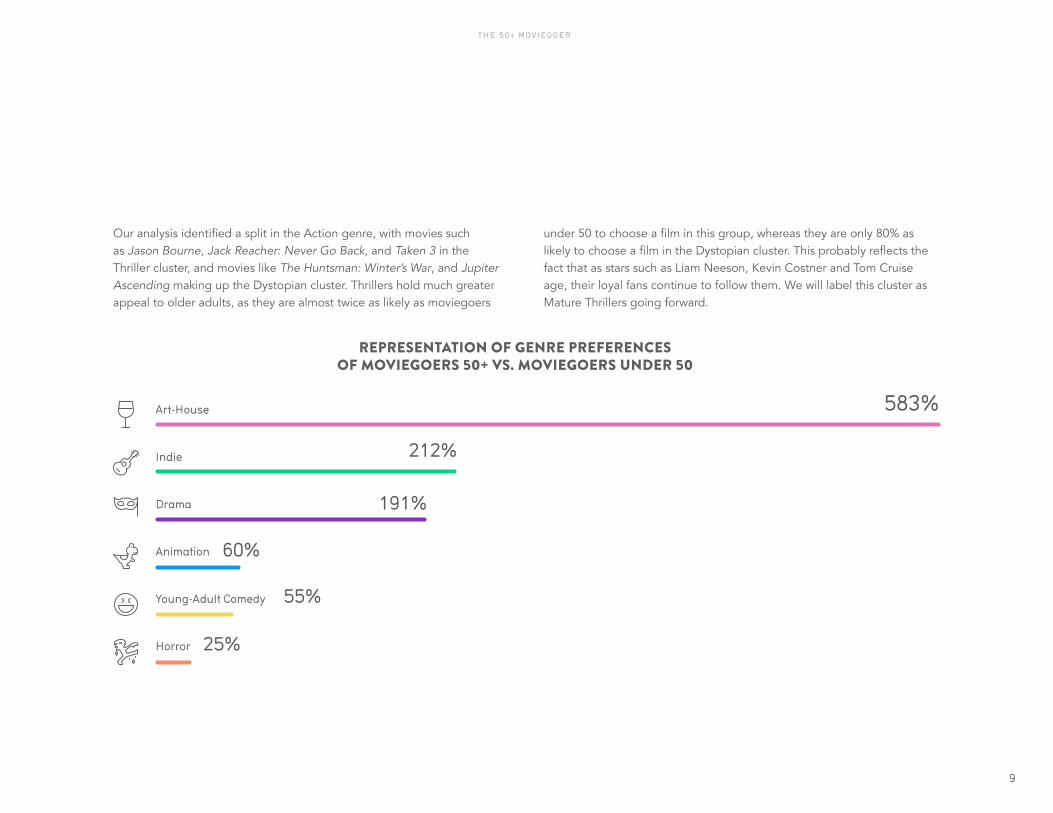
Our analysis identified a split in the Action genre, with movies such as Jason Bourne, Jack Reacher: Never Go Back, and Taken 3 in the Thriller cluster, and movies like The Huntsman: Winter’s War, and Jupiter Ascending making up the Dystopian cluster. Thrillers hold much greater appeal to older adults, as they are almost twice as likely as moviegoers
under 50 to choose a film in this group, whereas they are only 80% as likely to choose a film in the Dystopian cluster. This probably reflects the fact that as stars such as Liam Neeson, Kevin Costner and Tom Cruise age, their loyal fans continue to follow them. We will label this cluster as Mature Thrillers going forward.
REPRESENTATION OF GENRE PREFERENCES OF MOVIEGOERS 50+ VS. MOVIEGOERS UNDER 50
Art-House
Indie
Drama
Horror
Young-Adult Comedy
Animation
583%
212%
191%
60%
55%
25%
9
T H E 5 0 + M O V I E G O E R
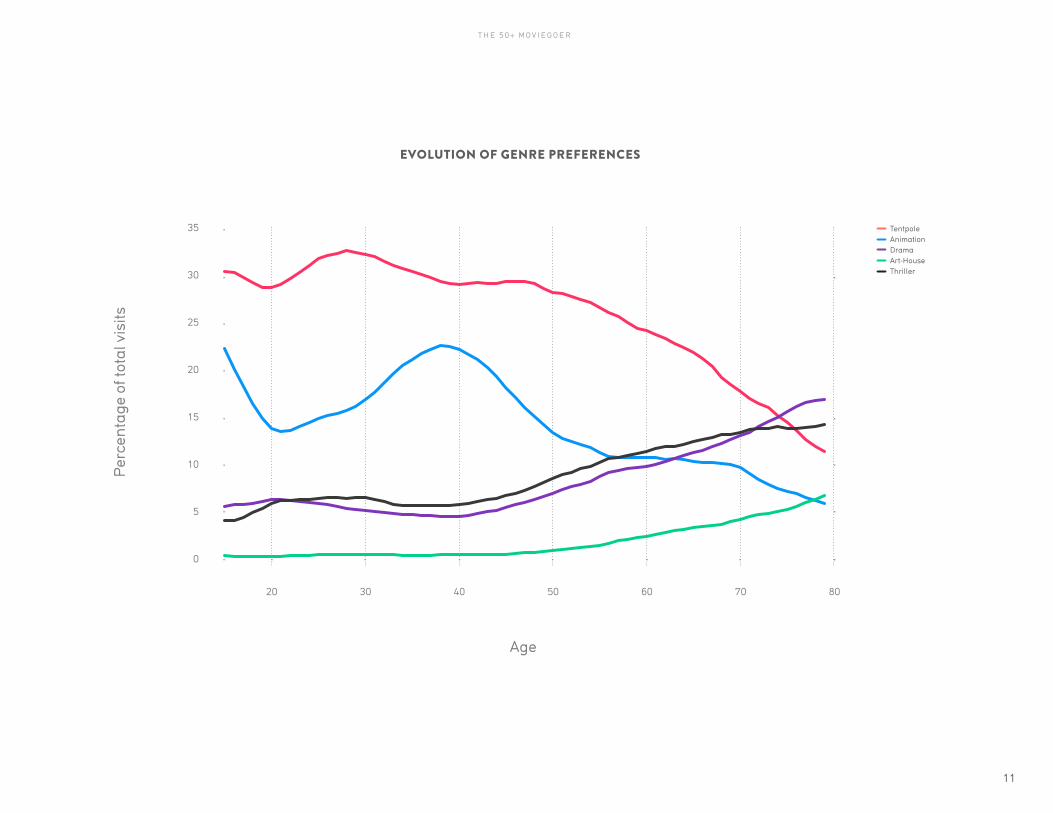
Figure 5 shows the evolution of audience preferences for several different clusters. Here we clearly see that after the age of 50, preferences for Tentpole and Animated films, which make up the bulk of the viewing for audiences under age 50, begin to decline significantly. These two genres, which combine to make up 56% of all visits for moviegoers under 50, only make up 42% of visits by moviegoers 50+, and only 34% of visits by those 65+. As shown in Figure 5, as moviegoers age, visits to films in these genres are replaced by more niche genres such as Dramas, Thrillers, Art-House and Christian films.
This leads to the final question regarding genre preference: what is the contribution of older adults to the success of films in each genre? To answer this question, we first considered older moviegoers’ share of all cinema visits. Using Movio Media’s quota sampling procedure, we calculated that 32% of all visits by moviegoers over the age of 14 were made by older
adults. This is consistent with the ticket purchase estimates provided by the MPAA. Unsurprisingly, this demographic is most critical to the success of Art-House films, as they are responsible for 75% of all visits to films in this cluster. Similarly, they make up 56% of visits to Christian films, 54% of visits to Indie films, 53% of visits to Dramas, and 49% of visits to Mature Thrillers. Also unsurprisingly, they are only responsible for 15% of visits to Horror films.
It is also interesting to note that preference for Tentpole declines rapidly with age for this demographic, with those aged between 50 and 64 choosing to attend blockbusters 80% as often as moviegoers under 50, while those over 65 are only 60% as likely to choose to attend a film in the Tentpole cluster when they visit the cinema. Even so, this demographic makes up 27% of the 14+ audience, making a significant contribution to the overall success of blockbusters.
10
T H E 5 0 + M O V I E G O E R
Age
Per
cen
tage
of t
otal
vis
its
20
35
30
25
20
15
10
5
0
30 40 50 60 70 80
EVOLUTION OF GENRE PREFERENCES
Tentpole Animation Drama Art-House Thriller
11
T H E 5 0 + M O V I E G O E R
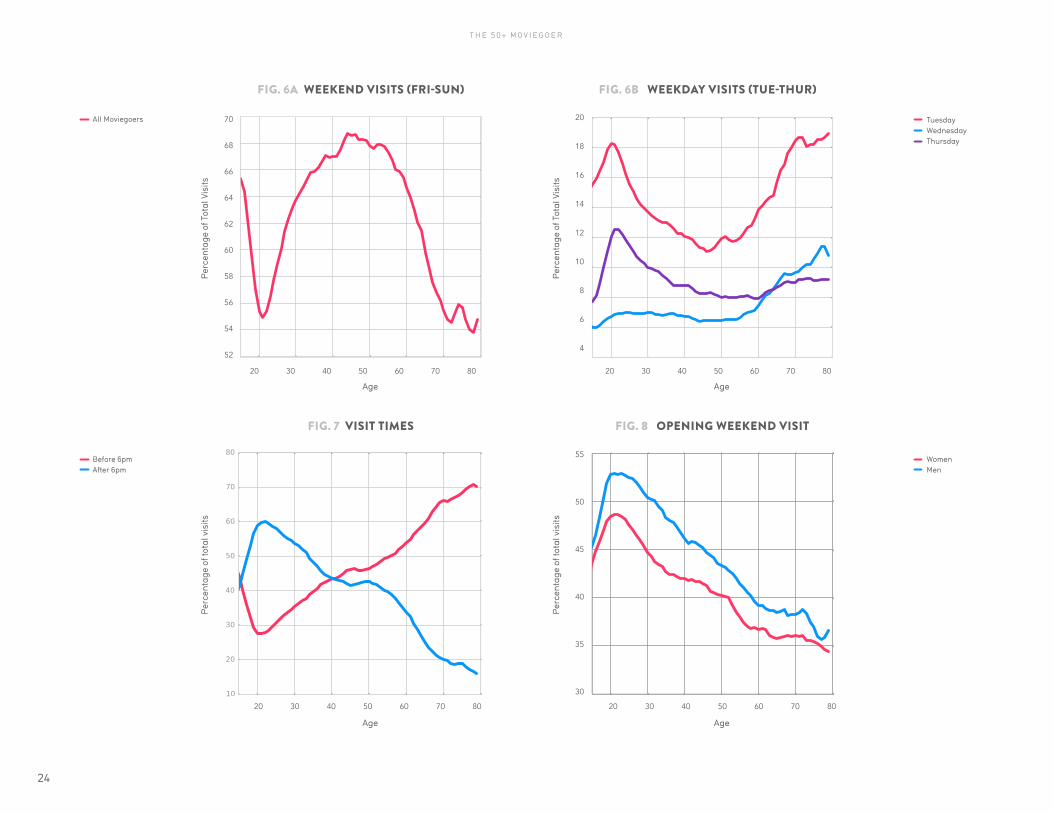
Now that we have established the types of movies that appeal to older adults, we consider when they prefer to visit the cinema. Like all groups, most their visits take place on the weekend (62%), as shown in Figure 6. However, this behavior pattern changes significantly depending on age, as moviegoers 65+, make only 56% of their visits on the weekend, compared with 66% for those under 65. The shift is largely reflected in Tuesday and Wednesday visits, with adults 65+ visiting on Tuesday 17% of the time and Wednesday 10% of the time.
A similar shift is observed when we consider time of day. In contrast with Millennials, older adults make the majority (70%) of their visits before 6pm. Again, as shown in Figure 7, the proportion of night visits declines significantly, with moviegoers 65+ making only 20% of all movie visits after 6pm.
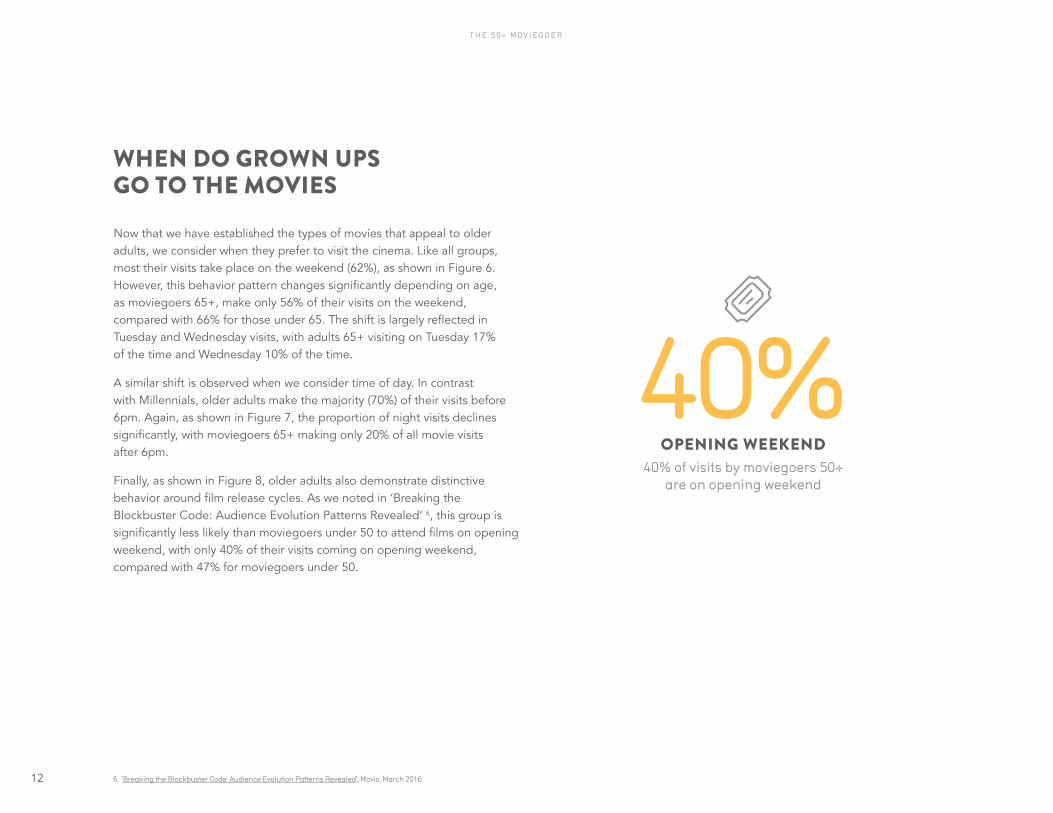
Finally, as shown in Figure 8, older adults also demonstrate distinctive behavior around film release cycles. As we noted in ‘Breaking the Blockbuster Code: Audience Evolution Patterns Revealed’ 6, this group is significantly less likely than moviegoers under 50 to attend films on opening weekend, with only 40% of their visits coming on opening weekend, compared with 47% for moviegoers under 50.
WHEN DO GROWN UPS GO TO THE MOVIES
6. ‘Breaking the Blockbuster Code: Audience Evolution Patterns Revealed’, Movio, March 2016
OPENING WEEKEND
40%40% of visits by moviegoers 50+
are on opening weekend
12
T H E 5 0 + M O V I E G O E R
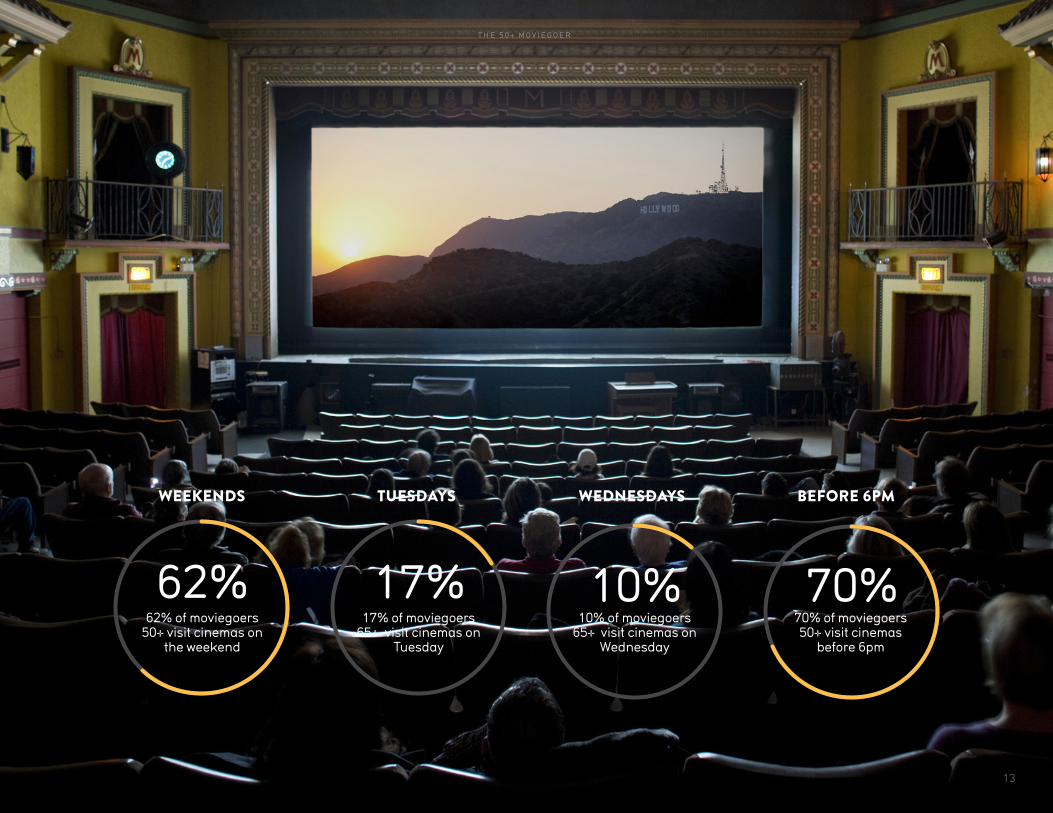
WEDNESDAYS
10%10% of moviegoers
65+ visit cinemas on Wednesday
TUESDAYS
17% of moviegoers 65+ visit cinemas on
Tuesday
17%
WEEKENDS
62% of moviegoers 50+ visit cinemas on
the weekend
62%
BEFORE 6PM
70% of moviegoers 50+ visit cinemas
before 6pm
70%
13
T H E 5 0 + M O V I E G O E R
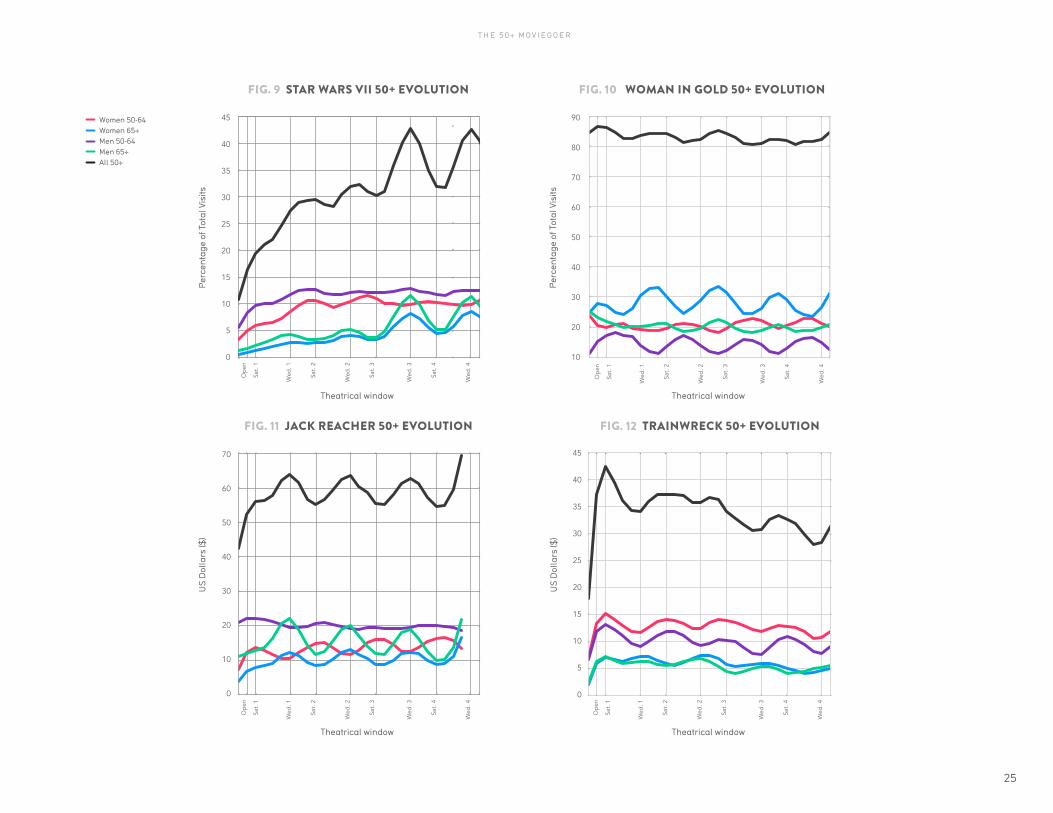
To further explore their behavior over the film release cycle, we considered some specific examples. First we considered how older adults attended Star Wars Episode VII. Figure 9 shows how older moviegoers’ proportion of the ‘Star Wars’ audience evolved over its run. Overall, moviegoers 50+ made up 27% of the ‘Star Wars’ audience, increasing from 17% on opening weekend to 34% from the end of week two. This is consistent with the behavior we observed in ‘Breaking the Blockbuster Code: Audience Evolution Patterns Revealed’.
Figure 10 shows the audience evolution for Woman in Gold. This is a movie that we would expect to appeal to an older crowd, and it does, with moviegoers 50+ making up 82% of the audience. In addition, while we observe that some older adults, particularly moviegoers 65+, appear to prefer to avoid the crowds on opening night, there is significantly less change in the audience composition over the run.
In Figure 11, we consider Jack Reacher: Never Go Back. The results here are a bit surprising, as moviegoers 50+ make up almost 57% of the overall audience. Again, like ‘Star Wars’, this does increase over time, from 53% on opening weekend to 58% after week two, driven largely by an increase in
the proportion of men 65+. The impact of this group is particularly dramatic on Wednesdays late in the film’s run.
Finally, Figure 12 shows the evolution for Trainwreck. This is not a movie that many would have predicted held appeal to older adults, but 36% of Trainwreck’s audience was 50+, which was almost certainly a factor in its greater-than-expected success at the box office. Interestingly, the pattern displayed here is a bit different from what we usually observe, with the proportion of moviegoers 50+ declining over time. This may be because the type of older moviegoer interested in a film like Trainwreck is more motivated to get to a movie early, and this is reflected in this audience’s average attendance delay, which is 10% lower than that for other older adults, and their average number of visits on opening weekend, which is 11% higher.
The combination of characteristic patterns of behavior in genre and timing preferences exhibited by older adults suggests an opportunity for cinema operators to better optimize their program scheduling with key sessions throughout the week in return for a longer season.
14
T H E 5 0 + M O V I E G O E R
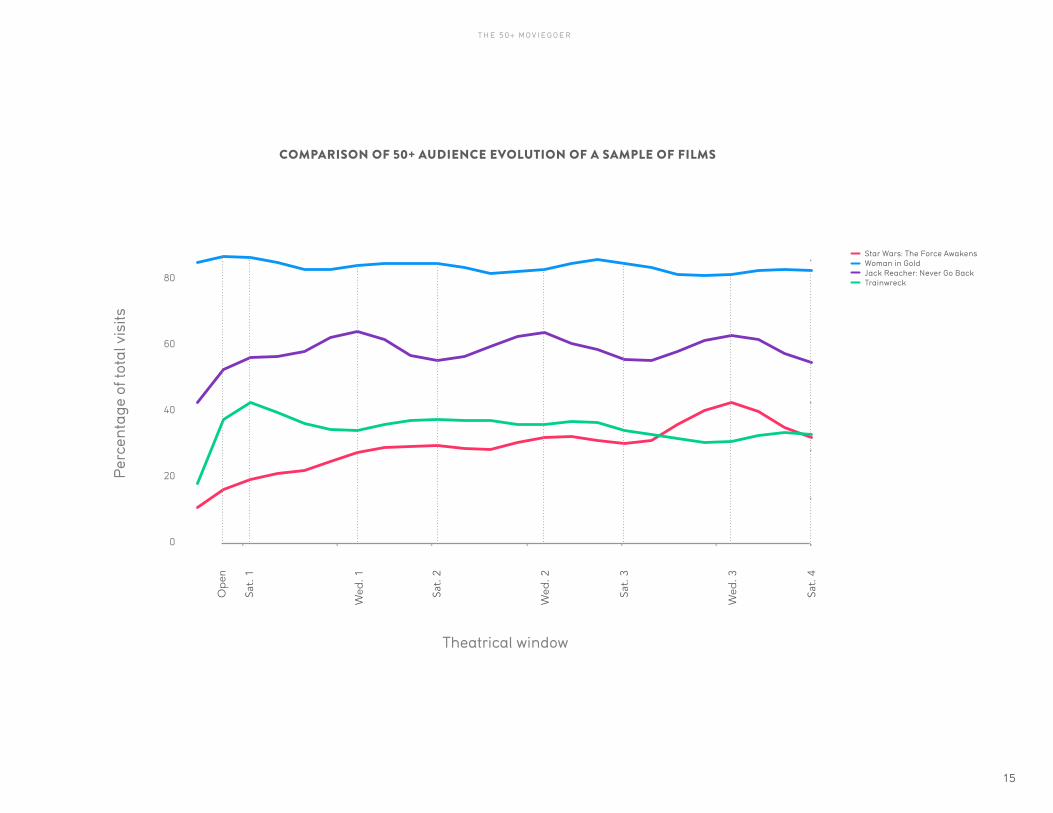
Star Wars: The Force Awakens Woman in Gold Jack Reacher: Never Go Back Trainwreck
COMPARISON OF 50+ AUDIENCE EVOLUTION OF A SAMPLE OF FILMS
Op
en
Wed
. 1
Wed
. 2
Wed
. 3
Sat.
1
Sat.
2
Sat.
3
Sat.
4
Per
cen
tage
of t
otal
vis
its
Theatrical window
80
60
40
20
0
15
T H E 5 0 + M O V I E G O E R
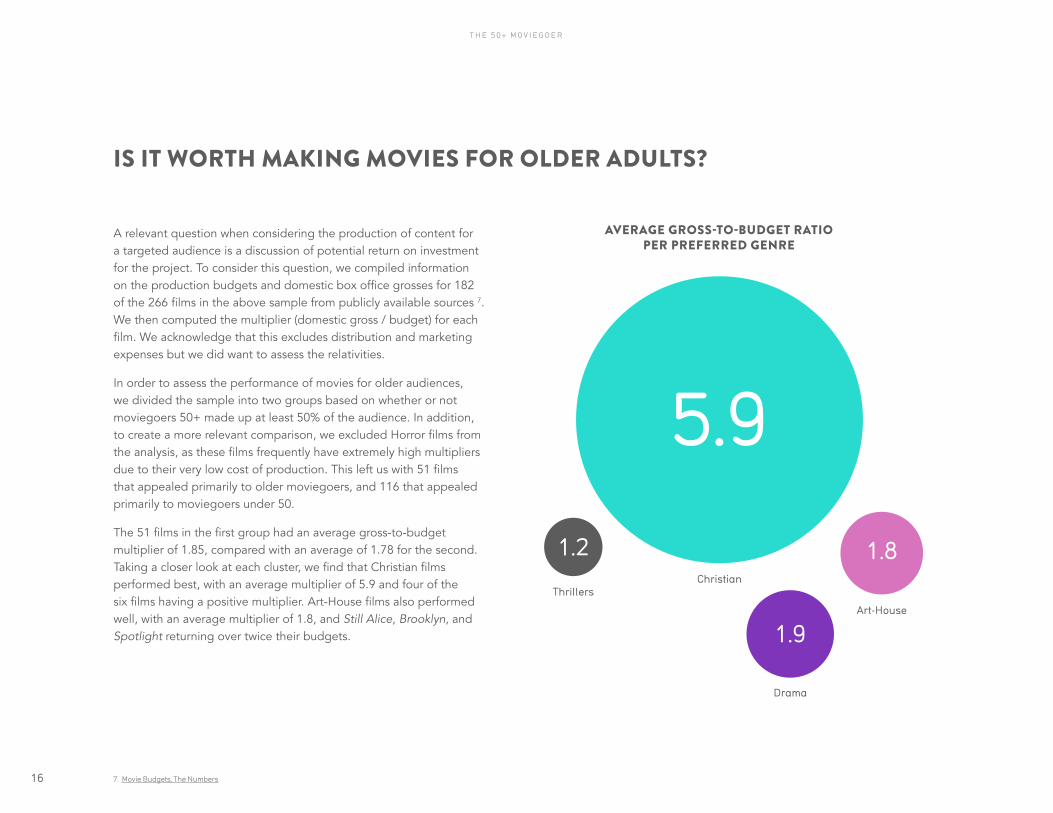
A relevant question when considering the production of content for a targeted audience is a discussion of potential return on investment for the project. To consider this question, we compiled information on the production budgets and domestic box office grosses for 182 of the 266 films in the above sample from publicly available sources 7. We then computed the multiplier (domestic gross / budget) for each film. We acknowledge that this excludes distribution and marketing expenses but we did want to assess the relativities.
In order to assess the performance of movies for older audiences, we divided the sample into two groups based on whether or not moviegoers 50+ made up at least 50% of the audience. In addition, to create a more relevant comparison, we excluded Horror films from the analysis, as these films frequently have extremely high multipliers due to their very low cost of production. This left us with 51 films that appealed primarily to older moviegoers, and 116 that appealed primarily to moviegoers under 50.
The 51 films in the first group had an average gross-to-budget multiplier of 1.85, compared with an average of 1.78 for the second. Taking a closer look at each cluster, we find that Christian films performed best, with an average multiplier of 5.9 and four of the six films having a positive multiplier. Art-House films also performed well, with an average multiplier of 1.8, and Still Alice, Brooklyn, and Spotlight returning over twice their budgets.
IS IT WORTH MAKING MOVIES FOR OLDER ADULTS?
7. Movie Budgets, The Numbers
5.9
1.9
1.81.2Christian
Art-House
Drama
Thrillers
AVERAGE GROSS-TO-BUDGET RATIO PER PREFERRED GENRE
16
T H E 5 0 + M O V I E G O E R
8. What Women Want: Unlocking Box Office Revenue, Movio, October 2015
Dramas appealing to older adults, particularly those appealing to older women, performed similarly well, with My Big Fat Greek Wedding 2, Woman in Gold, and The Second Best Exotic Marigold Hotel as the standouts in this cluster. Each of these returned over three times their budget in domestic gross. This is one of the clusters that was identified in Movio’s 2015 whitepaper, ‘What Women Want’ 8, as having the potential drive incremental box office revenue by attracting a subset of moviegoers that tend to avoid tentpole releases. In addition, Sully and McFarland, USA, two more gender-balanced dramas, both had multipliers over two.
We found that Indie films did not generally perform as well as other genres, with an average multiplier of only 1.1. However, we could only analyze a small subset of this genre as budget information for these types of films is not widely available.
Finally, Mature Thrillers had slightly positive returns with an average multiplier of 1.2. Notable successes in this genre include The Accountant and Bridge of Spies, which had multipliers of 1.9 and 1.8 respectively. This cluster did also include several films with low domestic returns, such as Run All Night, The Finest Hours, and Inferno. These films all played well with older adults, but this market does not appear to be large enough to support $50-$70M budget films as a sole target audience for a film.
The lesson here for movies targeted at grown-ups is the same as for all movies: when it’s a compelling story told well, the payback can be fast when a film resonates with an older, domestic audience.
GROSS-TO-BUDGET RATIO
3.0Woman in Gold
returned 3 times its budget in domestic gross
17
T H E 5 0 + M O V I E G O E R
The movie industry ignores moviegoers 50+ at its own peril. This is already a vibrant and valuable segment that will only grow more influential as the general population ages. In this white paper, we revealed that older moviegoers are truly engaged with the movie-going experience.
IF YOU MAKE IT THEY WILL COME
OLDER ADULTS Make up 27% of all moviegoers and 25% of all frequent moviegoers;
See on average 6.8 movies annually, which is 5% more than Millennials;
Tend to visit half of the time during weekdays, especially on Tuesday and Wednesday, when aged over 65;
Make 70% of their visits before 6pm;
Don’t rush to see a movie on opening weekend and tend to take longer to attend a film;
Are significantly more likely to watch Art-House, Dramas, and Indie films;
Are 40% less likely to choose to attend blockbusters when aged over 65.
HERE ARE SOME WAYS TO REAP THE REWARDS FROM SERVING MOVIEGOERS 50+ : Value older moviegoers as reliable repeat visitors – their frequency and spend over the course of an entire year more than offsets a lower per-visit spend.
Produce movies for this demographic – a well-made drama that appeals to older American moviegoers (think The Hundred Foot Journey or Woman in Gold) can more than double its production budget from domestic box office grosses alone.
Don’t assume that every older moviegoer graduates to Art-House movies the minute they turn 50. Mature Thrillers show that for this segment, genre tastes don’t change and nor do the action heroes!
Consider cinema scheduling strategy to secure incremental box office from counter-programming during off-peak days and times.
Don’t forget about older moviegoers when marketing Tentpoles – particularly re-makes (Ghostbusters) and franchises with a nostalgia factor like Star Wars and Jurassic World.
18
T H E 5 0 + M O V I E G O E R

19
T H E 5 0 + M O V I E G O E R
MOVIEGOER CHARACTERIZATION
In order to characterize the behavior of different demographic groups within the population of moviegoers, we constructed a sample of 500,000 U.S. moviegoers that viewed at least one film between August 1, 2015 and August 1, 2016. We applied a quota sampling procedure in order to ensure that the demographic distribution within this sample was the same as the distribution of moviegoers described by the MPAA in their 2015 Theatrical Market Statistics report.
MOVIE CLUSTERS
266 major theatrical releases between January 1, 2015 and November 1, 2016 were divided into eleven clusters using the same technique we applied in ‘Understanding Millennial Moviegoers: A Data-Driven Playbook’. Using over 1,000,000 member movie-going histories, we applied a neural network similar to word2vec to project each movie into a vector space, and the k-means algorithm was applied to the the points in this space to create the clusters. Nonlinear T-SNE projection was applied to create the two-dimensional map.
50+ AUDIENCE PROPORTIONS AND AUDIENCE EVOLUTION CHARTS
The daily and full-run audience breakdowns were computed using the full Movio Media dataset. The audience members for each film were weighted such that the active membership at the time of the film’s release matched the distribution described by the MPAA. This procedure ensures that any changes to the demographic distribution of members in the Movio Media database do not affect the movie audience composition estimates.
METHODOLOGY
20
T H E 5 0 + M O V I E G O E R

APPENDIX: SUPPORTING FIGURES
21
T H E 5 0 + M O V I E G O E R
1.2
1.0
0.8
0.6
0.4
0.2
0.0
7.0
6.5
6.0
5.5
5.0
4.5
4.0
FIG. 1 MOVIEGOERS VS U.S. POPULATION FIG. 2 CINEMA LOYALTY VS U.S. POPULATION FIG. 3 NUMBER OF VISITS 08/2015 - 08/2016
% o
f Pop
ula
tion
Moviegoer Women Moviegoer Men US Women US Men
Moviegoer Women Moviegoer Men US Women US Men
Women Men
Age Age Age
20 30 40 50 60 70 80
1.8
1.6
1.4
1.2
1.0
0.8
0.6
0.4
0.2
0
% o
f Pop
ula
tion
20 30 40 50 60 70 80 20 30 40 50 60 70 80
Pro
rate
d N
um
ber
of V
isits
Co
pyr
igh
t ©
20
16
AA
RP
, All
rig
hts
res
erve
d. R
epri
nti
ng
wit
h p
erm
issi
on
on
ly.
22
T H E 5 0 + M O V I E G O E R

7.5
7.0
6.5
6.0
5.5
5.0
4.5
4.0
FIG. 5 EVOLUTION OF GENRE PREFERENCES
Tentpole Animation Drama Art-House Thriller
Age
20 30 40 50 60 70 80
Pro
rate
d N
um
ber
of V
isits
AnimationArt-HouseChristianDramaDystopianHorrorIndieTentpoleThrillerUrbanYoung-Adult Comedy
AnimationArt-HouseChristianDramaDystopianHorrorIndieTentpoleThrillerUrbanYoung-Adult Comedy
AnimationArt-HouseChristianDramaDystopianHorrorIndieTentpoleThrillerUrbanYoung-Adult Comedy
FIG. 4 AUDIENCE BASED FILM CLUSTERS
23
T H E 5 0 + M O V I E G O E R
Age
Age Age
Age
Per
cen
tage
of T
otal
Vis
its
FIG. 6A WEEKEND VISITS (FRI-SUN) FIG. 6B WEEKDAY VISITS (TUE-THUR)
Per
cen
tage
of T
otal
Vis
its
20
18
16
14
12
10
8
6
4
2020
FIG. 7 VISIT TIMES FIG. 8 OPENING WEEKEND VISIT
Per
cen
tage
of t
otal
vis
its
Per
cen
tage
of t
otal
vis
its
55
50
45
40
35
30
3030 4040 6060 5050 8080 7070
20 4030 50 60 70 8020 4030 50 60 70 80
70
68
66
64
62
60
58
56
54
52
All Moviegoers
Before 6pm After 6pm
Women Men
Tuesday Wednesday Thursday
24
T H E 5 0 + M O V I E G O E R
Theatrical window
Theatrical window
Theatrical window
Theatrical window
US
Dol
lars
($)
US
Dol
lars
($)
Per
cen
tage
of T
otal
Vis
its
Per
cen
tage
of T
otal
Vis
its
FIG. 9 STAR WARS VII 50+ EVOLUTION FIG. 10 WOMAN IN GOLD 50+ EVOLUTION
FIG. 11 JACK REACHER 50+ EVOLUTION FIG. 12 TRAINWRECK 50+ EVOLUTION
70
60
50
40
30
20
10
0
45
40
35
30
25
20
15
10
5
0
Op
enO
pen
Op
enO
pen
Wed
. 1W
ed. 1
Wed
. 1W
ed. 1
Wed
. 2W
ed. 2
Wed
. 2W
ed. 2
Wed
. 3W
ed. 3
Wed
. 3W
ed. 3
Sat.
1Sa
t. 1
Sat.
1Sa
t. 1
Sat.
2Sa
t. 2
Sat.
2Sa
t. 2
Sat.
3Sa
t. 3
Sat.
3Sa
t. 3
Sat.
4Sa
t. 4
Sat.
4Sa
t. 4
Wed
. 4W
ed. 4
Wed
. 4W
ed. 4
45
40
35
30
25
20
15
10
5
0
90
80
70
60
50
40
30
20
10
Women 50-64 Women 65+ Men 50-64 Men 65+ All 50+
25
T H E 5 0 + M O V I E G O E R