56
World Payments Report 2012
| Date post: | 02-Nov-2014 |
| Category: |
Documents |
| Upload: | ramendra-singh |
| View: | 16 times |
| Download: | 0 times |

World Payments Report2012
3 Preface
Section 1: World Non-Cash Markets and Trends
5 Key Findings
6 Global Volume of Non-Cash Payments Continues to Show Healthy Gains
6 Pace of Growth in Volumes Was Fastest in Developing Markets
10 Individual Payments Markets in Europe Fared Differently Amid Debt Crisis
12 BRIC Markets Show Unique Non-Cash Preferences and Adoption Rates
14 Global Payments Volumes Are Expected to Have Reached 306 Billion in 2011
15 Mature Asia-Pacific Is Home to Three of the Ten Largest Non-Cash Payments Markets in the World
16 Electronic and Mobile Payments Continue to Grow at Pace
18 Conclusion
Section 2: Ability to Innovate is Challenged Amid Sea of Key Regulatory and Industry Initiatives
21 Key Findings
22 Waves of Initiatives Continue to Drive Change in Payments
22 Eurozone Crisis Has Accelerated the Regulatory Push for Systemic Risk Control and Transparency in Banking
24 Key Regulatory and Industry Initiatives (KRIIs) in Payments, 2012
27 Innovation Emerges As a Central Theme When KRIIs Converge
29 Certain KRIIs Create More Direct Value Than Others for Customers
31 Focus of SEPA, Long on Compliance, Now Needs to Shift Toward Customer Innovation
33 SEPA Update
33 Mandated Deadline of February 2014 Is Set for SEPA Credit Transfers and Direct Debits
33 Onus of SEPA Implementation Lies Heavily on Banks and Corporates
34 All Stakeholders Need to Focus Now on Migration Specifics
35 Still Ahead for SEPA
Section 3: Banks Need to Seize Opportunity of Customer-Centric Innovation
37 Key Findings
38 Innovation in Payments Is Evolving More Toward Customer-Centricity
39 Banks Need to Innovate Even More Around Customer Needs to Drive Loyalty and Retention
41 Innovation Readiness Reflects Understanding of Customer Needs, and PSP Innovation Capabilities
42 Four ‘Innovation Hotspots’ Offer Opportunity for Innovation in Payments
44 Regulation Can Drive Innovation Even When Not Designed Specifically to Do So
44 Regulation Continues to be Both Beneficial and Challenging for Payments Innovation
47 Way Forward: Banks Must Continue to Focus on Innovating to Meet Customer Needs and Collaborate
on a Value-Creating Payments Ecosystem
50 Closing Thoughts
51 Methodology
52 Glossary
Table of Contents
Now in its eighth year, The World Payments Report (WPR) from Capgemini, The Royal Bank of Scotland (RBS), and Efma continues to explore the state and evolution of global non-cash payments.
The most recent full year data on transactions is for 2010, and shows a healthy 7.1% gain in non-cash payments volume globally. As we publish WPR 2012, weakness persists in global economic conditions, but early data suggests non-cash payment volumes could nevertheless have risen another 8% in 2011. However, volume is only part of the story for the payments market, which is growing and changing in new and exciting ways and arguably ways that data is not yet able to capture.
The World Payments Report 2012 explores payments market development, and—in response to industry requests—revisits a key theme introduced in WPR 2011: the breadth and depth of regulatory and industry initiatives, and the degree to which they are driving industry transformation. Importantly, we find that while ‘regulation’ is often synonymous with ‘constraint,’ some regulations are actually enabling payments innovation, directly or indirectly. We consider SEPA, for example, which is closer to becoming the launch pad for innovation it was designed to be, now that mandated migration deadlines have been set.
We also look at the opportunity banks are now pursuing to take customer-centricity to a new level. After years of sustained success in driving internal improvements for better efficiency and cost-effectiveness in existing operations, today’s horizon of payments innovation is drawing banks further into customer-driven, value-added innovation—an area in which non-bank players have been most successful at capturing the imagination of users to date.
Our research, which included a survey and face-to-face interviews with payments executives from across the world, showed that for banks to succeed, they will need to continue to align their innovation capabilities with the evolving demands of their customers. It also showed that banks are well-positioned to innovate in many areas, most notably around proposition development, payments instruction, operations processing, and account reporting and invoicing.
Banks may consider partnering with non-banks, and will need to maintain an open dialogue with all stakeholders (including regulators) as the payments ecosystem evolves into a more level playing field in which all stakeholders are able to innovate—to the benefit of clients as well as their own businesses.
We hope this year’s report provides useful insights, and look forward to next year.
3
Preface
Jean LassignardieGlobal Head of Sales and MarketingGlobal Financial Services
Capgemini
Kevin BrownGlobal Head, Transaction Services Product International Banking
The Royal Bank of Scotland
Patrick DesmarèsSecretary General
Efma

4
section title l1section title l2
5World Payments rePort 2012
Ke
y F
ind
ing
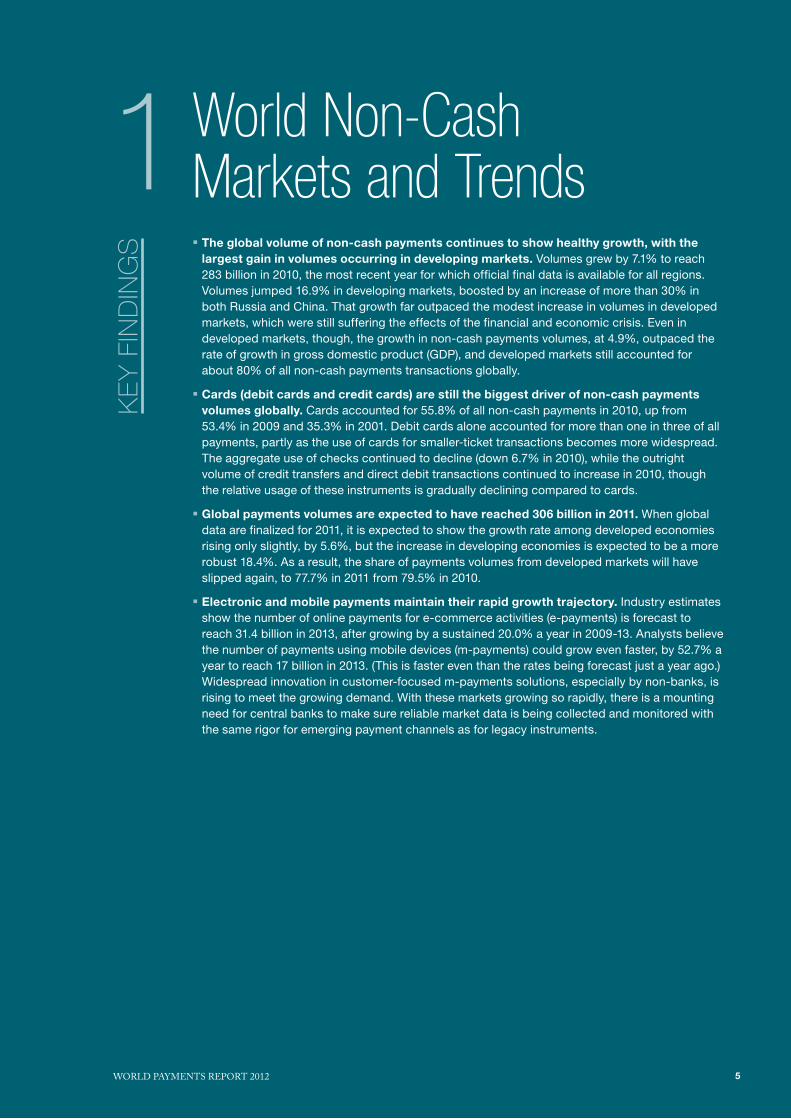
s � The global volume of non-cash payments continues to show healthy growth, with the largest gain in volumes occurring in developing markets. Volumes grew by 7.1% to reach 283 billion in 2010, the most recent year for which official final data is available for all regions. Volumes jumped 16.9% in developing markets, boosted by an increase of more than 30% in both Russia and China. That growth far outpaced the modest increase in volumes in developed markets, which were still suffering the effects of the financial and economic crisis. Even in developed markets, though, the growth in non-cash payments volumes, at 4.9%, outpaced the rate of growth in gross domestic product (GDP), and developed markets still accounted for about 80% of all non-cash payments transactions globally.
� Cards (debit cards and credit cards) are still the biggest driver of non-cash payments volumes globally. Cards accounted for 55.8% of all non-cash payments in 2010, up from 53.4% in 2009 and 35.3% in 2001. Debit cards alone accounted for more than one in three of all payments, partly as the use of cards for smaller-ticket transactions becomes more widespread. The aggregate use of checks continued to decline (down 6.7% in 2010), while the outright volume of credit transfers and direct debit transactions continued to increase in 2010, though the relative usage of these instruments is gradually declining compared to cards.
� Global payments volumes are expected to have reached 306 billion in 2011. When global data are finalized for 2011, it is expected to show the growth rate among developed economies rising only slightly, by 5.6%, but the increase in developing economies is expected to be a more robust 18.4%. As a result, the share of payments volumes from developed markets will have slipped again, to 77.7% in 2011 from 79.5% in 2010.
� Electronic and mobile payments maintain their rapid growth trajectory. Industry estimates show the number of online payments for e-commerce activities (e-payments) is forecast to reach 31.4 billion in 2013, after growing by a sustained 20.0% a year in 2009-13. Analysts believe the number of payments using mobile devices (m-payments) could grow even faster, by 52.7% a year to reach 17 billion in 2013. (This is faster even than the rates being forecast just a year ago.) Widespread innovation in customer-focused m-payments solutions, especially by non-banks, is rising to meet the growing demand. With these markets growing so rapidly, there is a mounting need for central banks to make sure reliable market data is being collected and monitored with the same rigor for emerging payment channels as for legacy instruments.
World Non-Cash Markets and Trends1

6
PACE Of GROWTh IN VOluMES WAS fASTEST IN DEVElOPING MARKETS
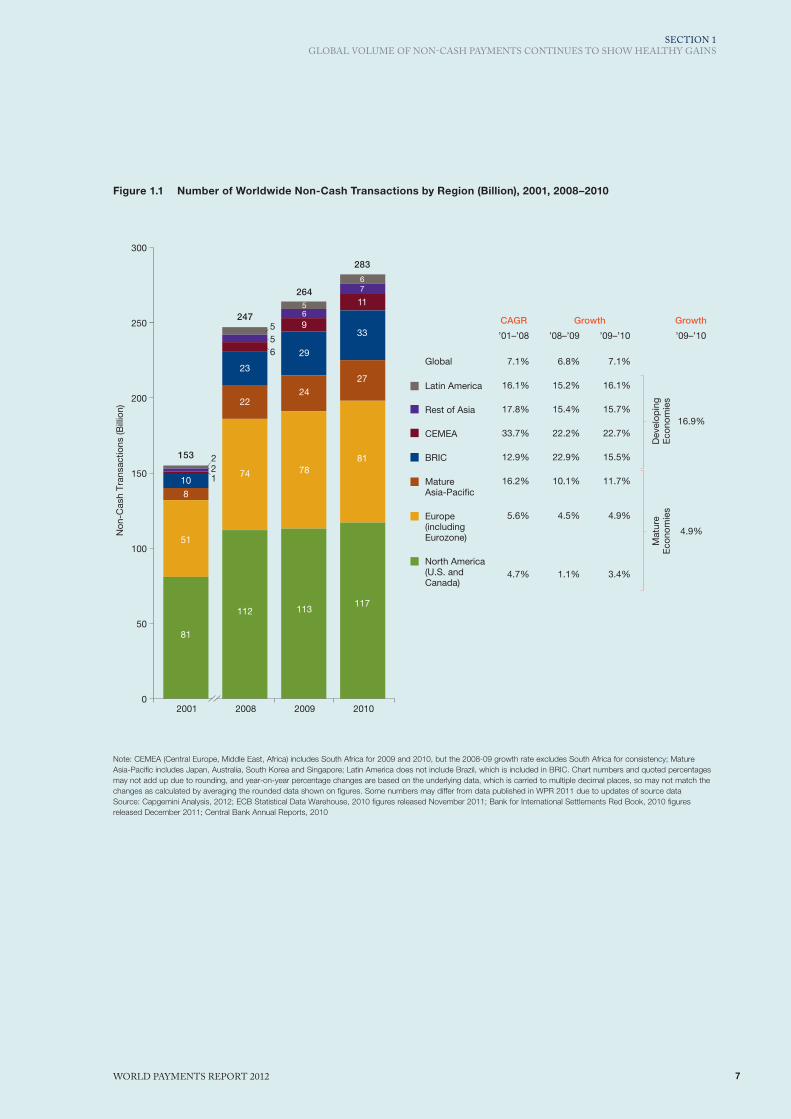
The global volume of non-cash transactions grew 7.1% in 2010 to reach 283 billion1 (see Figure 1.1). The rate of growth was very strong in developing markets (16.9%), and modest (4.9%) in developed markets, which were still feeling the prolonged effects of the global financial and economic crisis.
The outright volume of non-cash payments remains heavily concentrated in developed markets, with North America, Europe, and Mature Asia-Pacific accounting for a combined 79.5% of non-cash payments volumes in 2010.2 However, Brazil, China, and Russia are among the top ten3 payments markets, and Brazil is now the third largest non-cash market in the world—a sign Brazil’s market is now maturing after years of rapid growth. China and Russia (the ninth and tenth largest markets respectively) both saw volumes jump by more than 30%. In China, more and more retailers are beginning to accept cards, which is fueling the expansion of non-cash payments. In Russia, the non-cash payments market is growing fast, driven by increased card usage, and the successful expansion of banking beyond urban areas and the standard retail bank market infrastructure. Non-banks are also increasingly driving innovation in electronic money and retail payments.
U.S. NON-CASH PAyMENTS GROWTH PICkEd UP AS LIqUIdITy STARTEd TO RETURN TO THE MARkETS
The U.S. remains the largest single payments market, with 107.2 billion non-cash payments transactions in 2010. The growth in volumes was just 3.4%, but that was up from their slowest-ever growth rate (1.0% in 2009), as the impact of the financial crisis lessened, and liquidity started to return to the markets. Europe (including the Eurozone) also saw modest growth (4.9%) in volumes, and that was consistent with prior
years despite the economic downturn. This rate also remains far above GdP growth, demonstrating again the resilience of payment services, and their attractiveness as a market in which to invest.
CARdS REMAIN THE BIGGEST dRIvER OF RISING PAyMENTS vOLUMES
Cards, and debit cards in particular, continue to be the single biggest driver of global non-cash payment volumes. In 2010, more than one in three non-cash payments were made using a debit card, putting the total volume of such transactions at 107 billion, up 15.2% from 2009.
In recent years, debit card usage has benefitted from various trends, including the tightening of credit standards for credit card users, mainly in the U.S. and some European countries, which has reduced access to credit for many consumers. debit cards have also been used increasingly for small-ticket transactions as more consumers begin to favor debit cards over cash (and are mindful of incurring further debt on credit cards), and more merchants accept smaller-value debit transactions (after acquirers and card issuers removed the minimum fee per transaction).
If debate over the regulation of Multilateral Interchange Fees (MIF) is resolved, it could make the credit card business (and product innovation) more attractive for banks, but the use of debit cards is likely to keep widening nonetheless, as issuers seek to incentivize users by, for example, expanding rewards and loyalty programs for usage. debit cards are also the clearing instrument underlying numerous e- and m-payment schemes, so volumes are boosted by the robust growth in those markets (p16). Usage in emerging markets is also being boosted as the growing number of debit card schemes being introduced or planned (India, Russia, Ukraine) increases access for users.
Global Volume of Non-Cash Payments Continues to Show Healthy Gains
1 Transaction volumes cited in the WPR 2012 may differ from those provided in previous years as data are continually normalized to provide more accurate comparisons between regional datasets (see methodology). Also note the percentage changes in transaction volumes from year to year are based on the underlying data, which is carried to multiple decimal places, so may not match the changes as calculated by averaging the rounded data shown on figures. WPR data also does not include pre-paid card transactions, which are included in some official country datasets, notably the U.S. and Canada, where such usage is well-developed (also see footnote 4).
2 In terms of the data in this chapter, ‘Europe’ comprises the Eurozone, Denmark, Poland, Sweden, and the U.K. The Eurozone comprises the 13 countries that were members as of 2007: Austria, Belgium, Finland, France, Germany, Greece, Ireland, Italy, Luxembourg, Netherlands, Portugal, Slovenia, and Spain. (Cyprus and Malta joined in 2008, Slovakia in 2009, and Estonia in 2011); Mature Asia-Pacific comprises Australia, Japan, Singapore, and South Korea; Also see methodology.
3 The top ten non-cash payments markets, in order of size in 2010, were the U.S., Eurozone, Brazil, U.K., South Korea, Canada, Japan, China, Australia, and Russia.
7World Payments rePort 2012
SECTION 1GLOBAL vOLUME OF NON-CASH PAyMENTS CONTINUES TO SHOW HEALTHy GAINS
figure 1.1 Number of Worldwide Non-Cash Transactions by Region (Billion), 2001, 2008–2010
0
50
100
150
200
250
300
2010200920082001
CAGR
Global
Latin America
Rest of Asia
CEMEA
BRIC
Mature Asia-Paci�c
Europe(including Eurozone)
North America (U.S. and Canada)
Dev
elop
ing
Eco
nom
ies
Non
-Cas
h Tr
ansa
ctio
ns (B
illio
n)
Mat
ure
Eco
nom
ies
7.1%
16.1%
17.8%
33.7%
12.9%
16.2%
5.6%
4.7%
6.8%
15.2%
15.4%
22.2%
22.9%
10.1%
4.5%
1.1%
’01–’08 ’08–’09
Growth
7.1%
16.1%
15.7%
22.7%
15.5%
11.7%
4.9%
3.4%
’09–’10
Growth
16.9%
4.9%
’09–’10
153
247
264
283
81
51
8
10
112
74
22
23
113
78
24
29
221
6
55
9
56
117
81
27
33
11
76
Note: CEMEA (Central Europe, Middle East, Africa) includes South Africa for 2009 and 2010, but the 2008-09 growth rate excludes South Africa for consistency; Mature Asia-Pacific includes Japan, Australia, South Korea and Singapore; Latin America does not include Brazil, which is included in BRIC. Chart numbers and quoted percentages may not add up due to rounding, and year-on-year percentage changes are based on the underlying data, which is carried to multiple decimal places, so may not match the changes as calculated by averaging the rounded data shown on figures. Some numbers may differ from data published in WPR 2011 due to updates of source dataSource: Capgemini Analysis, 2012; ECB Statistical Data Warehouse, 2010 figures released November 2011; Bank for International Settlements Red Book, 2010 figures released December 2011; Central Bank Annual Reports, 2010

8
The global volume of credit card transactions4 rose 5.2% in 2010, a faster pace than the 1.6% in 2009, when liquidity-constrained banks were tightening credit card limits, and consumers were spending less in the initial aftermath of the financial crisis, especially in developed markets.
Cards continue to account for a consistently increasing share of the growing pool of non-cash transactions in every region. In North America, for example, cards accounted for 62% of non-cash transactions in 2010, up slightly from 60% in 2009, and up sharply from 38% in 2001 (see Figure 1.2).5 Increasing liquidity in the U.S. in 2010, as the financial crisis lessened, meant that banks resumed more active credit card issuance to consumers (and extended credit limits), resulting in increased usage.
Cards accounted for an even greater share of volumes in Mature Asia-Pacific (67%) and are growing fast in Brazil, Russia, India, and China (BRIC) as a whole, though each BRIC market is at a different stage of payments development, and each features different payments preferences (see BRIC Markets Show Unique Non-Cash Preferences and Adoption Rates, p12).
The cards market is not without challenges, including fraud and infrastructure issues, but debit cards in particular are positioned well to take market share from other payment instruments, including cash and checks, especially if customers increase their use of emerging instruments, such as e-/m-payments, and choose to settle those transactions as card payments (as many are doing now).
CREdIT TRANSFER ANd dIRECT dEBIT USAGE REMAIN STABLE
In general, the proportional use of direct debits is not changing much in major markets (as illustrated in Figure 1.2). The largest markets for direct-debit usage in 2010, in terms of transactions per inhabitant, were Austria, France, Germany, Netherlands, and the U.k. direct debits are most popular for consumer-to-business and Public (C2B and C2P) uses, such as utility, insurance, and tax payments where the corporate treasurer can benefit from reliable cash predictions. direct debit offerings, and therefore usage, are traditionally far less developed in BRIC
nations beyond Brazil, or in Mature Asia-Pacific (though Japan’s ‘electronically recorded monetary claim’ introduced in 2009 may lead to a new form of direct debits).
The number of credit transfer transactions rose globally in 2010, but accounted for about the same share of total transactions overall (around 18%). Usage grew fastest in BRIC markets, where the growth has been driven by the extensive use of credit transfers by corporations and the public sector (e.g., for pension, benefit, and wage payments), as well as the surging number of individual internet users with broadband connections.
CHECk USAGE CONTINUES TO dECLINE
The use of checks is also declining as card usage grows—though usage ranges from endemic in nations such as the U.S., India, and France to obsolete in countries such as Sweden. Check writing is expected to keep declining as the use of faster and more efficient non-cash payment methods expands, in some cases fueled by government-led initiatives. In France, for instance, a recent working group set up by the Ministry of Finance recommends reducing the number of checks processed by 50% by the end of 2017.6
However, as noted, checks remain popular in many major non-cash payments markets as they still provide value in certain circumstances. Habit, tradition, and inertia also continue to defer switching from checks. Check use is highest in the U.S., where 23 billion checks were written in 2010. That was down from 31 billion in 2006, but is still the highest in the world, and is likely to remain high as checks are still common in business-to-business (B2B) as well as business-to-consumer (B2C) and person-to-person (P2P) transactions.
CASH USAGE REMAINS STRONG
despite the increasing use of non-cash instruments, cash-in-circulation still grew in 2010, though at a slower pace than in 2009. The gap between the growth of cash and non-cash transactions per inhabitant is decreasing, indicating a potential change in customers’ payment patterns.
4 To ensure consistency and accuracy in regional comparisons, WPR cards data does not include prepaid card transactions—numbers that are included in some country data, including the U.S., which includes transactions involving private label, general purpose, and EBT cards (which store electronic benefit transfers to federal aid recipients). These and other country prepaid totals are not included in WPR data as the majority of countries in the WPR study scope do not report this data in the same way.
5 Direct debits are based on a mandate, and target revolving payments, so usage rates are very stable. However, changes in the way data have been reported inflated growth rates for 2009 (because of the inclusion of South Africa, and BIS updates data on Brazil from 2009 onward), causing 2010 rates to seem more modest in comparison.
6 The proposal is contained in a report issued in April 2012 by the Comité Consultatif du Secteur Financier, part of the Bank of France.

9World Payments rePort 2012
SECTION 1GLOBAL vOLUME OF NON-CASH PAyMENTS CONTINUES TO SHOW HEALTHy GAINS
figure 1.2 Comparison of Non-Cash Transactions (Billion) and Mix of Payment Instruments (%), by Region, 2001, 2009–2010
0
40
80
120
160
BR
IC20
10
BR
IC20
09
BR
IC20
01
Mat
ure
APA
C20
10
Mat
ure
APA
C20
09
Mat
ure
APA
C20
01
Nor
thA
mer
ica
2010
Nor
thA
mer
ica
2009
Nor
thA
mer
ica
2001
Eur
ope
2010
Eur
ope
2009
Eur
ope
2001
Non
-Cas
h Tr
ansa
ctio
ns(B
illio
n)
50.6
77.6 81.4 80.8
112.8 116.6
7.7
24.3 27.1
10.0
28.7 33.1
CAGR 5.4%
CAGR 4.2%
CAGR 15.0%
CAGR 14.3%
5.5% 4.9%
4.2%
15.5% 11.7% 14.1% 15.5%
3.4%
100%
75%
50%
25%
0%
Pay
men
t In
stru
men
ts M
ix(%
)
28%
24%
31%
17%
39%
27%
27%
7%
40%
27%
27%
6%
38%
4%
6%
52%
60%
10%
7%
23%
62%
10%
7%
20%
51%
5%
24%
20%
64%
8%
22%
6%
67%
8%
21%
4%
14%
4%
38%
44%
34%
17%
35%
14%
38%
15%
35%
12%
■ Cards ■ Direct Debits ■ Credit Transfers ■ Checks
Note: Mature Asia-Pacific (APAC) data excludes South Korea cards data for 2001, Singapore credit card transaction volume data for all years, and Japan data for direct debits for all years as data was unavailable; France and South Africa credit card data not available for all years; South Africa direct debit and credit transfer data available only for 2009 and 2010. Chart numbers and quoted percentages may not add up due to rounding. Some numbers may differ form data published in WPR 2011 due to updates of source dataSource: Capgemini Analysis, 2012; ECB Statistical Data Warehouse, 2010 figures released November 2011; Bank for International Settlements Red Book, 2010 figures released December 2011; Central Bank Annual Reports, 2010

10
INDIVIDuAl PAyMENTS MARKETS IN EuROPE fARED DIffERENTly AMID DEBT CRISIS
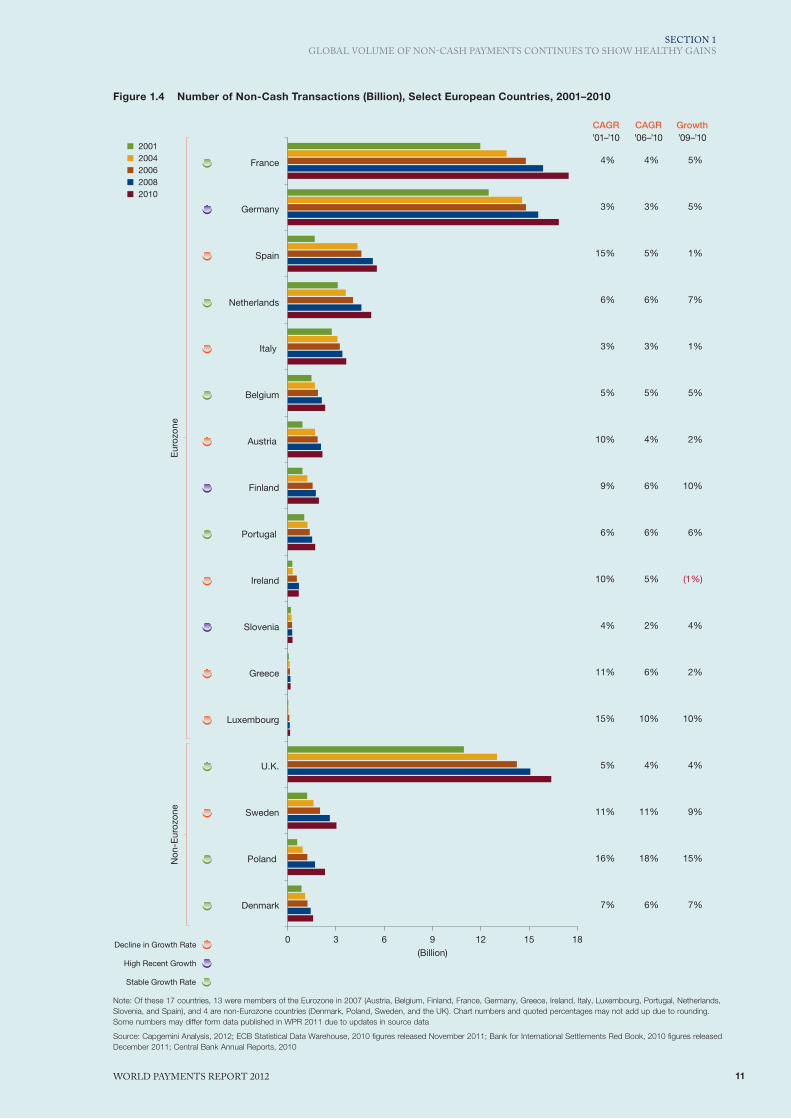
The Eurozone remains the second largest payments market in the world, accounting for 58.1 billion transactions or 20.5% of the total in 2010. Across Europe as a whole, France, Germany, and the U.k. are still the largest non-cash payments markets, each accounting for more than 16 billion non-cash transactions in 2010.
Eurozone non-cash payments were up 4.5% overall from 2009, but the economic downturn constrained the growth in volumes in several markets—most notably Greece, Italy, and Spain—and volumes actually declined by 1% in Ireland (see Figure 1.4). In fact, the weakened state of the European economy helped to drive the aggregate growth in European payments volumes below the 10-year average in 2010, but that was still far above average GdP growth, and some payments markets fared far better than others.
The volume of non-cash payments grew significantly in Poland, for example, due to sustained economic growth, proactive steps by market stakeholders, efforts to expand the merchant cards acceptance network (POS), and a drive to reduce the size of the unbanked population (which dropped from 34% in 2009 to 30% in 20107)8. Non-cash usage in Poland
has now reached the same level as in Italy, in terms of transactions per inhabitant (see Figure 1.3). In the future, m-payment schemes based on the recently introduced real-time low-value payments clearing infrastructure are also likely to fuel growth.
In Finland, a high level of IT readiness, a government-driven digitization agenda, and a long tradition of collaboration between the public and financial sectors have all helped to drive adoption of non-cash payment methods. For example, Finland is one of the first markets to have successfully migrated to the SEPA Credit Transfer (SCT). The key success factors in Finland’s development of its non-cash segment include the State Treasury of Finland’s promotion of electronic payments, a public sector focus on developing non-cash payment channels, and Finland’s readiness to have common standards-based solutions.
Finland, like Sweden, also has a highly developed electronic payments infrastructure for e-commerce, and a financially and technologically sophisticated general population that is comfortable with adopting new electronic payment methods. Finland topped the U.S. in terms of non-cash transactions per inhabitant in 2010 (361 vs. 347), and the two are closely followed by Sweden (323, see Figure 1.3).
7 data.worldbank.org, accessed June 6th, 2012.8 Note that comparable data is not available pre-2009, so long-term trends are difficult to capture accurately from these data points.
figure 1.3 Number of Non-Cash Transactions per Inhabitant, Select European Countries and North America, 2001–2010FIGURE 1.4. Number of Non-Cash Transactions per Inhabitant, Select European Countries and North America, 2001–2010
2009 201020082007200620052004200320022001
0
50
100
150
200
250
300
350
400
Non
-Cas
h Tr
ansa
ctio
ns p
er In
hab
itant
CAGR Growth
’01−’09 ’09−’10
10%
3%
14%
10%
3%
5%
3%4%
5%
14%4%
3%17%11%
4%
9%5%
6%
8%
3%8% 10%
8%
2%
5%
7%
5%3%
4%
1%4%
1%14%1%
3%
(1%)6%
7%
Sweden
Luxembourg
Denmark
France
Austria
Netherlands
Germany
Belgium
Ireland
Slovenia
Portugal
Spain
Italy
Poland
Greece
Canada
U.K.
U.S.
Finland
Note: France credit card data not available for all years. Chart numbers and quoted percentages may not add up due to rounding. Some numbers may differ from data published in WPR 2011 due to updates of source dataSource: Capgemini Analysis, 2012; ECB Statistical Data Warehouse, 2010 figures released November 2011; Bank for International Settlements Red Book, 2010 figures released December 2011; Central Bank Annual Reports, 2010
11World Payments rePort 2012
SECTION 1GLOBAL vOLUME OF NON-CASH PAyMENTS CONTINUES TO SHOW HEALTHy GAINS
figure 1.4 Number of Non-Cash Transactions (Billion), Select European Countries, 2001–2010FIGURE 1.3. Number of Non-Cash Transactions (Billion), Select European Countries, 2001–2010
0 3 6 9 12 15 18
Denmark
Poland
Sweden
U.K.
Luxembourg
Greece
Slovenia
Ireland
Portugal
Finland
Austria
Belgium
Italy
Netherlands
Spain
Germany
FranceE
uroz
one
Non
-Eur
ozon
e
(Billion)
CAGR
4%
3%
15%
6%
3%
5%
10%
9%
6%
10%
4%
11%
15%
5%
11%
16%
7%
’01–’10CAGR
4%
3%
5%
6%
3%
5%
4%
6%
6%
5%
2%
6%
10%
4%
11%
18%
6%
’06–’10Growth
5%
5%
1%
7%
1%
5%
2%
10%
6%
(1%)
4%
2%
10%
4%
9%
15%
7%
’09–’10
Decline in Growth Rate
High Recent Growth
Stable Growth Rate
■ 2001■ 2004■ 2006■ 2008■ 2010
Note: Of these 17 countries, 13 were members of the Eurozone in 2007 (Austria, Belgium, Finland, France, Germany, Greece, Ireland, Italy, Luxembourg, Portugal, Netherlands, Slovenia, and Spain), and 4 are non-Eurozone countries (Denmark, Poland, Sweden, and the UK). Chart numbers and quoted percentages may not add up due to rounding. Some numbers may differ form data published in WPR 2011 due to updates in source data
Source: Capgemini Analysis, 2012; ECB Statistical Data Warehouse, 2010 figures released November 2011; Bank for International Settlements Red Book, 2010 figures released December 2011; Central Bank Annual Reports, 2010
12
BRIC MARKETS ShOW uNIquE NON-CASh PREfERENCES AND ADOPTION RATES
While the BRIC countries share certain economic similarities, each is at a very different stage of maturity in terms of payments. Brazil’s payments market, for instance, has grown very rapidly, and with 20 billion non-cash transactions in 2010 is bigger than the individual European leaders. India, by contrast, still has a nascent payments market, while Russia and China are BRIC’s powerhouses of payments growth, though their levels of usage per inhabitant are still low.
In the BRIC bloc as a whole, non-cash transaction volumes rose 15.5% in 2010, slowing somewhat from the 22.9% growth rate in 2009 but showing a sustained gain in usage of 14.3% a year from 2001 through 2010. during that time, there has also been a tangible shift in the mix of payments instruments, with cards accounting for 38% of all BRIC non-cash payments in 2010, up from just 14% in 2001. However, the diversity of BRIC is evident in transactions data (see Figure 1.5). For example:
� Brazil is the largest and most mature of the BRIC payments markets. The number of non-cash payments there rose 8.9% in 2010 to 20.0 billion, making it the third-largest payments market in the world, behind the U.S. and Eurozone and ahead of the U.k. Brazil’s strong GdP growth, and the extension of banking networks through the creation of non-bank ‘banking agents’ are key drivers of Brazil’s non-cash payments. Usage per inhabitant has grown very fast, and has reached a level approaching that seen in some developed European markets (103 transactions per inhabitant in 2010). The use of cards continued to grow in 2010, benefitting from an extended POS network built during hyperinflation times, but credit transfers remain the most-used of the payments instruments. The Brazilian regulator has been making deliberate efforts to promote the development of retail payment systems since 2005 (e.g., ACH and the direct debit Authorization (ddA) scheme), issuing reports and directives to address the inefficiencies it was able to identify in the payments market.
� Russia’s non-cash payments market is the tenth largest in the world, and is growing fast, with volumes rising 33.9% in 2010, and showing sustained growth of 26.3% per year in 2001-10. during that time, card usage has increased to 27% of all transactions from just 3%, reducing somewhat the dominance of credit transfers (to a 70% market share in 2010 from 95% in 2001). Efforts to broaden access to banking are successfully extending into rural areas, and a 2010 federal act created a special legal
entity known as a ‘payment agent,’ which allows rural customers to make payments via payment terminals and ATMs that are not part of the standard retail bank market infrastructure. In Russia, this legislation is now considered a major driver for innovation in retail payments. Expansion of the card networks could also fuel growth, despite a delay in launching the publicly sponsored ‘Universal Electronic Card’ domestic cards scheme. direct debit payment schemes have not taken off in Russia, and credit transfers are still favored by corporate and public-sector users. Russia is also seeing strong growth in electronic money and retail payments, mainly driven by various non-bank initiatives, which are benefitting from their relatively less stringent legal environment, and limited innovation by the banking industry.
� India is currently the 13th largest non-cash payments market in the world, but has the potential to grow significantly. volumes have been growing about 10% a year as the National Payments Corporation of India (NPCI) continues to drive infrastructure improvements and the development of cheap and efficient electronic payment instruments (e.g., m-payments, the RuPay domestic cards scheme, and a biometric authentication card system that is currently being rolled out). Although non-cash payments growth in India is behind the more enthusiastic pace of other BRIC nations, it may pick up as the awareness and popularity of the above-mentioned innovations spreads. Thus far, however, the long-time reliance on checks in the B2B sphere and the use of cash in commerce have kept check and cash usage high. The market share of checks has continued to decline gradually, however—to 59% of all transactions in 2010 from 93% in 2001—during which time the market shares of cards and credit transfers have increased.
� China is the eighth largest payment market, and volumes jumped 30.3% in 2010. The use of cards now predominates, though cash is still used heavily for retail payments—as it is in India and Russia. Credit transfers are the next most commonly used and reliable method of settlement, as concerns persist about the security of e-banking, and even the use of cash, given the f low of counterfeit currency. Still, online shopping is becoming more commonplace, especially among residents of major cities. The payment options on Taobao.com, the most popular on-line shopping website in China, include multiple card and non-card settlement options. The directive on electronic payments, enacted by China in 2005, also guided banks on providing e-payment services, and adopted measures to handle checks electronically, and improve check processing efficiency.

13World Payments rePort 2012
SECTION 1GLOBAL vOLUME OF NON-CASH PAyMENTS CONTINUES TO SHOW HEALTHy GAINS
figure 1.5 Comparison Within BRIC of Non-Cash Transactions (Billion) and Payments Mix (%), 2001, 2009–10
0
10
20
30
Chi
na20
10
Chi
na20
09
Chi
na20
01
Ind
ia20
10
Ind
ia20
09
Ind
ia20
01
Rus
sia
2010
Rus
sia
2009
Rus
sia
2001
Bra
zil
2010
Bra
zil
2009
Bra
zil
2001
Non
-Cas
h Tr
ansa
ctio
ns(B
illio
n)
7.3
18.420.0
0.52.8 3.8
1.0 2.1 2.3 1.2
5.47.0
CAGR 11.8%
CAGR 26.3%
CAGR 10.4%
CAGR 21.8%
12.1%8.9%
25.4%33.9%
10.4%
20.8%30.3%
10.0%
16%
5%
45%
34%
28%
23%
39%
10%
32%
21%
39%
24%
5%
71%
19%
7%
9%
65%
21%
7%
13%
59%
65%
4%
15%
16%
69%
4%
15%
13%
12%
6%
80%
27%
4%
70%
6%
93%
8%
95%
100%
75%
50%
25%
0%
Pay
men
t In
stru
men
ts M
ix(%
)
3%
1%1%
2%
■ Cards ■ Direct Debits ■ Credit Transfers ■ Checks
Note: China 2010 direct debit data are estimates (data not available); Brazil 2009 and 2010 data was updated from BIS 2012 Red Book, and deviated significantly from previous years. Chart numbers and quoted percentages may not add up due to rounding. Some numbers may differ form data published in WPR 2011 due to updated source dataSource: Capgemini Analysis, 2012; ECB Statistical Data Warehouse, 2010 figures released November 2011; Bank for International Settlements Red Book, 2010 figures released December 2011; Central Bank Annual Reports, 2010

14
GlOBAl PAyMENTS VOluMES ARE ExPECTED TO hAVE REAChED 306 BIllION IN 2011
While data has yet to be finalized, initial estimates suggest global non-cash payments transactions reached 306 billion in 2011 (see Figure 1.6). The growth rate among developed economies is likely to be up slightly (5.6% vs. 4.9% in 2010), but the increase in developing economies is likely to have been far more robust (18.4%). As a result, the share of payments volumes from developed markets will have slipped to around 77.7% from 79.5% in 2010, and the trend is expected to extend in the long term.
Notably, 2011 is likely to confirm the key role of powerhouses Russia and China in driving global payments volumes. BRIC volumes as a whole are expected to show growth of 16.2% in 2011, with the use of cards growing even faster, to account for 43% of BRIC payments. But growth in developing-market
payments extends far beyond Russia and China; prime examples of other fast-growing developing payments markets include Turkey and Ukraine (both within CEMEA), and Mexico.
Initial data on world exports suggests large-value trade-related payments traffic will rise again in 2011. The value of world exports rose 22% in 2010, and had topped pre-crisis levels to reach US$4.6 trillion by the end of September 2011. M-payments, meanwhile, could get a boost from the recovery of workers’ remittances, which started to rise again in 2010 (up 5.0%) and are expected to grow 8.0% in 2011. Much of the future growth in remittance f lows is likely to be driven by countries in Central and Eastern Europe, Central Asia, Sub-Saharan Africa, and South Asia, and many such payments are made in mobile form, or using other means.
figure 1.6 Number of Worldwide Non-Cash Transactions (Billion), by Region, 2010–2011E
0
80
160
240
320
2011E2010
117
81
27
33
11
122
85
30
39
1487
76
283
306
CAGR Growth
Global
Latin America
Rest of Asia
CEMEA
BRIC
Mature Asia-Paci�c
Europe (including Eurozone)
North America (U.S. and Canada)
Developing Economies
Mature EconomiesN
on-C
ash
Tran
sact
ions
(Bill
ion)
7.1%
16.0%
17.3%
34.1%
14.3%
15.0%
5.4%
4.2%
8.2%
18.0%
15.7%
26.6%
16.2%
10.8%
4.8%
4.9%
’01–’10 ’10–’11E
Growth
18.4%
5.6%
’10–’11E
Note: CEMEA (Central Europe, Middle East, Africa) includes South Africa for 2009 and 2010, but the 2008-09 growth rate excludes South Africa for consistency; Mature Asia-Pacific includes Japan, Australia, South Korea and Singapore; Latin America does not include Brazil, which is included in BRIC. Chart numbers and quoted percentages may not add up due to rounding, and year-on-year percentage changes are based on the underlying data, which is carried to multiple decimal places, so may not match the changes as calculated by averaging the rounded data shown on figures. Some numbers may differ from data published in WPR 2011 due to updates of source dataSource: Capgemini Analysis, 2012; ECB Statistical Data Warehouse, 2010 figures released November 2011; Bank for International Settlements Red Book, 2010 figures released December 2011; Central Bank Annual Reports, 201010 Federal Reserve Payments Study, April 2011

15
As noted, while the growth in non-cash payments volumes is being powered by emerging markets, mature economies accounted for 79.5% of all non-cash payments in 2010. Mature Asia-Pacific (Australia, Japan, Singapore, and South Korea) is a key franchise within that group, and it is expected to account for nearly 10% of all non-cash payments in the world in 2011.
South Korea, Japan, and Australia all feature among the world’s ten largest non-cash payments markets (5th, 7th, and 9th, respectively) and while each is different, they all share some common prevailing trends, especially the rising use of cards, and persistent payments innovation. A few facts offer a taste of each market:
Australia � Non-cash payments market highly developed—283 transactions per inhabitant in 2010, among the highest in the world.
� 6.3 billion non-cash transactions in 2010, up 8.3%, cards accounted for 61% of all transactions in 2010; next most popular instrument, credit transfers, accounted for 24%.
� Payment system still evolving; moving away from bilateral clearing, and setting up hub infrastructures will enable future growth.
� The Reserve Bank of Australia’s Payments System Board is reviewing the payment systems; eyeing areas where stakeholders and regulators can cooperate to promote innovation, and open the market to newcomers.
Mature Asia-Pacific Is Home to Three of the Ten Largest Non-Cash Payments Markets in the World
South Korea � Well-developed non-cash payments markets—244 transactions per inhabitant in 2010.
� Volume growth strong nevertheless—up 13.7% to reach 11.9 billion in 2010.
� Cards accounted for 60% of total volumes in 2010. In cards segment:
— Penetration (credit, debit, and prepaid combined) is quite high.
— Explosive growth in cards market over the past four years; usage incentivized by government tax breaks, and aggressive marketing by issuers.
— Debit-card usage still relatively low (compared to other developed economies). Credit cards alone accounted for about 50% of all non-cash transactions in 2010, after usage grew 19.9% from 2009.
Japan � Non-cash payments volumes up 11.9% to 8.5 billion transactions in 2010; usage still relatively low for a developed market (67 non-cash transactions per inhabitant in 2010).
� Credit cards accounted for 81% of total 2010 volume.
� Payment Services Act (2010) is promoting competition and innovation by allowing non-banks to provide funds transfer services that were previously restricted to banks.
� Payments-infrastructure improvements ongoing; ISO20022 message standards implemented in retail payment system in 2011.
� Osaifu-Keitai (‘Wallet Mobile’), developed by NTT DoCoMo, is now the de facto standard m-payment system; lets consumers use phones as substitute for cash/cards at vending machines and merchant POS. Offers range of payment services, including e- money, identity card, loyalty card, public transport ticketing (railways, buses, air travel), and credit card.
WORLd PAyMENTS REPORT 2012
16
9 Industry analysts have amended their forecasts for e-payments noticeably, and for m-payments significantly in the last year, so estimates vary tangibly from those reported in WPR 2011.
10 Gartner Says Worldwide Mobile Payment Users to Reach 141 Million in 2011, Gartner, published, July 21, 2011, http://www.gartner.com/it/page.jsp?id=1749114
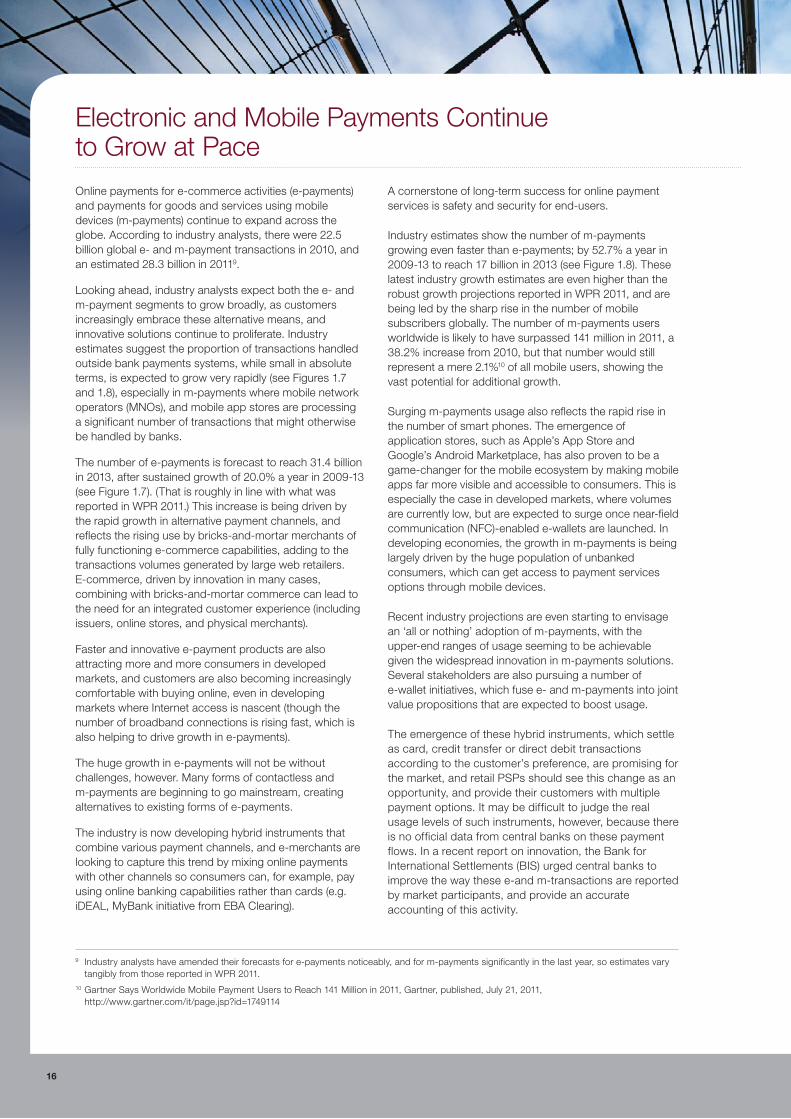
Online payments for e-commerce activities (e-payments) and payments for goods and services using mobile devices (m-payments) continue to expand across the globe. According to industry analysts, there were 22.5 billion global e- and m-payment transactions in 2010, and an estimated 28.3 billion in 20119.
Looking ahead, industry analysts expect both the e- and m-payment segments to grow broadly, as customers increasingly embrace these alternative means, and innovative solutions continue to proliferate. Industry estimates suggest the proportion of transactions handled outside bank payments systems, while small in absolute terms, is expected to grow very rapidly (see Figures 1.7 and 1.8), especially in m-payments where mobile network operators (MNOs), and mobile app stores are processing a significant number of transactions that might otherwise be handled by banks.
The number of e-payments is forecast to reach 31.4 billion in 2013, after sustained growth of 20.0% a year in 2009-13 (see Figure 1.7). (That is roughly in line with what was reported in WPR 2011.) This increase is being driven by the rapid growth in alternative payment channels, and reflects the rising use by bricks-and-mortar merchants of fully functioning e-commerce capabilities, adding to the transactions volumes generated by large web retailers. E-commerce, driven by innovation in many cases, combining with bricks-and-mortar commerce can lead to the need for an integrated customer experience (including issuers, online stores, and physical merchants).
Faster and innovative e-payment products are also attracting more and more consumers in developed markets, and customers are also becoming increasingly comfortable with buying online, even in developing markets where Internet access is nascent (though the number of broadband connections is rising fast, which is also helping to drive growth in e-payments).
The huge growth in e-payments will not be without challenges, however. Many forms of contactless and m-payments are beginning to go mainstream, creating alternatives to existing forms of e-payments.
The industry is now developing hybrid instruments that combine various payment channels, and e-merchants are looking to capture this trend by mixing online payments with other channels so consumers can, for example, pay using online banking capabilities rather than cards (e.g. iDEAL, MyBank initiative from EBA Clearing).
A cornerstone of long-term success for online payment services is safety and security for end-users.
Industry estimates show the number of m-payments growing even faster than e-payments; by 52.7% a year in 2009-13 to reach 17 billion in 2013 (see Figure 1.8). These latest industry growth estimates are even higher than the robust growth projections reported in WPR 2011, and are being led by the sharp rise in the number of mobile subscribers globally. The number of m-payments users worldwide is likely to have surpassed 141 million in 2011, a 38.2% increase from 2010, but that number would still represent a mere 2.1%10 of all mobile users, showing the vast potential for additional growth.
Surging m-payments usage also reflects the rapid rise in the number of smart phones. The emergence of application stores, such as Apple’s App Store and Google’s Android Marketplace, has also proven to be a game-changer for the mobile ecosystem by making mobile apps far more visible and accessible to consumers. This is especially the case in developed markets, where volumes are currently low, but are expected to surge once near-field communication (NFC)-enabled e-wallets are launched. In developing economies, the growth in m-payments is being largely driven by the huge population of unbanked consumers, which can get access to payment services options through mobile devices.
Recent industry projections are even starting to envisage an ‘all or nothing’ adoption of m-payments, with the upper-end ranges of usage seeming to be achievable given the widespread innovation in m-payments solutions. Several stakeholders are also pursuing a number of e-wallet initiatives, which fuse e- and m-payments into joint value propositions that are expected to boost usage.
The emergence of these hybrid instruments, which settle as card, credit transfer or direct debit transactions according to the customer’s preference, are promising for the market, and retail PSPs should see this change as an opportunity, and provide their customers with multiple payment options. It may be difficult to judge the real usage levels of such instruments, however, because there is no official data from central banks on these payment flows. In a recent report on innovation, the Bank for International Settlements (BIS) urged central banks to improve the way these e-and m-transactions are reported by market participants, and provide an accurate accounting of this activity.
Electronic and Mobile Payments Continue to Grow at Pace

17World Payments rePort 2012
figure 1.8 Number of Global M-payments Transactions (Billion), 2009–2013f
0
4
8
12
16
20
2013F2012F201120102009
M-P
aym
ent
Tran
sact
ions
(Bill
ion)
3.0 3.0
0.2 0.23.1 3.1
4.3 4.3
0.3 0.34.6 4.6
6.3 6.5
0.5 0.66.8 7.0
9.0 9.8
0.81.09.8
14.1
1.2
15.3
15.3
1.7
17.0
10.7
Total
Non-Bank Providers
■ WPR 2011 - Banks■ WPR 2011 - Non-Banks
■ 2012 Industry Estimates - Banks■ 2012 Industry Estimates - Non-Banks
48.8%
67.3%
Bank Providers 47.6%
52.7%
81.6%
50.7%
Industry forecasts for 2011-13 m-payments have seen signi�cant upward adjustments even since those prevailing at the time WPR 2011 was published
WPR 2011CAGR
’09–’13F
2012 Industry Estimates
’09–’13F
Note: Mobile (m-) payments are payments for goods and services made using mobile devices; Chart numbers and quoted percentages may not add up due to rounding. Some numbers may differ form data published in WPR 2011 due to change in growth rates used for estimationSource: Capgemini Analysis, 2012; Mobile Payments 2012, Innopay; “PayPal Mobile generating $6M daily in total payment volume,” May 25th 2011, Mobile Marketer; “Juniper Research Projects Mobile Payments Industry to Triple in Value in Four Years,” July 5th 2011, www.mobilemarketingwatch.com; 4Q.2011 Global Mobile Payment Market Forecast 2010-2016: “Global mobile payments users to hit 1 billion in 2016 with $998.5 billion in transaction value,” Feb 8th 2012, IE Market Research Corporation
figure 1.7 Number of Global E-Payments Transactions (Billion), 2009–2013fFIGURE 1.8. Number of Global E-Payments Transactions (Billion), 2009-2013F
0
5
10
15
20
25
30
35
2013F2012F201120102009
E-P
aym
ent
Tran
sact
ions
(Bill
ion)
14.2 14.2
0.9 0.915.1 15.1
16.8 16.7
1.2 1.217.9 17.9
19.8 19.5
1.5 1.8
21.3 21.3
23.4 22.8
2.0 2.6
25.4
27.6
2.7
30.3
27.5
3.8
31.4
25.4
WPR 2011CAGR
’09–’13F
Total
Alternative Paymentsa
■ WPR 2011 - Banks■ Alternative Payments
■ 2012 Industry Estimates - Banks■ 2012 Industry Estimates - Alternative Payments
Non-Banking Competition
19.1%
32.1%
Debit, Credit, Prepaid Cards 18.1%
2012 Industry Estimates
’09–’13F
20.0%
43.6%
18%
Industry estimates of e-payments transaction volumes have been amended noticeably even since those used just a year ago, in WPR 2011
a. Alternative payments are carried out by non-bank firms such as e-money licensed institutions, mobile phone and telecom firms, large retailers, etcNote: Electronic (e-) payments are online payments for e-commerce activities; Chart numbers and quoted percentages may not add up due to rounding. Some numbers may differ form data published in WPR 2011 due to change in growth rates used for estimationSource: Capgemini Analysis, 2012; Advance Payments Report 2011, Edgar, Dunn & Company; Visa, MasterCard, eBay, and American Express Annual Reports 2010, 2011
The global volume of non-cash payments continued to show decent growth even in developed markets in 2010, despite the ongoing effects of the global economic crisis, and payments expanded especially fast in emerging economies such as Russia and China. Poland and Brazil continued to show superior performance, and have joined the ranks of the world’s most mature payment markets. The outlook for 2011 and 2012 could be less optimistic, however, given increasing signs of global economic weakness and persistent fallout from the Eurozone debt crisis. Nevertheless, innovation in the payments space is still likely to drive expansion.
In fact, the surging use of m-payments especially shows the potential for payments to expand far beyond the confines of the traditional banking system, driven in particular by non-banks that have identified an opportunity to cater to niche customer needs, and leverage technology to execute successfully.
At this stage, it is not clear the extent to which non-cash payments are moving out from the traditional banking system, as it is becoming increasingly difficult to track and measure non-cash payments f lows through innovative channels, which defy unambiguous definition. For example, if a payment product supports multiple access channels, it could allow payments to be initiated via the Internet or the mobile communication network and settle as a card. The industry and regulators need to agree on some standards to capture such payments activity in a consistent and meaningful way.
Banks, of course, remain critical players in the payments space, but they have a challenging path to navigate, constrained at times by regulatory frameworks, and legacy businesses and infrastructures. As the size and shape of the payments landscape expands, banks will nevertheless need to continue to pursue an innovation agenda—one that is feasible within the market constraints—but looks to leverage the opportunities presented by new customer demands, and even by certain regulatory and industry initiatives.
In Section 2, we will outline key regulatory and industry initiatives (kRIIs) in the payments space, and explore the impact—positive and negative—on payment services providers (PSPs). In Section 3, we will discuss the innovation options for PSPs, and banks in particular, as customer needs grow and change, and payments means and technology proliferate, resulting in any number of innovative value propositions for customers.
Conclusion
18

World Payments rePort 2012
SECTION 1CONCLUSION
19

20
section title l1section title l2
21World Payments rePort 2012
� Regulators have continued to implement the Key Regulatory and Industry Initiatives (KRIIs) discussed in WPR 2011, and new initiatives have been introduced. The Eurozone debt crisis has accelerated the impetus behind certain KRII objectives, such as Basel III, and that urgency is prompting European banks to comply faster than originally expected. This is challenging their ability to innovate since meeting the considerable imperative to comply dominates time, energy, and financial resources, leaving less bandwidth for innovation.
� Payment service providers (PSPs), especially banks, are feeling intense pressure from the regulatory focus in payments, not least because regulations impact one another, and continuously evolve, thus require constant monitoring and attention. Regionally focused KRIIs have a tendency to be replicated in other regions, so regulators and banks need to ensure that individual regulations are not designed and implemented in a vacuum.
� While individual KRIIs can potentially be net positive or negative for innovation, payments innovation often emerges as KRIIs converge. This is certainly the case for payments processing and servicing, as well as standardization and security—areas in which innovation has regularly emerged as a direct result, or a byproduct, of KRIIs.
� Going forward, KRIIs aimed directly at driving innovation, with changes visible to the customer, have great potential to result in substantive change. Contactless cards / NFC initiatives offer a prime example. An increasing number of smart phones are being equipped with NFC technology, suggesting the market is becoming ready to drive usage of NFC technology in the payments industry. The bank and non-bank players piloting NFC innovations include major names like Google, PayPal, MasterCard, Visa, and Apple. The combination of industry initiatives, core bank infrastructure and non-bank players has and will be a powerful force of transformation in payments.
� Even SEPA, long focused on compliance, may perhaps soon be viewed more for its innovation potential. As the legal certainty around SEPA migration grows stronger, PSPs can start to look beyond the migration phase, and toward the SEPA platform to promote competition, efficiency, and innovation.
� The SEPA migration deadline is fast-approaching and significant preparation is required, so firms need to act soon if they have yet to commence their preparations. The deadline for migrating to SEPA Credit Transfers (SCT) and SEPA Direct Debits (SDD) has been set at February 1st, 2014, shifting the focus on SEPA migration from ‘when?’ to ‘how?’ While SCT adoption rates have been steadily increasing since the launch date, SDDs have shown little progress thus far.
� Ongoing uncertainty around key aspects of SEPA requirements raises the possibility that SEPA benefits may not be fully realized. Outstanding issues include the need for a common interpretation of SEPA requirements, certainty around exceptions being requested in Member State transition options, and assurances that technical interoperability can indeed be achieved. The industry is already looking for ways to leverage SEPA as a platform, and use the standardization that SCT and SDD offer to drive innovation.
Ke
y F
ind
ing
sAbility to Innovate is Challenged Amid Sea of Key Regulatory and Industry Initiatives
2
22
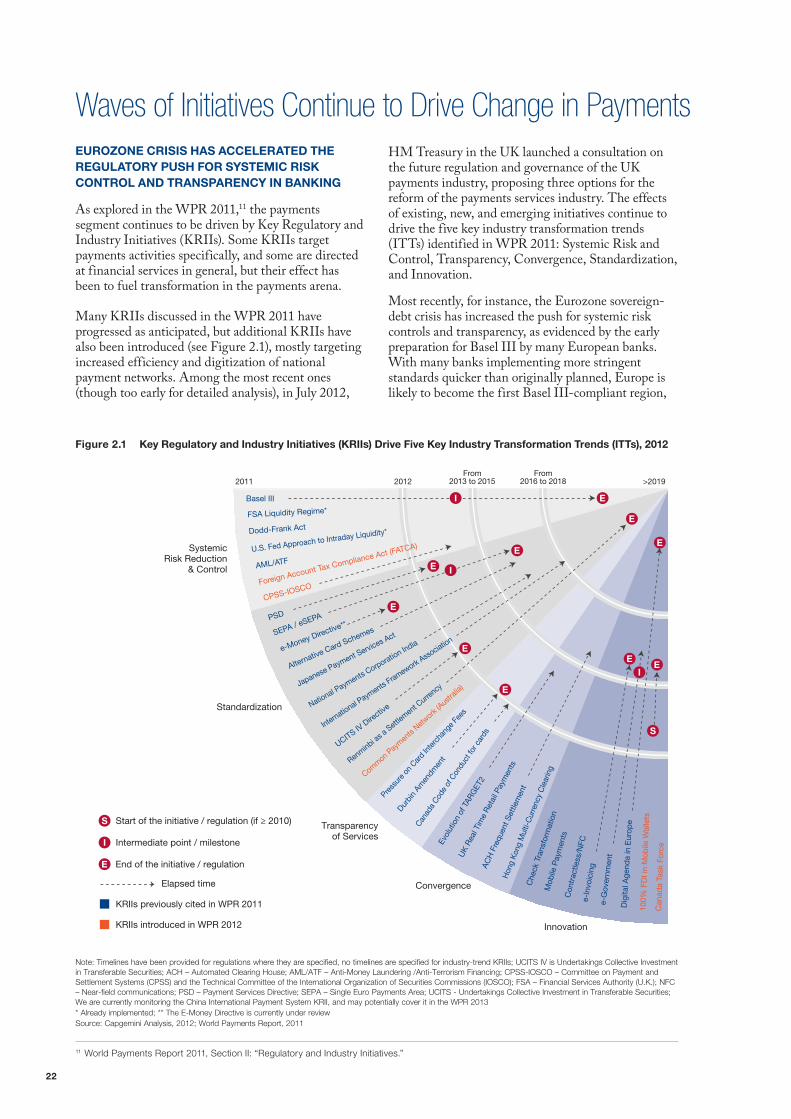
figure 2.1 Key Regulatory and Industry Initiatives (KRIIs) Drive five Key Industry Transformation Trends (ITTs), 2012
FIGURE 2.1. Key Regulatory and Industry Initiatives (KRIIs) Drive Five Key Industry Transformation Trends (ITTs), 2012
Basel III
FSA Liquidity Regime*
Dodd-Frank Act
U.S. Fed Approach to Intraday Liquidity*
AML/ATF
CPSS-IOSCOForeign Account Tax Compliance Act (FATCA)
PSD
SEPA / eSEPA
e-Money Directive**
Alternative Card Schemes
Japanese Payment Services Act
National Payments Corporation India
International Paym
ents Framework Asso
ciation
UCITS IV D
irectiv
e
Renminbi a
s a Sett
lemen
t Curre
ncy
Common Pay
ments
Network
(Austra
lia)
Press
ure o
n Car
d Int
erch
ange
Fee
s
Durbi
n Am
endm
ent
Canad
a Cod
e of
Con
duct
for c
ards
Evol
utio
n of
TAR
GET
2
UK
Rea
l Tim
e R
etai
l Pay
men
ts
AC
H F
requ
ent S
ettle
men
t
Hon
g K
ong
Mul
ti-C
urre
ncy
Cle
arin
g
Che
ck T
rans
form
atio
nM
obile
Pay
men
tsC
ontr
actle
ss/N
FCe-
Invo
icin
ge-
Gov
ernm
ent
Dig
ital A
gend
a in
Eur
ope
100%
FD
I in
Mob
ile W
alle
ts
Can
ada
Task
For
ce
2012 >2019From
2016 to 2018From
2013 to 20152011
Systemic Risk Reduction
& Control
Standardization
Transparencyof Services
Start of the initiative / regulation (if ≥ 2010)
Intermediate point / milestone
End of the initiative / regulation
Elapsed time Convergence
Innovation
KRIIs previously cited in WPR 2011
KRIIs introduced in WPR 2012
Note: Timelines have been provided for regulations where they are specified, no timelines are specified for industry-trend KRIIs; UCITS IV is Undertakings Collective Investment in Transferable Securities; ACH – Automated Clearing House; AML/ATF – Anti-Money Laundering /Anti-Terrorism Financing; CPSS-IOSCO – Committee on Payment and Settlement Systems (CPSS) and the Technical Committee of the International Organization of Securities Commissions (IOSCO); FSA – Financial Services Authority (U.K.); NFC – Near-field communications; PSD – Payment Services Directive; SEPA – Single Euro Payments Area; UCITS - Undertakings Collective Investment in Transferable Securities; We are currently monitoring the China International Payment System KRII, and may potentially cover it in the WPR 2013* Already implemented; ** The E-Money Directive is currently under reviewSource: Capgemini Analysis, 2012; World Payments Report, 2011
11 World Payments Report 2011, Section II: “Regulatory and Industry Initiatives.”
EuROzONE CRISIS hAS ACCElERATED ThE REGulATORy PuSh fOR SySTEMIC RISK CONTROl AND TRANSPARENCy IN BANKING
As explored in the WPR 2011,11 the payments segment continues to be driven by key Regulatory and Industry Initiatives (kRIIs). Some kRIIs target payments activities specifically, and some are directed at financial services in general, but their effect has been to fuel transformation in the payments arena.
Many kRIIs discussed in the WPR 2011 have progressed as anticipated, but additional kRIIs have also been introduced (see Figure 2.1), mostly targeting increased efficiency and digitization of national payment networks. Among the most recent ones (though too early for detailed analysis), in July 2012,
HM Treasury in the Uk launched a consultation on the future regulation and governance of the Uk payments industry, proposing three options for the reform of the payments services industry. The effects of existing, new, and emerging initiatives continue to drive the five key industry transformation trends (ITTs) identified in WPR 2011: Systemic Risk and Control, Transparency, Convergence, Standardization, and Innovation.
Most recently, for instance, the Eurozone sovereign-debt crisis has increased the push for systemic risk controls and transparency, as evidenced by the early preparation for Basel III by many European banks. With many banks implementing more stringent standards quicker than originally planned, Europe is likely to become the first Basel III-compliant region,
Waves of Initiatives Continue to Drive Change in Payments

23World Payments rePort 2012
SECTION 2WAvES OF INITIATIvES CONTINUE TO dRIvE CHANGE IN PAyMENTS
12 ‘Basel III monitoring exercise,’ April 2012, http://www.eba.europa.eu/Publications/Quantitative-ImpactStudy/Basel-III-monitoring-exercise.aspx
and could provide a blueprint for others. Such a ‘rush to comply’ also highlights how regulatory initiatives can be propelled by market events. In this case, many banks are keen to adopt Basel III as a way of demonstrating to market counterparties and regulators that they are stable institutions amid the volatility of the Eurozone crisis.
Nevertheless, ongoing fallout from the Eurozone and global financial crises could still drive additional regulation, while existing initiatives, such as the Single Euro Payments Area (SEPA) are starting to hit initial implementation milestones, and setting the stage for truly transformative change in payments in the medium-term.
dodd-Frank Section 1073 is another example of a highly transformative initiative on which the industry is now focusing, given its fast-approaching deadline of February 2013. Sections 1073’s provisions include requirements related to guarantees on delivery (or receipt) of funds, full disclosure of fees and exchange rates at the time of origination, post-transaction cancellation options under certain circumstances,
and error-resolution remedies. (See ‘key Regulatory and Industry Initiatives (kRIIs) in Payments, 2012’, p24 for more detail on newly introduced kRIIs and updates on previously documented kRIIs).
One bank mentioned that “For a Bank with a global footprint it can be challenging to keep abreast of current and emerging regulation on a national, regional and global basis.” Overall, the breadth and depth of kRIIs in payments are so extensive that the need for regulatory compliance could even test the ability of banks to invest as much as they might like in payment innovations. This is especially the case when kRIIs specifically demand additional capital. A survey conducted by the Basel Committee, for example, indicated as of June 2011 that the largest global banks need an extra €485 billion in their core reserves to meet Basel III capital rules12.
The global ‘heat map’ of kRIIs shows widespread and intense pressure on PSPs (see Figure 2.2), though it also highlights the global drive to develop efficient non-cash payment systems, which could provide greater access to and security in payments around the world.
figure 2.2 heat Map of Key Regulatory and Industry Initiatives (KRIIs), Global and Regional, 2012
Note: ACH – Automated Clearing House; AML/ATF – Anti-Money Laundering /Anti-Terrorism Financing ; CPSS-IOSCO – Committee on Payment and Settlement Systems (CPSS) and the Technical Committee of the International Organization of Securities Commissions (IOSCO); FSA – Financial Services Authority (U.K.); NFC – Near-field communications; PSD – Payment Services Directive; SEPA – Single Euro Payments Area; UCITS - Undertakings Collective Investment in Transferable Securities: We are currently monitoring the China International Payment System KRII, and may potentially cover it in the WPR 2013* Already implemented; ** The E-Money Directive is currently under reviewSource: Capgemini Analysis, 2012; World Payments Report, 2011
North America
■ Dodd-Frank Act■ Canada Task Force■ Fed Intraday Liquidity*■ Durbin Amendment■ Canada Code of Conduct for Cards
Asia Pacific
■ Hong Kong Multi-Currency Clearing■ Japanese Payments Services Act■ National Payments Corporation of India ■ Renminbi as a Settlement Currency■ Common Payments Network in Australia■ 100% FDI in Mobile Wallets in India
Europe
■ FSA Liquidity Regime*■ PSD ■ SEPA / eSEPA■ e-Money Directive**■ Evolution of TARGET2 ■ Pressure on Card Interchange Fees■ UK Real Time Retail Payments■ Digital Agenda in Europe■ ACH Frequent Settlement ■ Alternative Card Schemes■ UCITS IV
HIGH
HIGH
LOW
LOW
HIGH
LOW
HIGH
LOW
HIGH IMPACT
IMPACT ON PAYMENTS
LOW IMPACT
Global
■ Basel III■ Checks Transformation■ Mobile Payments■ Contactless Cards / NFC■ Foreign Account Tax Compliance Act (FATCA)■ e-Invoicing■ eGovernment■ CPSS-IOSCO■ International Payments Framework (IPFA) ■ AML / ATF
■ KRIIs cited in WPR 2011
■ KRIIs introduced in WPR 2012

24
Key Regulatory and Industry Initiatives (KRIIs) in Payments, 2012
Key #Key regulatory and
industry initiatives (KRIIs)Description
Initiatives Added to WPR List of KRIIs in WPR 2012
28 Canada Task Force
In December 2011, the Canada Task Force made recommendations to the Ministry of Finance to enhance digitization of payments in Canada. While highlighting the need for the government to lead the change, the report cited overall changes required to provide an updated infrastructure for Canada’s payment system, and identified the pre-requisite legislation.
29U.S. Foreign Account Tax Compliance Act (FATCA)
The FATCA is an effort by the U.S. government to improve tax compliance involving foreign financial assets and offshore accounts. Under FATCA, U.S. taxpayers with specified foreign financial assets that exceed certain thresholds must report those assets to the Internal Revenue Service (IRS). In addition, FATCA will require foreign financial institutions to report directly to the IRS information about financial accounts held by U.S. taxpayers, or held by foreign entities in which U.S. taxpayers hold a substantial ownership interest.
30Australia’s Common Payments Network (CPN)
The CPN, also known as the Community of Interest Network (COIN), provides an alternative to point-to-point connectivity between members of the payment system. The CPN replaces multiple links between individual participants with a single physical connection to the payments network ‘cloud.’ In February 2012, it reached a key milestone related to network connectivity and messaging standards in the Low Value Payments Roadmap, which is expected to reduce the costs of establishing and maintaining physical connections as well as enabling significantly faster file transfers.
31100% Foreign Direct Investment in Mobile Wallets in India
In March 2011, the Reserve Bank of India gave its conditional approval to allow 100% foreign direct investment (FDI) to develop and implement mobile wallets in India. However, the approval is coupled with stiff riders to safeguard the stability of the country’s financial services markets.
32 CPSS-IOSCO
The Committee on Payment and Settlement Systems (CPSS) and the Technical Committee of the International Organization of Securities Commissions (IOSCO) has released a set of standards that are designed to ensure the infrastructure supporting global financial markets is robust enough to withstand financial shocks. Its set of 24 principles applies to financial market infrastructures (FMI), including systemically important payment systems, central securities depositories, securities settlement systems, central counterparties and trade repositories. The new principles will replace existing sets of CPSS and CPSS-IOSCO standards.
Update on Initiatives Explored in WPR 2011
1 Basel III
Implementation of Basel III is being accelerated in Europe, where banks are transitioning from Basel II. To prepare for Basel III’s more stringent capital adequacy requirements, European banks are cutting costs and investments to preserve capital. Liquidity could also become an issue in the future. (Given the importance of liquidity and liquidity reporting requirements, we may also be covering Basel III intraday liquidity reporting requirements in WPR 2013). For now, the ECB is providing low-cost liquidity to banks, but with the re-definition of assets that can be given a 100% weighting as being liquid assets, European banks could ultimately find themselves competing aggressively for increased retail deposits to meet the new liquidity ratios. Also, restructuring done by consumer credit institutions to expand beyond credit operations has the impact of turning them into ordinary banks. In North America, banks effectively leapfrogged Basel II while concentrating on Dodd-Frank requirements, and must now manage dual compliance—even though Dodd-Frank and Basel III are not entirely aligned in their capital requirements.
2U.K. FSA Liquidity Regime
The U.K. Financial Services Authority (FSA) is now shifting its focus from negotiating and developing policy to implementing the liquidity regime for firms through its intensive supervisory approach. In another development, the FSA now requires clearing houses to include a liquidity buffer as part of their capital reserves to meet sudden short-term needs for cash. This is designed to guard against the possibility of a crisis at one clearing house threatening the entire global financial system.
25World Payments rePort 2012
Key #Key regulatory and
industry initiatives (KRIIs)Description
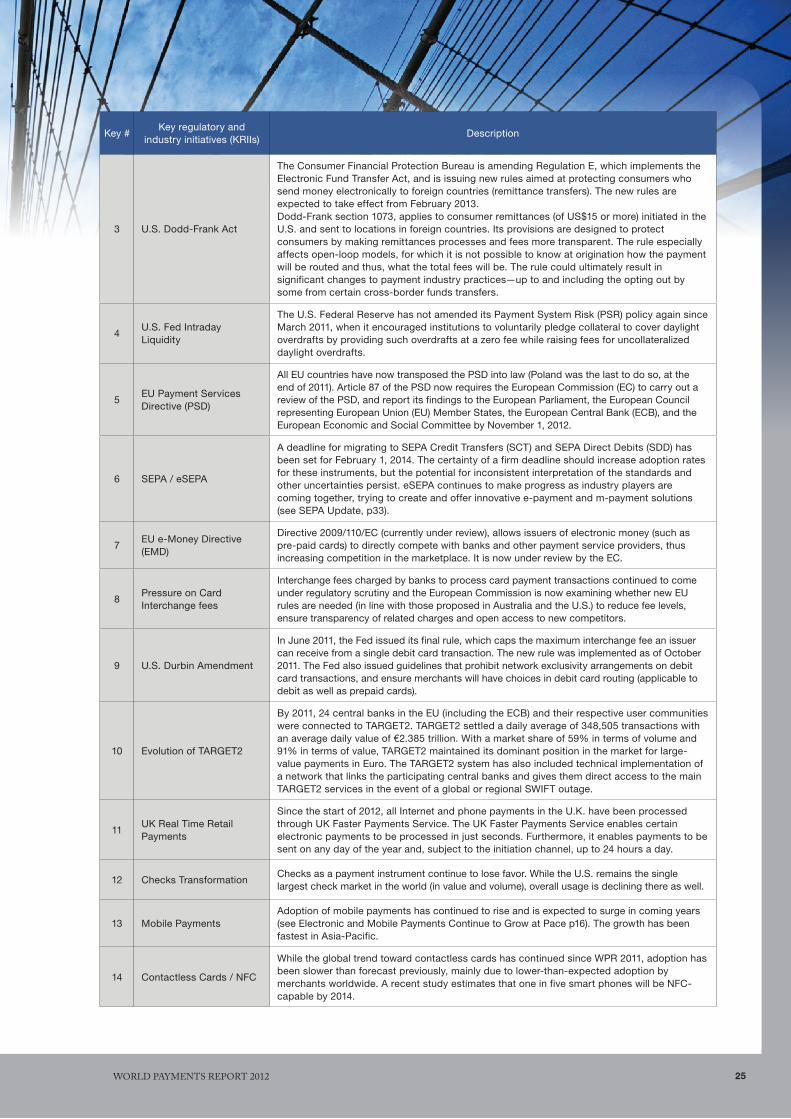
3 U.S. Dodd-Frank Act
The Consumer Financial Protection Bureau is amending Regulation E, which implements the Electronic Fund Transfer Act, and is issuing new rules aimed at protecting consumers who send money electronically to foreign countries (remittance transfers). The new rules are expected to take effect from February 2013.Dodd-Frank section 1073, applies to consumer remittances (of US$15 or more) initiated in the U.S. and sent to locations in foreign countries. Its provisions are designed to protect consumers by making remittances processes and fees more transparent. The rule especially affects open-loop models, for which it is not possible to know at origination how the payment will be routed and thus, what the total fees will be. The rule could ultimately result in significant changes to payment industry practices—up to and including the opting out by some from certain cross-border funds transfers.
4U.S. Fed Intraday Liquidity
The U.S. Federal Reserve has not amended its Payment System Risk (PSR) policy again since March 2011, when it encouraged institutions to voluntarily pledge collateral to cover daylight overdrafts by providing such overdrafts at a zero fee while raising fees for uncollateralized daylight overdrafts.
5EU Payment Services Directive (PSD)
All EU countries have now transposed the PSD into law (Poland was the last to do so, at the end of 2011). Article 87 of the PSD now requires the European Commission (EC) to carry out a review of the PSD, and report its findings to the European Parliament, the European Council representing European Union (EU) Member States, the European Central Bank (ECB), and the European Economic and Social Committee by November 1, 2012.
6 SEPA / eSEPA
A deadline for migrating to SEPA Credit Transfers (SCT) and SEPA Direct Debits (SDD) has been set for February 1, 2014. The certainty of a firm deadline should increase adoption rates for these instruments, but the potential for inconsistent interpretation of the standards and other uncertainties persist. eSEPA continues to make progress as industry players are coming together, trying to create and offer innovative e-payment and m-payment solutions (see SEPA Update, p33).
7EU e-Money Directive (EMD)
Directive 2009/110/EC (currently under review), allows issuers of electronic money (such as pre-paid cards) to directly compete with banks and other payment service providers, thus increasing competition in the marketplace. It is now under review by the EC.
8Pressure on Card Interchange fees
Interchange fees charged by banks to process card payment transactions continued to come under regulatory scrutiny and the European Commission is now examining whether new EU rules are needed (in line with those proposed in Australia and the U.S.) to reduce fee levels, ensure transparency of related charges and open access to new competitors.
9 U.S. Durbin Amendment
In June 2011, the Fed issued its final rule, which caps the maximum interchange fee an issuer can receive from a single debit card transaction. The new rule was implemented as of October 2011. The Fed also issued guidelines that prohibit network exclusivity arrangements on debit card transactions, and ensure merchants will have choices in debit card routing (applicable to debit as well as prepaid cards).
10 Evolution of TARGET2
By 2011, 24 central banks in the EU (including the ECB) and their respective user communities were connected to TARGET2. TARGET2 settled a daily average of 348,505 transactions with an average daily value of €2.385 trillion. With a market share of 59% in terms of volume and 91% in terms of value, TARGET2 maintained its dominant position in the market for large-value payments in Euro. The TARGET2 system has also included technical implementation of a network that links the participating central banks and gives them direct access to the main TARGET2 services in the event of a global or regional SWIFT outage.
11UK Real Time Retail Payments
Since the start of 2012, all Internet and phone payments in the U.K. have been processed through UK Faster Payments Service. The UK Faster Payments Service enables certain electronic payments to be processed in just seconds. Furthermore, it enables payments to be sent on any day of the year and, subject to the initiation channel, up to 24 hours a day.
12 Checks Transformation Checks as a payment instrument continue to lose favor. While the U.S. remains the single largest check market in the world (in value and volume), overall usage is declining there as well.
13 Mobile Payments Adoption of mobile payments has continued to rise and is expected to surge in coming years (see Electronic and Mobile Payments Continue to Grow at Pace p16). The growth has been fastest in Asia-Pacific.
14 Contactless Cards / NFC
While the global trend toward contactless cards has continued since WPR 2011, adoption has been slower than forecast previously, mainly due to lower-than-expected adoption by merchants worldwide. A recent study estimates that one in five smart phones will be NFC-capable by 2014.
26
Key #Key regulatory and
industry initiatives (KRIIs)Description
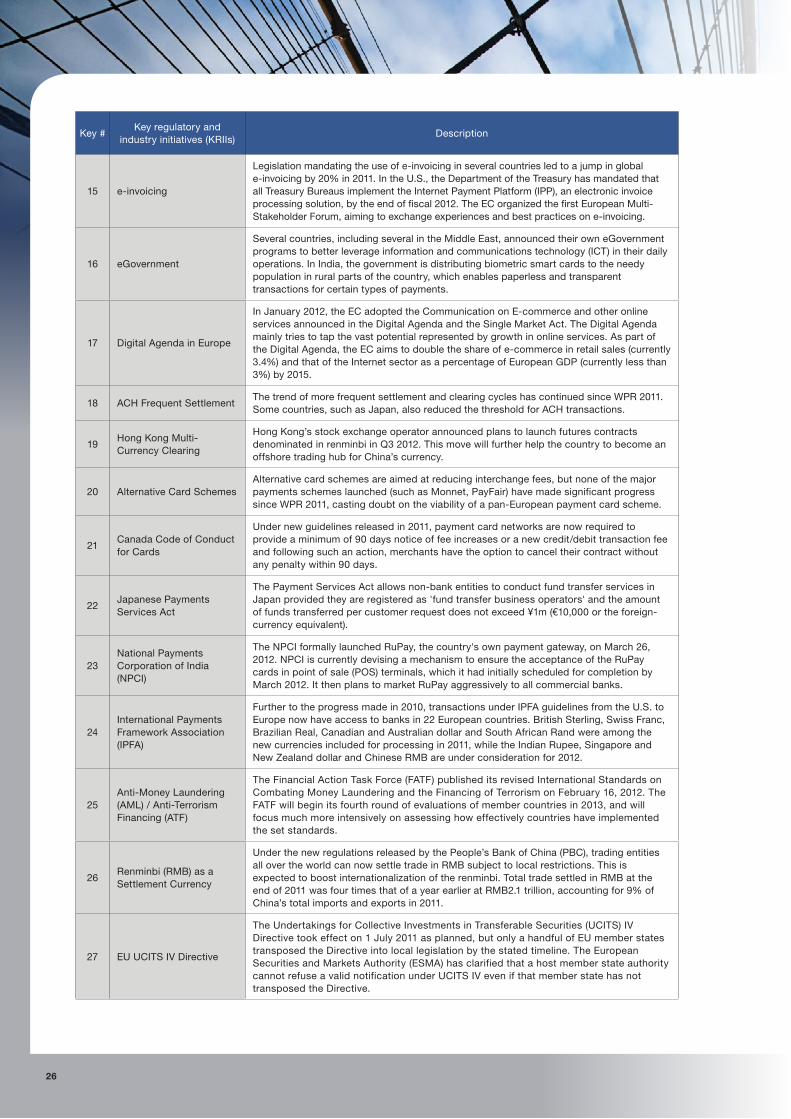
15 e-invoicing
Legislation mandating the use of e-invoicing in several countries led to a jump in global e-invoicing by 20% in 2011. In the U.S., the Department of the Treasury has mandated that all Treasury Bureaus implement the Internet Payment Platform (IPP), an electronic invoice processing solution, by the end of fiscal 2012. The EC organized the first European Multi-Stakeholder Forum, aiming to exchange experiences and best practices on e-invoicing.
16 eGovernment
Several countries, including several in the Middle East, announced their own eGovernment programs to better leverage information and communications technology (ICT) in their daily operations. In India, the government is distributing biometric smart cards to the needy population in rural parts of the country, which enables paperless and transparent transactions for certain types of payments.
17 Digital Agenda in Europe
In January 2012, the EC adopted the Communication on E-commerce and other online services announced in the Digital Agenda and the Single Market Act. The Digital Agenda mainly tries to tap the vast potential represented by growth in online services. As part of the Digital Agenda, the EC aims to double the share of e-commerce in retail sales (currently 3.4%) and that of the Internet sector as a percentage of European GDP (currently less than 3%) by 2015.
18 ACH Frequent Settlement The trend of more frequent settlement and clearing cycles has continued since WPR 2011. Some countries, such as Japan, also reduced the threshold for ACH transactions.
19Hong Kong Multi-Currency Clearing
Hong Kong’s stock exchange operator announced plans to launch futures contracts denominated in renminbi in Q3 2012. This move will further help the country to become an offshore trading hub for China’s currency.
20 Alternative Card Schemes Alternative card schemes are aimed at reducing interchange fees, but none of the major payments schemes launched (such as Monnet, PayFair) have made significant progress since WPR 2011, casting doubt on the viability of a pan-European payment card scheme.
21Canada Code of Conduct for Cards
Under new guidelines released in 2011, payment card networks are now required to provide a minimum of 90 days notice of fee increases or a new credit/debit transaction fee and following such an action, merchants have the option to cancel their contract without any penalty within 90 days.
22Japanese Payments Services Act
The Payment Services Act allows non-bank entities to conduct fund transfer services in Japan provided they are registered as 'fund transfer business operators' and the amount of funds transferred per customer request does not exceed ¥1m (€10,000 or the foreign-currency equivalent).
23National Payments Corporation of India (NPCI)
The NPCI formally launched RuPay, the country's own payment gateway, on March 26, 2012. NPCI is currently devising a mechanism to ensure the acceptance of the RuPay cards in point of sale (POS) terminals, which it had initially scheduled for completion by March 2012. It then plans to market RuPay aggressively to all commercial banks.
24International Payments Framework Association (IPFA)
Further to the progress made in 2010, transactions under IPFA guidelines from the U.S. to Europe now have access to banks in 22 European countries. British Sterling, Swiss Franc, Brazilian Real, Canadian and Australian dollar and South African Rand were among the new currencies included for processing in 2011, while the Indian Rupee, Singapore and New Zealand dollar and Chinese RMB are under consideration for 2012.
25Anti-Money Laundering (AML) / Anti-Terrorism Financing (ATF)
The Financial Action Task Force (FATF) published its revised International Standards on Combating Money Laundering and the Financing of Terrorism on February 16, 2012. The FATF will begin its fourth round of evaluations of member countries in 2013, and will focus much more intensively on assessing how effectively countries have implemented the set standards.
26Renminbi (RMB) as a Settlement Currency
Under the new regulations released by the People’s Bank of China (PBC), trading entities all over the world can now settle trade in RMB subject to local restrictions. This is expected to boost internationalization of the renminbi. Total trade settled in RMB at the end of 2011 was four times that of a year earlier at RMB2.1 trillion, accounting for 9% of China’s total imports and exports in 2011.
27 EU UCITS IV Directive
The Undertakings for Collective Investments in Transferable Securities (UCITS) IV Directive took effect on 1 July 2011 as planned, but only a handful of EU member states transposed the Directive into local legislation by the stated timeline. The European Securities and Markets Authority (ESMA) has clarified that a host member state authority cannot refuse a valid notification under UCITS IV even if that member state has not transposed the Directive.

27World Payments rePort 2012
SECTION 2WAvES OF INITIATIvES CONTINUE TO dRIvE CHANGE IN PAyMENTS
end-dates for migration now clearly mark SEPA as a regulatory initiative, despite its beginnings as an industry initiative.
At the same time, however, other initiatives such as Basel III have become inextricably intertwined with SEPA as, by definition, systemic regulation contains unique requirements —and potentially creates different consequences for banks in terms of investment, liquidity, and other key elements of financial services business models. This illustrates how important it is for regulators and market players to look at all current regulations holistically, carefully gauging the impact of each regulation on the others, and the net effects.
In plotting the multiple impacts of kRIIs, it is possible to see how they drive industry trends such as standardization. But it is also very clear that regulatory and industry initiatives have increasingly coalesced in their impact—directly or indirectly— to drive innovation (see Figure 2.3).
INNOVATION EMERGES AS A CENTRAl ThEME WhEN KRIIS CONVERGE
In reality, while each kRII is developed largely in isolation, its effects typically compound in practice once implemented in the interconnected world of payments. For this reason, neither regulators nor the payments industry can afford to view any kRII in a vacuum. Rather, kRIIs must be viewed in totality, taking account of the potential knock-on effects for other instruments or regions, and the evolution of the payments space itself.
SEPA is a prime example of an initiative that has spawned other initiatives with concomitant objectives, but also strains against the objectives of other kRIIs, such as Basel III (#1). SEPA was an industry response to a political vision of harmonized payment services, but it required a legal foundation. That emerged in the form of the Payment Services directive (PSd), which had to be transposed into the national law of each member state. The binding
figure 2.3 Overlapping Impact of Key Regulatory and Industry Initiatives (KRIIs) on Industry Transformation Trends (ITTs)
Note: ACH – Automated Clearing House; AML/ATF – Anti-Money Laundering /Anti-Terrorism Financing; CPSS-IOSCO – Committee on Payment and Settlement Systems (CPSS) and the Technical Committee of the International Organization of Securities Commissions (IOSCO); FSA – Financial Services Authority (U.K.); NFC – Near-field Communications; PSD – Payment Services Directive; SEPA – Single Euro Payments Area; UCITS - Undertakings Collective Investment in Transferable SecuritiesSource: Capgemini Analysis, 2012; World Payments Report, 2011
KRII 1. Basel III 2. FSA Liquidity Regime3. Dodd-Frank Act4. Fed Intraday Liquidity5. PSD 6. SEPA / eSEPA7. e-Money Directive 8. Pressure on Card Interchange Fees9. Durbin Amendment10. Evolution of TARGET211. UK Real Time Retail Payments
12. Checks Transformation13. Mobile Payments14. Contactless Cards / NFC15. e-Invoicing 16. e-Government 17. Digital Agenda in Europe 18. ACH Frequent Settlement19. Hong Kong Multi-Currency Clearing20. Alternative Card Schemes21. Canada Code of Conduct for Cards 22. Japanese Payment Services Act23. National Payments Corporation of India
24. International Payments Framework Association
25. AML / ATF 26. Renminbi as a Settlement Currency27. UCITS IV Directive28. Canada Task Force29. Foreign Account Tax Compliance Act
(FATCA)30. Common Payments Network in Australia31. 100% FDI in Mobile Wallets in India32. CPSS - IOSCO
Systemic Risk Reduction & Control
1 32 4
25
Transparency of Services
8
21
9
Innovation
12 28
13
29
15
14
16 17
Convergence
11
Standardization
5
20
27
7
23
6
22 26
19
24
32
30
3110 18
HIGH
LOW
IMPACT ON PAYMENTS
■ KRIIs cited in WPR 2011■ KRIIs introduced in WPR 2012
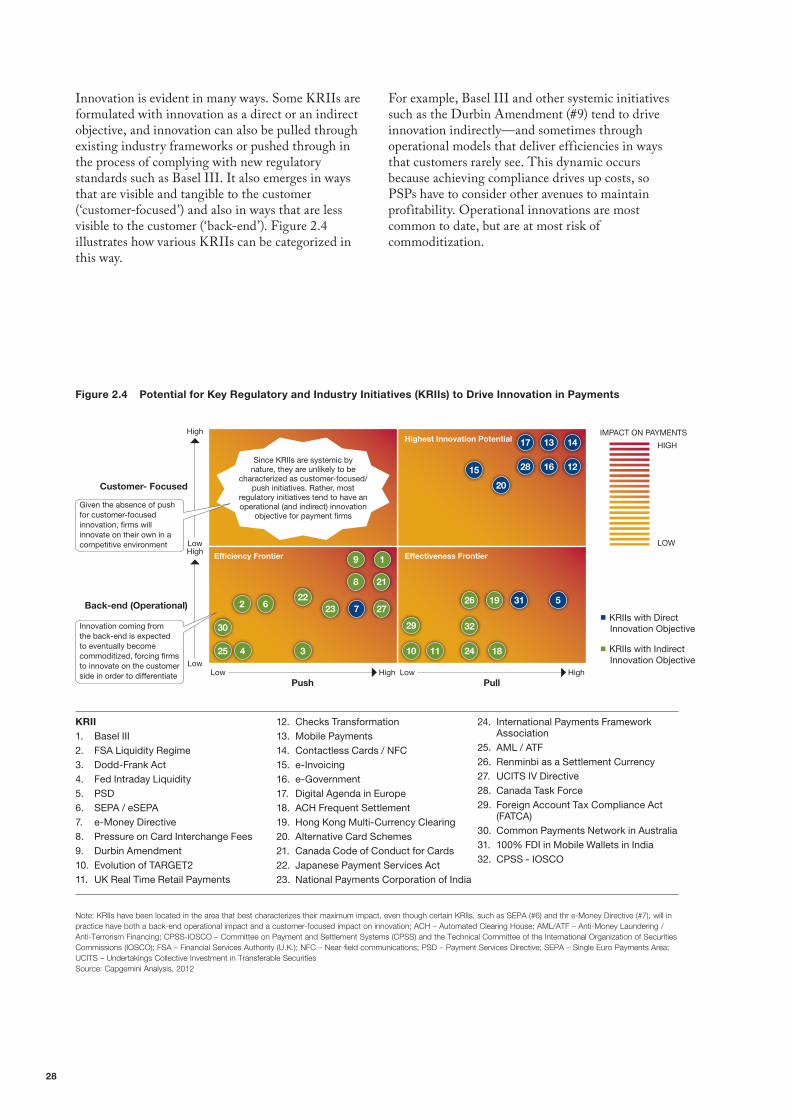
28
figure 2.4 Potential for Key Regulatory and Industry Initiatives (KRIIs) to Drive Innovation in Payments
Note: KRIIs have been located in the area that best characterizes their maximum impact, even though certain KRIIs, such as SEPA (#6) and thr e-Money Directive (#7), will in practice have both a back-end operational impact and a customer-focused impact on innovation; ACH – Automated Clearing House; AML/ATF – Anti-Money Laundering /Anti-Terrorism Financing; CPSS-IOSCO – Committee on Payment and Settlement Systems (CPSS) and the Technical Committee of the International Organization of Securities Commissions (IOSCO); FSA – Financial Services Authority (U.K.); NFC – Near-field communications; PSD – Payment Services Directive; SEPA – Single Euro Payments Area; UCITS – Undertakings Collective Investment in Transferable SecuritiesSource: Capgemini Analysis, 2012
For example, Basel III and other systemic initiatives such as the durbin Amendment (#9) tend to drive innovation indirectly—and sometimes through operational models that deliver efficiencies in ways that customers rarely see. This dynamic occurs because achieving compliance drives up costs, so PSPs have to consider other avenues to maintain profitability. Operational innovations are most common to date, but are at most risk of commoditization.
Innovation is evident in many ways. Some kRIIs are formulated with innovation as a direct or an indirect objective, and innovation can also be pulled through existing industry frameworks or pushed through in the process of complying with new regulatory standards such as Basel III. It also emerges in ways that are visible and tangible to the customer (‘customer-focused’) and also in ways that are less visible to the customer (‘back-end’). Figure 2.4 illustrates how various kRIIs can be categorized in this way.
KRII 1. Basel III 2. FSA Liquidity Regime3. Dodd-Frank Act4. Fed Intraday Liquidity5. PSD 6. SEPA / eSEPA7. e-Money Directive 8. Pressure on Card Interchange Fees9. Durbin Amendment10. Evolution of TARGET211. UK Real Time Retail Payments
12. Checks Transformation13. Mobile Payments14. Contactless Cards / NFC15. e-Invoicing 16. e-Government 17. Digital Agenda in Europe 18. ACH Frequent Settlement19. Hong Kong Multi-Currency Clearing20. Alternative Card Schemes21. Canada Code of Conduct for Cards 22. Japanese Payment Services Act23. National Payments Corporation of India
24. International Payments Framework Association
25. AML / ATF 26. Renminbi as a Settlement Currency27. UCITS IV Directive28. Canada Task Force29. Foreign Account Tax Compliance Act
(FATCA)30. Common Payments Network in Australia31. 100% FDI in Mobile Wallets in India32. CPSS - IOSCO
30
25 4 3 10
29
11 24
32
26 19
18
2 622
23 27
218
9 1
731 5
20
15 28
17
16
13
12
14
Since KRIIs are systemic by nature, they are unlikely to be
characterized as customer-focused/push initiatives. Rather, most
regulatory initiatives tend to have an operational (and indirect) innovation
objective for payment firms
High
Customer- focused
Push Pull
Back-end (Operational)
highest Innovation Potential
Effectiveness frontierEfficiency frontierHighLow
LowLow LowHigh High
Given the absence of push for customer-focused innovation, firms will innovate on their own in a competitive environment
Innovation coming from the back-end is expected to eventually become commoditized, forcing firms to innovate on the customer side in order to differentiate
HIGH
LOW
IMPACT ON PAYMENTS
■ KRIIs with Direct Innovation Objective
■ KRIIs with Indirect Innovation Objective

29World Payments rePort 2012
SECTION 2WAvES OF INITIATIvES CONTINUE TO dRIvE CHANGE IN PAyMENTS
CERTAIN KRIIS CREATE MORE DIRECT VAluE ThAN OThERS fOR CuSTOMERS
While different kRIIs have varying degrees of innovation potential, they also affect providers and users to differing degrees. PSPs can leverage those kRIIs that most affect users to enhance customer satisfaction. Consider m-payments, for example.
M-payments are significantly altering the overall payments landscape by enabling users to execute payments anywhere, anytime. While many current initiatives are focused on developing smart phone platforms, the next stage will center on enabling other mobile devices with payment capabilities, helping to increase adoption while boosting the ability of emerging-economy populations to access the financial services system. However, m-payments also have a substantial impact on payments processing by PSPs (see Figure 2.5), so innovation cannot be achieved without significant commitment and evolution.
E-government (#16) and the EU’s digital Agenda (#17) are other good examples of kRIIs that enhance customer satisfaction. The principle behind e-government is to maximize the social and economic potential of Information and Communication Technology (ICT) to both inform and provide services to citizens and businesses. E-government extends to e-procurement, e-invoicing and e-payments so has a considerable potential impact on both payment services users (PSUs) and processors of payments. It will be driven by increased access to broadband and mobile technology, and fueled by the enhanced capabilities of telecom firms. The net effect will be to drive online and m-payments, increase social and economic inclusion, and improve the reliability and security of transactions.
kRIIs that have specific objectives aimed directly at driving innovation are often pulled through existing frameworks in ways that are visible to the customer. In many cases, non-bank players have been key to innovation on these fronts to date as they have been able to leverage the existing banking infrastructure, and the long-standing trust that clients have in banking services, to provide customer-driven innovation in very specific areas of the payments value chain (also see Section 3 on innovation).
Contactless cards/NFC (#14) offer a prime example. An increasing number of smart phones are being equipped with NFC technology, suggesting the market is ready to drive usage of NFC technology in the payments industry. The bank and non-bank players piloting NFC innovations include major names like Google, PayPal, MasterCard, visa, and Apple.
In general, though, kRIIs designed to overhaul industry practices, such as e-Government (#16), the digital Agenda in Europe (#17), Mobile Payments (#13), Contactless Cards/NFC (#14) and Checks Transformation (#12), are relatively likely to have the highest innovation potential—more so than initiatives related to oversight.

30
used heavily by both consumer and B2B payments, so innovation has centered on optimizing processing with digitization and electronic clearing. In France, checks could soon be phased out as they cost too much to process. According to Comité Consultatif du Secteur Financier (part of the Bank of France), one in two checks could vanish as soon as 2017. The Italian Banking Association (ABI) has also started an initiative aimed at digitizing the use of checks by 2013. Additional customer-focused innovations around checks include remote deposits, which allow customers to use mobile devices to upload check images and make the corresponding deposits. � The Uk Real Time Retail Payments (#11) initiative speeds up certain payments. The service allows participating banks to provide near real-time processing of smaller-value electronic payments such as funds transfers, bill payments and standing orders.
Ultimately, though, payments industry transformation is likely to be driven fastest and farthest by those kRIIs that have direct innovation objectives and provide mutual benefits to both PSPs and PSUs. There is considerable opportunity for PSPs to capture quick wins by innovating around those kRIIs that have a tangible impact on users and a beneficial (or at least manageable) impact on processors. As illustrated on Figure 2.5, checks transformation and the Uk Real Time Retail Payments have proven to be two good examples of such quick wins.
� As a kRII, efforts to replace checks (#12) are designed to drive innovation—i.e., by encouraging the use of alternative, more efficient instruments. These innovations have been pulled through existing frameworks in a way that is visible and tangible to the customer. In some countries, the innovation has focused less on replacement, and more on facilitating the use of checks when usage is entrenched. In the U.S., for example, checks are
figure 2.5 Impact of Key Regulatory and Industry Initiatives (KRIIs) on Payment Service Providers (PSPs) and Payment Service users (PSus)
Note: ACH – Automated Clearing House; AML/ATF – Anti-Money Laundering /Anti-Terrorism Financing; CPSS-IOSCO – Committee on Payment and Settlement Systems (CPSS) and the Technical Committee of the International Organization of Securities Commissions (IOSCO); FSA – Financial Services Authority (U.K.); NFC – Near-field communications; PSD – Payment Services Directive; SEPA – Single Euro Payments Area; UCITS - Undertakings Collective Investment in Transferable SecuritiesSource: Capgemini Analysis, 2012
Low
Low
Med
ium
Medium
Hig
h
High
KRII 1. Basel III 2. FSA Liquidity Regime3. Dodd-Frank Act4. Fed Intraday Liquidity5. PSD 6. SEPA / eSEPA7. e-Money Directive 8. Pressure on Card Interchange Fees9. Durbin Amendment10. Evolution of TARGET211. UK Real Time Retail Payments
12. Checks Transformation13. Mobile Payments14. Contactless Cards / NFC15. e-Invoicing 16. e-Government 17. Digital Agenda in Europe 18. ACH Frequent Settlement19. Hong Kong Multi-Currency Clearing20. Alternative Card Schemes21. Canada Code of Conduct for Cards 22. Japanese Payment Services Act23. National Payments Corporation of India
24. International Payments Framework Association
25. AML / ATF 26. Renminbi as a Settlement Currency27. UCITS IV Directive28. Canada Task Force29. Foreign Account Tax Compliance Act
(FATCA)30. Common Payments Network in Australia31. 100% FDI in Mobile Wallets in India32. CPSS - IOSCO
Dire
ct P
erce
ived
Pay
men
t Va
lue
for
Pay
men
t S
ervi
ce U
sers
(PS
Us)
Impact on Payment Processing by Payment Service Providers (PSPs)
22
5
8
11
6
7
325
20
9
229
17
19
10
30
23
27
15
1211
31
16
24
21
26
32
18
13
28
14
Focus KRIIs that can be leveraged to gain customer satisfaction
Strong potential for ‘quick win’ for PSPs
■ KRIIs cited in WPR 2011 ■ KRIIs introduced in WPR 2012

31World Payments rePort 2012
SECTION 2WAvES OF INITIATIvES CONTINUE TO dRIvE CHANGE IN PAyMENTS
Given these realities, SEPA innovations to date have therefore been largely on the ‘Efficiency Frontier’ (Figure 2.4). But that is mostly because SEPA’s progress has been on establishing and implementing the rules, procedures, and technical requirements needed to facilitate migration to SEPA products. In short, the focus has been a drive to ensure all participants have a common understanding of the immediate SEPA priorities (including waves of milestones set even before implementation). Going forward, now that SEPA migration has been mandated for credit transfers and direct debits (see SEPA Update, p33), the SEPA Council will be able to shift its focus to leveraging standardization, and—along with the European Payments Council (EPC)— promoting competition and innovation.
SEPA is designed to create more choice, transparency, and efficiency for PSUs, prompting PSPs to invest in technological innovations such as m-payments and e-payments and move toward eSEPA. In the process, the cost savings on cross-border transactions, coupled with the benefits of other SEPA innovations, could help stimulate economic growth in coming years.
Among the most recent developments on the path to eSEPA are the following:
� EPC Mobile. The EPC is working with all the stakeholders in the mobile payments ecosystem to help develop the necessary standards for mobile-based SEPA payments. The EPC has released a number of White Papers related to m-payments (most recently in February 2012), with the aim of advancing m-payments, and ensuring the development of a sustainable m-payments infrastructure. � E-invoicing. Electronic invoicing offers substantial benefits over paper invoicing, including faster payment processing, printing cost savings, and a fully automated payments process. SEPA offers an ideal platform to launch interoperable e-invoicing schemes in Europe, which could result in estimated savings of up to €65 billion per year for businesses.14 In 2011, the EC constituted a European Multi-Stakeholder Forum on Electronic Invoicing, consisting of members from the private and public sectors of all member states, and key stakeholders from the user side of the market. The Forum aims to facilitate broad-scale adoption of e-invoicing at both the national and EU level.
Other kRIIs have significant potential to drive innovation and build customer satisfaction, but are more challenging for PSPs, so innovation in these areas is likely to be slower to materialize. The durbin Amendment (#9), for example, capped debit-card interchange fees in order to benefit customers. However, some PSPs raised monthly service fees to compensate for the loss of merchant fees. The Amendment requires that merchants have a choice of processing via at least two independent networks, so between the loss of fees and the network competition, PSPs arguably have less incentive to innovate around processing debit transactions—especially as volumes could decrease if consumers feel the transactions are costing extra.
The ability of kRIIs to drive or constrain innovation can also change over time. As market conditions and user behavior change, there is strong potential for the innovation focus of kRIIs to switch from operational to a customer-centric basis, especially as the operational improvements become commoditized, and PSPs need to differentiate through customer innovation. This could soon be the case with SEPA.
fOCuS Of SEPA, lONG ON COMPlIANCE, NOW NEEDS TO ShIfT TOWARD CuSTOMER INNOVATION
SEPA as a kRII has to date had a significant impact on PSPs and a middling impact on PSUs (#6 on Figure 2.5). The objectives of SEPA have been competition, innovation, and efficiency. Standardization has been a common underlying theme too, but has also been a cause of strain.
For example, an initial focus centered on standardization as a launching pad for innovation, which would be a competitive differentiator. In practice, however, national authorities and market players embraced standardization with varying appetites—even as they pursued the principles of harmonization—so adoption and competition have not yet developed as they might have.
There can be a fine balance between under-regulation and over-regulation. Emerging payment means such as e- and m-payments are too immature to be standardized, for instance, so market forces tend to develop these payments spheres before associated regulation develops. At the same time, without standardization and appropriate, consistent frameworks, such markets could fragment into multiple incompatible proprietary solutions, which are sub-optimal and lack interoperability.
14 http://ec.europa.eu/internal_market/payments/einvoicing/index_en.htm
32
Beyond the 2014 migration deadline, the focus of the SEPA Council is likely to shift again, though it is not yet clear what form or representation it will assume. A lot will depend, however, on what roles, powers, and representation the Council ultimately has, and what characterizes its interactions with other industry bodies and players, so issues of governance are likely to become important going forward (also see SEPA Update, p33).
For now, though, the EC, ECB, EPC and SEPA Council will need to spur migration in such a way as to accommodate the ultimate objectives of SEPA, which are to increase competition, innovation and efficiency. Standardization should provide a common platform from which competitors can drive innovation, and digitization should increase efficiency.
To be most relevant, the primary focus of standardization should be core payments, rather than targeting e- and m-payments prematurely. But when the focus does turn to standardization of e- and m-payments, it will need to be done in such a way that innovation can still thrive.
In this sense, SEPA offers a prime illustration of the ability of kRIIs to drive innovation—or constrain it—depending on operating conditions, and the position of the players in the payments ecosystem (see Section 3 for a wider discussion of these issues).
� Electronic Money Directive (EMD). Twenty EU Member States have already transposed the EMd into law, and the EMd has been incorporated into the Agreement on the European Economic Area (which covers the 27 EU Member States plus Iceland, Lichtenstein and Norway). Even though implementation is not quite complete across all Member States, a further review of the directive is due to be undertaken by the EC this year.
Seeking to ensure the development of a strong framework for electronic payments, the EC is seeking input from all stakeholders on the potential barriers for market integration for cards, Internet, and m-payments across Europe—initially via consultation on a Green Paper15 from early in 2012. Ongoing collaboration will be critical as the EPC and SEPA Council focus their future roles on promoting competition, collaboration, and innovation in the payments market, as well as ensuring the mandated migration to SCT and Sdd payment schemes by the February 2014 deadline.
Until now, the SEPA Council’s role has been to monitor and support the SEPA migration process to ensure the SEPA vision is realized. It has also sought to ensure accountability and transparency of SEPA processes by involving all concerned parties, while the EPC has been responsible for developing and maintaining SEPA payment schemes as defined in the SCT and Sdd Rulebooks.
15 http://ec.europa.eu/internal_market/payments/cim/index_en.htm

33WORLd PAyMENTS REPORT 2012
Mandated Deadline of february 2014 Is Set for SEPA Credit Transfers and Direct DebitsA deadline for migrating to SEPA Credit Transfers (SCT) and SEPA Direct Debits (SDD) has been set at February 1, 2014. The certainty of a firm deadline should trigger a major increase in adoption rates for these instruments, though the potential for inconsistent interpretation of the standards could still be an issue.
As of April 2012, 4,559 banks representing more than 95% of payments volumes in Europe were reachable for SCT transactions, but the SCT indicator (SCT transactions as a percentage of total Eurozone credit transfers) was just 27.2% at the end of March 2012. Still, usage is expected to pick up in the remainder of 2012, ahead of the 2014 deadline.
The SDD adoption rate has been very low (0.4%), but is also likely to increase significantly given the legal certainty brought about by the mandated deadline. As of February 2012, 3,928 PSPs representing more than 80% of SEPA payments volume were reachable for SDD core (for consumers) and 3,447 PSPs for SDD B2B. Corporations have been slow to embrace SDD in the absence of a firm deadline, and because they were unsure whether their own customers would be reachable or whether banks could support them in the migration process. Banks, for their part, have been tentative about committing to SDD capabilities without proof there will be corporate uptake.
The SEPA Cards Framework (SCF) remains in the early implementation phase, with high-level principles developed by the EPC to govern issuers, acquirers, card schemes, and operators. Adoption of the associated EMV standards (chip technology to combat fraud) has risen steadily since they were introduced in 2008, and by December 2011, 79.7% of all transactions at point-of-sale (POS) terminals were EMV-compliant. Of total transactions, compliance was 90.43% for cards, 92.96% for POS terminals, and 96.28% for ATMs (automated teller machines) in the Eurozone.
While the SCT/SDD migration deadline has added some certainty to SEPA, stakeholders are still grappling with various elements of implementation, including the following:
� Disparate interpretations. A common understanding of the detailed requirements of the SEPA regulation is critical, but it is not a given. The work being led by the European Banking Federation to develop guidance on these key points of potential ambiguity has been important, helping to enable a set of common implementation planning assumptions.
� Persistent uncertainty. Members do not have to finalize the exemptions they are requesting under the various Member State transition period options until February 2013, making it problematic for PSPs and corporates to plan with complete certainty until then. Multinationals, for instance, cannot make firm plans for their entire organization until they know exactly what regime will prevail in each country.
� Technical readiness. While there are guiding principles on technical standards, there are currently many variants of the technical messaging, raising the possibility that interoperability may not be assured.
The main focus of SEPA implementation for now will be to raise awareness to help drive migration, and have a detailed plan ready by the end of 2012. Beyond that, the payments industry can start to look toward the Digital Agenda in Europe, and see how SCT and SDD can be leveraged to drive innovation in the financial supply chain.
Onus of SEPA Implementation lies heavily on Banks and Corporates The setting of SEPA end-dates could help to push the demand and supply sides more convincingly toward the SEPA ‘Big Time’ scenario—in which SEPA is implemented to its fullest extent, all the potential benefits can viably be captured, and the basic SEPA instruments are automatically commoditized. This possibility means banks will have to work far more aggressively than in the past to re-position themselves to deliver volumes and/or value. As it stands, in fact, the task of implementing SEPA largely falls to banks and corporate clients.
For retail customers, there is little to do but leverage the benefits. Consumers can access the more tailored payment solutions that are likely to emerge as a result of the increased competition and resultant innovation in the payments market. In the future, greater transparency in payments fees will also enable customers to make intelligent choices that will reduce overall transaction costs. An integrated payments market will increase the security of payment transactions, which will help drive trust in remote payment methods (e- and m-payments).
Non-bank PSPs are also embracing the opportunity to start operating freely across borders in a standardized payments market. The barriers to entry for them are relatively low, because SEPA ‘payment institutions’ (PIs) do not need a banking license to enter the payments business and leverage the existing infrastructure, yet the potential revenues are high. Moreover, non-banks may even be at a competitive advantage since most act as fund-transfer carriers, and do not technically hold deposits, so are not subject to many of the strict regulations, (e.g., regarding capitalization) that apply to banks.
SEPA Update

34
For corporations, however, SEPA is a major undertaking, requiring dedicated planning and the active engagement of stakeholders, especially because the short-term benefits may seem neither clear nor assured at first. Corporations will need to make significant strategic and financial investments for SEPA migration, but implementation can generate benefits through solutions available in the market, and by taking an approach to SEPA that goes beyond ticking the boxes of compliance. Key success factors will include the following:
� A comprehensive IT assessment and roadmap. SEPA migration potentially touches on numerous aspects of IT infrastructure and processes, from the front end to the back, so IT positioning will be critical.
� The scale and scope of the SEPA migration project need to be defined by constructing a profile of accounts receivable (A/R) and accounts payable (A/P) across geographies through rigorous analysis. Then, corporates must plot a smooth transition.
� Payments databases need to be updated to ensure payments will be processed reliably and accurately for various stakeholders. SEPA involves a shift to IBAN, with new message formats based on ISO 20022 XML, so many corporates will need to change the way they collect bank details from their vendors and employees, and bank code information from local issuing authorities—and the way they manage mandates for direct debits.
Despite the challenges, SEPA compliance provides an opportunity for European corporates to improve their bottom line by automating internal systems to make them more efficient. For example, SEPA will allow corporates to consolidate their bank accounts, especially using SDD, thereby improving efficiency in liquidity management and cash-flow visibility. Standardized SEPA formats also enable end-to-end automation and reconciliation, leading to greater straight-through-processing (STP) and lower processing costs. Along with security and cost advantages, SEPA also creates opportunity for small and medium-sized enterprises (SMEs) to expand their cross-border business by using new trade routes powered by SEPA instruments like SDD.
European corporates will need strong bank partnerships to help overcome some of their key implementation issues, but banks face a host of implementation issues of their own. Not only are there significant cost challenges associated with SEPA implementation, there is also the possibility of increased competition from new players. As payments have become commoditized, revenue has come under pressure—pressure that will only increase as cross-border transactions fees are eliminated. Banks will need to mitigate the cost pressure by pursuing cost efficiencies, and innovative solutions.
They will therefore need to step up their SEPA migration programs to develop new SEPA-compliant service offerings for their customers, and come up with a SEPA migration strategy to support customers as they migrate from domestic payment products to SEPA-equivalents.
In fact, most banks will probably need to move toward far more collaborative relationships with customers and competitors as the pressures of SEPA and other regulations change the demands of the payments space. As one leading European bank put it, “Regulatory initiatives such as SEPA are severely challenging our traditional business models and revenue streams.” This pressure is making it necessary for banks to look beyond their conventional, tried and true models.
Banks can help corporate clients, for example, by offering services such as a corporate payment factory that can centralize payment/collections flows. Banks will also be able to offer their services more easily to customers across SEPA, regardless of location; and they should be able to expand their business to serve their customers’ needs in a more cost-effective manner.
All Stakeholders Need to focus Now on Migration SpecificsFor all stakeholders, however, it is time to focus on the specifics of SEPA execution now that SEPA SCT and SDD migration has been mandated for 2014. Banks and corporates, in particular, will need to upgrade payments processing and infrastructure, and improve PSU-PSP relationships. To do so successfully, they will need to address the following:
� flexibility of systems. Banks should develop flexible payment systems to respond to future changes and developments in the evolving SEPA compliance process. Systems should be able to handle multiple future scenarios, including any restructuring of the Eurozone itself, which could conceivably lead to a return to some legacy national currencies.
� Priority of migration steps. Banks and corporates will need to formulate a clear heat map of priorities for each step of SEPA migration. High-level focus areas like IT migration will need to be broken down and prioritized, and cost-effective decisions made about, for example, upgrading existing IT systems vs. installing new systems.
� Outsourcing options. Banks and corporates will need to decide early whether to outsource parts of the payment process. Software-as-a-service (SaaS) and business process outsourcing (BPO) models could be chosen as needed, and package-based products could be deployed. This is also an area where potential partnerships with non-banks could be considered.
� Payments products mix. Corporates will need to analyze whether they want to continue with a mix of payment products that require very specific operational processes. Liquidity and cash management products and products for reconciliation purposes should all be analyzed, and corporates should work with banks and other service providers to explore new options.

35World Payments rePort 2012
figure 2.6 Progress and Projections of SEPA
Source: Capgemini Analysis 2012; Executive interviews, 2012
■ SEPA is successful and provides a platform for new innovations
■ SEPA replaces all other payment schemes
■ SEPA provides a good base for further innovation and efficiency gains
■ SEPA instruments are implemented but do not gain traction and usage as expected by the EC
■ Migration and benefits progress is slow
■ If SEPA does not gain the desired traction, the impact on creating a platform for innovation could be limited
SEPA Scenario A
SEPA Scenario B
HIGH
MED.
PROBABILITY OF OCCURENCELaunch of SCTs
and SDDs
Launch of SEPA Council
Mandated SEPA migration end-dates
are announced
Prohibition of Multilateral Interchange Fees (MIF) for SDD for cross-border DDs
Bank Identifier Codes (BIC) not required to be provided
for national transactions
Member States have to choose State-specific options by early-2013
Migration deadline for SCT and SDD for Euro
Members
Reachability for Eurozone Member States
(SCT and SDD)
Migration deadline for SCT and SDD for non-
Eurozone Members
Migration deadline for niche products
BIC not required for cross-border transactions
Prohibition of MIF for SDD for National DDs
Reachability for non-Euro Member States
(SCT and SDD)
Permission for Member States to waive message
format for PSUs of bundled SCT and SDD
Free conversion of country-specific Basic Bank Account Numbers (BBAN)
to International Bank Account Numbers (IBAN)
Ad
optio
n of
SE
PA In
stru
men
ts
2008–2011 2012–2014 2014 Onward
Economic uncertainty and the sovereign-debt issues
in the Eurozone could divert resources from initiatives to harmonize and implement
payments regulations
Represent milestones needed for successful SEPA implementation during the indicated time line
Still Ahead for SEPABanks and corporates, as well as non-bank PSPs, now have an incentive in the form of the migration deadline to address these and other issues of SEPA compliance, but it is also true that the rapidly changing and volatile macroeconomic environment could still alter the path and pace of SEPA progress in the run-up to the deadline.
At a practical level, there is a risk that the economic uncertainty and persistent debt crisis in the Eurozone could still divert attention and resource from the harmonization process. All stakeholders will need to pursue and maintain an effective dialogue and a coordinated path to capture the originally envisioned benefits of SEPA. (Figure 2.6 illustrates the potential paths for SEPA.)
New regulatory initiatives, such as the next steps following the Green Paper consultation, should be coordinated with other regulations to ensure consistency in regulation, and a firm foundation for a stronger Digital Agenda. The Green Paper, while addressing a number of topics, arguably lacked a coherent vision, so there is still an opportunity, and need, for this to be defined.
The governance of the SEPA Council will also need to be considered, with the focus on clarifying its role, and ensuring that the Council, as well as the EC and EPC, are properly representing all stakeholders. Bankers across Europe want more active participation from corporates to help in shaping the future of SEPA, and achieving its main objectives of competition, innovation, and efficiency.
The EC is expected to review the governance structure for SEPA, and propose a new model by the end of 2012 that includes structural changes to ensure input from all stakeholders. The EPC (which is currently governing the SEPA project) has proposed a three layer structure for SEPA governance:
� Political layer: The SEPA Council would form the political layer, acting as the decision-making body, and ‘owning’ the SEPA project. It would include representation from the EC/ECB, as well as the supply (PSPs) and demand (PSUs) sides of the market.
� Multi-Stakeholder Realization layer: A newly formed Cards Stakeholders Group (CSG) would be established and managed by the SEPA Council to co-ordinate inputs on e- and m-payments, cards, cash, SCT and SDD.
� Stakeholder Positioning and Organizing layer: The EPC would provide technical support to the multi-stakeholder structure, if requested, and perform other support duties.
However the specific responsibilities are structured, governance will need to address strong demand from stakeholders across Europe to increase the representation of non-banks, corporates, and users in strategic payments decisions.

36

section title l1section title l2
37World Payments rePort 2012
3 � Many banks are increasingly shifting their innovation focus to customer-centricity, after sustained success in driving internal improvements for better efficiency and cost-effectiveness in existing operations. This shift will bring banks, possibly through partnerships, more squarely into today’s horizon of innovation, where non-bank players like M-Pesa and Octopus have been successful at capturing mindshare. Non-banks, with new platforms and no legacy-system constraints, are leveraging unique business models to drive innovation around specific customer solutions to generate revenue.
� hurdles to innovation remain but customer retention and acquisition are the critical outcomes. Innovation in payments faces ubiquitous barriers related to governance, technology, and regulation, but probably most challenging is the need to build a strong payments-specific business case, even when the return on investment is difficult to measure. Financial returns are not the only objective of payments innovation. For PSPs, the most important dividends in today’s evolving payments space lie in customer retention and acquisition.
� Many banks are targeting innovation in specific areas of the payments value chain. Targeted innovation is likely to be more cost-effective than attempting to innovate across the entire value chain, as, if deployed successfully, it promises customer-focused innovation in areas of core competency and existing demand. Accordingly, our survey confirms, banks are likely to increasingly focus on proposition development, payments instruction, operations processing, and account reporting and invoicing.
� Regulation can also pave the way for innovation. In general, regulations designed to drive payments evolution through systemic changes such as competition, standardization, and social inclusion support innovation, while those that address business models, by targeting market entry or price regulation for example, have potential to slow or deter innovation. But in cases where payments innovation has thrived, the dividends have typically been distributed among many industry participants.
� Successful payments innovators will have a granular understanding of the needs of their target customer segments, and their own innovation capabilities. This type of innovation strategy, which is driven directly by customer needs, and properly leverages innovation capabilities, will have a more compelling business case, and a greater chance of success. More specifically, innovators will need to understand:
– The key success factors (KSFs) for customer-centric innovation by segment. There are common KSFs such as ‘interoperability’ and ‘security,’ as well as client segment-specific KSFs such ‘multi-currency management’ and ‘multiple instrument choice’ among others.
– Their own innovation readiness, measured in terms of their capability on ‘Innovation Bricks.’ To succeed, PSPs will need to identify and fill gaps in their innovation construct in four key areas: financial; stakeholder engagement; culture/governance; and internal process and technology.
To innovate successfully going forward, while still improving the efficiency of processes over time, banks will need a systematic approach: first assessing and strengthening their innovation foundation elements, which includes selecting/creating the most relevant proposition based on various ‘value spaces;’ then improving specifically on the capabilities that are ‘must-haves’ for their innovation strategies; and then pursuing value-added capabilities. Notably, innovation might involve looking outside the banking industry to find partners with which to collaborate on specific, niche, customer-focused propositions.
Banks Need To Seize Opportunity Of Customer-Centric Innovation
Ke
y F
ind
ing
s

38
In the second wave of innovation, non-banks are more prominent in customer-focused innovation. This is because non-bank PSPs are more likely to be leveraging existing banking platforms (infrastructure, account management etc.), and cherry-picking specific areas of the value chain in which to offer innovative customer-focused solutions that offer benefits around speed, convenience, and cost. This approach employs unique business models aimed directly at driving top-line growth, and has been highly successful, not least because non-banks have been able to leverage intrinsic advantages, including new technology, lack of legacy-system constraints, and a relatively small compliance burden.
One such example is the ‘Osaifu-keitai,’ or mobile wallet, a device-based mobile solution launched by NTT dOCOMO in Japan in 2004. The services supported by this innovation go beyond payments to include electronic money and a host of other services. The service grew significantly, creating a critical mass of both users and merchants—approximately 10 million users and 640,000 accepting stores. After NTT dOCOMO, other operators such as kddI and Softbank also followed with similar services.
INNOVATION IN PAyMENTS IS EVOlVING MORE TOWARD CuSTOMER-CENTRICITy
The industry defines innovation in different ways, but we consider innovation to involve the design, development, and implementation of new or altered products, services, processes, organizational structures, and business models to create value for either or both PSPs and PSUs. Importantly, innovation goes beyond simply inventing a product or service; it extends to implementing a product/service/proposition that has a positive business impact, though that impact may not be primarily financial. If successful, innovations differentiate their creators and implementers, and become widely adopted across the industry.
Payments innovation (pre-1990), saw banks pursue numerous innovations—mostly leveraging technology advancements to improve operational efficiency by enhancing existing systems, making them better, faster, and cheaper. Then the Internet was commercialized, and its popularity and usage grew. By the mid-1990s, a second wave of payments innovation had begun to take shape, focused on creating new customer-centric services. This wave was driven largely by non-banks and new entrants (see Figure 3.1).
figure 3.1 Waves of Innovation in Payments
Source: Capgemini Analysis 2012
Payment hubs were adopted by banks to build their own version of
best-in-class payments architecture
Payment hubs act as enabler for innovation as they bring agility required for operating models
Google introduced its Wallet to store all credit, debit, and
loyalty cards in phone Chase Bank introduced
remote deposit capture (RDC) technology for check imaging
NTT Docomo launched their mobile wallet
in 2004
PayPal, which was born in 1999 and had 100,000 users in Jan 2000, grew tenfold over the ensuing two
months to reach 1 million users
Bank of America launched the first modern-day credit card in 1958 to tap into emerging
middle class spending
Barclays Bank introduced first
ATM in 1967
Online banking was offered in 1981 by four major banks (Citibank,
Chase Manhattan, Chemical and Manufacturers Hanover)
Chip and pin cards were first adopted as a standard
in France in 1993, and helped cut domestic fraud
Inno
vatio
n
Timeline
1980 2000 2012Estimated Start of Wave 2
High on Customer
Focus
Innovation Wave 2
Innovation Wave 1
High on Internal
Efficiency
Banks Non-Bank
Banks have been successful in the first wave of innovation, helping them
to improve operational efficiency mainly due to
advancement in technology
The popularity of the Internet saw the start of a second
wave of innovation, focused on creating new customer-centric services, most often
by non-banks

39World Payments rePort 2012
SECTION 3BANkS NEEd TO SEIzE OPPORTUNITy OF CUSTOMER-CENTRIC INNOvATION
clearing systems in countries such as Poland or France are also introducing a new expedited processing and settlement option.
� Ease and predictability. Retail customers want easier payments options, which has led to the emergence of payments through email, mobile, and social media. Corporates want to ensure predictability in the payments process (e.g., error-free, on-time and stable systems), which helps them to improve their accounts receivable (A/R) and accounts payable (A/P) processes to optimize working capital. � Invoicing and open account payments. Corporate payments parties are highly inter-connected, so new products/services need to offer seamless integration with the various processes and systems currently used by corporate clients and their counterparties (vendors, partners, client corporate firms, and merchants.) � E-payments. The Internet is fast becoming the primary channel for many purchases, so payments solutions will need to support these trends. Global e-payments volumes are expected to grow by 20.0% a year through 2013 (see Section 1, p5) as e-commerce revenues surge.
Among emerging customer needs: �More personalized services. PSPs once tended to favor ‘one-size-fits-all’ services, but homogenous offerings cannot cater adequately to the increasingly diverse needs of both corporate and retail customers, which are demanding customized services and products that fit their specific financial needs and schedules. Banks have an opportunity, though, to analyze customer activities and payments patterns to deliver a more personalized customer relationship experience and proposition.
� Corporate support for new payment instruments. Since retail customers are gravitating toward payments via the Internet, smart phones, social media platforms, and virtual currencies, corporates (especially merchants) need to position themselves to accept a wide and diverse range of payment instruments.
Banks, by contrast, must manage their longstanding commitment (by history and/or regulation) to a full suite of services that sometimes includes cross-subsidized businesses. They are also challenged by more expensive legacy systems, and extensive compliance commitments and costs. One of the leading non-bank players told us, “For new players and start-ups, it’s easier to drive innovation because of their agility, and better positioning to understand customers. For banks, it can get hard because of their massive organizational size, and sometimes lack of speed in decision-making and execution.” On the other hand, noted a leading European player, “Banks have the advantage of trust from their clients to manage their data. Non-banks at times are also able to offer faster time-to-market, and diversity of options.”
Over the longer-term, however, banks are expected to focus more on customer-driven innovation, while non-banks may consider incremental innovation as they mature. For banks, the move toward disruptive innovation is necessarily gradual, given the constraints of their traditional businesses, so partnerships with non-banks might feature in their strategies going forward. In fact, banks and non-banks are already forming “co-opetition” payments-innovation relationships—cooperating in some cases and competing in others. The position of non-banks will also change over time. If they gain more market prominence and power, some might for example seek direct access to clearing and settlement, rather than using the existing banking infrastructure, and this could add to their costs, as well as bringing greater regulatory oversight.
BANKS NEED TO INNOVATE EVEN MORE AROuND CuSTOMER NEEDS TO DRIVE lOyAlTy AND RETENTION
Customers will continue to be the catalyst for innovation among both non-banks and banks going forward, especially given the enabling role of technology. The customer imperative will ref lect both increased urgency around existing needs, and new demands. For example, among the existing customer needs that are becoming more pressing:
� Real-time payments. Both corporate and retail customers are increasingly looking for real-time processing of payments. For this reason, Uk Real Time Retail Payments has had significant success in the U.k., and the U.S. National Automated Clearing House Association (NACHA) as well as

40
MANy SURvEyEd PAyMENTS ExECUTIvES RATE BUSINESS CASE HIGHLy AS A POTENTIAL BARRIER TO INNOvATION
Since a robust business case rates so highly as a potential barrier to innovation, it is important to understand exactly what the concerns are, and how they could be addressed. The WPR survey shows the issues relate to investment, revenue, and risk, and while some are specific to payments, many are the same concerns all businesses have about innovation, including those related to upfront costs, and the uncertainty about how to define and compute the return on investment.
The business case in financial terms is even more difficult to establish if the payments business is not perceived by the broader organization to be a core business driving profits, but in any case, banks need to focus on the real barriers to creating new products/services for customers. For instance, to succeed, innovation needs a critical mass of both paying customers and accepting merchants, so banks will need to consider all the scenarios for adoption. For example, gathering payments data from shopping
� Payments on mobile and social platforms. As the number of mobile and smart phone users rises rapidly, customers (mainly in the retail segment) are looking for payment options that use these technologies. younger demographics in particular expect payment options to be integrated into social media to facilitate purchases of digital goods such as online games, applications, music and videos. � Payment options based on location and context. Payment options based on location and customer context, such as the Starbucks POS m-payment option, are gaining traction and appeal. PayPal’s open development platform also allows third parties to develop customer-facing applications based on a customer’s location/context.
Specifics aside, the WPR survey of payments executives shows customer retention is the most often cited driver of innovation, followed closely by customer acquisition. The key barriers to innovation are cultural (inability to change) and building a business case that generates a return on investment (ROI) for customer-centric innovation (see Figure 3.2).
figure 3.2 Key Drivers of and Barriers to Innovation in Payments by Banks (% of Respondents)FIGURE 3.2. Key Drivers of and Barriers to Innovation in Payments by Banks (% of Respondents)
0 20 40 60 80 100
Brand positioning
Meeting challengesfrom competitors
Creating new market(new payment method/
customer segment)
Cost savings
Improving ef�ciency
Customer acquisition
Customer retention
0 20 40 60 80 100
Need for standardization
Less incentive forcollaboration in R&D
Interoperability acrossservice providers
Isolated business silos
Constrained bylegacy systems
Restrictions on marketentry across borders
Constrained by regulation
Restrictions onmarket access
Security concerns fornew technologies
Building business caseNA
Attitude to change (fromtraditional approaches)�
�
�
�
�
�
�
�
�
�
67.5%67.3%
56.5%
55.2%
51.3%
50.1%
49.6%
40.2%
37.4%
31.7%
31.6%
27.4%
60.5%
53.9%
48.6%
42.6%
42.4%
30.2%
% of Respondents
Key Drivers Key Barriers
% of Respondents
■ Technology ■ Governance ■ Regulatory
Note: Charts represent weighted results of respondents indicating the drivers and barriers as ‘Very Important’ or ‘Extremely Important,’ based on total 30 responses (from banks) in WPR 2012 Executive Survey; The percentage for “Building business case” as a barrier is weighted average of several component parameters from the WPR 2012 Executive SurveySource: Capgemini Analysis, 2012; WPR 2012 Executive Survey, 2012

41World Payments rePort 2012
SECTION 3BANkS NEEd TO SEIzE OPPORTUNITy OF CUSTOMER-CENTRIC INNOvATION
TO SET A CUSTOMER-dRIvEN INNOvATION PATH, BANkS NEEd TO dRILL dOWN THE SPECIFIC NEEdS IN THEIR TARGET SEGMENTS
To deliver enhanced customer value, banks’ approach to innovation has to be customer-driven, and be clearly visible to customers through easier, faster, cheaper, or value-added services. There are numerous key success factors (kSFs), however, including:
� Corporate: Alignment with business, compliance to standards, management across multiple currencies and countries, positive business case for investment.
� Retail: Ease of use, ease of sign-up/access, choice of multiple instruments, consistency in experience.
� Common to both corporate and retail: Reduced cost, interoperability, perception value, presence of catalysts, security, critical mass of users/merchants, optimal transaction time.
idEAL, a collaborative initiative among industry players, offers a good example of how a thorough understanding of customer kSFs can mold innovation to deliver success. In 2005, three large banks from the Netherlands jointly built a real-time online payment platform offering benefits to both consumers (easy to use, widely accepted, secure, no sign-up requirements, and free service) and merchants (positive business case due to low upfront investment and operating cost, guaranteed payments, easy integration with existing stores). The number of transactions using idEAL grew from 4 million in 2006 to 94 million in 2011.
Similarly, NCR Corporation was able to offer value to both banks and their clients with its envelope-free ATM deposit service, which is part of its Intelligent deposit services that allows customers to deposit cash and checks at the same time, in a single transaction, through a single slot, making the deposit process faster.
In practice, as one bank executive explains, “Clients act as test sites for new services, but also pay for them. In the corporate domain, innovation comes from discussion with clients. In retail, however, customer behavior is less predictable, so banks need to define concept, test, pilot, develop, roll out, and scale up” their innovations.
histories can help retailers to drive personalized advertising/marketing and special offers. This more targeted advertising, and greater visibility into customer behavior, could help retailers to improve their profitability and supply chain management, as well as providing value to customers. As one leading financial firm said, “The battle in innovation is in understanding customers, and the best place to do that is at the point of transaction—which is also a lead to the huge advertising market.”
Many bank executives also acknowledge that the objective of payment innovation goes beyond direct financial returns. “Banks need to innovate now,” said one executive, “because the cost pressure is on, and a cost game is not an option in a commoditized market.” At the same time, though, “Clients are the main driver to innovate, asking for consistency in offerings, simple, easy, single contracts, and a consistent experience across countries.”Moreover, another executive said innovation is essentially a value proposition with a business case. “It doesn’t need to be a new product; it can be a new combination of products. But as banks compete with similar products, innovation is a key differentiator.”
The business case must be based on innovation objectives—including brand enhancement and/or competitive positioning. In order to meet their financial criteria, banks will need to identify return-on-investment (ROI) metrics (such as new/alternate revenue streams, cross sales, customized-advertising opportunity, or customer loyalty rates), factor in the upfront costs, and devise a pricing strategy for new products/services.
INNOVATION READINESS REflECTS uNDERSTANDING Of CuSTOMER NEEDS, AND PSP INNOVATION CAPABIlITIES
The key for each bank is to assess its own customer key success factors (kSFs) and its own internal capability to innovate. By evaluating their readiness for innovation in this way, banks can take a customer-driven approach to prioritizing their innovation, taking account of their ability to execute successfully. This approach will in itself help to clarify the business case, as customer needs will be driving the innovation strategy.
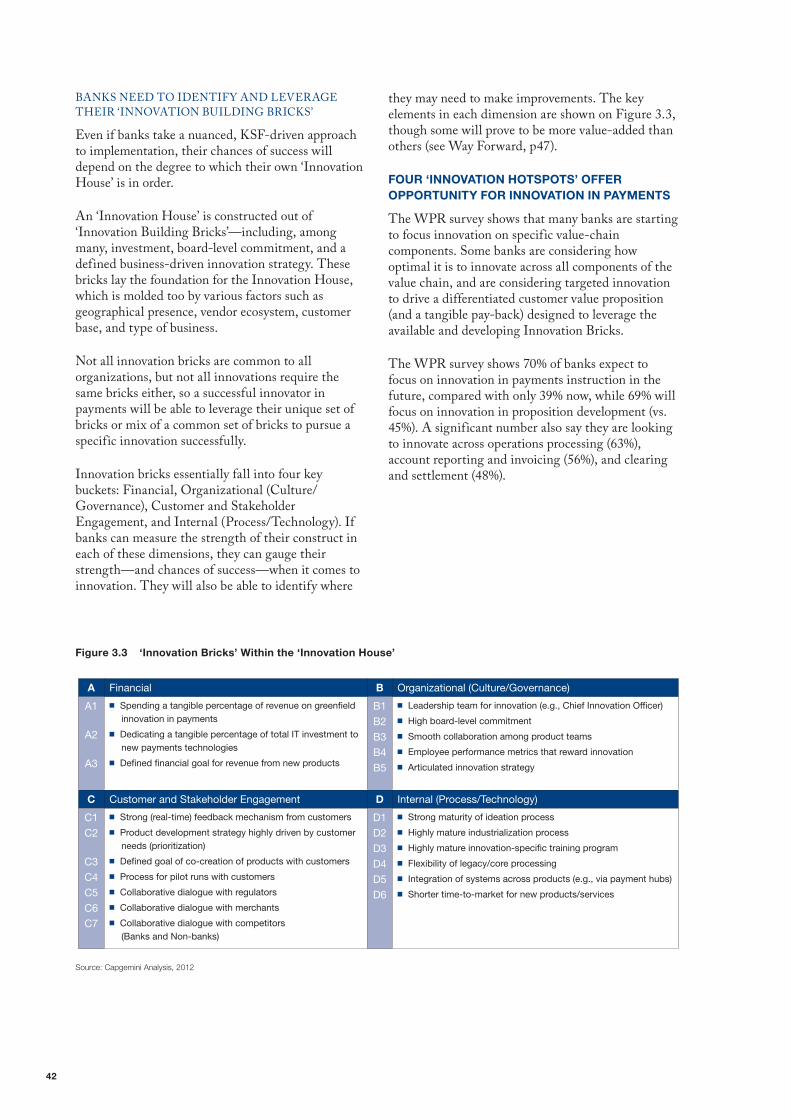
42
they may need to make improvements. The key elements in each dimension are shown on Figure 3.3, though some will prove to be more value-added than others (see Way Forward, p47).
fOuR ‘INNOVATION hOTSPOTS’ OffER OPPORTuNITy fOR INNOVATION IN PAyMENTS
The WPR survey shows that many banks are starting to focus innovation on specific value-chain components. Some banks are considering how optimal it is to innovate across all components of the value chain, and are considering targeted innovation to drive a differentiated customer value proposition (and a tangible pay-back) designed to leverage the available and developing Innovation Bricks.
The WPR survey shows 70% of banks expect to focus on innovation in payments instruction in the future, compared with only 39% now, while 69% will focus on innovation in proposition development (vs. 45%). A significant number also say they are looking to innovate across operations processing (63%), account reporting and invoicing (56%), and clearing and settlement (48%).
BANkS NEEd TO IdENTIFy ANd LEvERAGE THEIR ‘INNOvATION BUILdING BRICkS’
Even if banks take a nuanced, kSF-driven approach to implementation, their chances of success will depend on the degree to which their own ‘Innovation House’ is in order.
An ‘Innovation House’ is constructed out of ‘Innovation Building Bricks’—including, among many, investment, board-level commitment, and a defined business-driven innovation strategy. These bricks lay the foundation for the Innovation House, which is molded too by various factors such as geographical presence, vendor ecosystem, customer base, and type of business.
Not all innovation bricks are common to all organizations, but not all innovations require the same bricks either, so a successful innovator in payments will be able to leverage their unique set of bricks or mix of a common set of bricks to pursue a specific innovation successfully.
Innovation bricks essentially fall into four key buckets: Financial, Organizational (Culture/Governance), Customer and Stakeholder Engagement, and Internal (Process/Technology). If banks can measure the strength of their construct in each of these dimensions, they can gauge their strength—and chances of success—when it comes to innovation. They will also be able to identify where
figure 3.3 ‘Innovation Bricks’ Within the ‘Innovation house’
Source: Capgemini Analysis, 2012
A Financial B Organizational (Culture/Governance)
A1
A2
A3
■ Spending a tangible percentage of revenue on greenfield innovation in payments
■ Dedicating a tangible percentage of total IT investment to new payments technologies
■ Defined financial goal for revenue from new products
B1B2B3B4B5
■ Leadership team for innovation (e.g., Chief Innovation Officer)
■ High board-level commitment
■ Smooth collaboration among product teams
■ Employee performance metrics that reward innovation
■ Articulated innovation strategy
C Customer and Stakeholder Engagement D Internal (Process/Technology)
C1C2
C3C4C5C6C7
■ Strong (real-time) feedback mechanism from customers
■ Product development strategy highly driven by customer needs (prioritization)
■ Defined goal of co-creation of products with customers
■ Process for pilot runs with customers
■ Collaborative dialogue with regulators
■ Collaborative dialogue with merchants
■ Collaborative dialogue with competitors (Banks and Non-banks)
D1D2D3D4D5D6
■ Strong maturity of ideation process
■ Highly mature industrialization process
■ Highly mature innovation-specific training program
■ Flexibility of legacy/core processing
■ Integration of systems across products (e.g., via payment hubs)
■ Shorter time-to-market for new products/services
43World Payments rePort 2012
SECTION 3BANkS NEEd TO SEIzE OPPORTUNITy OF CUSTOMER-CENTRIC INNOvATION
� Operations processing, or the internal processing of both incoming and outgoing payments. Innovations include processing social media payments for retail, cash management solutions for corporates, and online card acceptance platforms for both retail and corporate. Innovators in this area include, Western Union, MasterCard/visa, and Amex Serve, which have been successful in creating value around operations processing driven by customer needs. � Account reporting and invoicing involves support activities such as sending transfer completion reports, updating records, issuing statements, etc., as well as providing the documentation that underlies commercial transactions. Innovations include corporate solutions such as e-invoicing, and a single global payments portal with real-time reporting. Successful solutions in this area have so far been by banks, including RBS (e-invoicing) and Bank of America (BofA) Merrill Lynch (CashPro).
Notably, many of these Innovation Hotspots have emerged as a result of key regulatory or other industry initiatives like those detailed in Section II. As noted, the impact on innovation of regulations and other industry initiatives is not always clearly positive for PSPs, but there are many cases in which regulation has the power to drive innovation, whether that was its primary intention or not.
These high-impact areas, which punctuate the payments value chain, are most likely to involve partnerships aimed at developing a new payments innovation ecosystem. Significant amounts of activity are already evident in each of these areas. For example: � Proposition development. In selecting the value proposition to be delivered, PSPs need to define target customer segments, geography, and high-level decisions on which products/services will be offered. For optimal effect, PSPs should seek to identify ‘value spaces’ that are linked to the value chain but are most relevant given their ‘as-is’ capabilities (‘Innovation Bricks’) (see The Way Forward, p47). Successes in this area to date include a wide variety of firms, including PayPal, M-Pesa, Pulse + OboPay, and Amex Serve. � Payments instruction, i.e., all the possible ways a payment can be instructed to move from any channel, including third parties. Innovations in this area include NFC, person-to-person, and social media transactions for retail customers, e-payments for corporates, and m-payments for both the retail and corporate segments, so have been driven by both financial services firms and non-banks, including Google Wallet, PayPal, M-Pesa, and Pulse + OboPay.

44
Regulation Continues to be Both Beneficial and Challenging for Payments InnovationThe impact of regulations on innovation is not always clear for PSPs, and different types of regulation may have different levels of respective impact. In general, those designed to drive payments evolution through competition, standardization, and social inclusion help innovation, while there may be less incentive to innovate—for incumbents at least—when key elements of the business model are under pressure, as is the case with regulation targeting market entry or price regulation (see Figure 3.4).
The constraints on innovation usually emerge in one of the following ways:
� Cost. Regulations may impact the capital reserves of an organization, reducing margins—and the amount that can be plowed back into the budget for investment in innovation.
� Regulatory differences across markets, especially within the same region, can cause an uneven innovation response in different markets.
� Involvement of multiple stakeholders. In markets with a lot of parties/stakeholders, it is sometimes hard to move quickly to innovate due to the possible need for alignment among all stakeholders.
� Overlapping regulations. There are instances when regulations have diverging objectives, leading to confusion over implementation and making players hesitant to pursue innovation.
� Changing regulatory environment. Regulatory environments are evolving, and dependent on numerous factors. This makes it difficult for firms to plan for the future, and potentially reduces the scope to innovate.
An example of an adverse impact on a major payments program is the Monnet Project, which was designed as a standardized pan-European card scheme, including contactless, e- and m-payments. However, regulators insisted that the business model comply with an agreement already established with Visa and MasterCard. This made the proposed business model unviable, and the Monnet Project was shelved.
Innovation can also be compromised if regulators are not actively monitoring the impact of their initiatives. For example, regulations can have unintended consequences, compromising the ability/desire of participants to dedicate time, money, and mindset to pursuing innovation. By the same token, of course, the unintended consequences can be positive. For example, the U.K.’s FSA intraday liquidity regulation is making payments flows clearer, and adding value for customers in ways that might not have occurred but for regulation. Regulation can also fail to meet its expectation and design as an outright driver of innovation. To date, in fact, there are any number of cases in which regulations have spawned both positive and negative effects for innovation.
Regulation Can Drive Innovation Even When Not Designed Specifically to Do So
figure 3.4 Alignment of the Objectives of Regulation and Innovation
Source: Capgemini Analysis, 2012
Examples 1. M-Pesa Initiative in Kenya 2. Paypal blocked in India
3. Google Bucks Dropped Initiative4. Canadian Task Force introduction
5. Alipay change of ownership in China 6. Interchange fees reduction in Australia
REGULATION OBJECTIVES INNOVATION OBJECTIVES
Help Zone
Hinder Zone
Helps Innovation Hinders Innovation
■ Competition
■ Standardization
■ Social Inclusion
■ Consumer Safety
■ Market Entry
■ Price Regulation
■ Efficiency
■ Operational Reliability
■ Customer Delight
■ Differentiation
4
1
3
2
6
5
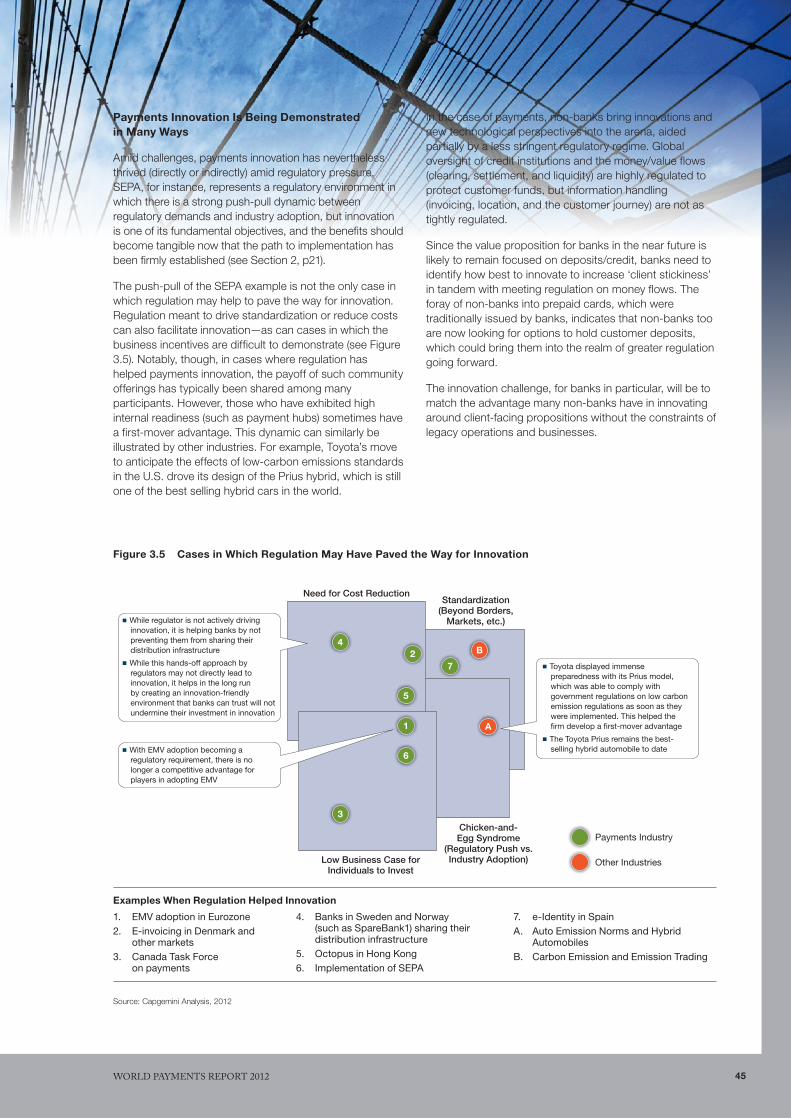
45World Payments rePort 2012
figure 3.5 Cases in Which Regulation May have Paved the Way for Innovation
Source: Capgemini Analysis, 2012
Examples When Regulation helped Innovation
Need for Cost Reduction
Low Business Case for Individuals to Invest
Standardization (Beyond Borders,
Markets, etc.)
Chicken-and-Egg Syndrome
(Regulatory Push vs. Industry Adoption)
B
A1
5
6
24
3
7
Payments Industry
Other Industries
■ While regulator is not actively driving innovation, it is helping banks by not preventing them from sharing their distribution infrastructure
■ While this hands-off approach by regulators may not directly lead to innovation, it helps in the long run by creating an innovation-friendly environment that banks can trust will not undermine their investment in innovation
■ Toyota displayed immense preparedness with its Prius model, which was able to comply with government regulations on low carbon emission regulations as soon as they were implemented. This helped the firm develop a first-mover advantage
■ The Toyota Prius remains the best-selling hybrid automobile to date■ With EMV adoption becoming a
regulatory requirement, there is no longer a competitive advantage for players in adopting EMV
1. EMV adoption in Eurozone 2. E-invoicing in Denmark and
other markets3. Canada Task Force
on payments
4. Banks in Sweden and Norway (such as SpareBank1) sharing their distribution infrastructure
5. Octopus in Hong Kong6. Implementation of SEPA
7. e-Identity in SpainA. Auto Emission Norms and Hybrid
AutomobilesB. Carbon Emission and Emission Trading
Payments Innovation Is Being Demonstrated in Many Ways
Amid challenges, payments innovation has nevertheless thrived (directly or indirectly) amid regulatory pressure. SEPA, for instance, represents a regulatory environment in which there is a strong push-pull dynamic between regulatory demands and industry adoption, but innovation is one of its fundamental objectives, and the benefits should become tangible now that the path to implementation has been firmly established (see Section 2, p21).
The push-pull of the SEPA example is not the only case in which regulation may help to pave the way for innovation. Regulation meant to drive standardization or reduce costs can also facilitate innovation—as can cases in which the business incentives are difficult to demonstrate (see Figure 3.5). Notably, though, in cases where regulation has helped payments innovation, the payoff of such community offerings has typically been shared among many participants. However, those who have exhibited high internal readiness (such as payment hubs) sometimes have a first-mover advantage. This dynamic can similarly be illustrated by other industries. For example, Toyota’s move to anticipate the effects of low-carbon emissions standards in the U.S. drove its design of the Prius hybrid, which is still one of the best selling hybrid cars in the world.
In the case of payments, non-banks bring innovations and new technological perspectives into the arena, aided partially by a less stringent regulatory regime. Global oversight of credit institutions and the money/value flows (clearing, settlement, and liquidity) are highly regulated to protect customer funds, but information handling (invoicing, location, and the customer journey) are not as tightly regulated.
Since the value proposition for banks in the near future is likely to remain focused on deposits/credit, banks need to identify how best to innovate to increase ‘client stickiness’ in tandem with meeting regulation on money flows. The foray of non-banks into prepaid cards, which were traditionally issued by banks, indicates that non-banks too are now looking for options to hold customer deposits, which could bring them into the realm of greater regulation going forward.
The innovation challenge, for banks in particular, will be to match the advantage many non-banks have in innovating around client-facing propositions without the constraints of legacy operations and businesses.

46
Regulation Should Provide flexibility for Innovation to Thrive
Given that regulation can help to drive innovation even when not specifically designed to do so, it may be beneficial for the industry if regulators could find a way to optimize the innovative effects of their initiatives when thinking through the entirety of the potential impact.
Even though regulators try to assess the broad effects of their actions, some examples exist of cases in which the net effect of various regulations with different objectives may not have transpired as anticipated. Figure 3.6 offers some examples, and ways in which regulators could perhaps have allowed more room for innovation.
Regulation Objective
Positive Effect On Innovation
Negative Effect On Innovation
Net Effect On Innovation
Options for Regulators
Reference Cases
Product Security and Transparency
Transparency forces institutions to re-assess their processes and products and ensure products are safe
Can make banks wary of testing new domains and products if regulation seems to be still evolving
Increased regulatory demands for transparency encourage banks to re-assess their products, which necessitates innovation
Clear regulation with early indicators focused on products and instruments can save a lot of R&D expenditure for the institutions and channel resources in the right direction
Google Bucks dropped its initiative as a result of regulators being concerned about consumer financial safety
Standardization Sets clear terms and boundaries
Establishes a common, stable platform to innovate
Increases wait-and-see attitudes (Waiting for others to take the first step, and waiting for final clarity on standards)
Proprietary standards can impede others from using an innovation
A clear common standard creates economies of scale and provides additional incentive to innovate
ISO 20022 messaging standards, and SCT and SDD standard products can provide uniformity for all, but regulators should refrain from putting all scope for innovation in the collaborative space which can lead to certain impediments as well
The Canadian Task Force on payments is a consultative process that is looking to define the roles of each of the players, thereby creating the pathway to ensure a level playing field
Market Entry Regulation
Reduces competition for incumbents
Prohibits market entry including new players with new ideas
Reduced competition can bring complacency
Market entry regulations should be used sparingly where there could be a potential threat of too many unknowns and hence to consumer safety
PayPal’s push into India stalled after the central bank regulated several specifics of merchant transactions, making PayPal unattractive as a payment option. Such cases could bring about complacency among local players
Competition/ Choice
Additional focus on institutions to improve services
Provides a level playing field to all players
Reduced R&D co-operation across PSPs
Increased incentive for competition to innovate
While creating regulations, the regulators should ensure that there is a level playing field for all PSPs
Alipay’s change of ownership in China, (caused by a Chinese mandate which regulated that only local players could be eligible for a government license necessary to engage in third party payments) is an example of the negative impact that a lack of competition can have on innovation
Price Regulation Gives incentive to innovate in other efficiency- producing areas such as delivery model or supporting systems to reduce costs. Also forces PSPs to think of alternate means to make profits
Limits funds for innovation
While price regulation can force firms to look for other areas in which to innovate to make up for lost profit elsewhere, it may have the potential to lead to firms not having the required funds to be able to invest in innovation to the degree they would like
Regulators should try to ensure a level playing field through competitive regulation, and other initiatives ensuring transparency and security for customers, and market forces should ensure the desired price environment is achieved, leaving more scope for banks to innovate
The interchange fee reduction in Australia is an example of how a regulatory effort to influence market prices had an adverse effect
In the EU, fees for the same products differ by country.
figure 3.6 Positive and Negative Effects of Payments Regulations, Select Examples
Impact on Innovation Low Medium High
Helps Innovation Hinders Innovation Neither Helps Nor Hinders Innovation

section title l1section title l2
47World Payments rePort 2012
Banks Must Continue to Focus on Innovating to Meet Customer Needs and Collaborate on a Value-Creating Payments Ecosystem As banks seek to shift their focus toward more customer-centric innovation, they will need to move beyond standard payment instruments, and look to address customer needs that are not fulfilled by traditional products/services—all while continuing to improve the efficiency of processes over time. In the process, they need to work collaboratively within the industry to construct a payments ecosystem in which dialogue and regulation support each other in order to level the playing field, so all stakeholders can innovate for the benefit of themselves and their customers.
‘Innovation Value Spaces’ Enable PSPs to Choose the Most Relevant Proposition(s)
As noted, developing a value proposition is critical to customer-focused innovation, but banks may need to reorient their thinking away from the traditional financial business case and efficiency frontier to thrive. By leveraging their innovation building bricks, and partnering—most likely with technology or non-bank service providers—PSPs will increase their chances of innovation success.
The
Way
Fo
rW
ar
dThe Way Forward

48
financial management, this could involve cultural shifts such as embedding a tolerance for failure during the innovation process, and a willingness to accept cannibalization of existing products/services. All dimensions will need to be assessed across the entire ‘Innovation House,’ and across the payments value chain, and solidified in the process of driving the selection/creation of a value proposition for customers that delivers a consistent experience across offerings and execution.
� Building capability on the ‘must haves’ for the chosen value proposition—across the four dimensions—financial (e.g., spending on new technology, defining goals for new products); internal process/ technology (time-to-market, integration, ideation process); organizational (leadership team, board commitment, cross-product collaboration); and customer and stakeholder engagement (customer feedback, customer needs-based development, piloting process, collaboration with merchants).
Figure 3.7 illustrates the range of value propositions that could result, and notes some of the innovations in products/services in these value Spaces.
EvOLvING INNOvATION CAPABILITIES ARE CRITICAL TO SUCCESS
To capture these kinds of opportunities, banks will need to continue to solidify and build their innovation capabilities. To date, our research shows, banks are not as strongly positioned to be successful innovators as they would be if their innovation building bricks were best in-class (see Figure 3.8).
To successfully navigate the path to innovation, banks should consider the following:
� Assessing and solidifying their innovation ‘foundation’ across four dimensions—financial, internal, organizational, and customer and stakeholder engagement. As well as evaluating and pursuing fundamental requirements such as allocating budget and implementing robust
figure 3.7 Innovation Value Spaces, with Select Examples
Value Propositions Description
RE
TAIl
1 ‘Be’ the Money Virtual Currency
■ Create your own currency in a virtual world (e.g., gaming) for closed-loop payments and align to real world currency■ Example: MintChip by the Royal Canadian Mint, Other emerging digital currency / Social currency, Bitcoin
2 ‘lend’ the Money Money Lending
■ Bundle payments with lending and account services such as Escrow (wholesale), P2P, Micro-finance ■ Examples: M-Pesa, Grameen Bank, Kiva
3 ‘Change’ the Money Currency Conversion
■ Focus on currency conversion, such as money changing, remittances, and changing to virtual currency■ Examples: Western Union, MoneyGram
4 ‘Store’ the Money Prepaid Cards
■ Create prepaid products and leverage of ‘liability base’ brought in through quality payment services■ Examples: Starbucks Mobile Application, Google Wallet, Boku+MasterCard, Greendot – Prepaid Cards
5 ‘Move’ the Money Money Transfer
■ Make online / off-line payment easy through any payment instruction mode such as plastic, mobile, or NFC■ Examples: M-Pesa, iDEAL, Citibank Digital Wallet, Starbucks, Pulse+OboPay, Boku+MasterCard
CO
MM
ON 6 ‘Analyze’ the Money
Payment Analytics
■ Focus on information presentation, e.g., cash forecasting for corporates, and personal finance management for retail with insights drawn from use of analytics. Examples: Bank of America Merrill Lynch CashPro, Intuit, Amex PAYVE-Spend IQ
7 ‘Secure’ the Money Security Services
■ Focus on security of payment processing such as AML checks, PCI-DSS compliance, fraud management, e-locker for digital storage, and provide ‘Trust services’; Example: SWIFT
8 ‘Process’ the Money Payment Processing
■ Processing payments including origination, settlement and reporting (most commoditized value space )■ Examples: Banks, iDEAL, SWIFT, Pulse+OboPay
CO
RP
OR
AT
E
9 ‘Risk’ of Money Risk Management
■ Manage the different types of payment risks such as counterparty, liquidity (including intra-day), foreign exchange, and settlement
■ Examples: Deutsche Bank – FX4Cash
10 ‘Time’ the Money Information VAS
■ Real-time visibility into payments (balance and transaction) across treasuries and client organization components■ Examples: Bank of America Merrill Lynch CashPro
11‘Match’ the Money Trade/Supply Chain
Management
■ Matching invoices and supply chain information with money flow to provide value-added services■ Examples: E-Invoicing (Tieto, Nordea, Bottomline Technologies), American Express OPEN AcceptPay
12 ‘Manage’ the Money Treasury Management
■ Drive more value out of money through visibility, investment propositions, and liquidity solutions (pooling, balancing)■ Examples: Travelex Global Business Payments, Bank of America Merrill Lynch – Electronic Bank Account Management
(eBAM)
Source: Capgemini Analysis, 2012

49World Payments rePort 2012
� Only then, in the ‘value-added’ stage, can the focus turn to other important ‘Innovation Bricks’ that really ref lect a build-up in innovation capabilities. Examples are spending on greenfield projects (financial), a mature process for developing ideas (internal), an articulated innovation strategy (organizational), and a collaboration with a competitor (stakeholder engagement).
To innovate going forward, banks could also consider creating a ‘Payments Innovation Ecosystem’ looking outside the banking industry to find small or medium-sized partners with whom to collaborate on more niche and customer-focused innovations.
CashPro Online is one example of such a partnership that innovates around corporate bank account reporting and invoicing. Another example of collaborative innovation is the joint venture between Nordea and its partners, which produced an e-invoicing concept over the SWIFT network allowing interoperability across their systems for corporates to save time and money by e-invoicing.
Equens, in the Netherlands, employs an ‘Innovation Sounding Board’ to receive input from its IT partners and solution providers, universities, banks, and other bodies. This group helps Equens formulate its innovation priorities, and also obtains support for new ideas.
These and other types of customer-driven value propositions are examples of the kind of solutions that banks could pursue as they seek to solidify and augment their longstanding customer relationships with new and exciting solutions designed to deliver tangible value. These types of opportunities, some developed in partnership with non-banks, will enable banks to better leverage the opportunity of the evolving payments space to the benefit of their customers. “Innovation needs to be managed as in biotechnology firms,” said one of the leading ACH players. “you should try multiple innovations; even one success will pay for investments in all.”
SECTION 3THE WAy FORWARd
figure 3.8 Relative Positioning of Banks’ Innovation Building Blocks
1 4 5 6 7
1
4
5
6
7F
irm
s’ F
utur
e F
ocu
s
Firms’ Current Ability
Worst-in-Class
Worst-in-Class Best-in-Class
Best-in-Class
Internal Customer and Stakeholder Engagement Financial Organizational
Spending on new technology
Spending on Green�eld innovation
De�ned goal for co-creation with customersDe�ned �nancial goal for new products
Collaborative dialogue with competitors
Feedback mechanism from customers
Pilot process with customers Collaborative dialogue with regulators
Customer needs-based product development
Collaborative dialogue with merchants Board-level commitment
Cross-product collaboration Leadership team
Innovation as KPI
Articulated innovation strategy
Innovation training for employees
Flexibility of legacy systems
Maturity of industrialization process
Maturity of ideation process
Integration of systems Time to market
Note: The chart represents the responses from the banking industry for each ‘Innovation building block;’ based on 30 responses (only banks) from Online WPR 2012 Executive Survey; 7 represents the ‘Best-in-class’ ability and 1 represents ‘Worst-in-class’Source: Capgemini Analysis, 2012
SECTION TITLE L1SECTION TITLE L2
Our parting words in the World Payments Report 2011 noted that regulatory pressure, and the drive toward standardization and commoditization, were converging to propel a fundamental transformation in the payments landscape in the mid-to-longer term. This year’s report not only reaffirms that assertion, it offers insight into ways innovation can and will spring from the regulatory and market pressure to transform.
Indeed, while non-cash transactions volumes continue to show healthy growth on a global basis, the growth is increasingly likely to be fueled by electronic and mobile payments—areas in which innovation is specifically designed to meet the evolving demands of customers. For example, hybrid forms of e-payments now combine various payment channels to give consumers more options for settle e-commerce transactions as card, credit transfer or direct debit transactions. M-payments usage is similarly surging at a breakneck pace because of the proliferation of smart phones—and easy access to payment apps that are literally available at the touch of button, even for those without access to traditional bank accounts or branches.
In fact, innovations in e- and m-payments are emblematic of the broader imperative for PSPs, which is to provide payment solutions that customers need, in the form they need them, via the channels they prefer, in an accessible and easy-to-use way. Those needs will not be the same for every customer segment, or every corporate or individual customer, but PSPs need to identify the must-haves for any payments solution or experience they create, pursue, or present.
This imperative is especially pressing for banks, which unlike non-banks, have a wider scope than a single, narrowly focused solution or experience. Banks have long-standing and often multi-faceted and complex relationships with customers—relationships that exist and evolve within a highly regulated environment.
The challenge for banks, then, is to respond to the changing needs of customers and concurrently continue to operate compliantly in the markets where they compete. Given the increasing number and scope of regulatory initiatives, effective responses may increasingly involve partnerships with non-banks so that the combined strengths of partners can offer customers a compelling experience.
It remains to be seen exactly how the relationships between banks and non-banks will evolve in coming years, or how the regulatory environment will choose to monitor payments activities and players that are increasingly difficult to classify in the categories used by today’s banking system. It is clear, however, that users of payment instruments will continue to expect more choice and better service, so banks will need to increase the level of open dialogue with all stakeholders, including non-banks and regulators, to make sure conditions remain ripe for innovation—to the benefit of customers, PSPs, and the global economy.
Closing Thoughts
50
Clo
sin
g T
ho
ug
hTs

51World Payments rePort 2012
METHOdOLOGy
For worldwide macro descriptive graphs (number of transactions per region), seven regions were defined: Europe without Russia, North America, Japan-Australia-South korea-Singapore, BRIC (Brazil, Russia, India, China), Latin America without Brazil, Rest of Asia, and CEMEA, grouped by geographic, economic, and non-cash payment-market maturity criteria.
2011 NON-CASh TRANSACTIONS ESTIMATIONS
The non-cash payments estimations for 2011 were calculated using our forecast model, which has been further enhanced since WPR 2011 as part of our ongoing improvement efforts to size up-to-date trends for our readers, despite the delays in publication of official data. The model is bottoms-up, and takes into account factors such as historical growth rates of non-cash instruments at a country-level, the local regulatory environment, and certain macroeconomic factors that can impact the growth of non-cash payments in a region. Also, while most markets have not published actual 2011 numbers at the time of going to print, we have carried out ‘sense-checks’ with available 2011 numbers that were released in q2 2012 in order to further validate our estimates.
E-PAyMENTS AND M-PAyMENTS
Industry estimates for the overall size of the e-payments and m-payments markets are derived from various industry and analyst reports, including Advance Payments Report 2011, Edgar, dunn & Company; IE Market Research Corporation; Innopay-Mobile Payments 2012; PR Web; and Juniper Research.
For estimating transactional data for non-banks and alternative players, in e-payments and m-payments, we have analyzed transactional data from PayPal, Amazon, and vodafone M-Pesa.
Average transaction sizes for e-payments were estimated by analyzing cards data collected for WPR 2012, visa, and MasterCard transactional data. Average e-payment value per transaction was taken as US$66.3 for 2011, US$66.7 for 2012, and US$67.1 for 2013.
Average m-payment value per transaction (sourced from IE Market Research) was taken as US$6.6 for 2011, US$7.1 for 2012, and US$7.7 for 2013.
WPR 2012 ONlINE ExECuTIVE SuRVEy
The WPR online survey polled payments executives on the focus of innovation, the factors that affect innovation, the role of regulation, and their capability across ‘Innovation Bricks.’ The respondent population includes 30 banks, as well as non-banks, processors, and other players. The individual responses were weighted by country-level non-cash transaction volumes as quantified in Section 1. The survey was conducted in North America, Europe, and Asia-Pacific markets.
NON-CASh PAyMENTS
This year’s World Payments Report offers insights on the payments markets in the following geographical areas: � North America: Canada, and the U.S.; � Europe:
– The thirteen countries that were members of the Eurozone in 2007: Austria, Belgium, Finland, France, Germany, Greece, Ireland, Italy, Luxembourg, Netherlands, Portugal, Slovenia, and Spain. (Cyprus and Malta joined in 2008, Slovakia in 2009, and Estonia in 2011 are not the part of WPR 2012 non-cash transaction analysis.);
– Four non-Eurozone countries: denmark, Poland, Sweden, and the U.k.
� Mature Asia-Pacific: Australia, Japan, Singapore, and South korea;
� BRIC: Brazil, Russia, India, and China; � Latin America: excluding Brazil; � Central Europe, Middle-East, Africa (CEMEA) includes Saudi Arabia, South Africa, Turkey, and Ukraine.
data for Canada, China, Hong kong, Japan, Russia, Singapore, South Africa, and the U.S. was taken from the latest Bank for International Settlements (BIS) payment statistics Red Book (2010 data released december 2011). data for Europe was taken from the European Central Bank (ECB) Statistical data Warehouse (2010 data released November 2011). For the remaining countries, data was taken from central bank publications and websites. Macroeconomic indicators (gross domestic product and population) were collected from the World Bank and International Monetary Fund (IMF).
Total non-cash circulation is the sum of check, debit card, credit card, credit transfer and direct debit transactions. due to the numerous revisions in official data made by the ECB, along with changes in reporting methodology by various countries, data for previous years may diverge from data initially reported in the WPR 2011. CEMEA now includes South Africa data for 2009 and 2010. Wherever data was unavailable or substantially different, data was estimated on a linear basis. China 2010 direct debit data has been estimated (official data had yet to be published by China’s central bank). Germany’s data from 2005 onward has been updated by the ECB, and differs from that used in WPR 2011. From 2007 onward, the updated ECB data was taken, and estimated data for 2005 and 2006 at the payment instrument level, by using compound annual growth for 2004-07. These German numbers have been used in all our analysis. Apart from Germany, there were no major changes in methodology, and for all other countries, we used the latest data published, even if restated for previous years.
U.S. data from the BIS Red Book does not include prepaid cards data, which is included in data from the central bank.
due to a lack of reliable historical data trends, data for some countries has been estimated and then grouped under the appropriate regional heading: other Asian countries, other Latin America countries, or other CEMEA countries.
Methodology

52
ABIL’Associazione Bancaria Italiana (Italian Banking Association)
AChAutomated Clearing House
AMl / ATfAnti-Money Laundering / Anti-Terrorist Financing
A/P / A/RAccounts Payable / Accounts Receivable
ATMAutomated Teller Machine
B2B / B2CBusiness-to-Business / Business-to-Consumer
BAfT-IfSABankers’ Association for Finance and Trade and International Financial Services Association
BISBank for International Settlements
BRICRefers collectively to the countries of Brazil, Russia, India, China
CAGRCompound Annual Growth Rate
C2B / C2PConsumer-to-Business / Consumer-to-Public Sector
CEMEACentral Europe, Middle-East, Africa
ChAPSClearing House Automated Payments System (U.K.)
COINCommunity of Interest Network; see CPN
CPNCommon Payments Network, also known as the Community of Interest Network (COIN). Provides an alternative to point-to-point connectivity between members of the Australian payment system
CPSSCommittee on Payment and Settlement Systems
CTCredit transfer
CuPChina UnionPay
DD / DDADirect Debit / DD Authorization
DMfDebtor Mandate Flow
EBTElectronic Benefit Transfers
ECEuropean Commission
ECB DWhEuropean Central Bank’s Statistical Data Warehouse (DWH), the official ECB publication covering the main payment and securities settlement systems in EU Member States
EEAEuropean Economic Area (27 EU Member States plus Iceland, Liechtenstein, and Norway)
EfmaEuropean Financial Management & Marketing Association
eGovernmentThe use of Information and Communication Technology (ICT) by governments to inform and render services to citizens and businesses
e-InvoicingThe transmission and storage of invoices, without the delivery of paper documents, by electronic means
e-MandateThe process of issuing an e-mandate will allow Debtors and Creditors to exchange mandates in a fully electronic way
EMDe-Money Directive (EU)
EMV standardEuropayMasterCardVisa – a global standard for cards, POS and ATM terminals in relation to credit and debit card payments
e-paymentsOn-line payments for e-commerce transactions
EPCEuropean Payments Council
e-procurementUse of electronic communications and transaction processing by government institutions and other public sector organizations when buying supplies and services or tendering public works.
e-SEPAServices that make use of advanced information and communication technology when offering pre-payment, payment and/or post-payment services within the SEPA framework
ESMAEuropean Securities and Markets Authority
EuEuropean Union
EurozoneThe Eurozone comprises the Member States of the EU that have adopted the euro as their national currency. Eurozone data in the first Section of this report covers the thirteen countries that were members in 2007 – Austria, Belgium, Finland, France, Germany, Greece, Ireland, Italy, Luxembourg, Netherlands, Portugal, Spain and Slovenia. Since then, Cyprus, Malta, and Slovakia and Estonia have also joined, bringing the number of Eurozone members to 17 as of 2012
Glossary

53World Payments rePort 2012
fATCAU.S. Foreign Account Tax Compliance Act; U.S. government move to improve tax compliance involving foreign financial assets and offshore accounts
fATfFinancial Action Task Force, an inter-governmental body whose objective is the development and promotion of policies to combat money laundering and terrorist financing
fIFinancial Institution
fMIFinancial Market Infrastructures
fSAFinancial Services Authority (U.K.)
GDPGross Domestic Product
ICTInformation and Communication Technology
IOSCOInternational Organization of Securities Commissions
Interchange feeThe fee paid by the acquirer to the issuer mainly to reimburse for payment guarantees, fraud management, and issuer processing costs
IPfAInternational Payments Framework Association
IPPInternet Payment Platform (e-invoicing processing solution for U.S. Treasury bureaus)
ISO 20022Abbreviated term referring to the ISO message scheme used by SEPA instruments
ITTsIndustry Transformation Trends
KRIIsKey Regulatory and Industry Initiatives
KSfKey Success Factor
legacy paymentsTerm used to describe domestic payment instruments that pre-date SEPA
m-paymentsMobile payments; any payment initiated through a mobile device
MandateIn payments, the “mandate” is the authorization required
MNOMobile Network Operator
MIfMultilateral Interchange Fee
NAChANational Automated Clearing House (U.S.)
NfCNear-Field Communications (short-range wireless technology) used for contactless payments
Non-Cash PaymentsPayments made with instruments other than notes and coins, i.e., using credit transfers, direct debits, credit or debit cards or checks
NPCINational Payments Corporation of India
P2PPerson-to-Person
Payments hubThe “business evolution” of the Payments Factory: it also focuses on people, processes, consolidated payment processing that enables a wide range of sourcing strategies and facilitates product innovation
PIPayment Institution
POSPoint-of-Sale
PSDPayment Services Directive
PSP / PSuPayment Service Provider / Payment Service User
Red BookAn official publication of the Bank for International Settlements (BIS)
ROIReturn on Investment
RTGSReal-Time Gross Settlement
SCTSEPA Credit Transfer
SDDSEPA Direct Debit
SEPAThe Single Euro Payments Area is a domain in which the EEA is standardizing all euro payments and collections so they can be treated as domestic transactions
SMSShort Message Service (more commonly known as text-messaging)
STPStraight-Through Processing
SWIfTSociety for Worldwide Interbank Financial Telecommunication
uCITSUndertakings for Collective Investments in Transferable Securities (EU Directive)
GLOSSARy
Glossary

54
With around 120,000 people in 40 countries, Capgemini is one of the world’s foremost providers of consulting, technology and outsourcing services. The Group reported 2011 global revenues of EUR 9.7 billion. Together with its clients, Capgemini creates and delivers business and technology solutions that fit their needs and drive the results they want. A deeply multicultural organization, Capgemini has developed its own way of working, the Collaborative Business ExperienceTM, and draws on Rightshore®, its worldwide delivery model. Learn more about us at www.capgemini.com.
Capgemini’s Global Financial Services Business Unit brings deep industry experience, innovative service offerings and next generation global delivery to serve the financial services industry. With a network of 21,000 professionals serving over 900 clients worldwide Capgemini collaborates with leading banks, insurers and capital market companies to deliver business and IT solutions and thought leadership which create tangible value.
visit www.capgemini.com/financialservices
Rightshore® is a trademark belonging to Capgemini
The RBS group is a large international banking and financial services company serving over 27 million clients across the Uk, Europe, Middle East, Africa, Americas and Asia. Its Transaction Services business ranks among the leading international providers of transaction banking services – delivering domestic and international payments, cash and liquidity management services, trade finance solutions and commercial cards to corporates, financial institutions and public sector organisations around the world.
RBS’s solutions range from single onshore clearing accounts, through innovative liquidity and short-term investment solutions to full white-labelling of our cash management and trade finance capabilities. An on-the-ground presence in 37 major trading economies and partner bank agreements worldwide, gives us the global reach and local expertise to help drive your business forward. This extensive footprint simplifies the clearing process across currencies and geographies and enables you to leverage our proven trade solutions to manage your trade flow products and trade finance transactions. Access to specialist advisory teams, an award-winning product set and integrated end-to-end solutions gives you the tools you need to enhance your capabilities.
visit www.rbs.com
As a global not-for-profit organisation, Efma brings together more than 3300 retail financial services companies from over 130 countries. With membership from almost a third of all large retail banks worldwide, Efma has proven to be a valuable resource for the global industry, offering members exclusive access to a multitude of resources, databases, studies, articles, news feeds and publications. Efma also provides numerous networking opportunities through work groups, online communities and international meetings.
visit www.efma.com
About Us

We would like to extend a special thanks to all of the financial institutions and individuals who participated in our executive interviews and surveys.
The following firms are among the participants who agreed to be publicly named:
ABN AMRO Bank, Netherlands; Banco Bradesco S.A., Brazil; Banco Comercial Portugues SA, Portugal; Bank of Queensland, Australia; BBVA, Spain; BNP Paribas PF, France; CGD, Portugal; CIP, Brazil; Clydesdale Bank, UK; Commerzbank, Germany; Credit Agricole, France; Currence-iDEAL, Netherlands; Deutsche Bank S.A., Brazil; Deutsche Card Services GmbH, Germany; EBA Clearing, France; Equens, Netherlands; Erste Group Bank AG, Austria; Garanti Payment Systems, Turkey; Giesecke & Devrient, US; ICICI Bank, UK; ING, Netherlands; Itaú-Unibanco, Brazil; KBC Group, Belgium; Natixis, France; NCR Corporation, India; NETS, Norway; Nordea Bank AB, Finland; NPCI, India; NTT Docomo, Japan; PayPal, US; Rabobank, Netherlands; SEB, Sweden; SiNSYS, Italy; STET, France; Unicredit, Italy; VocaLink, UK; Wells Fargo & Company, US
We would also like to thank the following teams and individuals for helping to compile this report:
Christophe Vergne, William Sullivan, David Wilson, and Anuj Agarwal for their overall leadership for this year’s report: Amit Jain, Aneet Bansal, Mahesh Bhattad, Rajendra Thakur, and Jackie Wiles for researching, compiling and writing the findings, as well as providing in-depth market analysis.
Capgemini’s Global Payments Network for providing their insights, industry expertise and overall guidance: Jeroen Holscher, Paul Koetsier, Michel Vaja, Martina Weimert, Venugopal Pappu Subrahmanya Venkata, Sergio Magnante, Veronica Pichi, Deborah Baxley, Saskia Stekelenburg, Paresh Madani, Linton Burling, and Joel Oliveira.
The Global Product Marketing and Programs, and Corporate Communications Teams for producing, marketing and launching the report: Karen Schneider, Vanessa Baille, Mary-Ellen Harn, Matt Hebel, Martine Maître, Sourav Mookherjee, Stacy Prassas, Erin Riemer, and Sunoj Vazhapilly.
RBS Thought Leaders for providing insight, industry expertise and guidance: Teresa Connors, Simon Newstead, Andy Brown, Jenny Way, Jonathan Bye, Petra Plompen, George Evers, Alison Elworthy, Trina Knowles, and from the RBS marketing team: Aoife Reynolds, Oliver Williams, and Rachel Kerrone.
The Efma team and Patrick Desmarès for their collaborative sponsorship, marketing, and continued support.
© 2012 Capgemini and The Royal Bank of Scotland plc (RBS). All Rights Reserved. Capgemini, RBS, and Efma, their services mentioned herein as well as their logos, are trademarks or registered trademarks of their respective companies. All other company, product and service names mentioned are the trademarks of their respective owners and are used herein with no intention of trademark infringement. No part of this document may be reproduced or copied in any form or by any means without written permission from Capgemini.
Disclaimer The information contained herein is general in nature and is not intended, and should not be construed, as professional advice or opinion provided to the user. This document does not purport to be a complete statement of the approaches or steps, which may vary accordingly to individual factors and circumstances, necessary for a business to accomplish any particular business goal. This document is provided for informational purposes only; it is meant solely to provide helpful information to the user. This document is not a recommendation of any particular approach and should not be relied upon to address or solve any particular matter. The text of this document was originally written in English. Translation to languages other than English are provided as a convenience to our users. Capgemini, RBS, and Efma disclaim any responsibility for translation inaccuracies. The information provided herein is on an ‘as-is’ basis. Capgemini, RBS, and Efma disclaim any and all representations and warranties of any kind concerning any information provided in this report and will not be liable for any direct, indirect, special, incidental, consequential loss or loss of profits arising in any way from the information contained herein.
Acknowledgements
For more information, please contact:
Capgemini [email protected]
Efma [email protected]
For press inquiries, please contact:
Marta Saez (Pan-Europe) [email protected]
Stephen Bosk (North America) [email protected]
Mary-Ellen Harn (Capgemini) [email protected]
Aoife Reynolds (RBS) [email protected]
Karine Coutinho (Efma) [email protected]
Visitwww.wpr12.com
www.capgemini.com/wpr12
www.rbs.com


