The acrolein and acrylonitrile synthesis over a bismuth molybdate catalyst : kinetics and mechanism Citation for published version (APA): Lankhuijzen, S. P. (1979). The acrolein and acrylonitrile synthesis over a bismuth molybdate catalyst : kinetics and mechanism. Eindhoven: Technische Hogeschool Eindhoven. https://doi.org/10.6100/IR1200 DOI: 10.6100/IR1200 Document status and date: Published: 01/01/1979 Document Version: Publisher’s PDF, also known as Version of Record (includes final page, issue and volume numbers) Please check the document version of this publication: • A submitted manuscript is the version of the article upon submission and before peer-review. There can be important differences between the submitted version and the official published version of record. People interested in the research are advised to contact the author for the final version of the publication, or visit the DOI to the publisher's website. • The final author version and the galley proof are versions of the publication after peer review. • The final published version features the final layout of the paper including the volume, issue and page numbers. Link to publication General rights Copyright and moral rights for the publications made accessible in the public portal are retained by the authors and/or other copyright owners and it is a condition of accessing publications that users recognise and abide by the legal requirements associated with these rights. • Users may download and print one copy of any publication from the public portal for the purpose of private study or research. • You may not further distribute the material or use it for any profit-making activity or commercial gain • You may freely distribute the URL identifying the publication in the public portal. If the publication is distributed under the terms of Article 25fa of the Dutch Copyright Act, indicated by the “Taverne” license above, please follow below link for the End User Agreement: www.tue.nl/taverne Take down policy If you believe that this document breaches copyright please contact us at: [email protected]providing details and we will investigate your claim. Download date: 18. Feb. 2020
Transcript
The acrolein and acrylonitrile synthesis over a bismuthmolybdate catalyst : kinetics and mechanismCitation for published version (APA):Lankhuijzen, S. P. (1979). The acrolein and acrylonitrile synthesis over a bismuth molybdate catalyst : kineticsand mechanism. Eindhoven: Technische Hogeschool Eindhoven. https://doi.org/10.6100/IR1200
DOI:10.6100/IR1200
Document status and date:Published: 01/01/1979
Document Version:Publisher’s PDF, also known as Version of Record (includes final page, issue and volume numbers)
Please check the document version of this publication:
• A submitted manuscript is the version of the article upon submission and before peer-review. There can beimportant differences between the submitted version and the official published version of record. Peopleinterested in the research are advised to contact the author for the final version of the publication, or visit theDOI to the publisher's website.• The final author version and the galley proof are versions of the publication after peer review.• The final published version features the final layout of the paper including the volume, issue and pagenumbers.Link to publication
General rightsCopyright and moral rights for the publications made accessible in the public portal are retained by the authors and/or other copyright ownersand it is a condition of accessing publications that users recognise and abide by the legal requirements associated with these rights.
• Users may download and print one copy of any publication from the public portal for the purpose of private study or research. • You may not further distribute the material or use it for any profit-making activity or commercial gain • You may freely distribute the URL identifying the publication in the public portal.
If the publication is distributed under the terms of Article 25fa of the Dutch Copyright Act, indicated by the “Taverne” license above, pleasefollow below link for the End User Agreement:
www.tue.nl/taverne
Take down policyIf you believe that this document breaches copyright please contact us at:
THE ACROLEIN AND ACRYLONITRILE SYNTHESIS OVER A BISMUTH MOLYBDATE CATALYST
' THE ACROLEIN AND ACRYLONITRILE SYNTHESIS
OVER A BISMUTH MOLYBDATE CATALYST
Kinetics and mechanism
PROEFSCHRIFT
TER VERKRIJGING VAN DE GRAAD VAN DOCTOR IN DE TECHNISCHE WETENSCHAPPEN AAN DE TECHNISCHE HOGESCHOOL EINDHOVEN, OP GEZAG VAN DE RECTOR MAGNIFICUS, .PROF. DR. P. VAN DER LEEDEN, VOOR EEN COMMISSIE AANGEWEZEN DOOR HET COLLEGE VAN DEKANEN IN HET OPENBAAR TE· VERDEDIGEN OP
VRIJDAG 22 JUNI 1979 TE 16.00 UUR
DOOR
SIMON PIETER LANKHUIJZEN
GEBOREN TE BREDA
ORUK: WIBRO HELMOND
Dit proefschrift is goedgekeurd door de promotoren:
Prof. drs. H. s. van der Baan, le promotor
Prof. dr. G. C. A. Schuit, 2e promotor
Aan Anny
Aan Jannelies
Gerdiene
Joanne
Machteld
Han
CONTENTS
1. Introduction
1.1. General
1.2. Acrylonitrile manufacture
1
2
1.3. The mechanism of the oxidation and arnmoxidation of
propene 3
1.4. Aim and outline of the present investigation 4
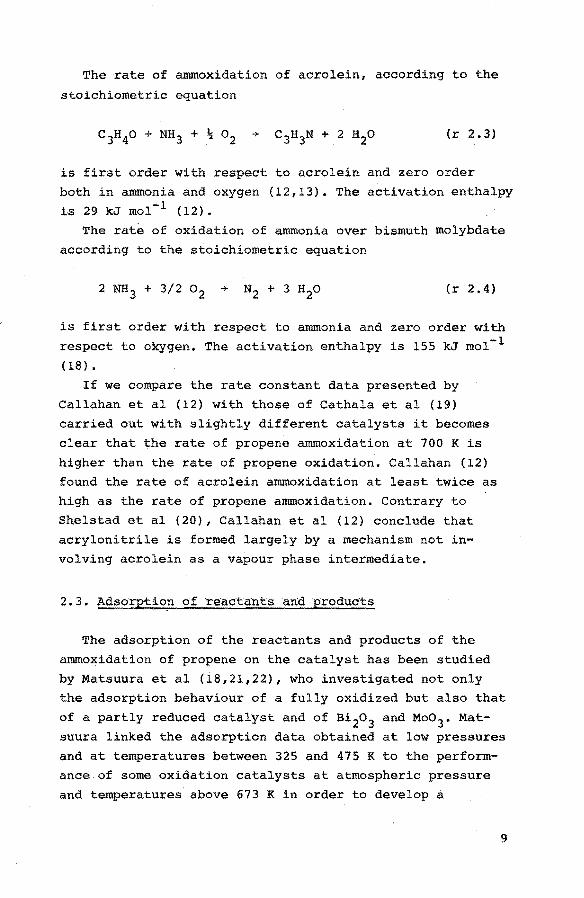
During the past two decades more than 400 papers and
reviews have been published about the selective oxidation of olefins in general and the ammoxidation of propene
over bismuth molybdates or bismuth molybdate containing
catalysts in particular.
In this chapter we will give a brief literature survey
to situate the subject of our investigation. It is not our
aim however to add a new comprehensive review of the li
terature to the excellent ones that have appeared already (1,2,3).
Catalytic oxidation reactions can be explained accor
ding to two different mechanisms, viz.
a) the reduction-oxidation mechanism, proposed by Mars
and van Krevelen (4) operating in the higher tempe
rature range;
b) the associative mechanism set up by Roiter (5) at
lower temperatures.
In the redox mechanism two separate steps are distinguish
ed: in the first step the hydrocarbon is oxidized with
lattice oxygen whereas in the second step the reduced
oxide is reoxidized by oxygen of the gasphase. In the
associative mechanism a reaction between adsorbed oxygen
species and the hydrocarbon occurs. Evidence for the two
mechanisms is obtained from i~otopic exchange experiments,
as has been pointed out by Boreskov (6) and Winter (7,8)
and from catalyst reduction experiments carried out by
Batist et al (9) and Sachtler et al (10).
Bismuth molybdate catalysts show a high activity in com
bination with a good selectivity both in the oxidation and
7
in the ammoxidation of propene. During the oxidation of
propene besides acrolein only small quantities of carbon dioxide, carbon monoxide, acetaldehyde and formaldehyde are
formed. Acrylonitrile is the main product of the propene
ammoxidation. Other products are acetonitrile, hydrogen cyanide, carbon dioxide and carbon monoxide whereas acrolein
is only a trace product. The stoichiometric equations are
(r 2.1)
(r 2.2)
2.2. Kinetics
Broadly there is a great similarity in the overall features of the oxidation and ammoxidation of propene over bismuth molybdate catalysts: the rates of oxidatiop and
ammoxidation are both first order with respect to propene
and zero order with respect to oxygen. The rate of ammoxi
dation is zero order in ammonia (11,12).
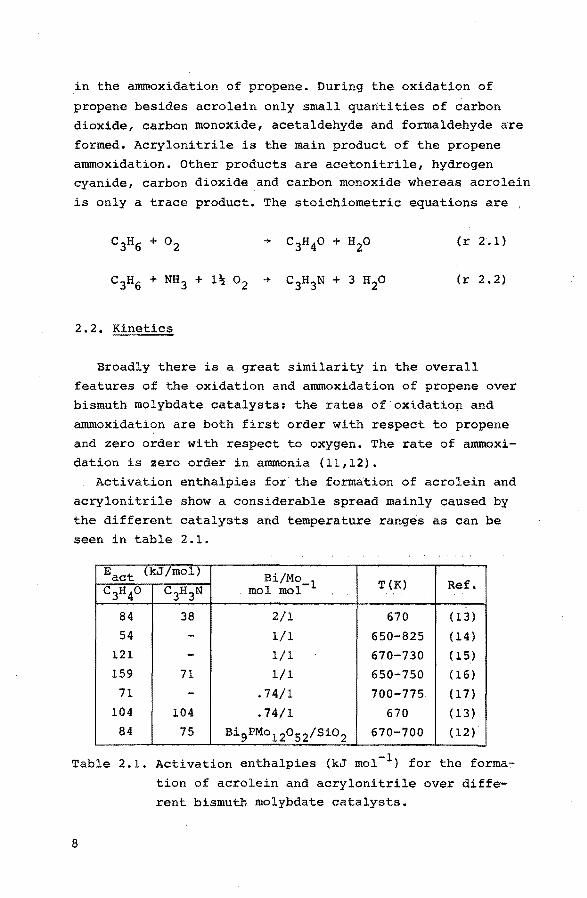
Activation enthalpies for the formation of acrolein and
acrylonitrile show a considerable spread mainly caused by
the different catalysts and temperature ranges as can be seen in table 2.1.
Table 2.1. Activation enthalpies (kJ mol-l) for the forma~ tion of acrolein and acrylonitrile over different bismuth molybdate catalysts.
8
The rate of ammoxidation of acrolein, according to the
stoichiometric equation
(r 2.3)
is first order with respect to acrolein and zero order
both in ammonia and oxygen (12,13). The activation enthalpy is 29 kJ mol-l (12).
The rate of oxidation of ammonia over bismuth molybdate
according to the stoichiometric equation
+ (r 2 .4)
is first order with respect to ammonia and zero order with
respect to oxygen. The activation enthalpy is 155 kJ mol-l
( 18) •
If we compare the rate constant data presented by
Callahan et al (12) with those of Cathala et al (19)
carried out with slightly different catalysts it becomes
clear that the rate of propene ammoxidation at 700 K is
higher than the rate of propene oxidation. Callahan (12)
found the rate of acrolein ammoxidation at least twice as
high as the rate of propene ammoxidation. Contrary to
Shelstad et al (20), Callahan et al (12) conclude that
acrylonitrile is formed largely by a mechanism not in
volving acrolein as a vapour phase intermediate.
2. 3. AdsorE,t'i,on of reactants an:d ·products
The adsorption of the reactants and products of the
ammoxidation of propene on the catalyst has been studied
by Matsuura et al (18,21,22), who investigated not only the adsorption behaviour of a fully oxidized but also that
of a partly reduced catalyst and of Bi2o 3 and Moo3 • Mat
suura linked the adsorption data obtained at low pressures
and at temperatures between 325 and 475 K to the performance of some oxidation catalysts at atmospheric pressure
and temperatures above 673 K in order to develop a
9
reaction mechanism. He distinguishes between two types of
adsorption viz. the socalled A-type and the B-type adsorption.
The A-type is an activated, strong and slow adsorption, observed for butadiene, acrolein and ammonia on oxidized
Bi2Mo06 and for acrolein on Bi2o 3 • All adsorptions are of
the dual site type except the butadiene adsorption which
is a single site type. Enthalpies of adsorption are between 88 -1 .
and 100 kJ mol • Prereduction of the catalyst linearly de-creases the number of A-sites, so an A-site contains an
oxygen ion (OA). To allow for the two types of adsorption and for a similar adsorption of acrolein on Bi2o 3 it is
assumed that the A-site contains two anion vacancies (VBi)
located at two Bi-ions next to the oxygen ion OA. So the
A-site is VBiOAVBi' The B-type adsorption is a weak and fast adsorption
observed for butadiene, acrolein, olefins and ammonia.
This type of adsorption occurs on Bi 2Mo06 as well as on
Moo3 , but not on Bi2o 3 ~ On Bi2Moo6 all B-type adsorptions are of the dual site kind, except the ammonia adsorption. Enthalpies of adsorption are in the range of 25-50 kJ mol-l.
Previous reduction does not remove B .. sites, provided the
reduction temperature does not exceed 673 K. At tempera~
ture above 673 K Batist et al (23) found a rapid reduction
of the catalyst by butene-1 at degrees of reduction less than 8.3% and without loss of activity after reoxidation.
According to Matsuura (21) the reoxidation above 673 K is
first order in oxygen with an activation enthalpy of 72 kJ mol-1 •
The removal of B-sites, mentioned by Matsuura is probably connected with some rearrangement in the solid viz.
the formation of metallic Bi in a separate phase. This
phenomenon has been mentioned by Batist et al '(24,25).
B-sites are claimed to be combinations of an anion vacancy
(VM0
) and two oxygen ions (OB). So the B-site is OBVMooB. The A-type adsorption of ammonia and acrolein is strong
and the enthalpies of adsorption are so high that desorption
can only occur at reaction tP;mperatures. Adsorption of.
10
oxygen on non reduced catalysts does not occur. However, the catalyst shows some reversible dissociation when . the gas phase oxygen partial pressure is lower than the
equilibrium oxygen pressure (i.e. p02
eq (673 K) = 1.3 10-8
bar). According to Matsuura (21) the adsorption of oxygen
on partially reduced catalysts at room temperature is
small, rapid and independent of the degree of reduction
and does not lead to complete reoxidation.
Between 373 and 673 K the rate of reoxidation is zero order in oxygen. The enthalpy of activation is 113 kJ mol-1 ,
a value found also by Batist et al (9) for the reoxidation
of reduced Bi 2Mo 2o9 • Above 673 K the rate of reoxidation
becomes first order with respect to oxygen and has an
enthalpy of activation of- about 72 kJ mol-l, depending on the degree of reduction. According to Matsuura the acro
lein adsorption occurs on both A and B-sites. The strong and slow adsorption on site A, also observed on Bi2o3 is
a dual site adsorption. This acrolein adsorption fits the
adsorption model proposed by Sachtler et al (26}. This
dual site adsorption must influence the dual site adsorp
tion of propene on site B, which needs also OB' This could
be verified experimentally as the weak propene adsorptiqn
decreased after a pretreatment of the catalyst with acro
lein.
The adsorption behaviour of ammonia on an oxidized catalyst is very complicated. Matsuura (18) concludes that the
strong dual site adsorption is connected with the A-site,
with the donation of a proton to OB of the B-site. The ammonia adsorption on partially reduced catalysts is con
nected with a reduced A-site.
The weak and dual site adsorption of propene on site B
decreases after a pretreatment of the catalyst with ammo
nia. Experimental data of the strong adso~ption of ammonia
on Moo3 and Bi2o 3 are lacking because of the nitrogen formatio.n already occuring at low temperatures. Kfivanek et
al (27) calculated the enthalpy of adsorption of propene under
reaction conditions at 440 K on bismuth molybdate to be 130 kJ mol-1 .
11
2.4. Hydrocarbon surface intermediates
By the use of isotopic labels it is established by
Sachtler et al (10), McCain et al (28) and Adams et al
(29,30) that the oxidation of propene over bismuth molyb
date proceeds via the formation of the allylic interme
diate which is negatively charged. According to Schuit (2)
the proton is donated to an 0 2- ion at the surface, expe
rimentally confirmed by Beres et al (31), and the carbanion
is bonded to a metal ion at an anion vacancy. This mecha
nism resembles that taking place during the chemisorption
of benzaldehyde on a Sno2-v2o 5 catalyst, studied by
Sachtler (32).
Recent molecular orbital calculations by Haber et al
(33) carried out for different transition-metal cations
support the postulate that the IT-bonding electrons are
transferred from the allylic intermediate to the Mo 6+ ion.
The Mo 6+ is reduced to Mo 5+ or Mo 4+ and the positive char
ge on the c 3H5+-ion is concentrated on the terminal C
atoms in a symmetrical distribution. After the transfer of 2-electrons the allylic intermediate is cr-bonded to an 0
as was confirmed by Kondo et al (34). Dozono et al (35)
studied the ammoxidation of 3-13c propene at 450°C in the
presence of bismuth molybdate. Half of 3-13c in the acry
lonitrile was found to be in the CN-group. This points to
a symmetrical intermediate also in the acrylonitrile syn
thesis. The appearance of 13c in both the methyl- and the
cyanogroup of acetonitrile, although not completely dis
tributed (60/40 respectively) can only result from bond
rupture in the allylic intermediate rather than from the
breakage of a C = C bond in propene, acrylonitrile or
acrolein.
Further dehydrogenation must lead to a c 3H4-interme
diate and proton donation to another o 2- ion. Adams et al
(29,30) suggested that the allylic intermediate undergoes
this hydrogen abstraction before the incorporation of
oxygen which has been experimentally confirmed by means of
kinetic isotope effect measurements. Cathala et al (19)
12
connected this step with a parallel bond rupture which
gives rise to degradation products. Daniel and Keulks (36)
reported at 725 K an enhanced conversion of propene in a
reactor having a large post-catalytic volume. It appeared
that a surface-initiated homogeneous gas phase reaction
caused the formation of side products. Without the post
catalytic volume this formation disappeared, Recently
Kobayashi et al (37} have studied the mechanism of the
oxidation of propene by applying a transient response me
thod. It was found that a stable surface intermediate exists which can be formed either from propene or from
acrolein. Further dehydrogenation of the c 3H4 intermediate is highly
unlikely. In the case of ammoxidation Cathala et al (19)
supposed that dehydrogenation occurs after the formation
of allylidene-imine (C 3H4NH). This was also suggested by
Grassel+i et al (38) for the ammoxidation catalysed by Usb3o 10 • 1
2.5. Nitrogen containin<J surface intermediates ori<Jinatin<J from ammonia
The NH2-intermediate follows from the adsorption expe
riments of Matsuura {18). Ammonia is dissociatively ad
sorbed, according to Matsuura donating a proton to an
oxygen ion of the B-site. Ammonia adsorption on a reduced
catalyst is supposed to occur preferentially on the anion
vacancy left after reduction. Matsuura (18) and Cathala
et al (19) drew for mechanistic reasons a parallel between the dehydrogenation of the allylic intermediate and the
amide group and supposed the formation of allylidene
imine, synthesized by Bogdanovic et al (39), which proba
bly has adsorption properties comparable with acrolein and
butadiene. Germain et al (40) classified the oxides that
catalyse the oxidation of ammonia and postulated that the
imine-intermediate is a substitute for the double bonded
oxygen ion. He classified Moo 3 and not Bi 2o 3 among the
oxides that show moderate oxidation activity for ammonia.
13
As mentioned already for the c3H4 intermediate
further dehydrogenation of the imine is supposed to be
very unlikely.
2.6. Role of o~gen
It is generally assumed that the o2- ion on the surface
of the oxide catalyst is responsible for the oxidation of
the hydrocarbon.
Reoxidation by gas phase oxygen leads to the formation of
o2- but needs four electrons for every oxygen molecule,
as follows from the equation
o2 + 4 e + 2 c {r 2.5)
Gates et al (2) suggest a more stepwise donation of
electrons, viz. the formation of some intermediate oxygen - 2- ~ species e.g. o2 1 o2 and o at lower temperatures.
In that region the Mars van Krevelen mechanism does not
apply as was indicated by Boreskov et al (41) and Sancier
et al (42). The evidence of these intermediates is esta
blished by ESR spectroscopy (41). Van Hooff (44) suggested
that these intermediates lead to chain reactions. Haber
(45) assumed the oxygen intermediates to be electrophilic
reagents and the oxidizing species in the total oxidation
of hydrocarbons, whereas lattice oxygen ions are nucleo
philic reagents with non oxidizing properties. Van Dillen
(46) investigated the existence of these species extensi
vely. I 18 16 By means of 0 - 0 exchange, however, it is esta-
blished by Keulks (47) and Wragg et al (48) that bismuth
molybdate catalysts do not exchange with o2 at. temperatu
.res below 773 K in the absence of an oxidation reaction. . 18
Keulks (47) suggested from experiments with o2 gas phase oxygen and Bi 2Mo16o6 that during the oxidation of propene
at 698 K the oxygen of about 500 layers participated in
the reaction and that these layers were oxidized by a
rapid diffusion of oxygen from the bulk of the catalyst
14
rather than by gas phase oxygen. However the gas phase oxy
gen was gradually incorporated in the product. An immediate incorporation would be expected if the reaction with
catalyst oxygen was confined to the surface layer only on
which gas phase oxygen would be chemisorbed. Wragg et al
(48) with experiments at 748-773 K came to the same con
clusion. As also 180 is gradually incorporated in the
carbon dioxide Keulks assumed that the selective and com
plete oxidation of propene occurs at the same site.
Pendleton et al (49) studied the reaction between pro
pene and 18o2 over bismuth molybdate between 623 and 673 K. They showed the incorporation of lattice oxygen into the
acrolein, whereas oxygen for the carbon dioxide formation
in that temperature region comes from both the gas phase
and the lattice. Keulks et al (50} however in a later in
vestigation at 703 K concluded that there is no distinc
tion be~ween the lattice oxygen incorporated into carbon
dioxide and into acrolein.
Sancier et al (42) determined the relative contribution
of sorbed and lattice oxygen during propene oxidation over
silica supported bismuth molybdate between 590 and 670 K in a pulse reactor and concluded that above 623 K lattice
oxygen becomes more important whereas below 623 K the mo
bility of lattice oxygen is low and adsorbed oxygen takes
over the role. Recently van Oeffelen (51) found a rapid
increase of the electrical conductivity during the re
duction of Bi2Mo1 • 02o6 • 06 with propene at 673 K. He
ascribed this phenomenom to the formation of bismuth metal
particles on the surface. Similar evidence was also obtained by Peacock et al (52). E.s.r.-signals due to Mo5+ were detected when the catalyst was exposed to propene
but these signals were absent when oxygen was added (53).
Sancier et al (54) and Burlamacchi et al (55) obtained
the same results.
2.7. Catalyst
Significant contributions to our understanding of the
15
excellent catalytic properties of bismuth molybdate and the
nature of the active phase have been made by Schuit, Ba
tist and coworkers (2,9,56,58).
It would carry us too far to give a literature survey
about the structure of the active catalyst. We refer to
the recent review of Gates et al (2) and to chapter 4.
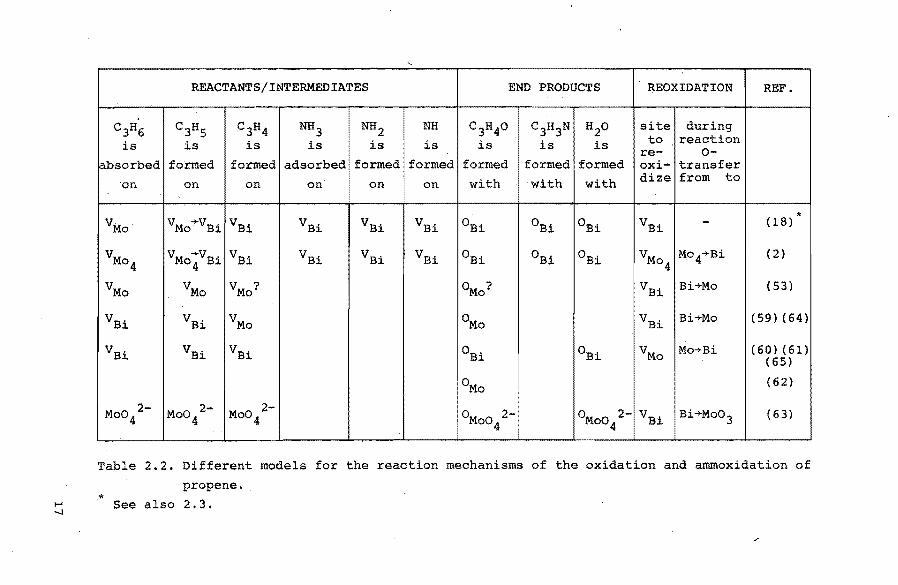
2.8. Models
Some authors have proposed models for the reaction me
chanism of the oxidation or ammoxidation of propene. These
models are summarized in table 2.2 without detailed infor
mation. In chapter 7 these models will be discussed.
16
REACTANTS/INTERMEDIATES
C3H6 C3H5 is is
C3H4 is
NH3 is
NH2 is
NH
is
c3a4o is
END PRODUCTS
C~H3NI H~O ~s ~s
REOXIDATION
site during to . reaction
re- 0-!absorbed formed formedladsorbedlformedlformedlformed formed! formed
with with
oxi- transfer dize from to
on I on on
VM.o
VMo4
VMo
VBi
VBi
2-Mo04
VMo..,.VBiiVBi
VMo~VBiiVBi
VMo
VBi
VBi
2-Mo04
VMo?
VMo
VBi
2-Mo04
on
VBi
VBi
on on
VBi VBi
VBi VBi
with
OBi
OBi
0Mo?
0Mo
OBi
0Mo
2-0Mo04
OBi
OBi
OBi
OBi
OBi
VBi
VM04
Mo4->-Bi
VBi Bi+Mo
VBi IBi+Mo
VMo IMo+Bi
0Moo4
2-IVBi Bi->-Mo0 3
REF.
* (18)
(2)
(53)
(59) (64)
(60) (61) ( 6 5)
( 62)
( 63)
Table 2.2. Different models for the reaction mechanisms of the oxidation and ammoxidation of
propene. * ~ See also 2.3.
~
1. Hucknall, D.J., Selective oxidation of hydrocarbons,
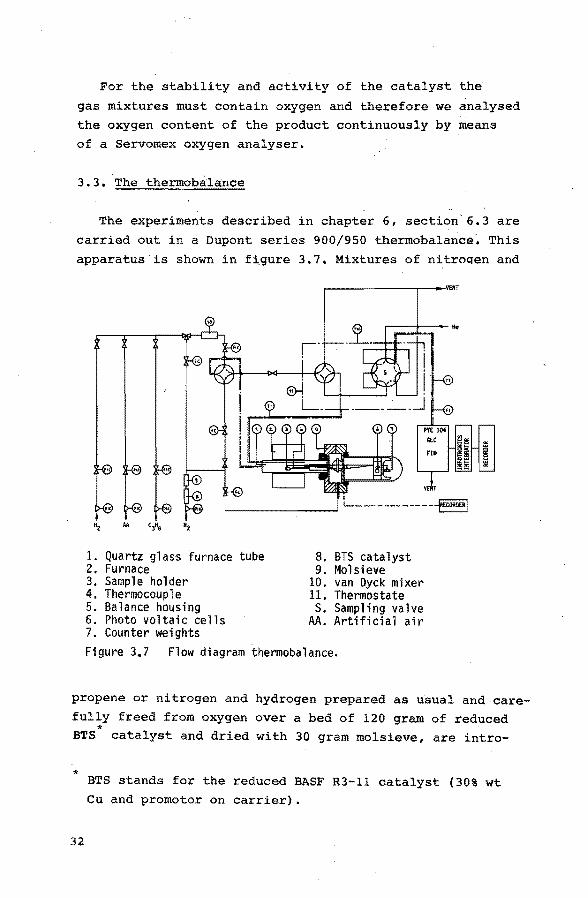
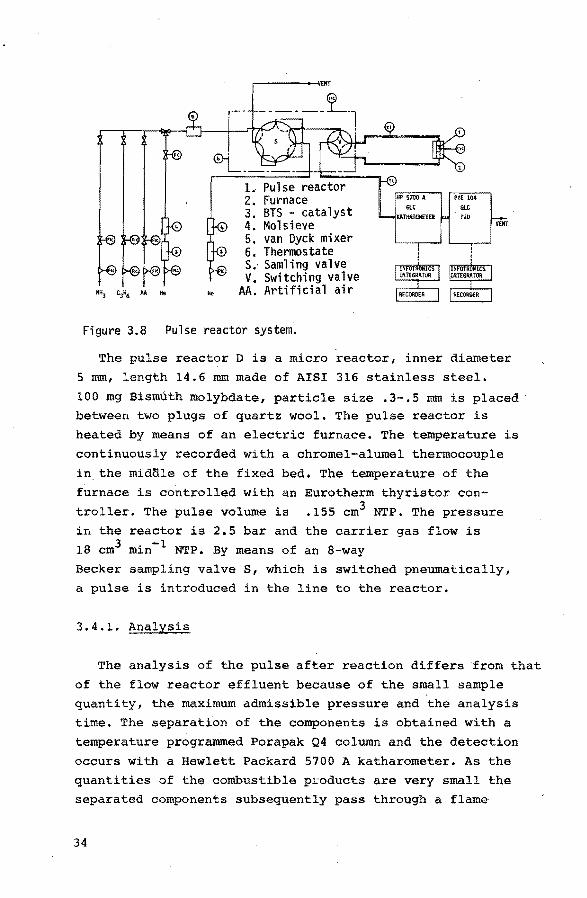
(SEE ALSO FIG. 3.2) 5. OXYGEN ANALYSER SEl SELECTION VALVE
FEED/PRODUCT M ARTIFICIAL AIR
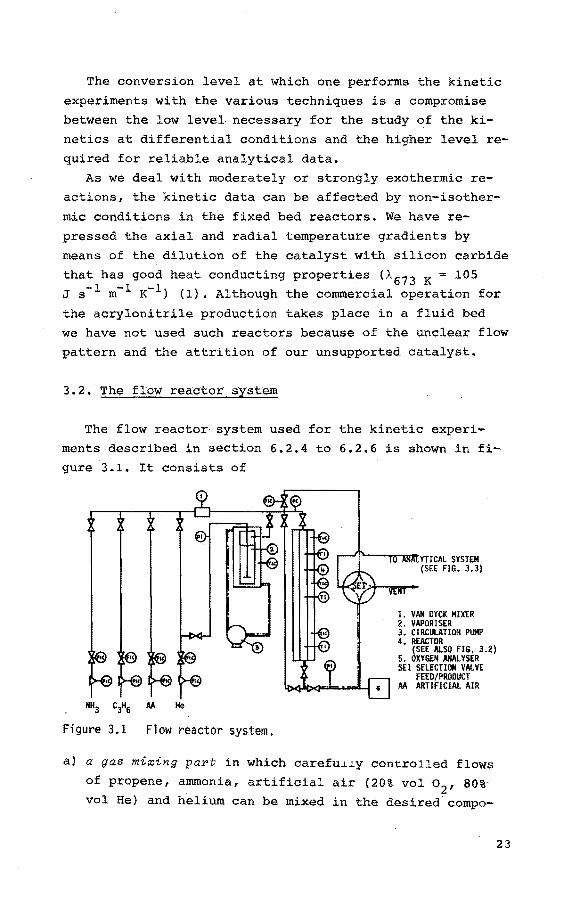
a) a gas mixing part in which carefu~~y controlled flows
of propene, ammonia, artificial air (20% vol o2
, 80%
vol He) and helium can be mixed in the desired compo-
23
sitions. For the experiments involving a liquid reac
tant (acrolein) and for the determination of the sub
stance specific correction factors of the liquids in
the analysis of the feed and the product composition
helium can be passed through a double-walled thermostated vaporizer filled with the pure component in
question. The desired partial pressure of the reactant
can be established by adjusting and controlling the
temperature of the vaporizer. It has been ascertained
that the rising heli~ bubbles were completely satura
ted with vapour. We used the Fourier-number as a mea
sure for the saturation of the dispersed phase
Dt Fo = r2 (3.J.)
with D is the molecular diffusion coef.ficient (m2 s-1),
tis the residence time of the bubble in the liquid (s),
r is the radius of the bubble (m). We found Fo > 4,
whereas already at Fo = .5 for Biot numbers >> 10 (no concentration gradient in the continuous phase), the
concentration distribution over the bubble is practi
cally constant (2). Moreover we analysed the vapour
gaschromatographically at varying liquid levels in the vaporizer and we found a constant vapour concentration.
b) a tubular fixed bed reaator, which is made of AISI 321
stainless steel. Three reactors have been used for the
various reactions as can be seen in table 3.1.
24
Reactor B is shown in figure 3.2. An aluminium jacket
has been cast around the reactor tube to improve the
temperature profile in the reactor. This aluminium
jacket is divided in three sections that are indepen
dently heated. The temperature is measured at eight places, three in the catalyst bed and five in the
siliconcarbide bed under and above the catalyst section.
The temperature is controlled at the three sections
within 1 K with Eurotherm thyristor controllers.
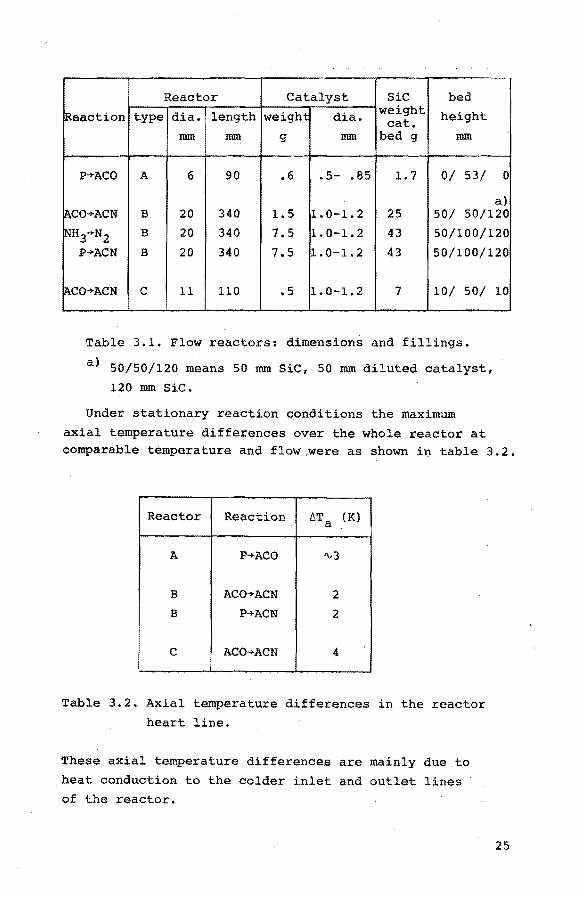
Reactor Catalyst SiC bed
Reaction type dia. length weight dia. weight height cat. lliiii lliiii g lliiii bed g lliiii
P-+ACO A 6 90 .6 • 5- • 85 1.7 0/ 53/ 0
a) jACO-+ACN B 20 340 1.5 1.0-1.2 25 50/ 50/120
INH3-+N2 B 20 340 7.5 1. 0-1.2 43 50/100/120 P-+ACN B 20 340 7.5 1. 0-1.2 43 50/100/120
IAco-+ACN c 11 110 .5 1.0-1.2 7 10/ 50/ 10
Table 3.1. Flow reactors: dimensions and fillings.
a) 50/50/120 means 50 mm SiC, 50 mm diluted catalyst,
120 mm SiC.
Under stationary reaction conditions the maximum
axial temperature differences over the whole reactor at comparable temperature and flow,were as shown in table 3.2.
Reactor Reaction t.Ta (K)
A P-+ACO 'V3
B ACO-+ACN 2 B P-+ACN 2
c ACO-+ACN 4
Table 3.2. Axial temperature differences in the reactor heart line.
These axial temperature differences are mainly due to
heat conduction to the colder inlet and outlet lines of the reactor,
25
II I ~ i
f;.
~ r
¥ ~
~ ~ ~
"' i~
fl-1-=~~~~~~:~~=--l ·~
H~.11
rg~~·i "'== • '
--'-.--J.I ~~"-'-'--· J
hfJ~(V/tf(l( .IVSI ZZt
{lllf¥,y·~s¥MMJrl«.
Figure 3.2 Flowreactor B.
26
Radial temperature profiles were measured in the cata
lyst section of reactor B and C during the ammoxidation of acrolein when the greatest differences could occur
and a temperature difference of not more than 1 K was
found in the radial direction.
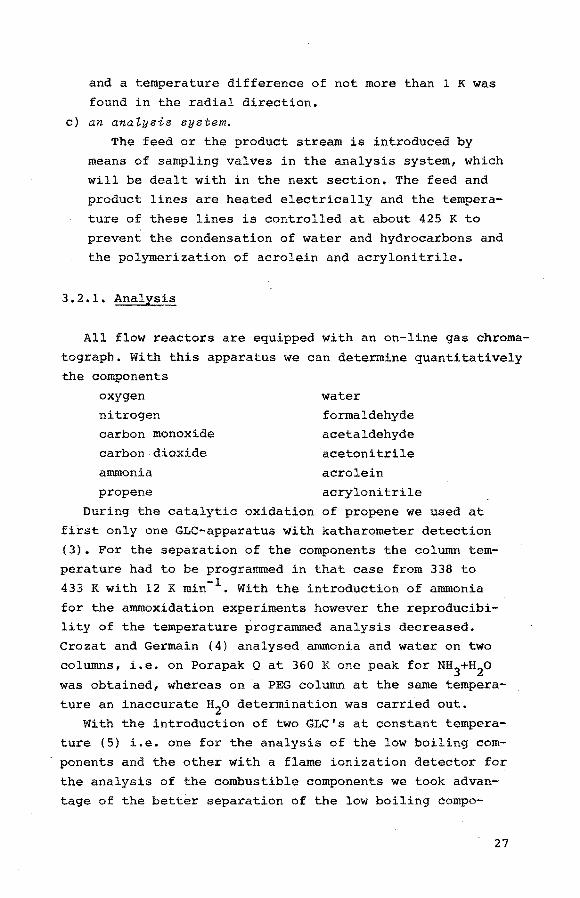
c) an analysis system.
The feed or the product stream is introduced by
means of sampling valves in the analysis system, which
will be dealt with in the next section. The feed and
product lines are heated electrically and the tempera
ture of these lines is controlled at about 425 K to
prevent the condensation of water and hydrocarbons and
the polymerization of acrolein and acrylonitrile.
3.2.1. Anal:y:sis
All flow reactors are equipped with an on-line gas chroma
tograph. With this apparatus we can determine quantitatively the components
oxygen
nitrogen
carbon monoxide
carbon dioxide
ammonia
water
formaldehyde
acetaldehyde
acetonitrile
acrolein
propene acrylonitrile
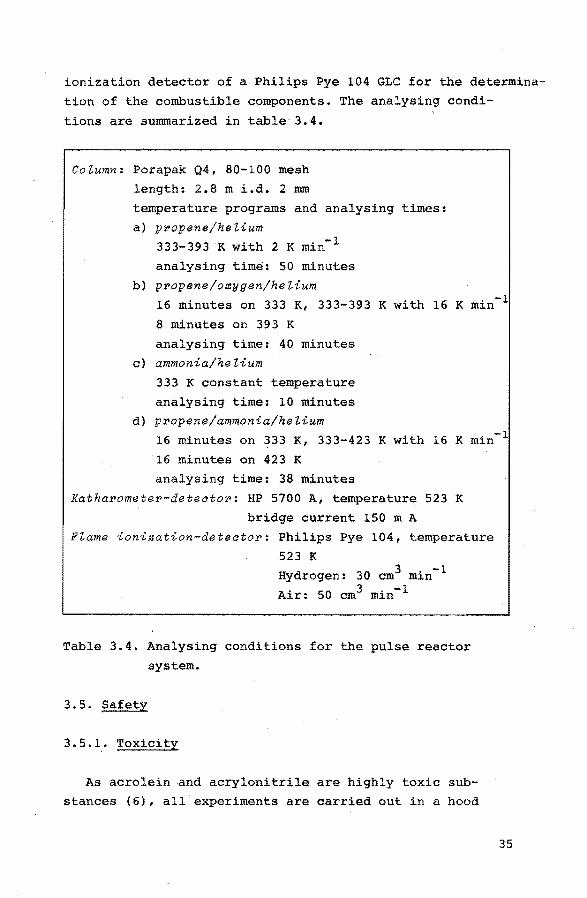
During the catalytic oxidation of propene we used at
fLrst only one GLC-apparatus with katharometer detection
(3). For the separation of the components the column tem
perature had to be programmed in that case from 338 to
433 K with 12 K min-1 . With the introduction of ammonia
for the ammoxidation experiments however the reproducibility of the temperature programmed analysis decreased.
Crozat and Germain (4) analysed ammonia and water on two
columns, i.e. on Porapak Q at 360 K one peak for NHj+H2o was obtained, whereas on a PEG column at the same tempera
ture an inaccurate H2o determination was carried out.
With the introduction of two GLC's at constant tempera
ture (5) i.e. one for the analysis of the low boiling com
ponents and the other with a flame ionization detector for
the analysis of the combustible components we took advan
tage of the better separation of the low boiling compo-
27
VENT
PRODUCT FEED
PRE SURE STABILIZER
VENT He
He
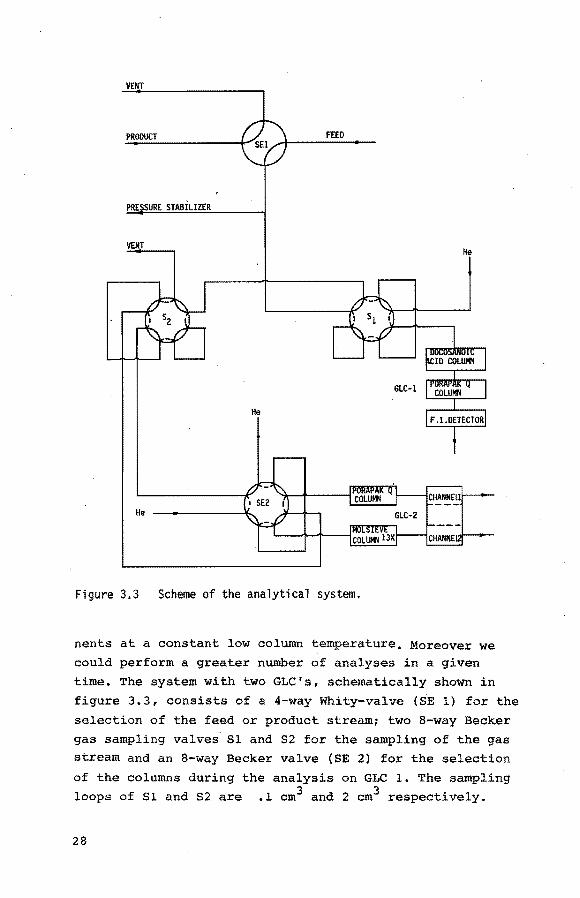
Figure 3.3 Scheme of the analytical system.
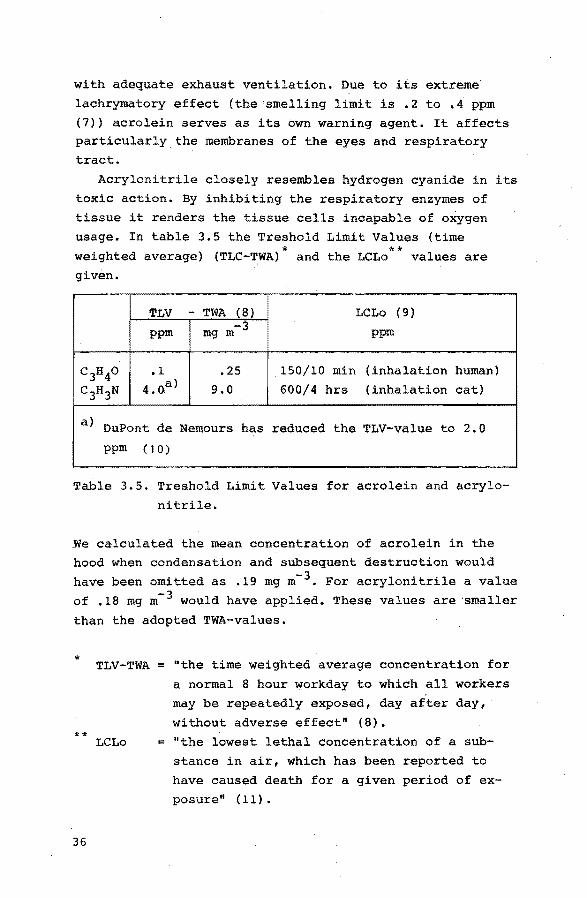
nents at a constant low column temperature, Moreover we could perform a greater number of analyses in a given
time. The system with two GLC's, schematically shown in
figure 3. 3, consists of a 4-way Whity-valve (S.E 1) for the
selection of the feed or product stream1 two 8-way Be.cker gas sampling valves S1 and S2 for the sampling of the gas stream and an 8-way Becker valve (SE 2) for the selection
of the columns during the analysis on GLC 1. The sampling
loops of S1 and S2 are .1 cm3 and 2 cro3 respectively.
5. A.P.B. Sommen, Int. Report TC (1975) University of Technology, Eindhoven
6. Sax, N.I., Dangerous Properties of Industrial Mate
rials, 4th Ed., van Nostrand Reinhold Cy., N.Y. (1975)
7. Hommel, G., Handbuch der gefahrlichen Guter, 2 Aufl.,
Springer Verlag, Berlin (1973)
8. Association of American Governmental Industrial Hy
gienists, Index TLV, Am. Ind. Hyg. Ass. Journ. 37, 721 (1976)
9. The International Technical Information Institute;
Toxic and Hazardous Industrial Safety Manual, Tokyo (1977)
10. Anon, Chern. Weekblad 1.1 (22) 1 (1977)
11. Registry of Toxic Effects of Chemical Substances, u.s.
38
Dept. of Health, Education and Welfare, NIOSH (1977) Cincinnatti, Ohio
CHAPTER 4
THE CATALYST
4.1. Introduction
It seems to be the fate of every catalyst to be repla
ced by another more active and selective one. So the mul
tiphase Cu-cu2o-cuo catalyst introduced in 1948 by Hearne and Adams (1), showing only a yield of about 50% in the
oxidation of propene to acrolein has.been superseded in the sixties by the superior bismuth molybdate catalyst.
Callahan et al (2) claimed this catalyst to be useful not
only for the oxidation of propene but also for the dehy
drogenation of 1-butene to butadiene and even for the
ammoxidation of propene to acrylonitrile. Shortly after
the commercial realization of the acrylonitrile process
SOHIO developed its second process based on USb3o10 (31.
but nowadays these two component catalyst system have been
replaced by the so-called multi-component~molybdate (MCM)
catalyst which contains.besides bismuth and molybdenum a
variety of elements such as nickel, cobalt, iron, manganese, phosphorus and potassium.
Whichever oxide combination may be an active and selec~
tive catalyst for the incorporation of a hetero atom (0 or
N) or for the dehydrogenation of olefins, ~t became evi
dent that the superior catalysts are all oxidic combina
tions or compounds containing at least two different ele~
ments. One of these is always a transition metal and the
other belongs to the later row Sa elements. The group of
ammoxidation catalysts is characterized by a high selec
tivity for partial oxidation and its ability to supply
oxygen as a reactant for a selective fissure of the C-H
and N-H bonds.
39
4.2. The structure of the bismuthmolybdate, catalyst
Of the two components of the catalyst of our investi
gation, Bi2o 3 and Moo3 , the former shows at temperatures below 773 K a low ac~ivity, while Moo3 displays at these temperatures an even lower activity but a fair se
lectivity at those temperatures. In combination by means
of a proper preparation method, however, a conspicuously
active and selective catalyst emerges.
Many attempts have b~en made to determine the structure
of the active phase. Series of catalysts have been prepared with varying Bi/Mo atomic ratios in the range of 2/3
to 2/1. All the catalyst samples were found to be selec
tive but differently active (4). In this range three sta
ble compounds were found, viz.
- the a.-phase (Bi2Mo3o12 ) with a monoclinic structure (a = 7.89, b = 11.70, c = 12.24 10""10 m, ~ =.116° l2'l .• This
structure is related to the structure of Scheelite, mentioned by Mekhtiev (5). The x .. ray data of Aykan (6) were
in good agreement with those of E!leij~nberg et al {7)
although the pattern contained additional reflections,
which means that more than one phase was present. Single
crystal studies by van den Elzen and Rieck (8) have confirmed the monoclinic structure. The a.~phase is stable
and has a melting point of 949 K.
- the (3-phase (Bi2Mo2o 9) or the so .... called Erman phase (9)
has been studied in detail. However, there still remains a great deal of uncertainty with regard to its stability
in catalytic oxidation which depends on the applied pre~
parative technique. The solid state technique as used by
Erman (9) leads to different metastable phases such as
the high-temperature y'-bismuth molybdate in the temperature region of catalytic activity in oxidation reactions.
40
The precipitation technique as used by Grzybowska et
al (10), Trifiro et al (ll) and Batist et al (4) (12) is
influenced by factors as pH, concentration of reagents and the treatment of the precipitate. Moreover the calcination temperature is an important factor, because
Batist (12) stated that already at temperatures up to
773 K the ~-phase slowly disproportionates into the a
and the y-phase. It has been observed by Batist et al
(12)(13) that the pH during the precipitation has a
strong influence on the catalytic activity of the aphase. This phenomenon is connected with the equilibrium
between the Mo-O-octahedra and - tetrahedra and it is
assumed that in these preparations the y-phase is always
present. The discussion about the structure of the ~phase has not yet come to an end. As the Bi/Mo ratio 1/1
is frequently used in commercial catalysts the elucida
tion of the nature of the active phase is an interesting
issue.
the y-phase (Bi2Mo06) has an x-ray pattern similar to
that of the rare mineral bismuthrnolybdate named Koechli~
nite, as reported by Zemann (14). It has a layer struc~
ture made up of (Bi 2o2 )~+ and (Moo2 )~+ sheets connected
by o 2- in the arrangement:
The structure of the mineral Koechlinite is orthorhombic . ~0 .
(a = 5.50, b = 16,24, c = 5.49 10 m) which was con-
firmed by van de Elzen and Rieck (15) who found the
following parameters (a= 5.487, b = 16.226, c = 5.506
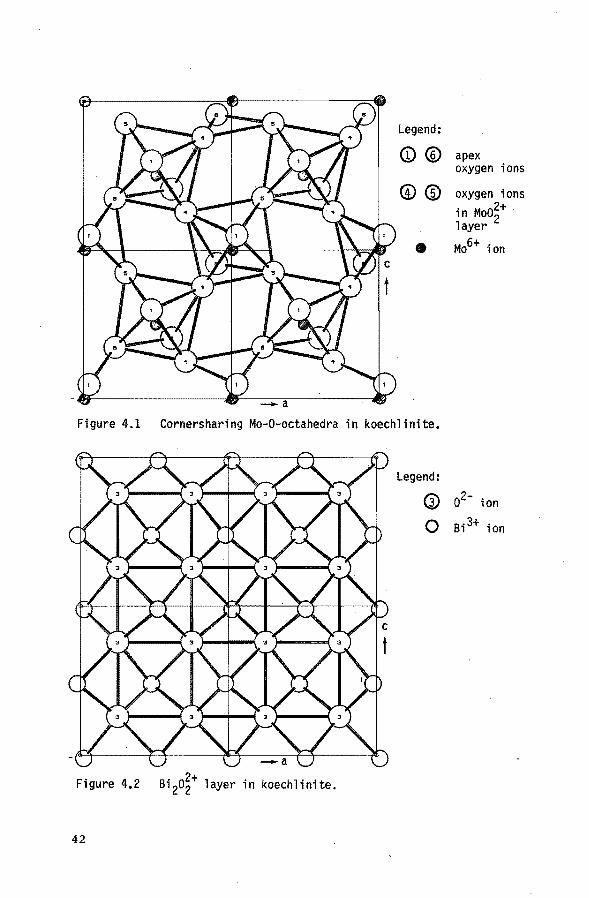
10-10 m). The structure was described as alternating
layers of (Bio);n and (Moo 42->n perpendicular to the y
direction. In figure 4.1 and figure 4.2 the corner sha
ring Me-octahedra and the Bi2o2-layer are shown respec
tively. These figures are based on van den Elzen's data (15).
The (MoO~-)n layer consists of Mo6+ ions in octahe
dral surrounding, the octahedra sharing corners in the
sheets and their apices point toward the (Bio);n layers.
The (Bio);n layers resemble the structure of BiOCl. In
Koechlinite the bond distances in the molybdenuro~xygen sheets are as follows: two at 1.76 10-10 m and two at
2.24 10-10 m. The molybdenum-oxygen bonds to the apex
41
Legend:
<D® apex oxygen ions
®® oxygen ions in Moo~+ layer
• Mo6+ ion
Figure 4.1 Cornersharing Mo-O-octahedra in koechlinite.
Figure 4,2 Bi 2o~+ layer in koechlinite.
42
Legend:
G) o2- ion
0 Bi 3+ ion
o 2- ions have intermediate lengths: 1.86 10""10 and 1.93
10""10 m. The bismuth ion is bonded to six oxygen ions:
the four Bi-0 distances in the BiO-layer range from 2.15
to 2.50 10-10 m. The distances to the apical oxygens of the Mo octahedra are 2.33 and 2.67 10-10 m. As pointed
out by Schuit (16) the structure of the y-bismuth molyb..,
date can therefore be regarded as an intermediate be
tween one having a two dimensional Reo3 .... type of corner
sharing Moo6 octahedra and one having slightly distorted Moo 4 tetrahedra.
The y-phase is metastable and at temperature.s above
930 K it can be transformed to the y'~hase .with a te~ tragonal structure, reported by Blasse (17). The melting point is 1211 K (7), the density is 8.26 ~0 3 kg m~ 3 (6).
The catalytic activity of bismuth molybdate has been
connected by Schuit et al (4) with the presence of cornersharing oxo-molybdenum octahedra and it has been postulated that the active site for adsorption of pro..,.
pene is an oxygen anion vacancy on a mo~ybdenum ion still being present in a tetragonally pyramidal configu~
ration.
4.3. Catalyst preparation
y-Bismuth molybdate has been prepared according to the
method described by Batist et al (12), Batist (13) and
Konings et al (18) either starting with molybdic acid
(method A) or with ammonium heptamolybdate (method B). For
all preparations the basic chemicals were analysed care~ fully in order to be sure of the stoichiometry of the
14. Zemann, J., Heidelberger Beitr. Mineral Petrogr. ~~
139 (1956)
15. van den Elzen, A.F., Rieck, G.D., Acta Crystallogr.
Sect. B 29, 2436 (1973)
16. Gates, B.C., Katzer, J.R., Schuit, G.C.A., Chemistry of Catalytic Processes,·. Chapter 4, McGraw Hill,
New York (1979)
17. Blasse, G., J. Inorg. Nucl. Chem. 28, 1124 (1966)
18. Konings, A.J.A., Creemers, H.J.M., Batist, Ph.A., J.
Catal. 41, 333 (1976)
19. van Oeffelen, D.A.G., Thesis, University of Technology,
Eindhoven (1978)
46
CHAPTER 5
EXPERIMENTAL METHODS
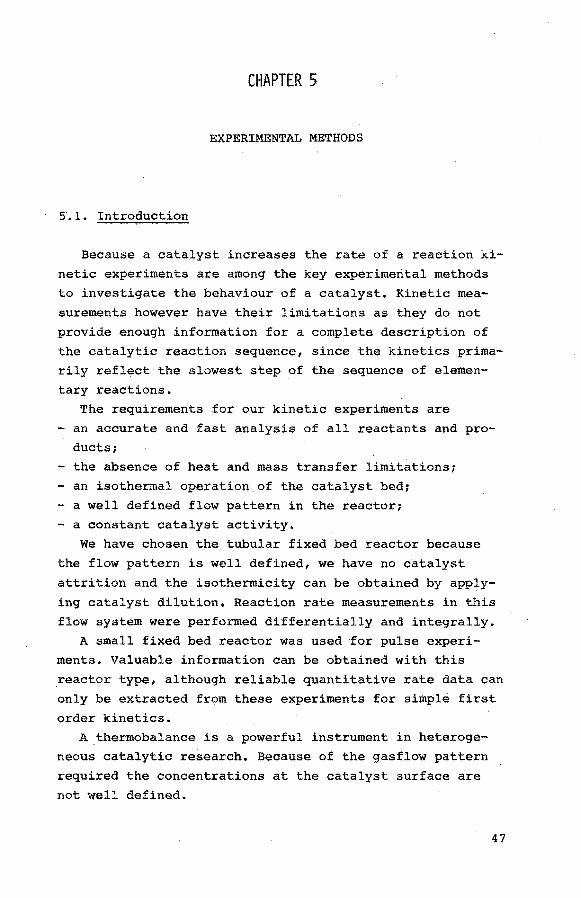
s·.l. Introduction
Because a catalyst increases the rate of a reaction ki
netic experiments are among the key experimental methods
to investigate the behaviour of a catalyst. Kinetic mea
surements however have their limitations as they do not
provide enough information for a complete description of
the catalytic reaction sequence, since the kinetics prima
rily reflect the slowest step of the sequence of elemen
tary reactions.
The requirements for our kinetic experiments are
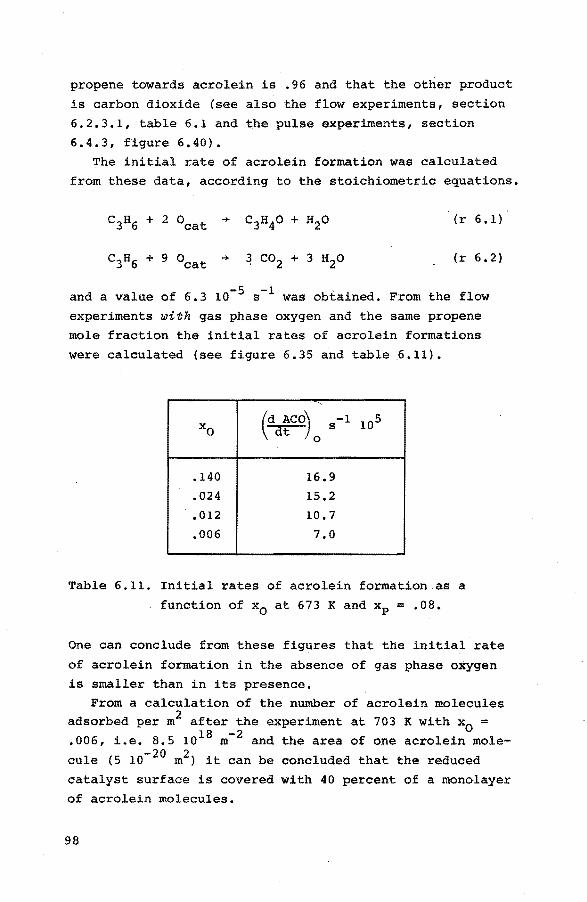
- an accurate and fast analysis of all reactants and pro-
ducts;
- the absence of heat and mass transfer limitations;
- an isothermal operation of the catalyst bed;
- a well defined flow pattern in the reactor;
- a constant catalyst activity.
We have chosen the tubular fixed bed reactor because
the flow pattern is well defined, we have no catalyst
attrition and the isothermicity can be obtained by apply
ing catalyst dilution. Reaction rate measurements in this
flow system were performed differentially and integrally.
A small fixed bed reactor was used ·for pulse experi
ments. Valuable information can be obtained with this
reactor type, although reliable quantitative rate data can
only be extracted from these experiments for simple first
order kinetics.
A thermobalance is a powerful instrument in heteroge
neous catalytic research. Because of the gasflow pattern
required the concentrations at the catalyst surface are
not well defined.
47
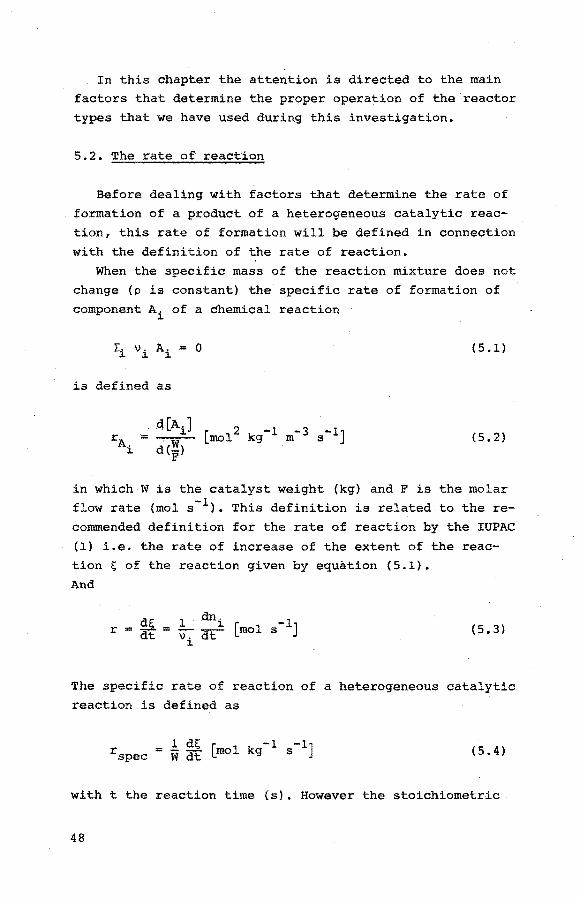
In this chapter the attention is directed to the main factors that determine the proper operation of the reactor
types that we have used during this investigation.
5.2. The rate of reaction
Before dealing with factors that determine the rate of formation of a product of a heterogeneous catalytic reac
tion, this rate of formation will be defined in connection
with the definition of the rate of reaction.
When the specific mass of the reaction mixture does not change (p is constant) the specific rate of formation of
component Ai of a Chemical reaction
(5.1)
is defined as
(5.2)
in which W is the catalyst weight (kg) and F is the molar flow rate {mol s-1 ). This. definition is related to there
commended definition for the rate of reaction by the IUPAC
(1) i.e. the rate of increase of the extent of the reaction~ of the reaction given by equation (5.1).
And
(5.3)
The specific rate of reaction of a heterogeneous catalytic reaction is defined as
(5.4)
with t the reaction time (s). However the stoichiometric
48
coefficients of an overall reaction are not defined unam
biguously like the coefficients -of an .elementary reaction
and therefore ~ and the rate of a non-elementary reaction
are not exactly defined either. For that reason we prefer
the definition of the rate of formation as given in equation (5.2) which can be calculated from measured data i.e.
the concentration, the amount of catalyst and the molar flow rate.
Note: The dimension of the rate of formation, [mol2 kg-1
m- 3 s-1], seems very complicated. If we would sub
stitute for W (kg catalyst) the number of active
sites, expressed in moles Ncr, then our reaction time
would have the dimension (S) again and the specific
rate of formation would revert to its normal dimen
sion [r] = [mol m- 3 s-1]. As the determination of Ncr
is not yet unambiguous we prefer the somewhat cum
bersome but straightforward quantity as defined in
the text. We will often use the terms "rate of for
mation" and "rate of consumption" instead of "spe
cific rate of formation" and "specific rate of con
sumption".
5. 3. Factors ·govern~n·g the re·a:ctor beha:Yiour
The interpretation of the kinetic results is very much
facilitated if the fluid flow in the reactor can be consi
dered to be an ideal plug flow and if the kinetic data are
obtained in a chemically controlled regime under isother
mal conditions •
.5. 3 .1. Plug flow
Danckwerts (2) pointed out that if the P~clet-number
for mass transport in axial direction based on the reactor
length
PemaL = iiL > 60 e:Da (5.5)
49
than the flow pattern will approach ideal plug flow. In
our fixed bed reactors the particle Reynolds number Redp is small and varies from .1 to 1.2. Edwards and Richardson
(3) have shown that at low Redp-values the axial disper
sion is only caused by molecular diffusion, thus Da = Dmol" The Peclet-number based on the particle diameter is
(5.6)
From the correlation given by equation (5.6) we calculate
the value of Pemadp in the order of .5. This means that at low Reynolds-numbers where equation (5.6) holds, it can be
deduced from equation (5.5) that axial mixing can be ne
glected if ~ > 120. This value is in line with the value p
of 100 calculated by Carberry and Wendel (4) for both an adiabatic and a fixed bed reactor based on an one dimen
sional model for a first order reac'tion and with the value
of 150 suggested by Finlayson (5) which is a more conser
vative value because the significance of axial heat trans
fer is taken into account. Mears (6) derived for non-first
order kinetics a plug flow criterion
:k...> d p
20 n Co ln Pemadp
(5.7)
with n is the order of the reaction and C0
and Ce are the
inlet and outlet concentrations respectively. This crite
rion shows that axial dispersion becomes more severe with increasing conversion and increasing order of the reaction.
Radial temperature gradients as a result of an exothermic
reaction are attended by radial dispersion, which further
improves the flow pattern in the direction of plug flow.
This improved flow pattern is known as the Taylor dispersion (7). During our experiments in the flow reactors the condition L/dp > 120 generally was satisfied. Measurements with respect to the residence time distribu
tion in the pulse reactor showed that even in that small
reactor the axial dispersion was almost absent.
50
Cpanneling and maldistribution in small reactors be
cause of wall effects can be dominant. Schwartz and Smith
(8) and Schertz and Bischoff (9) reported for reactor dia
meter to particle diameter D/dp ratios < 10 that point
velocities one particle diameter from the wall were 2 to
10 times as high as at the center line. A radial tempera
ture gradient as a result of an exothermic reaction gives
the highest figures bec~use of the corresponding radial
viscosity gradient. Carberry (10) and Bamford and Tipper
(11) recommend D/dp values > 10 for laboratory reactors.
5 •. 3. 2. Temperature 51radients
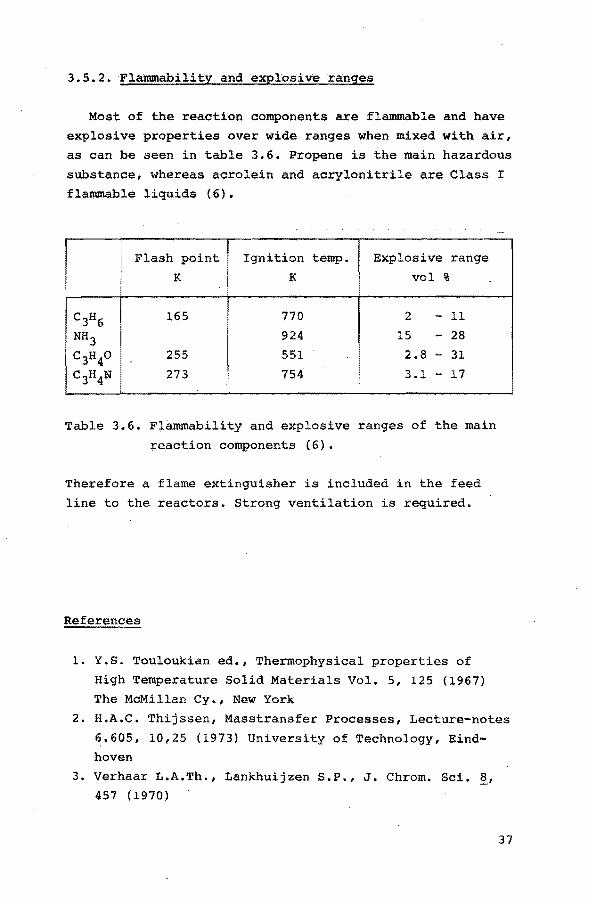
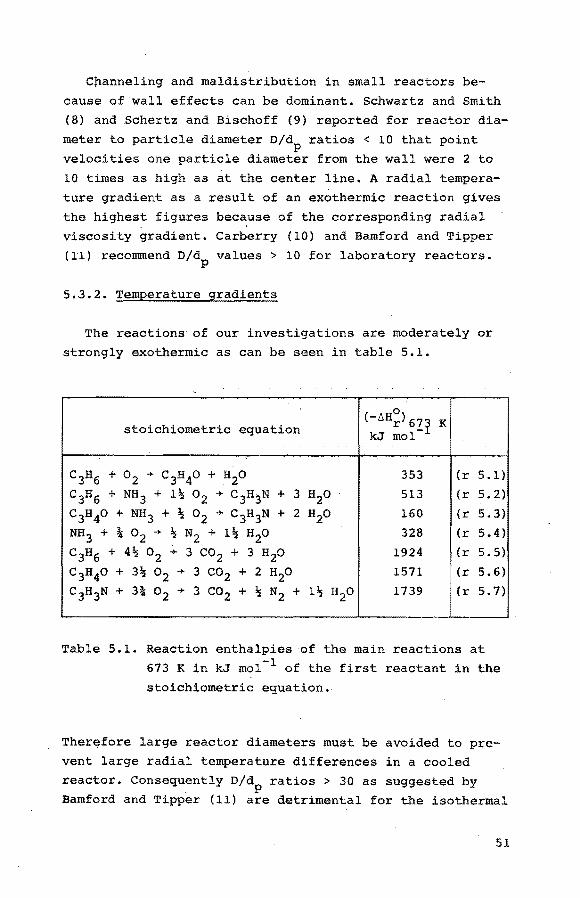
The reactions of our investigations are moderately or
Table 5.1. Reaction enthalpies of the main reactions at
673 K in kJ mol-l of the first reactant in the
stoichiometric equation.
Therefore large reactor diameters must be avoided to pre
vent large radial temperature differences in a cooled
reactor. Consequently D/d ratios > 30 as suggested by ' p
Bamford and Tipper (11) are detrimental for the isothermal
51
behaviour of the fixed bed reactor. Because the enthalpies
of the various reactions are different the heat produced
at comparable conditions depends strongly on the integral selectivity of the reaction concerned and on the overall
reaction rate. From the experimental data we calculated at
a reactant inlet concentration of 1 mol m- 3 for the ammoxi
dation of propene at 673 K an initial heat production of
1.1 kJ kg- 1 s- 1 and for the amrnoxidation of acrolein 5,5 -1 -1 kJ kg s • This heat production at stationary conditions
causes the occurrence of temperature gradients, which can be divided in three types i.e.
- an intraparticle gradient within the catalyst particle;
- an interphase temperature difference between the exter-
nal surface of the particle and the adjacent gas;
- an interparticle temperature difference between the ca-
talyst particles.
According to Mears (12) the interparticle gradient has the
greatest heat transport resistance, followed by the inter
phase and the intraparticle gradients. During our experi
ments the intraparticle gradient is absent, as was calcu
lated for the ammoxidation of propene by means of Ander~
son's criterion (13). This criterion requires
< 3 RT Ea
(5.8)
for a deviation from the isothermal rate less than 5%. (~Hr) is the absolute value of the reaction enthalpy, r is
the observed rate of reaction, AP is the thermal conducti
vity of the particle and Ea is the activation enthalpy of the reaction. This criterion is amply satisfied, even for
the total oxidation reactions. The criterion for the onset
of an interphase heat transport limitation, given by Mears . ( 12) is
(5.9)
52
with h is the gas-solid heat transfer coefficient. During
our experiment this criterion is easily met and thus in
terphase heat transfer is not influencing the experimen
tal results.
The conditions in our fixed bed reactors make that in
terparticle heat transport limitations can be present. As
the axial heat transport in laboratory reactors is small
compared with the radial transport, both the effective
radial thermal conductivity {Aer) and the heat transfer at the reactor wall (aw) are important parameters. According to de Wasch and Froment (14) who derived a model for ra•
dial heat traasfer with these two parameters, ~ and A w er depend on the Reynolds number and on the D/dp ratio. It will be clear that low Re-values and large bed diameters
cause radial temperature differences in integral fixed bed
reactors. Isothermicity is favoured by catalyst dilution
with inert solids that have a good thermal conductivity
and by small reactor diameters.
5.3.3. Catalyst dilution
By means of dilution of the catalyst with inert parti
cles isothermal conditions can be obtained in integral
reactors. Caldwell and Calderbank (15) described strate
gies for optimizing reactor performance by varying the
dilution ratio with axial distance. They used a dilution
ratio which decreased linearly with conversion. Mears (6)
argues that dilution is advantageous in minimizing radial
temperature gradients only if the reactor operates at
Reynolds numbers sufficiently low, for the effective ther
mal conductivity to be relatively insensitive to the mass velocity.
The influence of catalyst dilution may be of a chemical
or a physical nature. The influence of a diluting material
on the kinetics of a catalytic reaction have been esta
blished by Mosely and Good (16) and by Nix and Weisz (17).
Dilution can further have an effect on the residence
time distribution (with respect to the catalyst) and on
53
the temperature distribution. Bypassing at a high dilu
tion ratio gives a lower conversion. If the dilution and
the catalyst particles have different particle size dis
tributions the bed void fraction is influenced. Van den Bleek et al (18) developed a stochastic model that descri
bes the influence of the bypassing effects on conversion.
Their criterion to determine the allowable degree of dilu
tion
L b -d > 250 7 p v
(5.10)
where b is the volumetric dilution ratio and o is the relative experimental error in the conversion, ensures that
the bypassing effect will be an order-of-magnitude smaller
than o. This model has the drawback not to distinguish between reactions that are influenced by diffusion limita
tions and reactions that are not.
During our experiments with the ammoxidation of acro
lein we found some dilution effect i.e. a decrease of the
conversion at higher dilution ratios, whereas with the
oxidation and ammoxidation of propene this phenomenom was not observed. This difference could be explained if we
considered the diffusion limitation of the reaction rate of the acrolein ammoxidation. In this case van den Bleek's
dilution criterion appeared to be insensitive.
5.3.4. Mass and heat transfer
An estimate of the mass and heat transfer coefficients
is required to decide whether external transport limitations influence the chemical reaction rate. The mass and
heat transfer coefficients kg and h are based on the film··
theory with the assumption that mass and heat transfer are caused by diffusion and conduction through a stagnant gas
film around the catalyst particle. As the film thickness depends on the Reynolds number, kg and h are similarly
54
related to Re. The Chilton and Colburn j 0 and jH relations
(19) offer the possibility to determine kg and h.
The following relations are often applied:
Yoshida et al (20) found for .01 < Re < 50
j 0 = .84 Re -.51 (5.11)
whereas Gamson et al (21) correlated jH and j0
(5.12)
For the mass transfer from the bulk to the catalyst sur
face the overall rate of reactions rA is related to the
concentration difference ([A]b-[A]s> of the reactant between the bulk gas phase and the catalyst surface,
according to
r = A (5.13)
in which kg is the mass transfer coefficient (m s-1), Sis the specific surface area of the catalyst (m2 kg-1), tfJ. is
the sphericity factor.
The Chilton and Colburn relation is
(5.14)
in which CfA is the concentration factor (mol m- 3), GM is the superficial molar flow rate (mol m- 2 s-1), pis the
-1 -1 viscosity of the fluid (kg m s ), Pf is the fluid den-sity (kg m~3) and Dmol is the molecular diffusivity of the reactant in the fluid (m2 s-1). As we know the j 0-value
from equation (5.11) kg can be calculated from equation
(5.14) and after substitution in equation (5.13)
C[A]b-[A]8
) is found. For the ammoxidation of propene we calculated at the most favourable conditions for mass
transfer limitation a concentration difference for propene between the bulk gas phase and the catalyst of 2.38 10-2
55
-3 mol m , which is 1.8% of the applied propene concentra-
tion. We conclude that the mass transfer limitation for
all propene ammoxidation experiments can be neglected. As the ammoxidation of acrolein is a very fast reaction in
comparison with the ammoxidation of propene, mass transfer
limitation of the overall rate can occur. We calculated
again at favourable conditions for mass transfer limitation an acrolein concentration difference of 1.16 10-1 mol
m- 3 which was 15% of the applied concentration of acrolein.
In a similar way the temperature differenc.e between the
catalyst surface and the bulk gas phase can be calculated,
using the following equations:
(5.15)
in which h is the heat transfer coefficient (J m- 2 s-1 K-1)
and (Ts-Tb) is the temperature difference (K) and .. the Chilton and ·Colburn relation for heat transfer
(5.16)
in which c is the heat capacity at constant pressure (J kg-1 K-~), Af is the thermal conductivity (J m- 1 s-1
K- 1 ) and us is the superficial velocity (m s-1) of the
fluid. jH is calculated from the equations (5.11) and
(5.12) and substituted in equation (5.16) whereas (Ts-Tb) is found from equation (5.15) after substitution of h.
For the flow reactor experiments at the most unfavourable conditions for heat transfer we calculated a temperature
difference between the catalyst surface and the gas.phase
of .15 K. Because the temperature measurements in a pulse reactor are less accurate than in a differential flow
reactor we have calcul~ted the temperature difference between the catalyst surface and the gas phase during the
pulse and found (Ts-Tb) to below .06 K. For the thermobalance we calculated in a similar way a temperature difference at the steady state below .04 K. We conclude that
56
the temperature measurements of the gas phase represent
very well the temperature at the catalyst surface,
A quantitative approach to the intraparticle heat and
mass transfer has been defined according to Thiele (22) in
terms of an effectiveness factor n, the ratio of the observed rate to the rate that would exist if all the cata
lyst surface were equally accessible~ The calculation of n
according to Weisz and Hicks (23) has shown that in all cases this. parameter has a value very close to one. This
has been verified experimentally with catalyst particles
of different sizes.
5. 3. 5. Pr·essu:re drop
According to Ergun (24) the pressure drop over a fixed
bed depends on the particle diameter d , the void fraction . p e, the viscosity of the fluid p and the mass velocity G. As we carried out the experiment at atmospheric pressure
the measurements at differential conditions (high mass
velocities) could give appreciable pressure differences.
However at the maximum attainable mass velocity in flow reactor B a pressure drop over the reactor of 8.10- 3 bar
was found, whereas in the other flow reactors this diffe
rence was smaller. We conclude that the influence of the
pressure variation on the rate of reaction can be neglected.
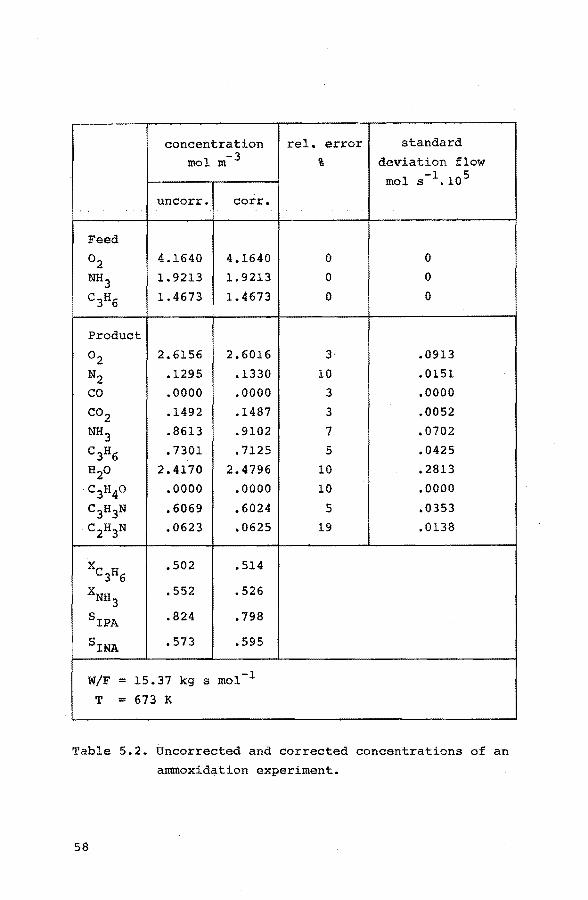
5. 4. Data: handling' a:nd a:na'lysis of errors
The analytical data obtained by means of GLC can easily
be converted to concentrations. From these values quanti
ties as conversion, space time and selectivities are cal
culated. As a complete analysis was carried out we used the additional information of the atombalances to improve the experimental data, according to the method given by
van der Grinten (25) and swenker (26). The results of the
raw concentration calculations are used in the adjustment
computing program. If the experimental errors are normally
57
concentration rel. error standard
mol m- 3 % deviation flow -1 5 mol s ,10
uncorr. corr,
Feed
02 4.1640 4.1640 0 0
NH3 1.9213 1.9213 0 0
C3H6 1.4673 1.4673 0 0
Product
02 2.6156 2.6016 3 .0913
N2 .1295 .1330 10 .0151
co .0000 .0000 3 .0000
C02 .1492 .1487 3 .0052
NH 3 .8613 .9102 7 .0702
C3H6 .7301 • 7125 5 .0425
H2o 2.4170 2. 4796 10 .2813
·C3H4o .0000 .0000 10 .0000
C3H3N .6069 .6024 5 .0353
c2H3N ,0623 ,0625 19 .0138
X C3H6
.502 .514
XNH .552 .526 3
5 IPA .824 .798
5 INA .573 .595
W/F = 15.37 kg s mol-l
T = 673 K
Table 5.2. Uncorrected and corrected concentrations of an
ammoxidation experiment.
58
distributed the most probable value of the experimental
error can be calculated by means of a minimalisation of
the sum of squares of deviations. The problem of the non
constant error vari.ance was solved by the use of appro
priate weight factors, calculated from independent esti
mates of the experimental error variances as a function of
experimental data, In this way the corrected concentrations
of all components could be calculated and plotted as a
function of space time. An example of raw and corrected
data is given in table 5.2. The constants of the kinetic equations were calculated by linearization of the equation
or by means of the Newton Raphson iteration method. The
difference between the experimental and model values were
minimalized with the procedure Minifun (27).
References
1. Manual of Symbols and Terminology for physico chemical
Quantities and Units, Appendix II, Part II, Hetero
Figure 6.11 Ammonia concentration as a funcHon of space time W/F (kg s mol ). Ammoxidation of acrolein.
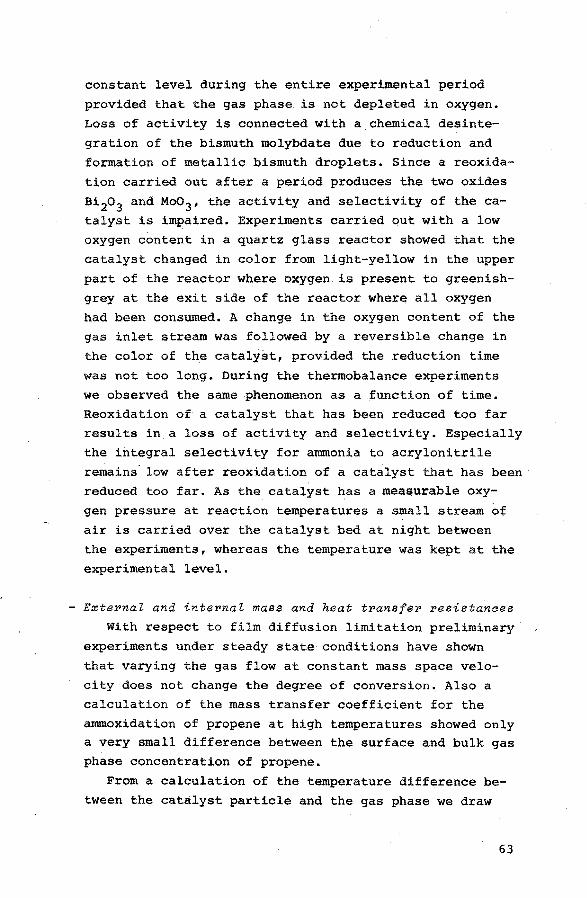
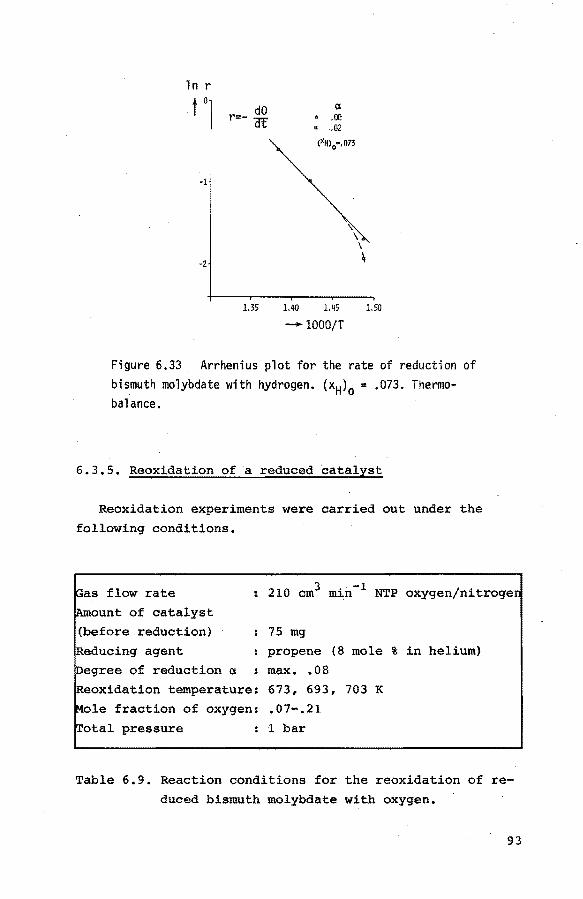
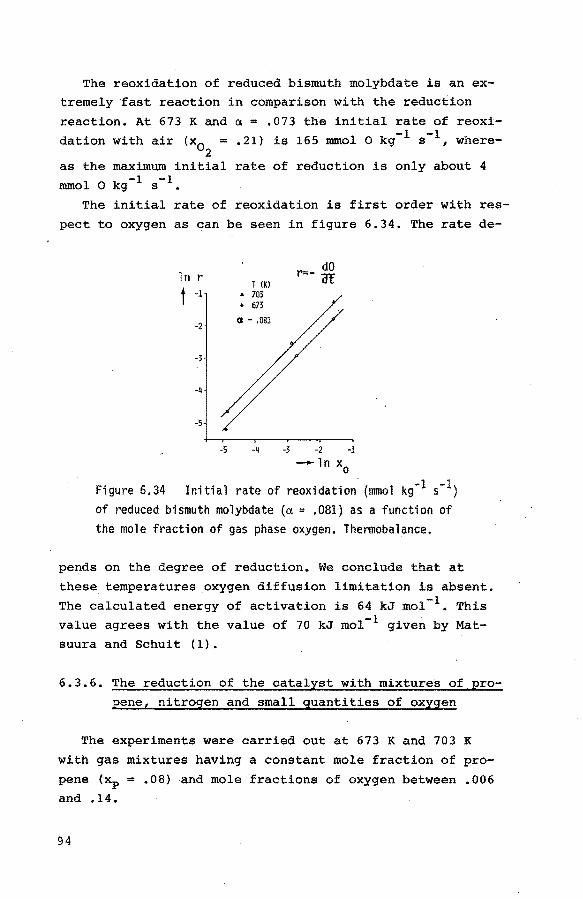
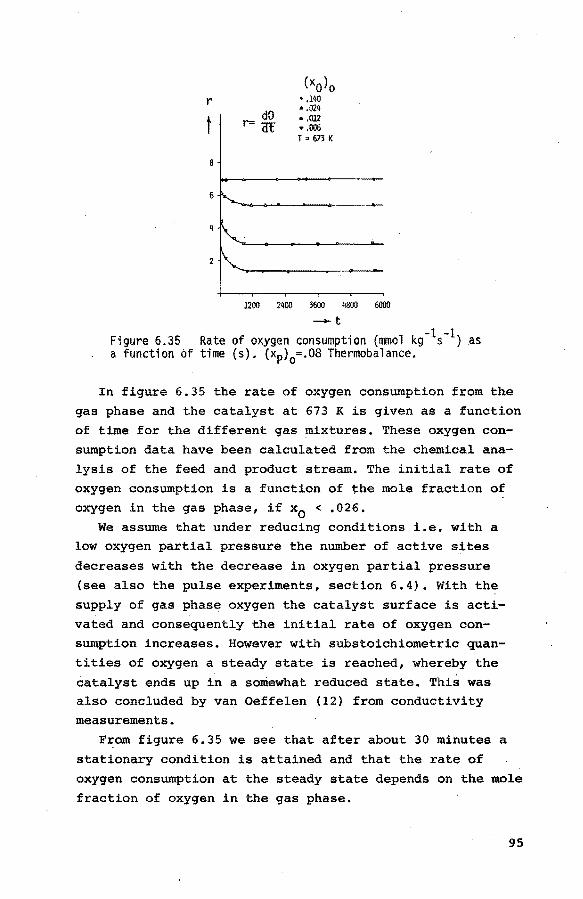
rate of reaction is zero order with respect to oxygen as
well as to ammonia.
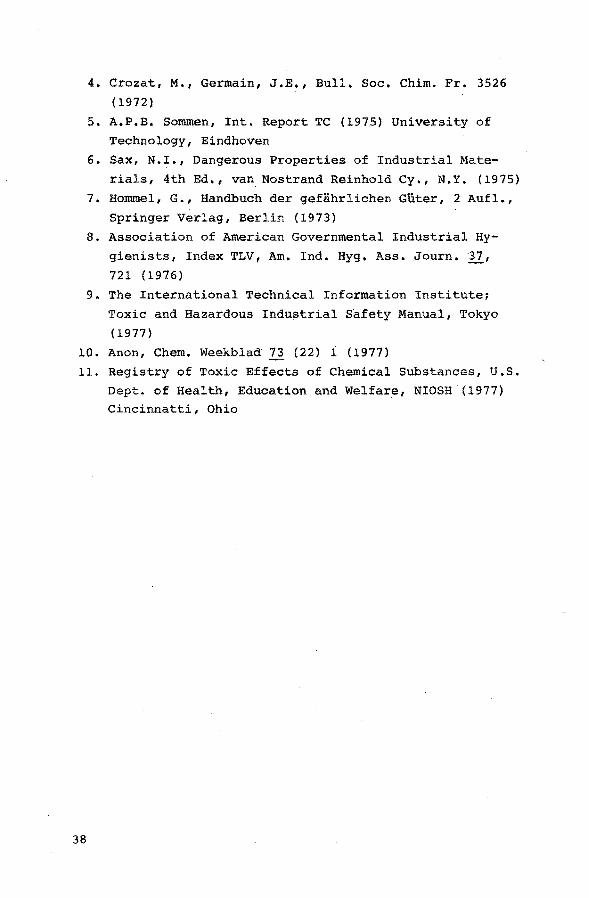
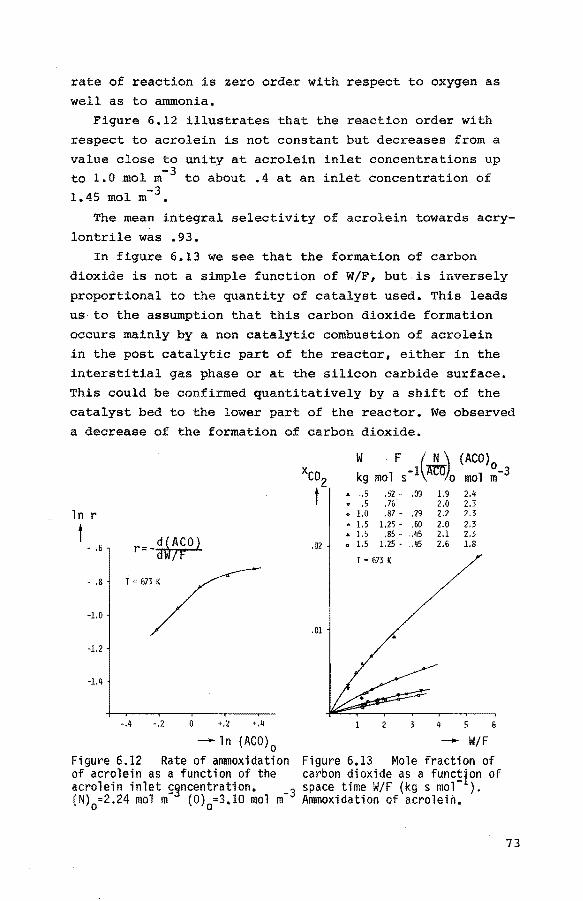
Figure 6.12 illustrates that the reaction order with
respect to acrolein is not constant but decreases from a
value close to unity at acrolein inlet concentrations up to 1.0 mol m- 3 to about .4 at an inlet concentration of
-3 1,45 mol m •
The mean integral selectivity of acrolein towards acry
lontrile was .93.
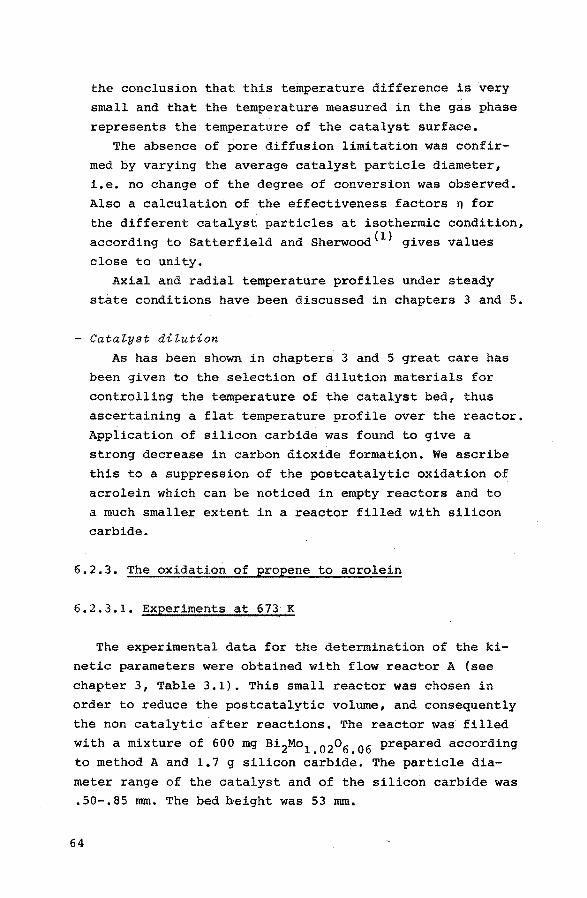
In figure 6,13 we see that the formation of carbon
dioxide is not a simple function of W/F, but is inversely
proportional to the quantity of catalyst used. This leads
us to the assumption that this carbon dioxide formation
occurs mainly by a non catalytic combustion of acrolein
in the post catalytic part of the reactor, either in the
interstitial gas phase or at the silicon carbide surface.
This could be confirmed quantitatively by a shift of the
catalyst bed to the lower part of the reactor. We observed
a decrease of the formation of carbon dioxide.
xco 2
W . F ( N ~ (AC0)0 kg mol s-1 XCU'o mol m-3
t A .. 5 .52 .09 1.9 2.4 9 .5 .76 2.0 2.3
ln r • 1.0 .87 .29 2.2 2.3
- .6
• 1.5 1.25 .60 2.0 2.3 • 1.5 .85 .45 2.1 2.3
.02 • 1.5 1.25 - .. 45 2.6 1.8 t T = 673K
- .8 T 673K
-1.0
.01
-1.2
-1.4
-.4 -.2 +,2 +,4 2 3 4 6
___,..ln (AC0)0
- W/F Figure 6.12 Rate of ammoxidation Figure 6,13 Mole fraction of of acrolein as a function of the carbon dioxide as a function of acrolein inlet s~ncentration, _3 space time W/F (kg s mol- ). (N)
0=2.24 mol m (0)
0=3.10 mol m Ammoxidation of acrolein.
73
As compared to the ammoxidation of propene the formation
of nitrogen is now notably suppressed. The integral selec
tivity of ammonia towards nitrogen is .09-.32 at inlet
molar ratios of ammonia to acrolein of 1.3-3.7 mol mol-1 •
For the propene ammoxidation the integral ammonia selecti
vity towards nitrogen is at comparable conditions .60-.75
(see figure 6.24).
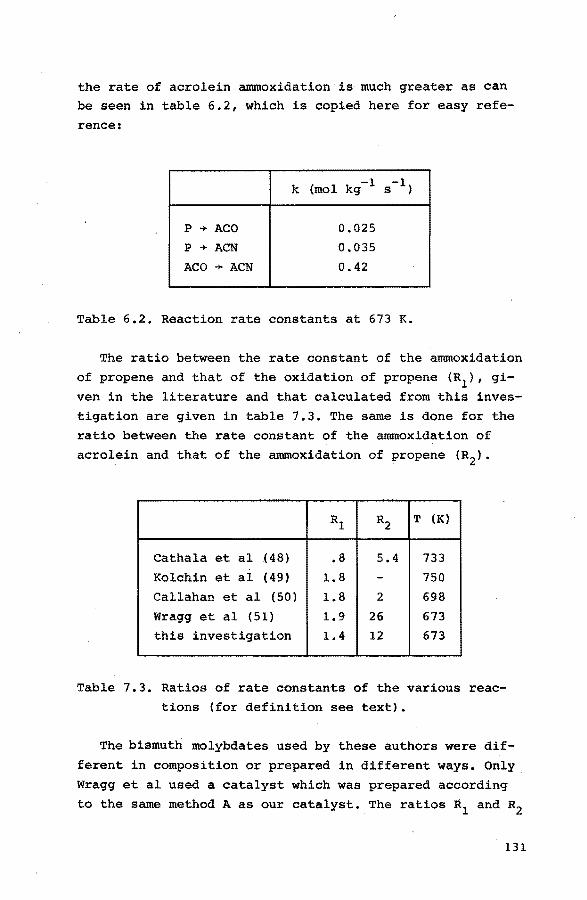
6.2.6. The ammoxidation of propene to acrylonitrile
6.2.6.1. Introduction and preliminary experiments
All reactions investigated in the preceding sections
appear to some extent during the ammoxidation of propene.
However for a selective catalyst it is expected that it
will not accelerate
- the parallel oxidation reactions of propene and ammonia
to acrolein, carbon dioxide, nitrogen and other oxida
tion products7 - the consecutive oxidation of acrylonitrile and acrolein
to carbon dioxide and other oxidation products.
It will be clear from the foregoing that besides the
main products acrylonitrile and water we will have a num
ber of byproducts. Of these nitrogen, carbon dioxide,
acetonitrile, carbon monoxide, acrolein and acetaldehyde
are of significance and generally found in modest quanti
ties in the reaction mixtures. At high conversions also
small quantities of ethene and of hydrogen cyanide have
been detected.
During the oxidation of propene the catalyst remains
active and selective for long periods of time, provided
gas phase oxygen is present. We calculated that more than
10 4 mol propene per kg catalyst were converted without
loss of activity and selectivity.
Preliminary experiments with water vapour in the feed
did not show a significant improvement of the integral
selectivity of propene towards acrylonitrile. As regards ammonia we observed some improvement of its integral se-
74
lectivity towards acrylonitrile. This means that water has
some inhibiting influence on the oxidation of ammonia to
nitrogen. However as we already operate with a feed con
sisting of four components i.e. the reactants and helium,
we decided not to add water vapour as a fifth one because
of the increasing intricacy of the flow control and hand
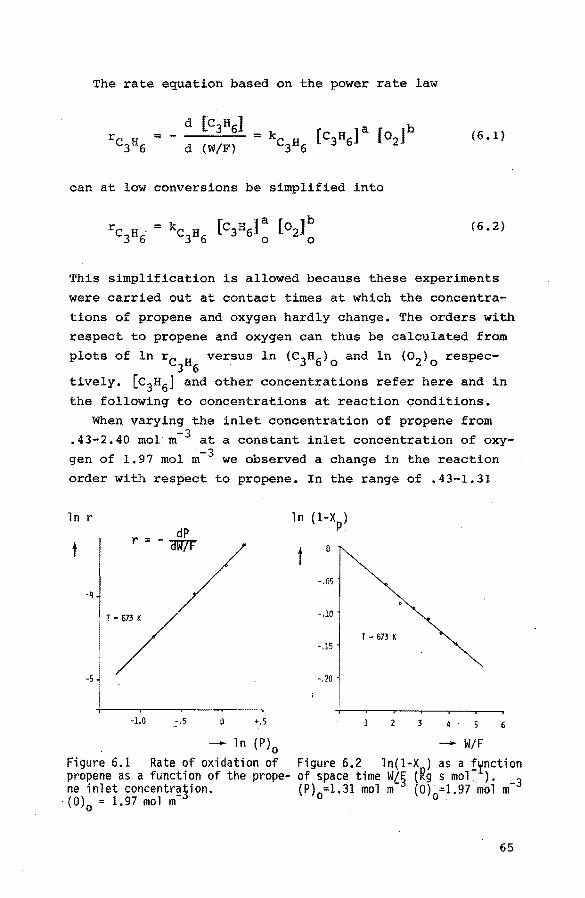
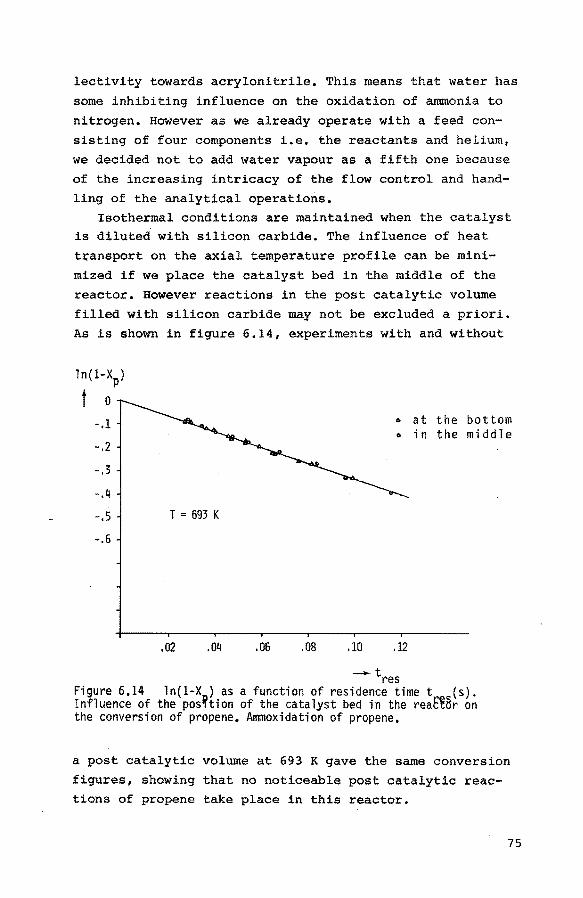
ling of the analytical operations. Isothermal conditions are maintained when the catalyst
is diluted with silicon carbide. The influence of heat
transport on the axial temperature profile can be mini
mized if we place the catalyst bed in the middle of the
reactor. However reactions in the post catalytic volume
filled with silicon carbide may not be excluded a priori.
As is shown in figure 6.14, experiments with and without
ln(l-Xp)
t 0
-.1 .,. at the bottom o in the middle
-.2
-.3
-.4
-.5 T = 693 K
-.6
.02 .OLJ .06 .08 .10 .12
-tres Figure 6.14 ln(l-X ) as a function of residence timet (s). Influence of the pos~tion of the catalyst bed in the reattBr on the conversion of propene. Ammoxidation of propene.
a post catalytic volume at 693 K gave the same conversion
figures, showing that no noticeable post catalytic reac
tions of propene take place in this reactor.
75
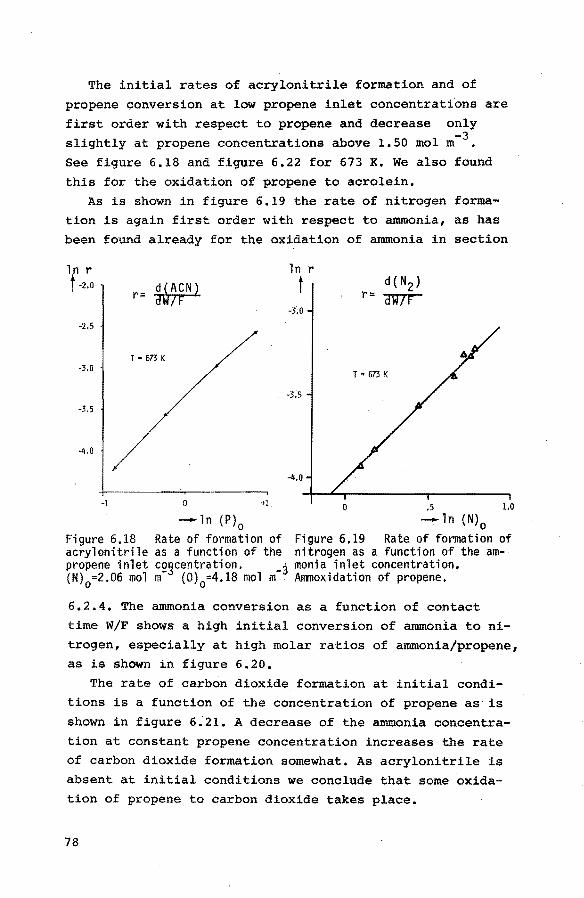
6.2.6.2. Experiments at 673 K
The experimental data were obtained with flow reactor
B (see chapter 3, table 3.1). The reaction conditions are
summarized in table 6.3.
[c3H6] .43 - 2.47 mol m -3
0 -3 (NH31 .78- 2.70 mol m
0 -3 [02] 2.58 - 4.51 mol m
0 -1 [c3H6/NH3] .21 - 2.05 mol mol 0
Pressure 1.0 bar
W/F 2.4 - 32.4 kg s mol -1
Table 6.3. Reaction conditions for the ammoxidation of
propene in flow reactor B at 673 K.
The catalysts prepared according to method A and B (see
chapter 4, section 4.3) did not show a difference in ac
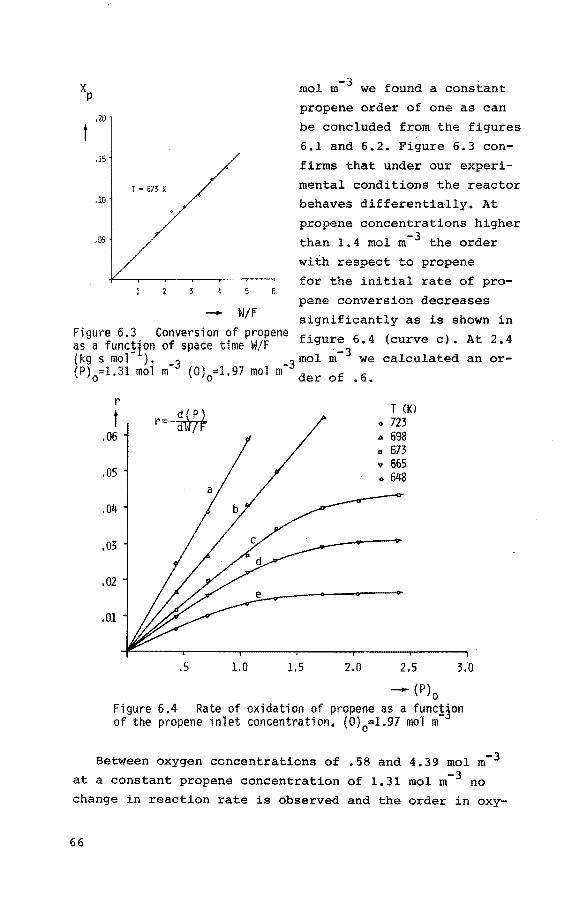
tivity and selectivity. The product concentrations as a
function of the contact time W/F, which are shown in fi
gure 6.15, are representative for the kinetic experiments
of the propene ammoxidation at 673 K.
The initial rate of reaction is zero order with respect to oxygen, provided the oxygen is present in stoichiometric
excess (see figure 6.16). This also holds for the oxida
tion of propene and ammonia and for the ammoxidation of
acrolein, as is illustrated in section 6.2.3 to 6.2.5.
With respect to ammonia we observed a small decrease of
the rate of reaction at increasing ammonia concentrations.
For the rate of propene conversion we calculated an ammo
nia order of -.08 to -.14 at inlet propene concentrations
of .78-2.33 mol m- 3 • This is shown in figure 6.17. The
same influence of the ammonia concentration is found for the rate of acrylonitrile formation.
76
(C)
p.o
10 20
• C3H6 a NH3
A C-jl~ v 0)2 o N2 o c2H3N
T = 673 K
30 40 -W/F
{C02) (C)
.·4ot .2ot
.36 .18
.32 .16
.28 .14
.24 .12
.20 .10
.16 .08
.12 .06
.08 .04
.04 .02
Figure 6.15 Concentration~ 1of reactants_and products as a function of space time WL~ (kg s mol ). Ammoxidat1on of propene. (0) =4.51 mol m -3 o ln r
0 (P}
0mol m
r
f t • .78 ( ) : i:~ r o =- %£f o
T • 673K -2.0
.08
-2.5 .06
-3.0
-3.5 .02 T • 673 K
-4.0 +---~--.----r---r--~
1 .2 .4 .6 .8 1.0
- (0) - ln (N) Figure 6.16 Initial rate 8f am- Figure 6.17 Initial rates of Rmmoxidation of propene as a function moxidation of propene as a function of the oxygen c22centration. _3 of the ammonia i~let concentration. (P)
0=1.49 mol m (N)
0=1.55 mol m {0}
0=4.26 mol m
77
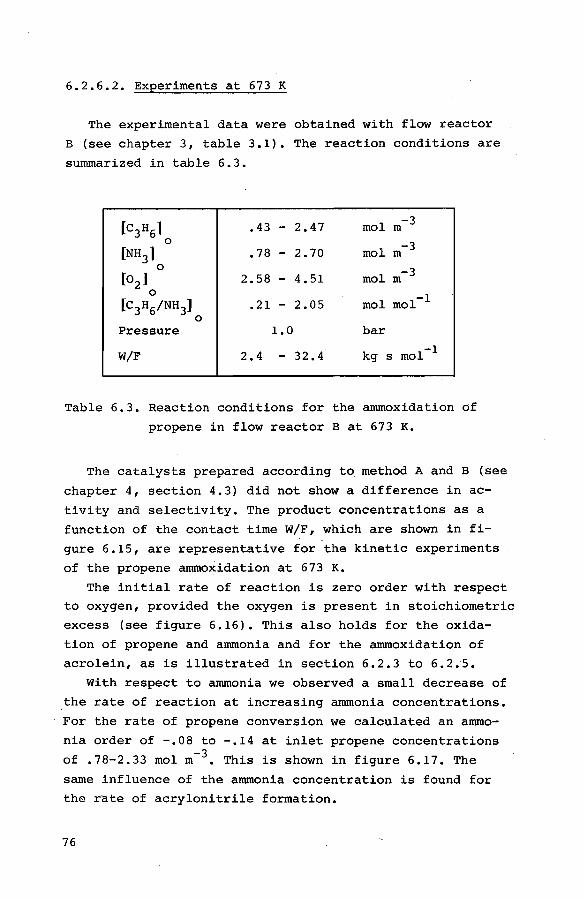
The initial rates of acrylonitrile formation and of
propene conversion at low propene inlet concentrations are
first order with respect to propene and decrease only -3 slightly at propene concentrations above 1.50 mol m
See figure 6.18 and figure 6.22 for 673 K. We also found
this for the oxidation of propene to acrolein.
As is shown in figure 6.19 the rate ofnitrogen forma
tion is again first order with respect to ammonia, as has
been found already for the oxidation of ammonia in section
ln r t ·2.0
-2.5
-3.0
-3.5
-4.0
-1
ln r
r=~ t d{N2) r= ifi17r
-3,0
T=673K
-3.5
-4.0
0 +1. 0 .5 1.0
-ln (P)0
-ln (N)0
Figure 6.18 Rate of formation of Figure 6,19 Rate of formation of acrylonitrile as a function of the nitrogen as a function of the am-propene inlet co~centration. -3 monia inlet concentration. {N)
0=2.06 mol m- (0)
0=4.18 mol m · Ammoxidation of propene.
6,2.4, The ammonia conversion as a function of contact
time W/F shows a high initial conversion of ammonia to ni
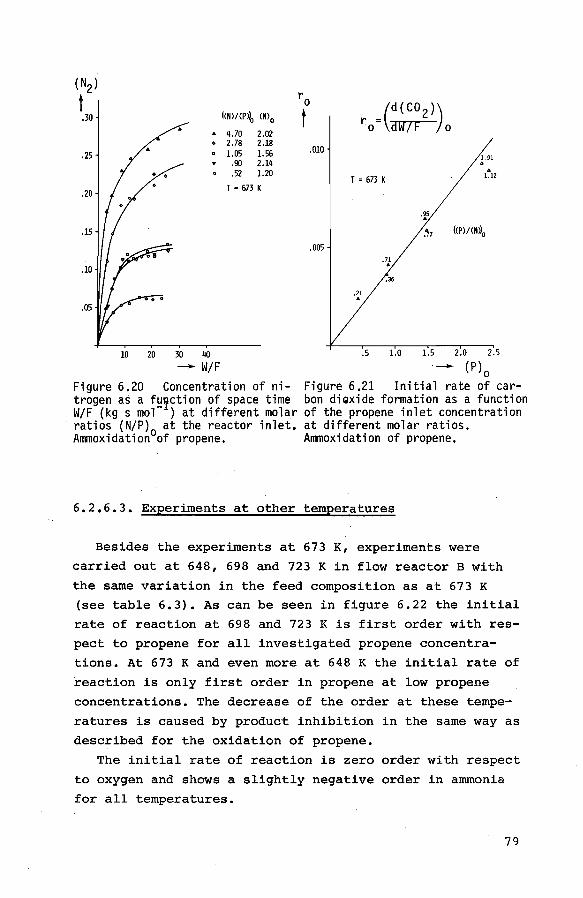
trogen, especially at high molar ratios of ammonia/propene, as is shown in figure 6.20.
The rate of carbon dioxide formation at initial condi
tions is a function of the concentration of propene as is
shown in figure 6.21. A decrease of the ammonia concentra
tion at constant propene concentration increases the rate
of carbon dioxide formation somewhat. As acrylonitrile is
absent at initial conditions we conclude that some oxida
tion of propene to carbon dioxide takes place.
78
(N2) ro t r -C(co2)) .30 (<Nl/(Plb <Nl 0 t . 4.70 2.02
o- dW/F o . 2.78 2.18 .25 a 1.05 1.56 .010
.90 2.14 !.91
.52 1.20 . T = 673K 1.12
.20 T = 673 K
.95 . .15 .''n (<Pl/(N~0
.005 .71
. 10 . .36
.~1
.05
10 20 30 40 .5 1.0 1.5 2.0 2.5
-- W/F -- (P) 0 Figure 6.20 Concentration of ni- Figure 6.21 Initial rate of cartrogen as a fu~ction of space time bon diGxide formation as a function W/F (kg s mol- ) at different molar of the propene inlet concentration ratios {N/P) at the reactor inlet. at different molar ratios. Ammoxidation°of propene. Ammoxidation of propene.
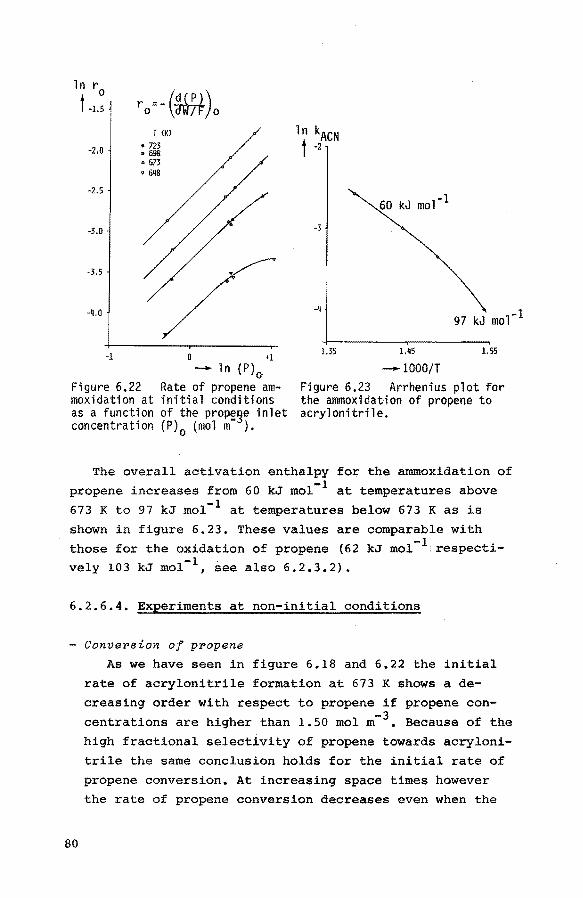
6.2.6.3. Experiments at other temperatures
Besides the experiments at 673 K, experiments were
carried out at 648, 698 and 723 K in flow reactor B with
the same variation in the feed composition as at 673 K (see table 6.3). As can be seen in figure 6.22 the initial
rate of reaction at 698 and 723 K is first order with res
pect to propene for all investigated propene concentra
tions. At 673 K and even more at 648 K the initial rate of
reaction is only first order in propene at low propene
concentrations. The decrease of the order at these tempe
ratures is caused by product inhibition in the same way as
described for the oxidation of propene.
The initial rate of reaction is zero order with respect
to oxygen and shows a slightly negative order in ammonia
for all temperatures.
79
ln r0
t ·1.5
·2.0
·2.5
·3.0
-3.5
-1
T <K)
• 723 • 698 4 673 • 648
0 +1
- ln (P) 0
ln k.ACN t ·2
-3
-4
1.35
97 kJ mol-l
1.45 1.55
-1000/T Figure 6.22 moxidation at as a function concentration
Rate of propene aminitial conditions of the prop~~e inlet (P)
0 (mol m ) •
Figure 6.23 Arrhenius plot for the ammoxidation of propene to acrylonitrile.
The overall activation enthalpy for the arnmoxidation of -1 propene increases from 60 kJ mol at temperatures above
673 K to 97 kJ mol-l at temperatures below 673 K as is
shown in figure 6.23. These values are
those for the oxidation of propene (62 -1 . vely 103 kJ mol , see also 6.2.3.2).
comparable with -1 kJ mol respecti-
6.2.6.4. Experiments at non-initial conditions
- ConvePsion of ppopene
80
As we have seen in figure 6.18 and 6.22 the initial
rate of acrylonitrile formation at 673 K shows a de
creasing order with respect to propene if propene con
centrations are higher than 1.50 mol m- 3 • Because of the
high fractional selectivity of propene towards acryloni
trile the same conclusion holds for the initial rate of
propene conversion. At increasing space times however
the rate of propene conversion decreases even when the
initial rate shows a zero order dependency in propene.
This means that the decrease of the reaction rate at
increasing space times is mainly caused by product inhi
bition.
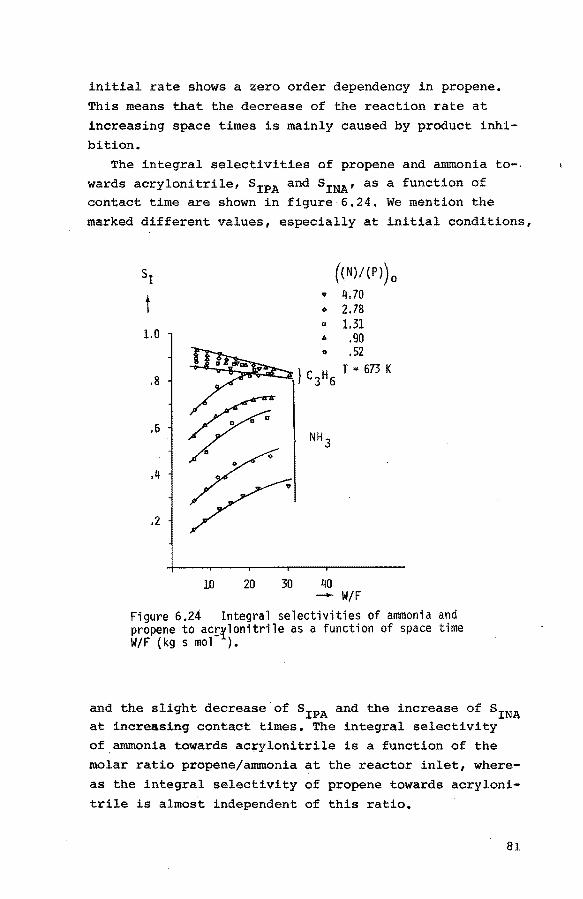
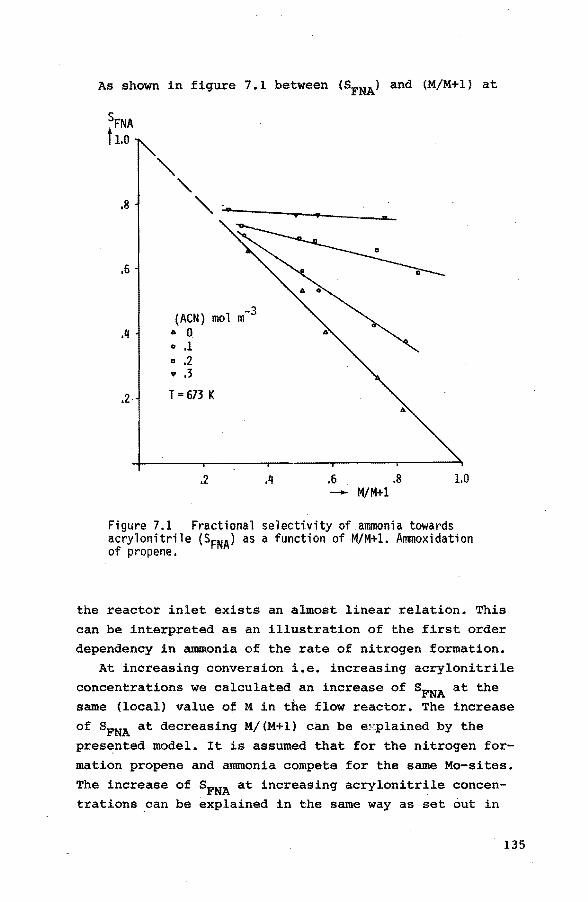
The integral selectivities of propene and ammonia to-.
wards acrylonitrile, SIPA and SINA' as a function of contact time are shown in figure 6.24. We mention the
marked different values, e.specially at initial conditions,
t 1.0
.8
.6
.4
.2
((N)/ (P)) 0
v 4.70 0 2.78 II 1.31 I> .90 0 .52
.,._~~~~ } C H T "' 673 K 3 6
10 20 30 40 - W/F
Figure 6.24 Integral selectivities of ammonia and propene to acrrlonitrile as a function of space time W/F (kg s mol ).
and the slight decrease of SIPA and the increase of SINA at increasing contact times. The integral selectivity
of.ammonia towards acrylonitrile is a function of the
molar ratio propene/ammonia at the reactor inlet, where
as the integral selectivity of propene towards acryloni
trile is almost independent of this ratio.
81
ConvePaion of ammonia and foPmation of nitPogen
As is shown in figure 6.20 the relatively high ini
tial rate of nitrogen formation at 673 K is followed by
a sharp decrease at increasing space times, until an
almost constant conversion level is attained. This level
depends on the molar ratio ammonia/propene. The
strong decrease of the rate of nitrogen formation at
increasing space times points to the inhibition of this
reaction by a product. As can be seen from figure 6.24
the integral selectivity of ammonia towards acryloni
trile increases markedly at increasing space times.
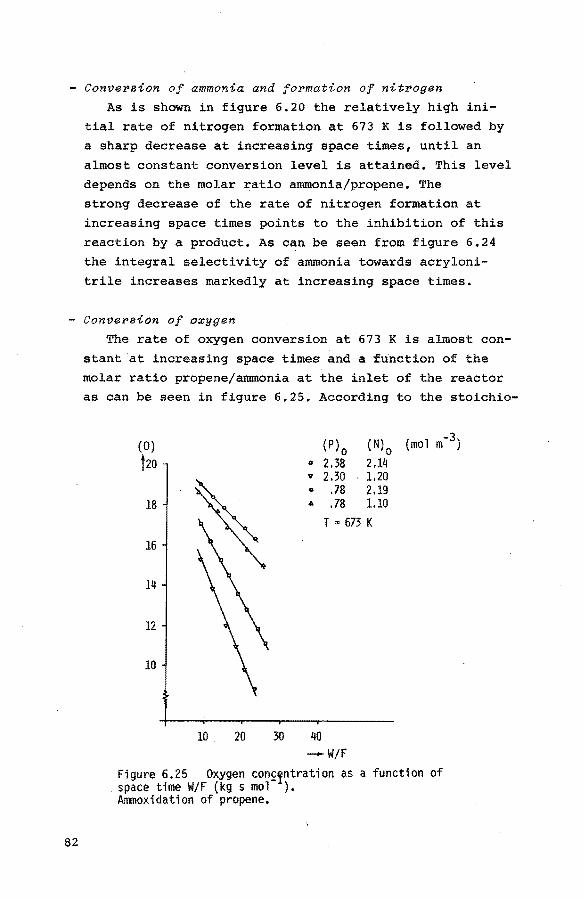
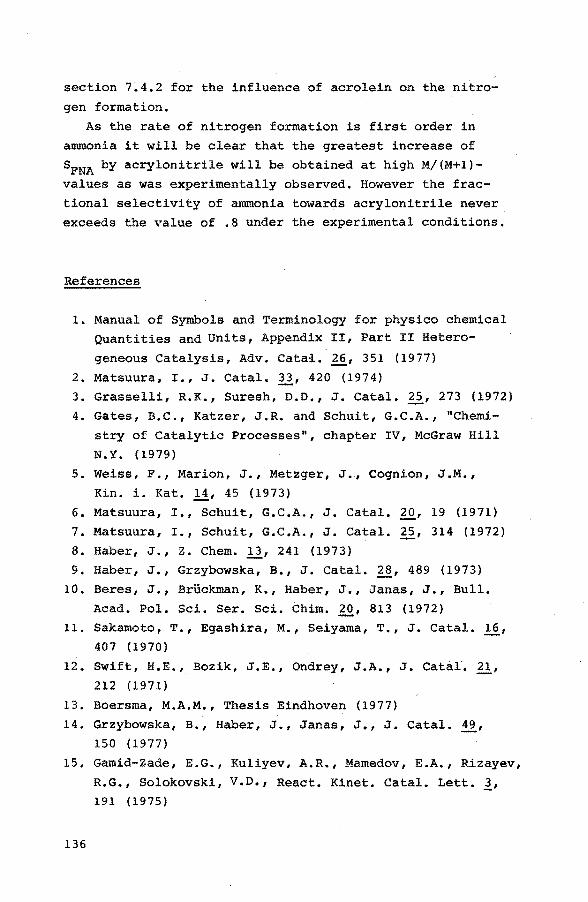
- ConvePaion of oxygen
82
The rate of oxygen conversion at 673 K is almost con
stant at increasing space times and a 'function of the
molar ratio propene/ammonia at the inlet of the reactor
as can be seen in figure 6.25. According to the stoichio-
(0) (P)o ( N} o (mol m-3}
ho D 2,38 2.1q
~ "' 2.30 1.20 0 .78 2.19
18 ... .78 1.10 T = 673 K
16
14
12
10
10. 20 30 40 -w;F
Figure 6.25 Oxygen con~!ntration as a function of space time W/F (kg s mol ). Ammoxidation of propene.
metric equations for the acrylonitrile and the nitrogen
formation the oxygen consumption is the same for both
reactions. This means that the rate of acrylonitrile
formation at non initial conditions is higher than the
rate of nitrogen formation as was experimentally con
firmed (see table 6.2). Most probably not the same sites are involved in the acrylonitrile and the nitrogen production.
- Formation of carbon dioreide As we have seen in figure 6.21 the initial rate of
carbon dioxide formation at 673 K depends on the molar
ratio propene/ammonia. This is in agreement with the fact
that at initial conditions the value of one for the
fractional selectivity of propene to acrylonitrile is
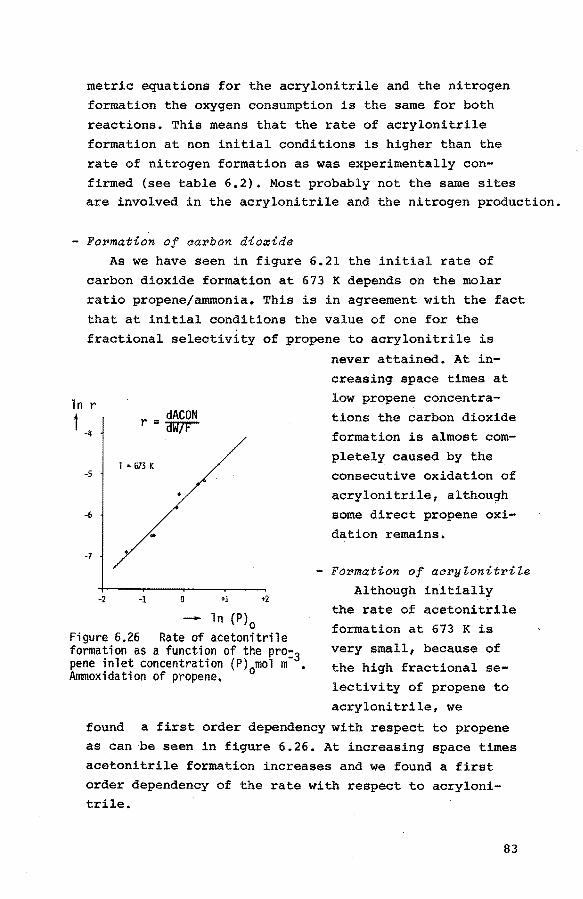
ln r
t -4 r _ dACON
- OA7t
T • 673K -5
-6
-7
-2 -1 +1 +2
- ln (P) 0 Figure 6.26 Rate of acetonitrile formation as a function of the pro" pene inlet concentration (P)
0mol m-3•
Ammoxidation of propene.
never attained. At in
creasing space times at
low propene concentra
tions the carbon dioxide
formation is almost com
plete!~ caused by the
consecutive oxidation of
acrylonitrile, althou~h
some direct propene oxi
dation remains.
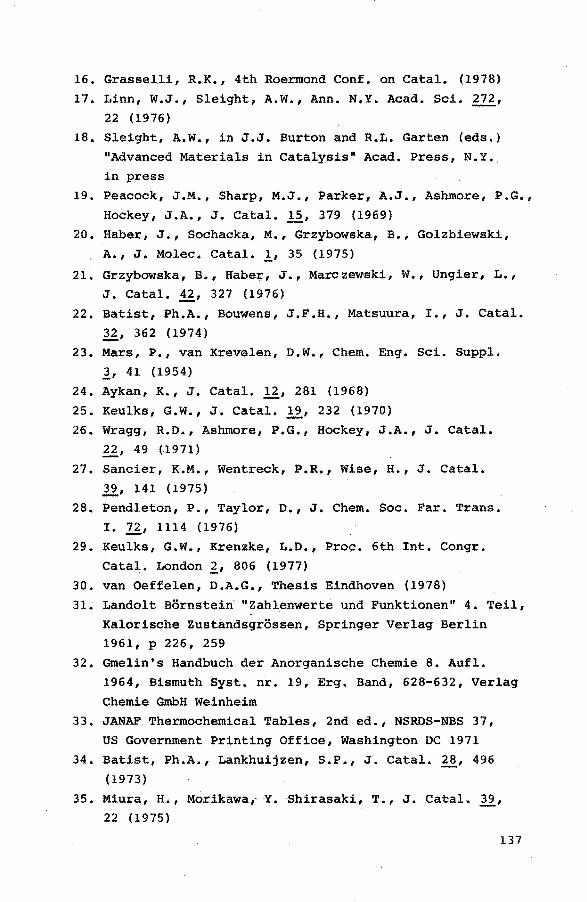
- Formation of acryLonitrile Although initially
the rate of acetonitrile
formation at 673 K is
very small, because of
the high fractional se
lectivity of propene to
acrylonitrile, we
found a first order dependency with respect to propene
as can be seen in figure 6.26. At increasing space times
acetonitrile formation increases and we found a first
order dependency of the rate with respect to acrylonitrile.
83
- Other products
Under the conditions of our investigation into the
kinetics of the propene ammoxidation at 673 K products like carbon monoxide, ethene, acetaldehyde and hydrogen
cyanide are produced in such low quantities that con
clusions about their rate of formation would be specula
tive.
6.3. Thermobalance experiments
Catalyst reduction and propene oxidation.
6.3.1. Introduction
In a thermobalance the weight changes of a given amount
of catalyst under various reaction conditions can be stu
died as a function of reaction time. The weight changes
may be caused by reduction (oxygen depletion of the cata
lyst) and by adsorption of reactants and products.
As discussed in section 6.1 and 6.2 the kinetics of the
different reactions present a rather complicated picture.
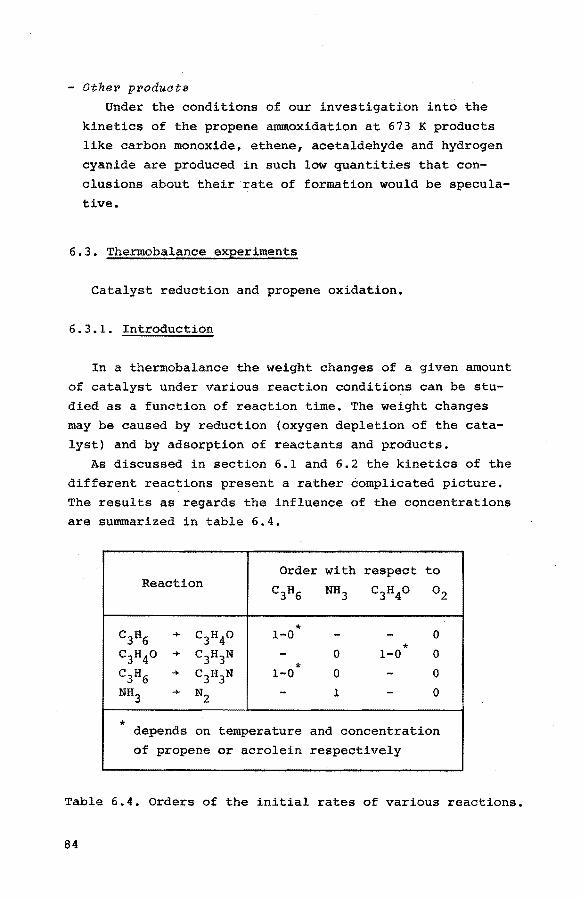
The results as regards the influence of the concentrations are summarized in table 6.4.
Table 6,4. Orders of the initial rates of various reactions.
84
Under similar conditions the rates of the oxidation of
propene, of the oxidation of ammonia, of the ammoxidation
of propene and of the ammoxidation of acrolein increase in this order, as was shown in table 6.2.
Below 673 K acrolein and acrylonitrile hinder the oxi
dation and ammoxidation of propene. Oxygen diffusion in the catalyst lattice to the reactive sites is also expected to influence the overall rate of reaction.
6.3.2. Preliminary experiments
For all thermobalance experiments a catalyst with a specific surface of 7.3 m2 g-1 was used, which was obtained
according to method B, but with a calcination temperature
of 753 K. Neither changes in gas flow rate (from 1-70 to 250 cm3
min-1 NTP) nor changes in catalyst.quantity (from 45 to 125 mg) nor changes in particle size (from .s to 1.4 mm)
had any influence on the rate of reduction of the cata
lyst. Calculations carried out according to the procedure of
Yoshida et al (5) showed that the tE;!mperature difference
across the boundary layer between the particle and the
gas phase can be neglected, so the temperature measured
above the sample is equal to the temperature of the particle.
6.3.3. Reduction of the catalyst with propene
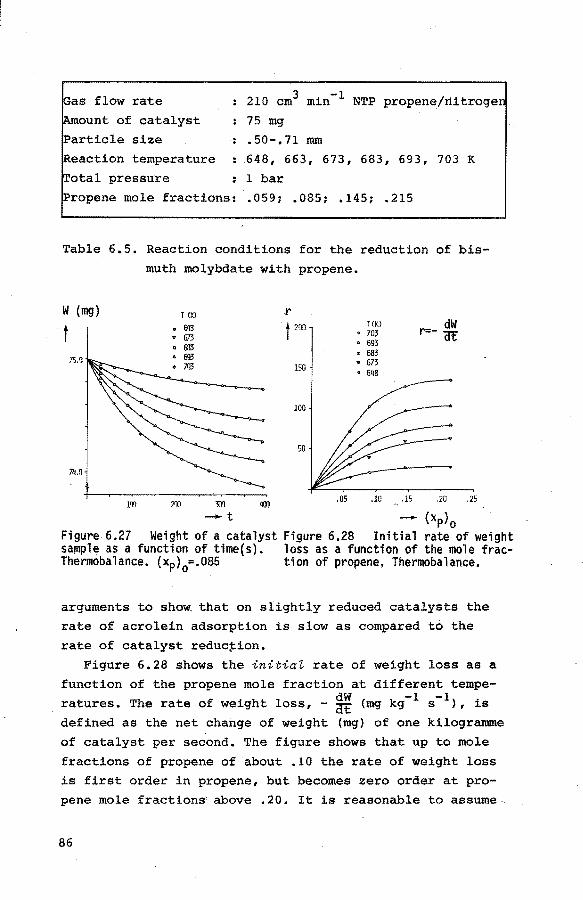
In table 6.5 the reaction conditions are given for the reduction of bismuth molybdate with mixtures of propene and nitrogen.
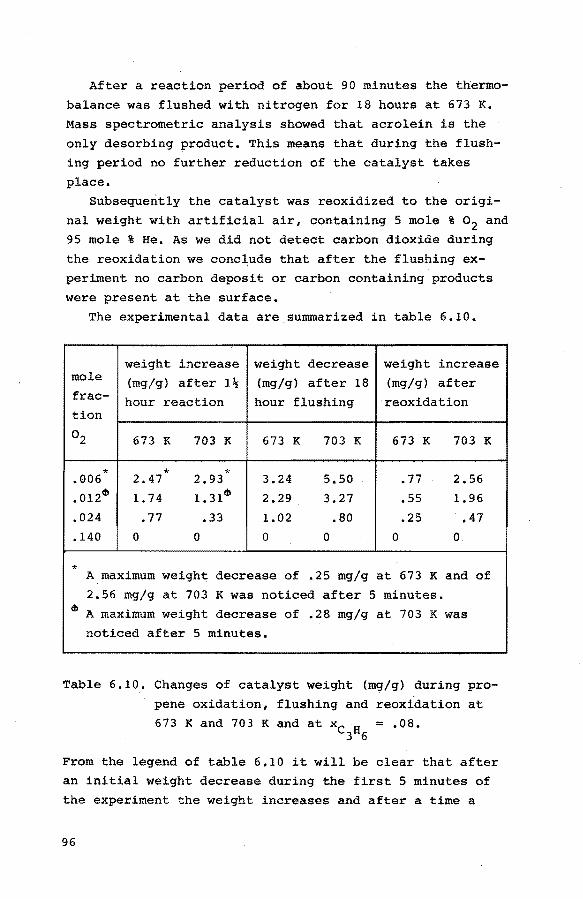
Figure 6.27 shows for a number of temperatures the weight of a sample as a function of time for the first 400
seconds of exposure to diluted propene (mole fraction xp = .085). More prolonged exposure causes the weight to
increase again, due to acrolein adsorption (see this chapter, section 6.3.6). In section 6.4.3 we will.offer
85
Gas flow rate
Amount of catalyst Particle size
Reaction temperature
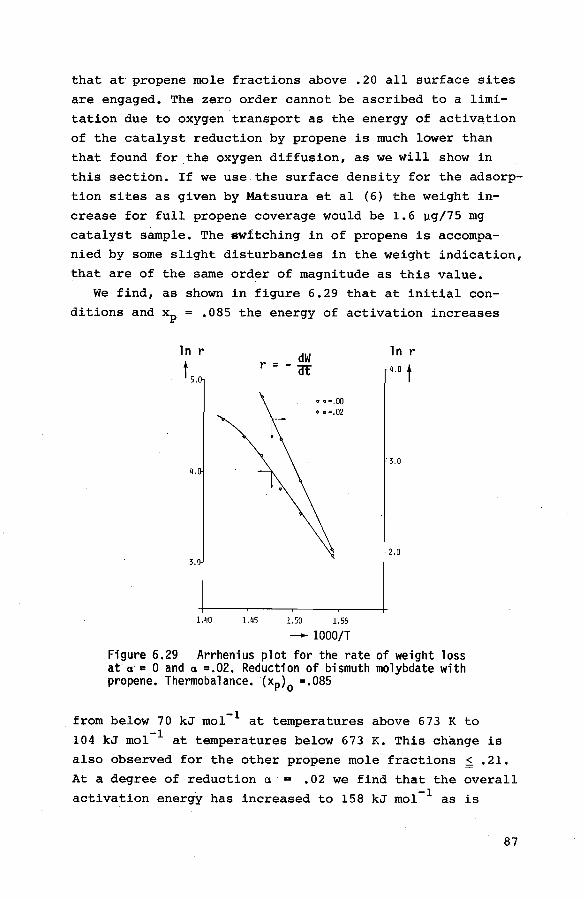
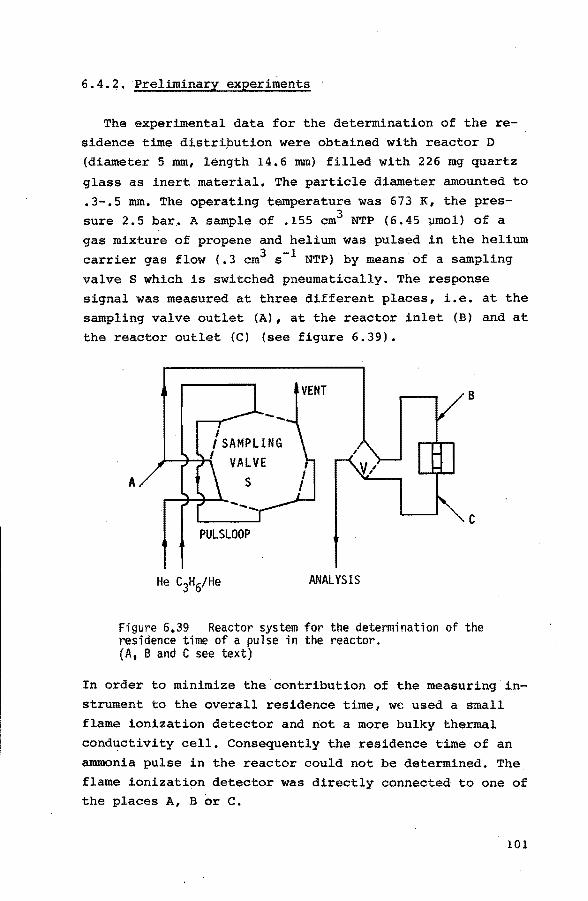
Total pressure
210 cm3 min-1 NTP propene/nitrogen
75 mg
.50-.71 mm
648, 663, 673, 683, 693, 703 K
1 bar
Propene mole fractions: .059; .085; .145; .215
Table 6.5. Reaction conditions for the reduction of bis
muth molybdate with propene.
w {mg) T (Kl .r
t • 643 t zoo HKl dW 6 703 r=- at • 693 • 683
75.0 v 673 150 • 648
100
50
74.0
1?1 300 400 .05 .10 .15 .zo .25
- t - {xp) 0 Figure 6.27 Weight of a catalyst Figure 6.28 Initial rate of weight sa~ple as a function of time(s). loss as a function of the mole frac-Thermobalance. (xp)
0=.085 tion of propene, Thermobalance.
arguments to show that on slightly reduced catalysts the
rate of acrolein adsorption is slow as compared to the
rate of catalyst reduction.
Figure 6.28 shows the initiat rate of weight loss as a
function of the propene mole fraction at different tempe-dW -1 -1 ratures. The rate of weight loss,- dt (mg kg s ), is
defined as the net change of weight (mg) of one kilogramme
of catalyst per second. The figure shows that up to mole
fractions of propene of about .10 the rate of weight loss
is first order in propene, but becomes zero order at propene mole fractions above .20. It is reasonable to assume
86
that at propene mole fractions above .20 all surface sites
are engaged. The zero order cannot be ascribed to a limi
tation due to oxygen transport as the energy of activation
of the catalyst reduction by propene is much lower than
that found for the oxygen diffusion, as we will show in
this section. If we use the surface density for the adsorp
tion sites as given by Matsuura et al (6} the weight in
crease for full propene coverage would be 1.6 ~g/75 mg
catalyst sample. The switching in of propene is accompa
nied by some slight disturbancies in the weight indication,
that are of the same order of magnitude as this value.
We find, as shown in figure 6.29 that at initial con
ditions and xp = .085 the energy of activation increases
ln r
t 5.0
3.
dW r = -at
1.50
• •=.00
1. 55
- 1000/T
3.0
2.0
Figure 6.29 Arrhenius plot for the rate of weight loss at·a·= 0 and a =.02. Reduction of bismuth molybdate with propene. Thermobalance. (xp)
0 =.085
from below 70 kJ mol-l at temperatures above 673 K to -1 104 kJ mol at temperatures below 673 K. This change is
also observed for the other propene mole fractions ~ .21.
At a degree of reduction ex = • 02 we find that the overall activation energy has increased to 158 kJ mol-l as is
87
shown by the curve for a = .02 in figure 6.29. The degree
of reduction a is defined as the fraction of the total
oxygen {six atoms per molecule bismuth molybdate) -that has
been removed i.e.
{6. 5)
This means that now another reaction step determines the
rate of reduction. We assume this to be the diffusion of
oxygen ions from the bulk to the surface of the catalyst
to reoxidize the reduced surface sites. If the diffusion
would be very fast the surface oxygen concentration would
be proportional to the bulk oxygen concentration and the
rate of reduction would be
dO - dt k 0 [Pj {6.6)
where 0 is the bulk concentration of oxygen. For constant
[P] we obtain from equation {6.6)
- ln
with k' = tion {6. 7)
0 k't 0 0
k [P] and t is
does not fit
the
the
{6.7)
reaction time. However equa
observed rate of weight loss.
We conclude therefore that the oxygen diffusion influences the observed rate of reaction.
A simplified model for such a combined surface oxidation
reaction and oxygen diffusion has been given by Batist et
al {7). They arrive after certain simplifications to the relation
a = -A + Bt~
that is valid for intermediate values of a and t. In equation {6.8) A and B are
88
{ 6. 8)
B 2 S p D~ -~
'!1'; s
(6.9)
(6.10)
with S is the specific surface area, p the density of the
catalyst, D the diffusion coefficient of oxygen ions in
the lattice, k the rate constant of the chemical reaction, X a socalled jump distance of the order of the lattice
constant and t the reaction time. Although the more gene
ral model of Steenhof de Jong (8) is based on the assump
tion that the chemical reaction step and the diffusion
step are not necessarily equal in rate and that the solid
is not a semi-infinite flat plate, the resulting equation
is rather difficult to handle and we decided to apply
Batist's relation. As is shown in figure 6.30 relation
t a
.OS
.04
.03
.02
.01
.00
-.01
T • 673 K Xp
•. 146 •• 081 •• 059
-.02 +--~--....---,--..-----., 10 15 20 25
- vt Figure 6.30 Degree of reduction as a function of~ Thermobalance.
(6.8) holds at 673 K and at different mole fractions of
propene for .01 < a. < .045 and 6 <It < 15 s~. Nearly the
same ranges are valid at the other temperatures. The de-
89
viation at the upper limit is caused by the adsorption of
acrolein but the values of A and B are still clearly de
fined. As we already know the value of the rate constant of
the chemical reaction on the catalyst surface and its
energy of activation we can use both the expression 6.9
and 6.10 to calculate the diffusion coefficient, its ener
gy of activation and the jump distance. For the diffusion
coefficient at 673 K and xp = .085 we found 3.3 l0-17 m2
s-1 . This value is comparable with that given by Batist
et al (7) for a less active catalyst at 723 K viz. 2.4 10-17 m2 s-1.
We calculate an activation energy from B of 168 kJ mol-l
and from A of 164 kJ mol-1 , assuming a jump distance A that is not dependent on the temperature. For the mean jump distance A we found a value of 3.8 l0-10 m for the
temperatures between 673 and 703 K. From the crystal struc
ture data determined by van den Elzen et al (9) (see fi
gure 4.1) we calculated a distance between two apex oxygen
ions of 3.64 10-10 m, which is in good agreement with the
value of the jump distance calculated from the experiments.
The energy of activation for the diffusion found in this
way fits very well with the results from the rates of re
duction at a= .02 viz. a value of 158 kJ mol-1 • We there
fore conclude that even at a low degree of reduction the
diffusion of oxygen in the bulk has a major influence on
the overall rate of reduction of the catalyst by propene
only. The above confirms that here the model of Batist et
al describes the process accurately.
6.3.4. Reduction of the catalyst with hxdrogen
From experiments carried out with propene, artificial
air and water in the fixed bed reactor we found that water
does not inhibit the formation of acrolein (see table
6.1). This means that also during the reduction of the
catalyst in the thermobalance inhibition by water is probably absent. The reduction of the catalyst with hydrogen
90
would therefore offer the possibility to investigate the
reactivity of the catalyst without the adsorption of acro
lein.
In table 6.7 the reaction conditions are given.
Gas flow rate 210 cm3 min-1 NTP hydrogen/ni
trogen
Amount of catalyst
Particle size
Reaction temperature
Total pressure
Hydrogen mole fraction
75 mg
.50-.71 mm
673, 703, 723 K
1 bar
.055~ .073~ .102
Table 6.7. Reaction conditions for the reduction of bis
muth molybdate with hydrogen.
In figure 6.31 the influence of the hydrogen mole frac
tion on the initial rate of reduction at 703 K is shown
and we conclude that the initial rate of reduction is
first order with respect to hydrogen. The reduction rate
ln r . t -0.5
-1.0
-1.5
_ dO r-- dt'
T = 703K
.OS
.03
.~II/ .Olr
T <Kl 0 723 6 703 • 673
(XHJ0=,073
q -2.5 -2.0 500 1000 1500 2000
-ln xH -t Figure 6.31 Initial rate of re- Figure 6.32 Degree of reduction duction (mmol kg-_s- } as a function as a function of time (s). Reduc;.. of the mole fraction of hydrogen. tion of bismuth molybdate with Thermobalance. · hydrogen. Thermobalance.
91
with hydrogen is much lower than with propene, as follows
from table 6.8.
dO -I -1 673 K 703 K -at {mmol kg s )
H2 .19 .37
C3H6 2.4 5.4
Table 6.8. Initial rates of reduction of bismuth molyb
date with hydrogen and propene.
XH = Xp = .073.
At 703 and 723 K the degree of reduction is a linear
function of time for the reduction range studied. At 673 K
this linear relationship is somewhat affected as is illu
strated in figure 6.32.
For the rate constant in the initial rate equation
(-~~) 0
(6.11)
we find an energy of activation of 85 kJ mol-l, as follows
from figure 6.33 (straight line). This value agrees with . -I
the value of 8I kJ mol given by Beres .et al {10). The
little curvature of the line in figure 6.32 for the re
duction at lower temperatures is ascribed to influences of the oxygen diffusion on the rate of reduction at a > 0.
As the mean overall energy of activation for the diffu--1 sion (E0 = 163 kJ mol ) is very much larger than the
energy of activation for the reduction with hydrogen the
influence of the diffusion will be felt only at tempera
tures below 673 K. This is illustrated in figure 6.33 by the dotted curve.
92
-1
-2
dO r=- df
1.35
(.l
• .00 • .02
(XHJ0=,073
'\ \ \
~
1.40 1.45 1.50
-1000/T
Figure 6.33 Arrhenius plot for the rate of reduction of bismuth molybdate with hydrogen. (xH)o = .073. Thermobalance.
6.3.5. Reoxidation of a reduced catalyst
Reoxidation experiments were carried out under the
following conditions.
Ga_s flow rate
Amount of catalyst (before reduction)
210 cm3 min-I NTP oxygen/nitroger
75 mg
Reducing agent propene (8 mole % in helium)
Degree of reduction a max •• 08
Reoxidation temperature: 673, 693, 703 K
Mole fraction of oxygen: .07-.21
Total pressure 1 bar
Table 6.9. Reaction conditions for the reoxidation of re
duced bismuth molybdate with oxygen.
93
The reoxidation of reduced bismuth molybdate is an extremely fast reaction in comparison with the reduction
reaction. At 673 K and a = .073 the initial rate of reoxi-1 -1 dation with air (x0 = .21) is 165 mmol 0 kg s , where-
2 as the maximum initial rate of reduction is only about 4 mmol 0 kg-1 s-1 •
The initial rate of reoxidation is first order with res
pect to oxygen as can be seen in figure 6.34. The rate de-
_ dO ln r
T (K) r-- (ff
t -1 " 703 • 673
·2 01 .081
·3
.q
-5
·5 .q ·3 -2 -1
-ln x 0
Figure 6.34 Initial rate of reoxidation (mmol kg-1 s-1} of reduced bismuth molybdate (a. = .081) as a function of the mole fraction of gas phase oxygen. Thermobalance.
pends on the degree of reduction. We conclude that at
these temperatures oxygen diffusion limitation is absent.
The calculated energy of activation is 64 kJ mol-1 • This value agrees with the value of 70 kJ mol-l given by Mat
suura and Schuit (1).
6.3.6. The reduction of the catalyst with mixtures of pro
pene, nitrogen and small quantities of oxx~en
The experiments were carried out at 673 K and 703 K
with gas mixtures having a constant mole fraction of pro
pene (xp = .08) and mole fractions of oxygen between .006
and .14.
94
r
t
6
4
2
(xo)o ~ ,140
dO •• 024 •• 012
r=Of v,006 T~673K
1200 2400 3600 lj8IJO 6000
-t Figure 6.35 Rate of oxygen consumption (mmol kg -ls -l) .as a function of time (s). (xp}
0=.08 Thermobalance.
In figure 6.35 the rate of oxygen consumption from the gas phase and the catalyst at 673 K is given as a function
of time for the different gas mixtures. These oxygen consumption data have been calculated from the chemical ana
lysis of the feed and product stream. The initial rate of oxygen consumption is a function of the mole fraction of
oxygen in the gas phase, if x0 < .026.
We assume that under reducing conditions i.e. with a low oxygen partial pressure the number of active sites
decreases with the decrease in oxygen partial pressure (see also the pulse experiments, section 6.4}. With the
supply of gas phase oxygen the catalyst surface is activated and consequently the initial rate of oxygen consumption increases. However with substoichiometric quan
tities of oxygen a steady state is reached, whereby the
catalyst ends up in a somewhat reduced state. This was also concluded by van Oeffelen (12) from conductivity measurements.
From figure 6.35 we see that after about 30 minutes a
stationary condition is attained and that the rate of
oxygen consumption at the steady state depends on the mole fraction of oxygen in the gas phase.
95
After a reaction period of about 90 minutes the thermo
balance was flushed with nitrogen for 18 hours at 673 K.
Mass spectrometric analysis showed that acrolein is the
only desorbing product. This means that during the flush
ing period no further reduction of the catalyst takes
place. Subsequently the catalyst was reoxidized to the origi
nal weight with artificial air, containing 5 mole % o2 and
95 mole % He. As we did not detect carbon dioxide during
the reoxidation we conclude that after the flushing ex
periment no carbon deposit or carbon containing products
were present at the surface.
The experimental data are summarized in table 6.10.
weight increase weight decrease weight increase mole {mg/g} after 1~ (mg/g) after 18 {mg/g) after frac- hour reaction hour flushing reoxidation tion
* A maximum weight decrease of .25 mg/g at 673 K and of 2.56 mg/g at 703 K was noticed after 5 minutes.
$ A maximum weight decrease of .28 mg/g at 703 K was noticed after 5 minutes.
Table 6.10. Changes of catalyst weight (mg/g) during pro
pene oxidation, flushing and reoxidation at
673 K and 703 K and at xc H = .oa. 3 6
From the legend of table 6.10 it will be clear that after
an initial weight decrease during the first 5 minutes of
the experiment the weight increases and after a time a
96
net increase in weight results, caused by the adsorption
of the heavier acrolein molecules. The ultimate quantity
of acrolein adsorbed represents a steady state that is
i.a. determined by the degree of reduction of the catalyst
and by the rate of acrolein production. Without oxygen in
the gas phase the net weight decrease after 5 minutes was 6.5 mg kg-l at 673 K and 13.3 mg kg-1 at 703 K, as can be
calculated from figure 6.27.
As is shown in figure 6.36 the amount of acrolein ad
sorbed under stationary conditions is proportional to the
degree of reduction a.
(ACO} .· a t 6
3
2
T (Kl . 673 . 703
.005 .01 .015 .• 02 .025 -a
Figure 6.36 Acrolein adsorbed (g kg-1) as a function of the degree of reduction a at stationary conditions. Thermobalance.
dO r=- at
ln r
t 2
T = 673K
0
-5 -4 -3 -2 -1
- ln x0 Figure 6.37 Rat!1of1oxygen consumption (mmol kg s ) as a function of the mole fraction of oxygen in the gas phase. (xp)
0=.08
Thermobalance.
In figure 6.37 the rate of oxygen consumption under
stationary conditions is plotted as a function of the mole fraction of oxygen in the gas phase. The rate of oxygen consumption is first order with respect to oxygen provided
x0 < .024 and the order decreases to zero when x0 > .08.
From figure 6.27 it can be calculated that the initial
rate of weight loss at 673 K and xp = .085 without gas phase oxygen is 3.9 10-5 s-1 • From the chemical analysis
it follows that at initial conditions the selectivity of
97
propene towards acrolein is .96 and that the other product
is carbon dioxide (see also the flow experiments, section
6.2.3.1, table 6.1 and the pulse experiments, section
6,4.3, figure 6,40).
The initial rate of acrolein formation was calculated
from these data, according to the stoichiometric equations.
(r 6. 1)
(r 6.2)
and a value of 6.3 10-5 s-1 was obtained. From the flow
experiments with gas phase oxygen and the same propene
mole fraction the initial rates of acrolein formations
were calculated (see figux-e 6.35 and table 6.11).
xo (\~co) 0
s -1 10 5
.140 16.9
.024 15.2
• 012 10.7
.006 7.0
Table 6.11. Initial rates of acrolein formation as a
function of x0 at 673 K and xp = .08.
One can conclude from these figures that the initial rate
of acrolein formation in the absence of gas phase oxygen
is smaller than in its presence. From a calculation of the number of acrolein molecules
adsorbed per m2 after the experiment at 703 K with x0 =
,006, i.e. 8.5 1018 m-2 and the area of one acrolein mole
cule (5 10-20 m2 ) it can be concluded that the reduced
catalyst surface is covered with 40 percent of a monolayer
of acrolein molecules.
98
From the data of table 6.10 and of figure 6.35 it can
be concluded that the amount of adsorbed acrolein is a
linear function of the rate of oxygen consumption under stationary conditions, as is shown in figure 6.38 for
673 K.
r
t 8
T '" 673 K
6
4
2
1 2 4
-(AGO) a
Figure 6.38 Rate of oxygen consumption (mmol kg-1 s-1) as a function of the amount of adsorbed ac~olein (g kg-1) at stationary conditions.. (xp}o = .oa, Thermobalance.
If only acrolein is desorbed by flushing the thermobalance, as was experimentally confirmed by means of mass
spectroscopy and the weight increase by oxidation is only caused by oxygen addition, then at 673 K about .85 oxygen
atom replaces one acrolein molecule and at 703 K we have
about 1.9 oxygen atom per acrolein molecule. Both figures are independent of the mole fraction of oxygen during the
reaction with propene. As one oxygen atom has an area of
10-19 m2 the amount of oxygen atoms in a closed monolayer packing is 8.3 10-6 mol m- 2• From table 6.10, column 6,
the amount of oxygen used for the reoxidation of the catalyst after reduction and flushing at 673 K is 7 10-6 mol
m-2 • This means that at that temperature almost all the
surface oxygen atoms were removed. At 703 K also bulk oxygen must be removed.
99
From this experiment we conclude that the catalyst is
in a partly reduced state during the catalytic oxidation
of propene with substoichiometric quantities of oxygen,
even at a low propene conversion level.
6.4. Pulse experiments
6.4.1. Introduction
As we have seen the interpretation of the thermobalance
experiments was hampered by the fact that acrolein is ad
sorbed on the reduced catalyst. However if we accounted
for this adsorption the experimental observations showed
themseives to be useful for the development of a reaction
model for the oxidation of propene. We decided to check
the conclusions by an investigation in a pulse reactor.
With this type of reactor we expected to obtain additional
information about the oxidation and ammoxidation reaction
under initial conditions.
However a pulse reactor is not a very appropriate de
vice for a kinetic investigation for the following reasons:
1. For kinetic work the concentrations and the reaction
time must be known. But even with an ideal a-function
form of the input pulse the length of the pulse in the
reactor and the concentration distribution within the
pulse are rather difficult to assess;
2. Even when the information required sub 1 is available,
it is possible that the adsorption of the reactants is
not the rate determining step. If a fast adsorption
step is followed by a reaction step over a period which
can be longer than the residence time, the calculated
apparent reaction rate based on the contact time of the
pulse will be too high.
Therefore we checked the value of the residence time as
calculated from the inert gas flow by an experimental de
termination of the pulse shape.
100
6.4.2. Preliminary experiments
The experimental data for the determination of the re
sidence time distripution were obtained with reactor D (diameter 5 mm, length 14.6 mm) filled with 226 mg quartz
glass as inert material. The particle diameter amounted to
.3-.5 mm. The operating temperature was 673 K, the pres
sure 2.5 bar. A sample of .155 cm3 NTP (6.45 ].!mol) of a gas mixture of propene and helium was pulsed in the helium
carrier gas flow (.3 cm3 s-1 NTP) by means of a sampling
valve S which is switched pneumatically. The response
signal was measured at three different places, i.e. at the sampling valve outlet (A), at the reactor inlet (B) and at
the reactor outlet {C) (see figure 6.39).
B
A
c PULSLOOP
ANALYSIS
Figure 6.39 Reactor system for the determination of the residence time of a pulse in the reactor. (A, B and C see text)
In order to minimize the contribution of the measuring instrument to the overall residence time, we used a small
flame ionization detector and n:ot a more bulky thermal
conductivity cell. Consequently the residence time of an
ammonia pulse in the reactor could not be determined. The
flame ionization detector was directly connected to one of the places A, B or C.
101
The increase of the pulse width is mainly caused hy the
axial diffusion in the line between the valve and the reac
tor and to a much smaller extent by the reactor itself. In particular valve V (see figure 6.39) and its connection to
the lines is responsible for a large increase of the re
sidence time.
As can be seen in table 6.12 the mean residence time
calculated at half height is about 6.6 s and independent
of the mole fraction of propene at the inlet of the flow
system, Consequently the gas mixtures will be more diluted
with helium at the reactor inlet.
p C3H6
inlet system (bar) .105 .298 .502
p C3H6
inlet reactor (bar) .025 .059 .086
crB 2 (s2) 5.04 7~63 8.63
ac 2 (s2) 7.04 8.49 8.01
tres (s) 6.2 6.7 6.8
Table 6,12. Data from the determination of the residence
time of a pulse in the reactor at 673 K.
Total pressure 2.5 bar abs.
The adsorption of reactants and products during a pulse
could be determined by means of the separate analysis of
the pulse and of the adsorbed products originating from
that pulse. To do that the reactor was closed by valve V
(see figure 6.39) after passage of the first pulse into
the gas chromatograph. The adsorbed products were given
time to desorb into the reactor gas phase and thereafter
flushed into the gas chromatograph. In this way we obtai
ned good carbon and nitrogen mass balances as can be seen from table 6.13.
From this table it follows that about 60% of the ammonia
remains adsorbed on the catalyst, As the product strip
102
c N
mmol kg -1 mmol kg -1
feed pulse 128.7 21.6
product pulse 15.6 5.4
unconverted pulse 110.0 3.5
pr<:>dU:ct strip 1.5 13.1 --- ---127.1 22.0
balance % 98.7 101.6
Table 6.13. Carbon and nitrogen mass balances for the re
action of a pulse containing 67 mole % c3a6 and 33 mole % NH3•
contains mainly N2 as a nitrogen containing product we
conclude that ammonia is easily oxidized by oxygen from
the catalyst. The quantity of ammonia adsorbed is equiva
lent to the number of surface Bi-sites if we use Matsu~ra's
data. This experiment further shows that of the first pul
se very little carbon containing material is adsorbed. We
decided not to reoxidiz~ the catalyst sample after each
series of pulses but to take a new quantity of catalyst prepared according to method A, for every new series.
6.4.3. Experiments with propene-helium mixtures
The experiments were carried out at 673 K in reactor D,
with 100 mg catalyst. As is shown in figure 6.40 for pure
propene in the sampling valve, the propene conversion de
creases from 8.3% at the first pulse to 5.0% at the tenth
puls~ with a sharp decrease from the first to the second
pulse. As from the second pulse onward the decay in conversion per pulse is small and constant, this decay is
ascribed to the oxygen loss of the catalyst.
103
0cat
t 12 ,.....,_ '" oC~qO ...... ..c
10 r\.__ oOCAT. .. •XC3"o
8 \ "'·._ T • 673 K
~.. ... " .....
6
4
2
.. .... _ ..............
.. '~ .... ~-.. ~ .... ....__ r-··1 / ~
2 4 6 8 10 12 14 16 18 -n p
Xp t
.10
.08
.06
.04
.02
Figure 6.40 Formation of acrolein· and_yarbon dioxide! consumption of catalyst oxygen (mmol kg } and convers1on of propene per pulse vs. pulse number np.
The rather great decrease in activity between the first
and the second pulse under almost all conditions makes it
reasonable to suppose that during the first pulse a number
of active sites are converted to less active and less se
lective sites. The active sites are very selective in the
first pulse as can be seen in figure 6.40 from the low
carbon dioxide production in the first pulse.
From figure 6.40 we see that in the first pulse about
12 mmol oxygen/kg catalyst is removed. From the carbon
balance over that pulse we calculate that almost no acrolein (less than 1 percent of the reduced sites) can be
adsorbed on these sites. This confirms again the slow ad
sorption of carbon containing products on a catalyst that
is only reduced to a very small extent and that is only
for a short period exposed to acrolein. All the lines of
figure 6.40 bisect the abcissa at about 32 pulses, which
corresponds to a degree of reduction a = .02. This is in agreement with the thermobalance experiments. Due to the
increase in pulse width, partial pressures of propene
> .12 bar could not be attained with this pulse reactor
system. Consequently the zero-order dependency with res-
104
pect to propene of the rate of
in the thermobalance for Pc H
oxygen consumption as found
> .14 bar could only be 3 6
approached but not. obtained. The experimental data indi-
cate however that at a propene partial pressure of .115
almost full coverage of the active sites is attained, as
- n p Figure 6.41 Amount of Pr~pene converted per pulse (mmol kg ) vs. pulse number n
0• Oxidation of prope
ne with and wi~hout (6) gas phase oxygen.
ln ACO t3
-3
lstwthpulse
• • C#qO • • c~
T=673K
-2
- ln (p0)0 Figure 6.42 Rates of formation of acrolein and1carbon dioxide per pulse (mmol kg- ) as a function of the partial pressure of oxygen(bar) at the pulse reactor inlet.
crease of the conve~sion as explained for the thermoba
lance experiments (see section 6.3.6) can be ascribed to
a decrease of the number of reduced sites.
The rate of formation of acrolein is a function of th~ partial pressureof oxygen as is illustrated in figure 6.42
for the first and the tenth pulse at low partial pressures of oxygen the oxygen is completely consumed. Consequently
at low partial pressures of oxygen the rate of acrolein
formation decreases in the last part of the pulse and the
catalyst becomes reduced to a certain extent. This causes
the rate of acrolein formation to decrease from the first
to the tenth pulse. The rate of formation of carbon dioxide is also a function of the partial pressure of oxygen for
all pulses. The increase of the rate from the first to the
tenth pulse at the same partial pressure of oxygen is pre
sumably caused by an increase of the number of unselective
sites by reduction of the catalyst.
For all oxygen concentrations the selectivity of the first pulse was above .95.
106
6.4.5. Experiments with mixtures of ammonia and helium
Experiments were carried out in reactor D at 673 K
with mixtures containing 8-100 mole % ammonia at the sys-
tern inlet. The amount of catalyst is 100 mg. The conver
sion of ammonia per pulse is constant for partial pressu
res of ammonia at least until pNH < .086 bar, as can be 3 seen in table 6.15.
partial pressure conversion of NH3 ocatalyst-consumpti~n of NH3 (bar) XN (fraction) mmol 0 kg-1 pulse-
.020 .174 1.4
.037 .167 2.6
.086 .170 8.3
.11 .123 11.8
Table 6.15. Catalyst reduction by ammonia oxidation to N2 as a function of the partial pressure of NH 3 at 673 K.
This means that this reaction behaves in the pulse reactor
as a first order reaction (again at least until pNH = 3
.086 bar). This is in agreement with the flow reactor ex-periments (see section 6.2.4).
Contrary to the decrease in conversion for subsequent
pulses of propene here the first pulse fits completely in
the pattern of all the others.
6.4.6~ Experiments with mixtures of gropene, ammonia and
helium
The experiments were carried out with pulses of propene/
ammonia mixtures diluted with helium. Due to the increase
in pulse width the series of diluted pulses contained 94,
107
95 and 96.5 mole % helium. The ratio propene/ammonia of
the remaining 6, 5 and 3.5 mole % respectively of these
gas mixtures was varied from 1:9 to 9:1. The experiments can be divided into two groups. In the
first group (pulses containing 94 mole % helium, pHe = 2.35 bar) we investigated the conversion and product dis
tribution as a·function of the pulse number for series of
16 pulses. In the second group (pulses containing 95 and
96.5 mole % helium, pHe = 2.385 and 2.413 bar respectively) we stopped each experiment after a few pulses because
our main interest was in the oxygen consumption by the
reactants and in the product distribution of the first
pulse.
Pulses of the first group of experiments showed quali
tatively the same picture as pulses of diluted propene as
can be seen for figure 6.43. The decrease in conversion
108
p
t
1~
•• 000 •• 02~ • .!IllS •• 062 ... 075
.086
T = 673K
2 ~ 6 8 10 12 1~ 16 18 20
-n p
Figure 6.43 Amount of propene converted (mmol kg-1} per pulse vs. pulse number np. Ammoxidation of propene using bismuth molybdate as reactant.
between the first and second pulse is again ascribed to
the loss of special sites. But presumably due to the pre
sence of ammonia we do not experience a loss in selecti
vity. As compared to the reaction with propene only, the
maximum oxygen consumption rate per pulse is now about 5
times higher (see figure 6.43) and would continue (if a
linear extrapolation to a zero conversion rate would be
realistic) to a degree of reduction of almost 50%. We see from the sections 6 .4'. 3, 6. 4. 4 and 6. 4. 6 that
the rate of oxygen suppletion by the catalyst is greatly
enhanced in the presence of oxygen or ammonia. In this
connection we recall the observation of Sancier et al (13)
who mentioned that the production of c3H416o on a catalyst
containing 16o is enhanced by increasing the partial pres
sure of 18o2 in pulse experiments. If all these phenomena
have the same cause it points to the assumption that the
adsorption of certain species enhance the supply of bulk 16 2- 18 2-oxygen to the reactive sites. In this respect 0 , 0
and NH2- could perform the same function.
ln ACN
t 3
2
15tlothpulse
C3H3N • a
c~ • • T = 673 K
-1
~ ~ ~
-ln (pN)o Figure·6.44 Rate of formation of acrylonitrile and·c,rbon dioxide per pulse (mmol kg- ) as a function of the partial pressure of ammonia (bar) at the pulse reactor inlet.
Table 6.16. Rate of carbon dioxide formation at 673 K for
the oxidation and ammoxidation of propene.
The product distributions obtained from the first pulse of
the various propene/ammonia/helium gas mixtures fit in
0cat t 16
14
.02 .04 .06 .08 .10 .02 ,04 .06 .08 .
- Pp - Pp Figure 6.45 A~~unt of catalyst Figure 6.46 ~~unt of catalyst oxygen (mmol kg ) used during the oxygen (mmol kg ) used during the first pulse for the formation of first pulse for the formation of the main products as a function of the main products as a function of !he partial pressure of propene(bar)~the partial pressure of propene(bar}. PHe=2.385 bar Pp+PN=.l15 bar PHe=2.413 bar Pp+PN=.087 bar
110
with those obtained from the first propene/helium and
ammonia/helium pulses as is shown in figure 6.45 and figure 6.46 where the rate of oxygen depletion of the cata
lyst for the formation of the main products acrylonitrile,
acrolein, acetonitrile, carbon dioxide and nitrogen is
plotted as a function of the partial pressures of propene and ammonia for two values of the partial pressures of
helium.
References
1. Satterfield, C.N., Sherwood, T.K., "The role of diffu
sion in catalysis", Addison-Wesley Publ. Cy. Inc., Reading (1963)
1st proton abstraction + Bi Bi 2-(C3H5)-formation on Mo Mo Moo4
Shift of (C3HS) Bi Mo - - -2nd proton abstraction + (C3H4)-formation Bi Mo Bi Mo 2-on Moo4
Formation of c3H40 with 2-0 near resp. of (Sleight) Bi Mo Bi Mo Moo4
Formation of H2o with 0 2-near resp. of (Sleight) Bi Mo Bi Mo Moo4
a-diffusion from places
near Bi to - Mo - Mo Mo
a-diffusion from places - - Bi - -near Mo to
Reoxidation near Bi Bi Mo Bi Bi
Table 7.2. Scheme of the various reaction models as presented in literature for the oxidation of propene to acrolein over bismuth molybdate.
As we have shown that in the ammoxidation of propene one of.the types of reactive sites is fully covered by
ammonia or its derivatives we adhere to a non he.tero-shift model, such as that of Peacock et al. Thus for the aero-
127
lein formation we assume the following sequence of stoi-
chiometric equations, all connected with moJybdenum
C3H6 + Mo6+ + OS 2-
+ 6+ -Mo (C3H5) + (OSH) (r 7.4)
6+ Mo (C3H5 ) + Mo4+cc3
H5
)+ (r 7.5)
Mo4+(C3H
5)+ 2- + Mo4+ + (OsC3H5) (r 7.6) + OS +-
4+ + Mo {C3H5 ) + 2-OS +
4+ Mo (C3H4} + (OsH) (r 7. 7)
The equations (r 7.4 tor 7.7) have been discussed above. 4+ In order to proceed from the.Mo (c3H4) species a number
of sequences is possible: e.g. either the Mo4+ of the
surface complex is oxidized by Bi3+ or the c 3H4 species
transfers to a Mo6+ site. In both cases electron transfer
can follow according
+ (r 7. 8)
This cc3H4) 2+ species then reacts with anos2- ion to form
acrolein that subsequently desorbs. The adsorbed acrolein
on molybdenum accounts for the inhibiting effect of acro
lein on the oxidation of propene.
There is also the possibility that we have a concerted
reaction,such as
+
(r 7. 9)
with subsequent desorption of acrolein and the same in
hibiting effect.
In all sequences we will end with a Mo4+ species that
will be reoxidized by means of the redox reaction (r 7.1).
7.4.2. The formation of nitro9en
We have discussed in section 7.3.1 that the nitrogen
128
containing species N0
and N1 are formed on the active
centres connected with bismuth and molybdenum respectively.
We suppose these species to be formed from ~mmonia by means of two separate dehydrogenation sequences.
The sequence on the active centre containing molybdenum
is comparable with the dehydrogenation of propene as given by the equations (r 7.4) to (r 7.8) for propene and ends
4+ 2+ with the species Mo (NH) • The sequence on the active centre containing bismuth
ends with the formation of the species Bi3+(NH) 2-. This
assumption is in agreement with that of Matsuura (2). The
abstraction of two protons is also mentioned by Gates et ,
al (4). Matsuura (2) assumed that the nitrogen formation occurs on an A-ensemble from two similar species Bi3+(NH) 2-.
We however postulate a reaction between the two intermediates formed on the different reactive ensembles viz. Bi3+(NH) 2- and Mo4+(NH) 2+. The formation of two different
species on different active sites is supported by our kinetic experiments. After the formation of the intermediate HN = NH proton abstraction and electron transfer leads to the formation of nitrogen. As was experimentally
found (see section 6.2.5.2) nitrogen formation is notably suppressed during the ammoxidation of acrolein. We a~cribe
4+ 2+ this phenomenon to the rapid formation of Mo (C3H4) and
Mo4+cc3H4NH) from acrolein, which results in a decrease
of the formation of the Mo4+(NH) 2+ intermediate.
7.4.3. The formation of acrylonitrile
Analogous to the.formation of acrolein Matsuura (2)
assumed that the greater part of the sequence that leads
to the formation of acrylonitrile from propene occurs o~ his A ensemble, whereas Gates et al (4) assume that the carbon-nitrogen bond is formed on this A ensemble before
the last two protons are abstracted. This also has been suggested by Cathala et al (46).
We also assume that acrylonitrile is formed via the formation of the intermediate c3H4NH, but from a
129
Mo4+cc3H4 ) 2+ and a Bi3+(NH) 2- species. This leads via a
rapid dehydrogenation to acrylonitrile, as was already
experimentally confirmed by Cathala et al (47), who found
the dehydrogenation of allyl amine over bismuth molybdate
to be a rapid and selective reaction.
The formation of acrylonitrile from acrolein at 673 K
is first order in acrolein for low acrolein concentrations
in the gas phase and zero order in ammonia. The rate of
acrolein formation is high in comparison with the rates of
oxidation and ammoxidation of propene, which points either
to a concerted reaction between N0
species and absorbed
acrolein or to a rapid formation of the intermediates 4+ 2+ 4+ .. Mo (C3H4) and Mo (C3H4NH). In th1.s respect we recall
the observation, mentioned in section 7.4.2 that the
nitrogen formation is notably suppressed, which means
that the intermediates are present on Mo4+. Further we mention the conclusion of Cathala et al (48) with respect
to the rapid formation of c3H4-species from acrolein. The
two possibilities are depicted in the scheme given in
section 7.5 by means of two dotted arrows.
7.4.4. The formation of water
The first order relation in propene for acrolein and
acrylonitrile formation requires that the proton abstrac
tion step is irreversible, which can be explained if the
conversion of surface hydroxyl groups to water is very
fast. This is confirmed by the observation that water va
pour does not inhibit the reaction. As discussed in sec
tion 7.3.4 we have no further evidence to offer as to what cations the hydroxyl groups are related.
7.5. The kinetic model
The experimental data given in chapter 6 show that
under comparable stationary conditions in the flow reac
tor the rate of propene oxidation is the smallest, direct
ly followed by the rate of propene ammoxidation, whereas
130
the rate of acrolein ammoxidation is much greater as can be seen in table 6.2, which is copied here for easy refe-
renee:
k (mol kg -1 -1 s )
p + ACO 0.025 p + ACN 0.035
ACO + ACN 0.42
Table 6.2. Reaction rate constants at 673 K.
The ratio between the rate constant of the ammoxidation
of propene and that of the oxidation of propene (R1), gi
ven in the literature and that calculated from this inves
tigation are given in table 7.3. The same is done for the
ratio between the rate constant of the ammoxidation of
acrolein and that of the ammoxidation of propene (R2).
R1 R2 T (K)
Cathala et al (48) .8 5.4 733
Kolchin et al (49) 1.8 - 750
Callahan et al (50) 1.8 2 698
Wragg et al (51) 1.9 26 673
this investigation 1.4 12 673
Table 7.3. Ratios of rate constants of the various reac
tions (for definition see text).
The bismuth molybdates used by these authors were dif
ferent in composition or prepared in different ways. Only
Wragg et al used a catalyst which was prepared according
to the same method A as our catalyst. The ratios R1 and R2
131
are calculated for different temperatures and the spread
in the values is in the direction that can be derived from
the activation energies given in table 7.4. The ratio R2 decreases at increasing temperatures, whereas the ratio
R1 is less temperature dependent. The activation energies
show a considerable spread, which will be caused by the
use of different catalysts and by the different tempera
ture ranges used for the calculation of Ea.
Ea (kJ mol-l) (T > 673 K)
p -~- ACO P -+ ACN ACO + ACN
Callahan et al (50) - 75 29
Wragg et al (51) 83a 38b -Cathala et al {52) 159c 71 -Monnier et al (53) 63 - -this investigation 62 60 -a temperature range unknown, value probably at 673 K b temperature range unknown c temperature range 657-754 K
Table 7.4. Activation energies of the three overall reac
tions.
The activation energy for the propene oxidation given by
Cathala et al is very similar to the value of 163 kJ mol-l
that we calculated for the activation energy of oxygen
diffusion at temperatures below 673 K (see section 6.3.3).
although the experiments by Cathala were carried out above
as well as below 673 K.
If we restrict ourselves to the treatment of the kine
tics of the three overall reactions given in table 7.4 we
conclude from the preceding sections that some of the
elementary steps occur in more than one of the three
132
overall reactions. This is shown in the following scheme,
which does not take account of all elementary steps nor
The first order in propene, both for oxidation and
ammoxidation requires that the surface coverage of the c3 species that enters the rate determining step is propor
tional to the propene gas phase concentration. This means
that this surface species must be formed via a reversible
reaction from the gas phase propene and the degree of
coverage for this species is relatively low. This indi
cates that reaction 2 of the scheme will be rate deter
mining. The fact that the overall rate constant for the
ammoxidation reaction is 1.4 times the rate constant for
the oxidation reaction is ascribed to a higher coverage
of the surface with acrolein than with acrylonitrile. This
is supported by the fact that the rate of the ammoxidation
reaction at 673 K remains first order in propene up to a -3 propene gas phase concentration of about 3 mol m , where-
as for the oxidation reaction deviation from the first
order dependency already begins at a propene concentration
of about 1.4 mol m- 3 (see figure 6.6 and 6.18}. Moreover
the enthalpies of activation for oxidation and ammoxida
tion have almost the same values i.e. 62-102 kJ mol-l and -1
60-97 kJ mol respectively for the same temperature
ranges (see figure 6.7 and 6.23}.
133
The observation that the rate of ammoxidation of acro
lein is more than one order of magnitude higher than that
of propene leads us to the conclusions that the rate of
adsorption of acrolein must be much greater than the ad
sorption of propene and further that the steps 7 and 8
also must be very fast and not rate determining in the
ammoxidation of propene. This is in agreement with the ob
servation that the ammoxidation of acrolein is only first
order in acrolein for an acrolein gas phase concentration
below 1 mol m- 3 (see figure 6.12), and that the inhibition
by acrylonitrile is smaller than the inhibition by acro
lein i.e. acrylonitrile desorbs much faster than acrolein.
As further little or no acrolein is found in the ammoxida
tion of propene, provided ammonia is present in excess,
we also conclude that the steps 7 and 8 are fast as well
in comparison with the steps 4 and 5, see also section 7.4.3,
7.6. Selectivities in the acrylonitrile synthesis reaction
The almost constant and high value of the integral pro
pene selectivity towards acrylonitrile (SIPA) and the
strong variation of the integral ammonia selectivity
(SINA)' as we have already mentioned in chapter 6, are
peculiar phenomena in this process. All other conditions
constant, the variation of SINA can be related to the molar ratio ammonia/propene Mat the reactor inlet (M ),
0 From experiments carried out at very short residence
times we calculated the initial rates of formation of the
nitrogen containing products at 673 K and from that the
fractional ammonia selectivity towards acrylonitrile
(SFNA) according to the definitions of the fractional
selectivity given by the IUPAC (1),
(7 .1)
could be calculated,
134
As shown in figure 7.1 between (SFNA) and (M/M+1) at
.6
(ACN} mol m-3
.4 A 0 0 .1 a ,2 9 .3
.2· T=673 K A
.2 .4 .6 .8 1.0 - M/M+l
Figure 7.1 Fractional selectivity of ammonia towards acrylonitrile (SFNA) as a function of M/M+l. Ammoxidation of propene.
the reactor inlet ~xists an almost linear relation. This can be interpreted as an illustration of the first order dependency in ammonia of the rate of nitrogen formation.
At increasing conversion i.e. increasing acrylonitrile
concentrations we calculated an increase of SFNA at the same (local) value of M in the flow reactor. The increase
of SFNA at decreasing M/(M+1) can be explained by the presented model. It is assumed that for the nitrogen for
mation propene and ammonia compete for the same Mo-sites.
The increase of SFNA at increasing acrylonitrile concentrations can be explained in the same way as set out in
135
section 7.4.2 for the influence of acrolein on the nitro
gen formation.
As the rate of nitrogen formation is first order in
ammonia it will be clear that the greatest increase of
SFNA by acrylonitrile will be obtained at high M/(M+1)values as was experimentally observed. However the frac
tional selectivity of ammonia towards acrylonitrile never
exceeds the value of .8 under the experimental conditions.
References
1. Manual of Symbols and Terminology for physico chemical Quantities and Units, Appendix II, Part II Hetero
geneous Catalysis, Adv. Catai. ~, 351 (1977)
2. Matsuura, I., J. Catal. 11• 420 (1974)
3. Grasselli, R.K., Suresh, D.D., J. Catal. ~. 273 (1972)
4. Gates, B.C., Katzer, J,R. and Schuit, G.C.A., "Chemi
stry of Catalytic Processes", chapter IV, McGraw Hill
NBR nitrile-butyl-rubber NTP normal temperature and pressure
o oxygen P propene
P~ P~clet number ppm parts per million
mol kg m-3
s2
ppm
Re = ~. Reynolds number (equation 5.11) avq>u
141
pud Redp = ~ Reynolds number with ref. to particle
SAN
Sc SOHIO
TLV
TWA
Subsar>ipts
a
b
cat e
eq
f
F
I
L
0
p
r
s
t
Symbol
c
142
diameter
styrene-acrylonitrile copolymer
Schmidt number Standard Oil Company of Ohio
Treshold Limit Value
time weighted average
activation, adsorbed, axial
bulk
catalyst
effective, reactor outlet equilibrium
fluid
fractional
integral
liquid state, bed length
initial value, reactor inlet
particle, pressure, pulse
reaction, reoxidation, radial
surface, superficial at time t
2-0 vacancy
ppm
Summary
This thesis deals with the synthesis of acrolein and
acrylonitrile over a bismuth molybdate catalyst. During
the last twenty years catalysts based on this compound
played an important role both in the commercial production
of acrylonitrile and in catalytic research with respect to
the elucidation of the mechanism of the selective oxida
tion of olefins over oxide catalysts.
Bismuth molybdate is not only a catalyst for the oxi
dation and ammoxidation of propene but catalyzes at the
same time also the oxidation of ammonia to nitrogen and
the ammoxidation of acrolein to acrylonitrile.
In order to contribute to the elucidation of the reac
tion mechanism we have investigated the kinetics of these
four reactions. The experimental work can be divided into
two parts:
1. The determination of the kinetics of these four reac
tions in continuously operating fixed bed flow reactors
under differential and integral conditlons at tempera
tures between 648 and 723 K and at atmospheric pressure;
2. An investigation into the behaviour.of bismuth molyb
date acting as oxidant in the absence of oxygen and in
the presence of substoichiometric amounts of oxygen ' and ammonia. These reactions have been studied in a
thermobalance and in a socalled pulse reactor.
At temperatures above 673 K and in the range of the
concentrations of this investigation the oxidation and
ammoxidation reactions are all first order in the organic
reactant and zero order in oxygen. At temperatures below
673 K the order in the organic reactant decreases with
increasing concentrations. At these temperatures the rate
of propene conversion is also inhibited by acrolein. The
ammoxidation of propene has a slightly negative order in
ammonia. The catalyst shows initially a high activity for
the oxidation of ammonia to nitrogen, which reaction is
first order in ammonia. The ammoxidation of acrolein is
zero order in ammonia. The activation enthalpies for the
143
oxidation and the ammoxidation of propene are very similar -1 . .
and increase from about 60 kJ mol at temperatures above 673 K to about 100 kJ mol-l at temperatures below 673 K.
Experiments in a thermobalance in the same temperature
range have shown that the initial rate of catalyst weight
loss is a function of the propene concentration. At tem
peratures below 673 K even at a low degree of reduction
the oxygen diffusion in the catalyst has a major influence
on the overall rate of reduction of the catalyst. The ad
sorption of acrolein on a partially reduced catalyst
appears to be a relatively slow process. The reoxidation
of a reduced catalyst with gas phase oxygen is an extreme
ly fast reaction and is first order in oxygen at tempera
tures above 673 K. The oxidation of propene with substoi
chiometric amounts of oxygen and at low propene conversion
can be carried out under stationary conditions with the catalyst operating in a partially reduced state, Under
these conditions the rate of reaction is first order in
oxygen for low oxygen concentrations and the amount of
acrolein adsorbed is a function of the degree of reduction and of the temperature.
Pulse experiments with propene-helium gas mixtures con
firmed the adsorption behaviour of partially reduced bis
muth molybdate for acrolein. When small quantities of
oxygen are added the rate of acrolein formation per pulse is again a function of the partial pressure of oxygen.
From experiments with ammonia-propene-helium gas mixtures
without oxygen it became clear that the rate of oxygen
suppletion by the catalyst is enhanced in the presence of
ammonia in the same way as in the presence of gas phase . 2- 2-
oxygen and it has been assumed that 0 and NH species perform the same function.
The presence of ammonia as the third reactant in the acrylonitrile synthesis is an important expedient to de
rive a mechanistic model from the experiments and from
literature data. We have concluded that ammonia molecules
are activated on two different active centres in two different ways. The activation for the ammoxidation of
144
propene and acrolein occurs on the active centre connected with bismuth, whereas that for the oxidation of ammonia
occurs on two different active centres connected with
molybdenum and with bismuth. From this we have concluded that propene is activated on molybdenum. The activation of oxygen takes place after the reduction of the catalyst
to some extent, according to the reduction-oxidation me
chanism proposed by Mars and van Krevelen and is related
to the diffusion of oxygen in the catalyst. From the kinetic data we have concluded that the rate
determining step of the oxida~ion and ammoxidation of
propene is the abstraction of the first proton of propene.
The acrolein ammoxidation may either proceed via a con
certed mechanism or via an adsorbed c3H4 intermediate.
145
146
Samenvatting
In dit proefschrift wordt de synthase van acroleine en
acrylonitril behandeld. Bismuth molybdaat wordt gebruikt
als katalysator. Gedurende de laatste twintig jaar hebben
katalysatoren op basis van deze verbinding niet alleen
een belangrijke rol gespeeld in deproduktie van acrylo
nitril maar ook heeft bismuth molybdaat in het fundamen
teel katalytisch onderzoek naar het mechanisme van de
selectieve oxidatie van olefinen met behulp van oxidische
katalysatoren een centraleplaats ingenomen.
Bismuth molybdaat is niet alleen een katalysator voor
de oxidatie en ammoxidatie van propeen, maar versnelt
tegelijkertijd ook de oxidatie van ammoniak tot stikstof
en de ammoxidatie van acroleine tot acrylonitril.
Om een bijdrage te leveren aan de opheldering van het
reactiemechanisme hebben we deze vier reacties aan een
kinetisch onderzoek onderworpen. Het experimentele werk
kan in twee stukken worden onderverdeeld:
1. De bepaling van de kinetiek van deze vier reacties in
continu werkende reactoren met een vast katalysatorbed
zowel onder differentiele als onder integrale kondities
bij temperaturen tussen 648 en 723 K en onder atmos
ferische druk;
2. Een onderzoek naar het gedrag van bismuth molybdaat
als oxidatiemiddel in afwezigheid van zuurstof en bij
gebruik van ondermaat zuurstof of ammoniak. Deze reac
ties zijn bestudeerd met gebruikmaking van een thermo
balans en een zogenaamde pulsreaktor.
Bij temperaturen boven 673 K zijn in het onderzochte
concentratie gebied de oxidatie en ammoxidatie reacties
eerste orde in de organische reaktant en nulde orde in
zuurstof. Beneden 673 K daalt de orde in de organische
reaktant bij toenemende concentraties. Bij deze tempera
turen wordt de omzettingvan propeen door acroleine geremd.
De ammoxidatie van propeen vertoont een kleine negatieve
orde in ammoniak. De katalysator is initieel zeer actief
in het oxideren van ammoniak tot stikstof, een reactie die
117
eerste orde in anunoniak is. De anunoxidatie van acroleine
is nulde orde in ammoniak. De activeringsenthalpieen voor
de oxidatie en de ammoxidatie van propeen zijn vrijwel
gelijk en nemen toe van ongeveer 60 kJ mol-l bij tempera•
turen hoven 673 K tot ongeveer 100 kJ mol-l bij tempera
turen beneden 673 K.
Experimenten met propeen-helium gasmengsels in het
zelfde temperatuurgebied in een thermobalans hebben aan
getoond dat de initiele snelheid waarmee het katalysator
gewicht afneemt een functie is van de propeen concentra
tie. Bij temperaturen beneden 673 K en zelfs bij lage
reduktiegraden heeft de zuurstofdiffusie in de katalysator
een grote invloed op de reduktiesnelheid van de katalysa
tor. De adsorptie van acroleine op een gedeeltelijk gere
duceerde katalysator blijkt vrij langzaam te verlopen. De
reoxidatie van een gereduceerde katalysator met zuurstof
is een zeer snelle reactie die bij temperaturen hoven 673
K een eerste orde gedrag in zuurstof vertoont. De oxida
tie van propeen met ondermaat zuurstof kan bij een lage
propeen conversie stationnair verlopen, waarbij de kata
lysator zich in een gedeeltelijk gereduceerde toestand
bevindt. Onder deze omstandigheden is de reactie bij lage.
zuurstofconcentraties eerste orde in zuurstof. De gead
sorbeerde hoeveelheid acroleine onder stationnaire om
standigheden is een funktie van de reduktiegraad en van
de temperatuur.
Puls experimenten met propeen-helium gasmengsels hebben
bevestigd dat gedeeltelijk gereduceerd bismuth molybdaat
acroleine adsorbeert. Als kleine hoeveelheden zuurstof
worden meegepulst is de vormingssnelheid van acroleine een
funktie van de partiele druk van zuurstof. Experimenten
met ammoniak-propeen-helium gasmengsels zonder zuurstof
hebben aangetoond dat de zuurstof afgiftesnelheid van de
katalysator in aanwezigheid van ammoniak op dezelfde wijze
wordt verhoogd als die in aanwezigheid van zuurstof zonder
ammoniak tijdens de oxidatie van propeen. Er wordt verondersteld dat o2- en NH2- species dezelfde funktie
vervullen bij de synthese van acroleine respectievelijk acrylonitril.
148
De aanwezigheid van ammoriiak als de derde reaktant in
de acrylonitril synthase is een belangrijk middel om een
mechanistisch model af te leiden uit de experimenten en de literatuurgegevens. We hebben geconcludeerd dat ammo
niak op twee verschillende manieren wordt geactiveerd. De
activering van ammoniak in de ammoxidatie van propeen en acroleine gebeurt op een "active centre" samenhangend met
bismuth, terwijl die voor de oxidatie van ammoniak tot
stikstof op twee verschillende "active centres" plaats
vindt, nl. op een bismuth- en op een molybdeen-centre.
Propeen wordt op het laatste "active centre" geactiveerd. De activering van zuurstof vindt plaats nadat de kataly
sator enigszins gereduceerd is volgens het Mars-van Kre
velen redox mechanisme en de inbouw van zuurstof in de
produkten geschiedt via een diffusie door het katalysator rooster.
Uit de kinetische gegevens hebben we eveneens gecon
cludeerd dat de snelheidsbepalende stap van de oxidatie
en ammoxidatie van propeen de eerste proton afsplitsing
van propeen is. De ammoxidatie van acroleine verloopt via een concerted mechanisme of via een geadsorbeerd c3H4 intermediair.
149
Dankwoord
Het onderzoek weergegeven in dit proefschrift is tot
stand gekomen da~ij de medewerking van velen. In het
bijzonder geldt dit voor de leden van de vakgroep Chemi
sche Technologie van de Afdeling der Scheikundige Techno
logie. Ik dank speciaal de heren D. Francois, J. van
Hettema, w. van Lith, G. van de Put, A. Sommen, L. Verhaar
en R. van der Wey, die steeds bereid waren de experimenten
te laten slagen.
Veel dank ben ik verschuldigd aan de afstudeerders, de
heren E. van Poelvoorde, P. Derks, J. van Laarhoven, P.
Linders, J. Voet, A. Tjang, R. van Collenburg, N. Willem
sen, P. Evertse, P. Florack, F. Hautus, A. de Laet, F.
Kroes, H. Houben, F. Douven, J. Spork, P. Oostveen en H.
van Liempt, die enthousiast aan het onderzoek hebben mee
gewerkt. Anderen die hebben bijgedragen dank ik in de
persoon van de heer R. Poulina, die tijdens twee stages
metingen heeft verricht.
Mijn dank gaat uit naar mijn oud-collega's van de werk
groep Gasfase reacties dr. J. Steenhof de Jong, dr. H.
Heynen en dr. M. Boersma met wie ik over dit onderzoek
interessante discussies h.Elb gevoerd. De heer Ph. Batist, die op kenmerkende wijze dit werk gestimuleerd heeft dank
ik zeer. Voorts dank ik dr. G. Visser voor de wijze waarop hij heeft bijgedragen tot de verdieping van het inzicht in
de katalysator structuur en mijn collega's van andere vak
groepen voor de nuttige wetenschappelijke informatie die
zij mij hebben verschaft.
Bij de vormgeving van het proefschrift heb ik de onmis
bare steun gekregen van de heren W. van Lith en R. van der
Wey. Mevr. E. Eichhorn-Meijers heeft op concientieuze
wijze het typewerk verricht. Hen allen dank ik zeer.
Gaarne maak ik van deze gelegenheid gebruik om ook
anderen, buiten mijn gezin en mijn werkverband, te danken
voor hun stimulerende bijdragen.
150
STELLINGEN
1 Otsubo et al en Miura et al houden - gelet op de kondi
ties waaronder zij de katalysatoren bereiden - bij de
verklaring van het mechanisme van de acroleine synthese
over bismuth molybdaat onvoldoende rekening met de mo
gelijke aanwezigheid van vrije oxiden en met de beweeg
lijkheid van de zuurstof in de katalysator.
T. Otsubo, H. Miura, Y. Morikawa, T. Shirasaki,
J. Catal. 240 {1975)
H. Miura, T. Otsubo, T. Shirasaki, Y. Morikawa,
J. Catal. 56, 84 (1979)
Dit proefschrift, hoofdstuk 7
2 Door voorbij te gaan aan o.a. het sterisch effekt van
de substituenten komen van Krevelen en Chermin met hun
berekeningsmethode voor de plafond temperatuur van een
polymerisatie reactie voor verschillende op dezelfde
plaats gesubstitueerde monomeren tot dezelfde uitkomst,
hetgeen in strijd is met de experimenteel gevonden
waarden.
D.W. van Krevelen, Properties of Polymers, 2nd ed.
Elsevier, Amsterdam 1976
R.W. Lenz, Organic Chemistry of Synthetic High
Polymers, Interscience, New York 1967
J. :&J:"andru:;>, E.H. Immergut, Polymer Handbook,
John Wiley, New York 1965
3 De onduidelijkheid met betrekking tot het begrip selec
tiviteit in de chemie is door de IUPAC slechts gedeel
telijk weggenomen. Het onderdeel integrale selectivi
teit voor een reactie uitgevoerd in een continu bedreven
reactor moet nog worden gedefinieerd.
Manual of Symbols and Terminology for physico che
mical Quantities and Units, Appendix II, Part II,
Heterogeneous Catalysis, Pure & Appl. Chern~ 46, 71 (1976)
4 Voor een juistE;! toepassing van primaire, droge batte
rijen is het noodzakelijk, zowel ten aanzien van energie
gebruik als ten aanzien van milieu aspekten dat de eti
kettering in plaats van de weinig zeggende informatie
"medium duty", "transistor batterij" of "long life" dui
delijke gegevens verstrekt over de scheikundige samen
stelling, kapaciteit, belastbaarheid en houdbaarheid van
de batterij.
Consumentengids 24, 259 (1976)
Consumentengids 25, 14 (1977)
5 De interpretatie van de veranderingen in het 13c NMR
spectrum van 1-buteen door chernisorptie op zeolieten en
de vertaling daarvan naar elektronen dichtheden c.q. verschuivingen leidt tot verkeerde conclusies.
D. Denney, W.M. Mastikhin, s. Narnba, J. Turkevich,
J. Phys, Chern. 82, 1752 (1978)
6 De bewering van Wauters et al dat gesilyleerde polyolen
in het algerneen geen (geprotoneerde) molekulaire ionen
geven in de chernische ionisatie rnassaspektrornetrie met isobutaan als reaktiegas, is onjuist.
E. Wauters, F. Vangaever, P. Sandra, M. Verzele,
J. Chrornatogr. 170, 133 {1979)
A.C. Schoots, F.E. Mikkers, C.A.M.G. Cramers,
s. Ringoir, J. Chromatogr. Biomedical Appl. (verschijnt binnenkort)
7 Minstens vier van de diffusiepaden in het systeem
Cu-Ni-Zn die Wirtz en Dayananda presenteren als resul
taat van hun onderzoek zijn op grond van de wet van be
houd van rnassa onmogelijk. Hun theoretische beschouwingen omtrent het verloop van de diffusie in dit systeern komen
hierdoor op losse schroeven te staan.
L.E. Wirtz, M.A. Dayananda, Metal. Trans. A 8A, 567 {1977)
8 Aangezien vele chemische en fysische wegen voor milieu
belastende stoffen naar de oceaan leiden, verdient het
aanbeveling de bestudering van bodem-, lucht- en water
verontreiniging uit te voeren in samenhang met de
oceanografie.
9 Hoewel het een goed gebruik is experimenten reeksen
zorgvuldig te plannen, moet de betekenis van het gelso
leerde, ad hoc experiment niet worden onderschat.
P.C. Sander, Intreerede, T.H. Eindhoven (1978)
10 Door de toepassing van zig-zag kanalen in een centri
fugaal-zifter wordt het principe van het zuivere meer
trapsproces, zoals dit geldt in een zig-zag zifter in