Arab Development Challenges Background Paper 2011/01 The ADCR 2011: Arab Human Development and Deprivation: Phenomenal Progress or Mixed Results? Khalid Abu-Ismail, Abdel-Hameed Nawar, Asmaa Abdel-Nabi and Gihan Abou Taleb
Transcript
Arab Development Challenges Background Paper 2011/01
The ADCR 2011: Arab Human Development and Deprivation: Phenomenal Progress or
Mixed Results?
Khalid Abu-Ismail, Abdel-Hameed Nawar,
Asmaa Abdel-Nabi and Gihan Abou Taleb
ii
United Nations Development Programme Arab Development Challenges Report
Background Paper 2011/01
The ADCR 2011:
Arab Human Development and Deprivation: Phenomenal Progress
or Mixed Results?
Khalid Abu-Ismail, Abdel-Hameed Nawar,
Asmaa Abdel-Nabi and Gihan Abou Taleb*
Khalid Abu-Ismail is Poverty and Macroeconomics Adviser at United Nations Development Programme- Regional Centre in Cairo (UNDP-RCC). E-mail: [email protected] Abdel-Hameed Nawar is Lecturer at Cairo University. E-mail: [email protected] Asmaa Abdel-Nabi is Research Assistants at UNDP-RCC. E-mail: [email protected] Gihan Abou Taleb is Research Assistants at UNDP-RCC. E-mail:[email protected] Comments should be addressed by email to the author(s)
EAP East Asia and Pacific (developing countries only)
ECA Europe and Central Asia (developing countries only)
GCC Gulf Cooperation Council
GDP Gross domestic product
GNI Gross national income
HDI Human Development Index
HDR Human Development Report
HIES Household Income Expenditure and Consumption Survey
HPI Human poverty index
KSA Saudi Arabia
LAC Latin America and Caribbean (developing countries only)
LDC Least developed countries
LEED Leadership in Environment, Energy and Design
LIC Low income countries
MD Multi -Dimensional
MDGs Millennium Development Goals
MIC Middle income countries
MICS Multiple Indicator Cluster Survey
MPI Multi-Dimensional Poverty Index
OPHI Oxford University Poverty and Human Development Initiative
OPT Occupied Palestinian Territories
PPP Purchasing power parity
SAS South Asia (developing countries only)
SSA Sub-Saharan Africa(developing countries only)
UAE United Arab Emirates
UNDP United Nations Development Programme
UNICEF United Nations Children’s Fund
WHS World Health Survey
1
Introduction The debate about the development model followed in the Arab region has become more intense following the recent wave of political contestation in the region, despite a long period of sustained increases in GDP. Clearly the increase in income has not been sufficient to cement social cohesion and enlarge the freedoms and sense of dignity enjoyed by Arabs. This is not unanticipated, as the development model has not followed the path of people-centred development that UNDP has been championing since the launch of the first Human Development Report in 1990. The economistic vision of development, development by means of increased production of goods and services, can easily go hand in hand with less social cohesion, usurpation of traditional rights and freedoms and undermine human dignity by treating human beings as commodities. Human development, while clearly dependent on material welfare and the provision of the basic necessities of life, is really about people having greater freedom from the elements and from oppressive dependence on other human beings. Human development is about creating a society in which human dignity is respected and human agency is promoted. It is thus inherently in contradiction with situations of mining of environmental assets and denial of basic human dignity. No wonder that many years of unbalanced development led to cries of dignity, freedom and social justice in the Arab region. The human development paradigm postulates a development process that expands human capabilities while increasing material production. In a practical sense it entails/envisions a development model, which spends heavily on improving the human condition by investing in accessible, quality and liberating education that empowers individuals to better understand and respond to developmental opportunities. It also implies general provision of quality health care services to safeguard the sanctity of human life and mitigate and respond to debilitating health conditions that undermine human dignity. The model assigns equal value to all humans and as such is inherently incompatible with large degrees of inequality in income and wealth. In this paper we are also concerned with measuring human development achievements and deprivation from human development, which can also be appropriately defined as human poverty. In general, measuring the level of poverty in a country or society can be a challenge – if only because of the subjective element involved in determining who was ‘poor’. There was a widely accepted idea that for any given society, poverty exists if an individual (or household) was unable to attain a certain standard of living, or ‘well-being’; that was deemed the minimum acceptable by the standards of that society. 1 Most societies also share, however, a concept of ‘absolute’ poverty that goes beyond any subjective standards. When people lack the basics of nutrition, health, sanitation and housing, they are poor by the principles of any society. ‘Well-being’ is thus multidimensional and driven by multiple deprivations – the lack of food and shelter, but also the lack of incomes and opportunities, of access to services and of ways to protect themselves against sudden shocks.2 These are, therefore, not driven purely by monetary factors. More broadly, poverty involves the inability to command resources, such as being healthy and literate. Poverty in this latter sense would constitute a lack of ‘capabilities’. The freedom approach offers a broader conceptual framework for understanding poverty and human development compared to other approaches, which identify development with increases in per capita income, industrialization, technological advance, or social modernization. The richness of this approach is best captured in terms of five instrumental freedoms that have immediate policy relevance: political freedoms, including “the political entitlements associated with democracies in the broadest sense”; economic facilities, in the
2
sense of the “opportunities that individuals respectively enjoy to utilize economic resources for the purpose of consumption, or production, or exchange”; social opportunities in the sense of “the arrangements that society makes for education, healthcare and so on”; transparency guarantees in the sense of “the freedom to deal with one another under guarantees of disclosure and lucidity”; and, protective security in the sense of the provision of a “social safety net for preventing the [vulnerable sections of society] from being reduced to abject misery and in some cases even starvation and death”. These “instrumental freedoms tend to the general capability of a person to live more freely, but they also serve to complement one another”.3 Development achievement on the basis of this approach, which is now being measured and regularly reported, by the Human Development Index (HDI), is crucial to grasp the concept of human poverty since "poverty means that opportunities and choices most basic to human development are denied".4 The Human Poverty Index (HPI) and the more recent Multi-dimensional Poverty Index (MPI) are therefore mirror images of the HDI that reflect deprivation from “instrumental freedoms”. Anchored in UNDP’s human development approach, this paper paints a broad picture of human development and human poverty in the Arab region by comparing its human development and poverty indicators with those of other developing regions. The paper also evaluates the state of human development and poverty in Arab countries relative to their respective income levels. Finally, the paper makes use of household survey data to present new findings regarding the sub-national disparities in multidimensional poverty, health and education within Arab countries and ends with concluding remarks.
Human Development The 2010 HDR introduces several reforms to the indicators and methodology used to calculate the Human Development Index. In previous reports the basic dimensions of the HDI were measured by life expectancy at birth; adult literacy rate and combined gross enrolment in education; and GDP per capita in purchasing power parity US dollars (PPP US$) respectively. In the 2010 report, the indicators measuring access to knowledge and a decent standard of living have changed. Namely, access to knowledge is measured by: mean years of adult education, which is the average number of years of education received in a life-time by people aged 25 years and older; and expected years of schooling for children of school-entrance age, which is the total number of years of schooling a child of school-entrance age can expect to receive if prevailing patterns of age-specific enrolment rates stay the same throughout the child's life. Additionally, the standard of living is now measured by Gross National Income (GNI) per capita in PPP US$, instead of Gross Domestic Product (GDP) per capita in PPP US$. Moreover, a multiplicative method of aggregation the indicators into an index is used. That is aggregation is made using the geometric mean of the dimension indices composing the HDI. Based on this new methodology, in Chapter 2, the report presents a list of ten “top movers” – countries that have seen the greatest improvements in human development, as measured by the Human Development Index, relative to their 1970 starting point. Among these, the presence of five Arab countries (Oman, Saudi Arabia, Tunisia, Algeria and Morocco) is striking. The 2010 HDR, however, adopts a specific definition of success – the actual rate of change in the HDI relative to a country’s starting point, calculated as the residual of a regression of the change in HDI on the country’s initial HDI level. It measures how well countries did in comparison to other countries with similar initial HDI levels. The exceptional performance of these countries, however, does not seem to be sensitive to the definition of success adopted: "regardless of how we measure it, the performance of these countries in health and education indicators has been stellar." 5
3
For example, in 1970, a baby born in Tunisia could expect to live 54 years; one born in China, 62 years. Today, life expectancy in Tunisia has risen to 74 years, a year longer than that of China. So while China’s per capita income grew almost three times as fast as Tunisia’s, Tunisia’s life expectancy grew twice as fast as China’s. Since it also significantly outperformed China on the education front, Tunisia gives China a run for its money in the overall development story (as captured by the HDI). Table 1: Ranking of Arab countries in terms of change in HDI, 1970-2010 and 1990-2010
One way to illustrate how striking the progress of these countries was is to look at how well they did in comparison with other countries according to the three components of the HDI. As argued in the report, the comparison between the evolution of life expectancy in these countries and the world average over time, as well as that of a subset of countries with a similar starting point shows that they started well below the world mean in 1970 but by 2010 had overtaken the rest of the world – and significantly outperformed countries that started off in the same place. Similar patterns characterize their performance on the education front. Since almost all Arab countries had very low baselines for health and education in 1970, the very high disparity between where they are now compared to what was expected given their initial conditions in the 1970’s is not surprising (this is particularly true for Oman). Interestingly, this was not the case for economic growth. The average growth rate of per capita income in Tunisia, Algeria and Morocco, which are among the top-ten movers, was only 2.1%, just slightly above the world average of 1.7%. In terms of growth, the best performer of the lot is Tunisia (3%) – but even here 19 countries had higher growth rates for the forty-year period. In contrast, only six countries outperformed Tunisia in terms of improvements in the HDI’s combined measure of health and education. As noted in the report, this illustrates a broader point. There is a remarkably weak correlation between economic growth and improvements in health and education. The correlation between these two variables over a forty-year period is 0.13 and is not statistically significant. Also striking is that the list does not include most of the Arab oil-rich countries on the income improvements. This is explained, however, in part by the fact that the GDP per capita figures are in constant PPP US$ so they measure the increase in real value added. Hence, the higher level of GDP per capita for oil-rich Arab states in 1970 may explain, to some extent, the relatively lower growth rates achieved over the entire period. The long-term development record of the region thus demonstrates that human development achievements are possible even without fast economic growth, a story that contrasts sharply
4
with the conventional stories of development success based on economic growth (such as the diversified, export-lead economies of the Asian Tigers). Despite what may be regarded as phenomenal progress, however, if 1970 is instead taken as the base year, Arab countries still lag behind on human development. This is clear in Figure 1.A; which shows the HDI and GNI ranks in 2010 for 180 developing countries. All Arab countries (with the exception of Tunisia, Jordan and Comoros) lie above the regression line that separates countries that have higher GNI relative to their HDI from countries that have lower GNI relative to their HDI. Thus, with the exception of Tunisia, all Arab countries, which have been identified by the global report as top-movers, still lag behind on human development relative to their income levels. The same picture emerges from the location of Arab countries on the regression line in Figure 1.B, which depicts the cross-sectional relationship between HDI and GDP per capita for the same year. Figure 1: GNI per capita rank versus HDI rank (A) and HDI and GDP per capita (B) for Arab countries and developing regions, 2010
(A) (B)
Source: Based on data from Human Development Report, 2010.
Further compelling evidence, demonstrating the sensitivity of the measure of human development achievement to the choice of the period, is also provided in Table 1. Taking 1990 as the base year, instead, changes the picture dramatically. First, HDI rakings drop for all Arab countries with the exception of Sudan, Kuwait, Djibouti and Lebanon, all of which lag behind in the ranking. Second, none of the top-ten Arab countries retain their position and Oman, the highest ranking Arab country for the 1970-2010 period, regresses to the 15th place and is overtaken by Morocco and Tunisia (ranked 12thand 14th respectively). Rankings for the non-income HDI also decline for the majority of Arab countries and only Oman and Saudi Arabia retain a leading position among the top-ten countries. Results for GDP, however, are more ambiguous, with countries equally divided among winners and losers.
To sum, the region's more recent human development record indicates that the pace of progress has declined significantly since 1990. This conclusion is also consistent with the findings of the Arab MDGR (2010), which points to a mixed performance with respect to the attainment of MDGs when 1990 is taken as the base year. The report classifies Arab countries into three main groups: countries that are likely to achieve MDGs targets (mainly GCC countries); countries with mixed progress and mixed opportunities, which constitute the bulk of Arab middle-income countries (MICs); and countries that are unlikely to achieve MDGs targets (mainly LDCs and MICs where security issues pose a serious threat to the achievement of MDGs, namely Iraq and the Occupied Palestinian Territory). The report also shows, however, that progress has been heterogeneous even across the various goals, with many Arab countries lagging significantly behind on employment, hunger, poverty and maternal health targets in particular. None of these indicators are directly captured by the HDI.
Algeria
Bahrain
Comoros
Djibouti
Egypt
Jordan
Kuwait Libya
Mauritania
Morocco
Qatar
KSA
Sudan
Syria
Tunisia
UAE
Yemen
0
20
40
60
80
100
120
140
160
180
0 20 40 60 80 100 120 140 160 180
HD
I R
ank
GNI per capita Rank
BHR KWT
OMN
QAT KSA
UAE
DJI SDN
DZA
LBY
MAR
TUN
EGY
JOR LBN
AR EAP
ECA
LAC
SAS
SSA
DR
0.2
0.3
0.4
0.5
0.6
0.7
0.8
0.9
1.0
4 5 6 7 8 9 10 11 12
Hybrid
HD
I
Ln GDP per capita, PPP
5
To further explain how the choice of measurement methodology adopted by the HDR has an upward bias on Arab development achievements, we may, for the sake of illustration, propose an alternative methodology that measures progress in closing the HDI deficit between Arab countries and countries with the highest HDI score. Although this is a very different question to ask, it is nonetheless of direct relevance to any assessment of real progress in human development. Table 2: Evolution of HDI and real GDP per capita gaps between Arab countries and developing regions and highly developed economies and rank of convergence, for example, shows the results of one attempt to undertake such an exercise. The first column shows the ratio of the HDI of the country to the simple average for the countries with highest ten HDIs in 2010. This ratio is then deducted from the same ratio in 1970. Hence, countries that were most successful in closing the HDI gap will record the highest positive percentage change between both ratios. The third column ranks developing countries accordingly. The same procedure is repeated for the GDP in the second and fourth columns. Table 2: Evolution of HDI and real GDP per capita gaps between Arab countries and developing regions and highly developed economies and rank of convergence, 2010
Country/Region HDI Gap GDP Gap HDI Rank GDP Rank
Bahrain 14% -33% 59 68
Kuwait 3% -75% 79 93
Oman 88% 63% 4 14
Qatar 6% -57% 70 83
Saudi Arabia 49% -39% 19 75
United Arab Emirates 23% 26% 41 25
Djibouti 20% -80% 44 95
Sudan 40% -3% 27 41
Algeria 44% -29% 24 64
Libya 29% -77% 34 94
Morocco 54% 20% 14 28
Tunisia 47% 62% 22 15
Egypt 41% 25% 26 26
Jordan 21% -17% 43 53
Lebanon 3% -23% 78 58
Arab countries 43% -10% 3 5
East Asia & Pacific 69% 526% 1 1
Europe & Central Asia -2% 1% 6 3
Latin America & Caribbean 14% -8% 5 4
South Asia 50% 78% 2 2
Sub-Saharan Africa 35% -31% 4 6
Developing region 38% 58%
Source: Authors estimates based on data from Human Development Report, 2010.
Although all Arab countries were successful in closing the HDI gap, the results in Table 2 confirm our doubts regarding any phenomenal progress. Only Oman is ranked within the top ten HDI achievers using this methodology, followed by Morocco and Saudi Arabia as a distant second and third (ranked fourteen and nineteen, respectively). The evolution of the GDP per capita gap, however, is strikingly unimpressive by comparison with the HDI where a divergence from the average per capita of the richest twenty countries, rather than a convergence, was recorded for Arab countries. Thus, compared to other developing regions, Arab countries ranked third and fifth, in terms of their ability to close the HDI and GDP per capita gaps, respectively. As one would expect, China (and hence the East Asia & Pacific region) ranks first on both indicators according to this methodology.
6
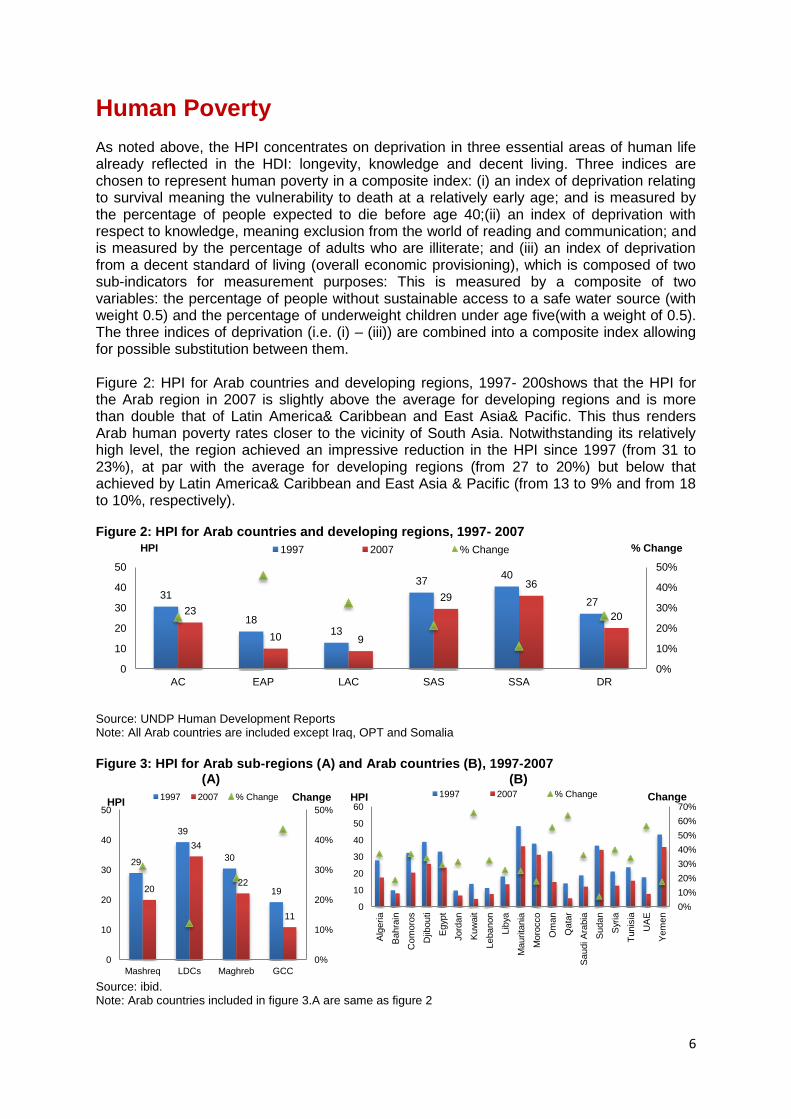
Human Poverty As noted above, the HPI concentrates on deprivation in three essential areas of human life already reflected in the HDI: longevity, knowledge and decent living. Three indices are chosen to represent human poverty in a composite index: (i) an index of deprivation relating to survival meaning the vulnerability to death at a relatively early age; and is measured by the percentage of people expected to die before age 40;(ii) an index of deprivation with respect to knowledge, meaning exclusion from the world of reading and communication; and is measured by the percentage of adults who are illiterate; and (iii) an index of deprivation from a decent standard of living (overall economic provisioning), which is composed of two sub-indicators for measurement purposes: This is measured by a composite of two variables: the percentage of people without sustainable access to a safe water source (with weight 0.5) and the percentage of underweight children under age five(with a weight of 0.5). The three indices of deprivation (i.e. (i) – (iii)) are combined into a composite index allowing for possible substitution between them. Figure 2: HPI for Arab countries and developing regions, 1997- 200shows that the HPI for the Arab region in 2007 is slightly above the average for developing regions and is more than double that of Latin America& Caribbean and East Asia& Pacific. This thus renders Arab human poverty rates closer to the vicinity of South Asia. Notwithstanding its relatively high level, the region achieved an impressive reduction in the HPI since 1997 (from 31 to 23%), at par with the average for developing regions (from 27 to 20%) but below that achieved by Latin America& Caribbean and East Asia & Pacific (from 13 to 9% and from 18 to 10%, respectively). Figure 2: HPI for Arab countries and developing regions, 1997- 2007
Source: UNDP Human Development Reports Note: All Arab countries are included except Iraq, OPT and Somalia
Figure 3: HPI for Arab sub-regions (A) and Arab countries (B), 1997-2007
Note: Arab countries included in figure 3.A are same as figure 2
31
18 13
37 40
27 23
10 9
29
36
20
0%
10%
20%
30%
40%
50%
0
10
20
30
40
50
AC EAP LAC SAS SSA DR
% Change HPI 1997 2007 % Change
(A) (B)
Source: ibid.
29
39
30
19 20
34
22
11
0%
10%
20%
30%
40%
50%
0
10
20
30
40
50
Mashreq LDCs Maghreb GCC
Change HPI 1997 2007 % Change
0%
10%
20%
30%
40%
50%
60%
70%
0
10
20
30
40
50
60
Alg
eria
Bahra
in
Com
oro
s
Djib
outi
Egyp
t
Jord
an
Kuw
ait
Lebanon
Lib
ya
Maurita
nia
Moro
cco
Om
an
Qata
r
Saudi A
rabia
Sudan
Syr
ia
Tunis
ia
UA
E
Yem
en
Change HPI 1997 2007 % Change
7
At the sub-regional level, Figure 3.A indicates that the HPI for the Arab LDCs was significantly above the average for the region in 2007 and nearly two thirds above the HPI for the Mashreq and Maghreb. Furthermore, the LDCs achieved a considerably lower reduction in the HPI since 1997 (from 39 to 34%) compared with the reduction rates achieved by the Maghreb and Mashreq. It is also worthy to note that, as opposed to the case of consumption poverty, both the HPI levels and their trends are quite similar for the latter two sub-regions. The highest rate of reduction in the HPI was achieved by the GCC (43%). It is not surprising, therefore, that the three highest rates of reduction in human poverty were achieved by Kuwait, Qatar, Oman and UAE, while the lowest reductions were achieved by Sudan, Yemen, Morocco and Mauritania respectively. Among the more diversified economies of the Mashreq and Maghreb, Syria and Algeria were able to reduce human poverty at a stronger pace. It is worthy to note however that the HPI for Morocco is significantly higher than the average for middle income Arab countries, making it closer to the ranks of LDCs. The reasons for this will become clear in the following analysis of HPI components. We begin our decomposition of the HPI with the indicator for deprivation from leading a long life as measured by the percentage of population who are not expected to reach age 40. Error! Not a valid bookmark self-reference..A-C present this variable and its percentage change over the period from 1997 to 2007 at the same levels of aggregation: global, regional, sub-regional and country. The figure clearly shows that Arab countries do not suffer from high levels of deprivation from survival to age 40 compared to other developing regions. Moreover, Arab countries scored an impressive reduction in this component of the HPI bringing the region closer in terms of levels and trends to East Asia& Pacific and Latin America& Caribbean than to South Asia or Sub-Saharan Africa. Figure 4: People not expected to reach age 40 in developing regions (A), Arab sub-regions (B) and Arab countries (C), 1997-2007
(A) (B) (C)
Source: ibid. Note: Arab countries included are same as figure 2
Arab countries are however more deprived from literacy as Figure 5 illustrates. The figure shows that illiteracy rates for Arab countries are significantly above the average for developing regions, making it almost at par with South Asia and Sub-Saharan Africa in 2007. It is also interesting to note that the disparities between Arab sub-regions are less sharp with regards to this indicator, particularly the disparity between LDCs and the Mashreq and Maghreb, which implies that illiteracy is a cross-cutting problem for the vast majority of Arab populations. It is also a particularly concerning problem for Morocco, which retains the highest illiteracy rates among Arab countries, explaining its relatively high HPI.
0%
5%
10%
15%
20%
25%
30%
0
10
20
30
40
AC
EA
P
LA
C
SA
S
SS
A
DR
1997 2007 Change %
0%
10%
20%
30%
40%
50%
0
10
20
30
GC
C
LD
Cs
Maghre
b
Mashre
q
1997 2007 Change %
0%
10%
20%
30%
40%
50%
60%
0
10
20
30
40
Alg
eria
Bahra
in
Com
oro
s
Djib
outi
Egyp
t Jord
an
Kuw
ait
Lebanon
Lib
ya
Maurita
nia
M
oro
cco
Om
an
Qata
r S
audi A
rabia
S
udan
Syr
ia
Tunis
ia
UA
E
Yem
en
Change HPI 1997 2007 Change %
8
Figure 5: Illiteracy rate in developing regions (A), Arab sub-regions (B) and Arab countries (C), 1997-2007
(A) (B) (C)
Source: ibid. Note: Arab countries included are same as figure 2
The third dimension of the human poverty index is calculated as the simple average of the population not using an improved water source and underweight children under age five. Access to an improved water source is a major challenge for most Arab countries given the high level of aridity in the region. Nonetheless as Figure 6.A shows, the population without access to an improved water source stood at 13.8% in 2007, lower than the average for developing regions and almost the same as in 2001 (14%). Figure 6: Percentage of people without access to an improved water source in developing regions (A), Arab sub-regions (B) and Arab countries (C), 2001-2007
(A) (B) (C)
Source: ibid. Note: Arab countries included are same as figure 2
Despite this region-wide stagnation, sub-regional trends varied distinctively. Reductions in deprivation achieved by the Mashreq were thus equally subdued by increases in deprivation in the Maghreb and LDCs. At the country level, Algeria scored the highest rate of increase in deprivation (from 6 to 17%) followed by Saudi Arabia and Sudan whereas the highest rates of decline were achieved by Tunisia, Oman and Egypt. It should be emphasized that the two largest LDCs, Sudan and Yemen, recorded setbacks as the share of population without access to an improved water source increased by 72 and 23%, respectively.
0%
10%
20%
30%
40%
50%
60%
0
10
20
30
40
50
60
AC
EA
P
LA
C
SA
S
SS
A
DR
1997 2007 Change %
0%
10%
20%
30%
40%
50%
60%
0
10
20
30
40
50
60
GC
C
LD
Cs
Maghre
b
Mashre
q
1997 2007 Change %
0%
10%
20%
30%
40%
50%
60%
70%
80%
0
10
20
30
40
50
60
70
Alg
eria
Bahra
in
Com
oro
s
Djib
outi
Egyp
t
Jord
an
Kuw
ait
Lebanon
Lib
ya
Maurita
nia
Moro
cco
Om
an
Qata
r
Saudi A
rabia
Sudan
Syr
ia
Tunis
ia
UA
E
Yem
en
Change HPI 1997 2007 Change %
-10%
0%
10%
20%
30%
40%
50%
60%
0
10
20
30
40
50
AC
EA
P
LA
C
SA
S
SS
A
DR
2001 2007 Change %
-20%
-10%
0%
10%
20%
30%
40%
50%
60%
0
10
20
30
40
GC
C
LD
Cs
Maghre
b
Mashre
q
2001 2007 Change %
-300%
-250%
-200%
-150%
-100%
-50%
0%
50%
100%
0
10
20
30
40
50
60
70
Alg
eria
Bahra
in
Com
oro
s
Djib
outi
Egyp
t
Jord
an
Kuw
ait
Lebanon
Lib
ya
Maurita
nia
Moro
cco
Om
an
Qata
r
Saudi …
Sudan
Syr
ia
Tunis
ia
UA
E
Yem
en
Change HPI 2001 2007 Change %
9
The second component of this third dimension of the HPI is based on the ratio of underweight children under the age of five to the total population of children, which is summarized in Figure 7. The figure shows a lower level of deprivation for this component compared to the average for developing regions, significantly below South Asia and Sub-Saharan Africa and slightly above East Asia& Pacific and Latin America& Caribbean. On the other hand, Arab countries scored the lowest rate of reduction in deprivation over the period from 1997 to 2007. As in the case of other human deprivations, Arab LDCs recorded a significantly higher percentage of underweight children under age five. Moreover, it is the only sub-region which witnessed an increase in deprivation (by 20%). However, this deprivation is curiously higher than expected for the GCCs, which had nearly twice the deprivation rates for the Mashreq and Maghreb in 2007. This is likely due to factors related to nutritional habits, rather than food insecurity. Within the Mashreq and Maghreb, Algeria and Egypt succeeded in achieving significant reductions (by 70 and 60%, respectively). Figure 7: Underweight children under age five in developing regions (A), Arab sub-regions (B) and Arab countries (C) (Percent), 1997-2007
(A) (B) (C)
Source: ibid Note: Arab countries included are same as figure 2
Multi-Dimensional Poverty
The method used for constructing the HPI does not preclude including other aspects of human deprivation. Such an expanded measure of human poverty is found in the recent Multi-Dimensional Poverty Index (MPI) produced by the Oxford University Poverty and Human Development Initiative (OPHI) and UNDP in 2010, which covers 104 countries (including 13 Arab countries). According to this methodology, a household is identified as multidimensional-poor if it is deprived in 3 of 10 indicators (also called dimensions) which, as in the HPI, are divided across three areas of deprivation (health, education and standard of living). The dimensions and their pertinent weights in the MPI are: health (child mortality and nutrition, each having 1/6 of the weight), education (years of schooling and child enrolment, each having 1/6 of the weight) and standard of living (electricity, drinking water, sanitation, flooring, cooking fuel and possession of assets, each having 1/18 of the weight).The MPI is then calculated as the product of two numbers: the headcount ratio or proportion of people who are multidimensional-poor and the average intensity of multidimensional-deprivation– which reflects the proportion of dimensions in which households are deprived. Despite the large degree of subjectivity in determining the cut-off thresholds for each dimension (and in determining the minimum number of dimensions required to identify whether or not a household is multi-dimensionally poor), the MPI has an important advantage compared with the HPI as it captures many more dimensions of human poverty and includes both the level of human deprivation and a measure of the intensity of poverty.
0%
10%
20%
30%
40%
50%
0
10
20
30
40
50
60
AC
EA
P
LA
C
SA
S
SS
A
DR
1997 2007 Change %
-40%
-20%
0%
20%
40%
60%
0
10
20
30
40
50
GC
C
LD
Cs
Maghre
b
Mashre
q
1997 2007 Change %
-80%
-60%
-40%
-20%
0%
20%
40%
60%
80%
0
10
20
30
40
50
Alg
eria
Bahra
in
Com
oro
s
Djib
outi
Egyp
t
Jord
an
Kuw
ait
Lebanon
Lib
ya
Maurita
nia
Moro
cco
Om
an
Qata
r
Saudi A
rabia
Sudan
Syr
ia
Tunis
ia
UA
E
Yem
en
Change HPI 1997 2007 Change %
10
Using survey data from 104 countries with a combined population of 5.2 billion (78 per cent of the world population), the OPHI estimated that 1.7 billion people -one third of the world population- live in multidimensional poverty. Of this population living in multidimensional poverty, only 2.5% belong to Arab States (41.2 million people), approximately half live in South Asia (844 million people) and nearly one third are in Africa (458 million). In Figure 8.A, it is clear that the MPI is below the HPI for Europe & Central Asia, Arab countries, Latin America& Caribbean and East Asia& Pacific. The ratio of the HPI to the MPI is second highest for Europe & Central Asia and Arab countries, which implies a significantly lower MPI compared to the HPI. The reason for this is made clear in the country-level data of Figure 8.B which shows developing countries with highest ratios. Of the highest thirty six ratios, eight belonged to the Arab region and six of them among highest twenty two ratios, including the more populous Egypt and Syria. Figure 8: Ratio of HPI to MPI for developing regions (A) and thirty six highest ratios (B), 2007
(A) (B)
Source: UNDP Human Development Reports and OPHI Note: For HPI, Arab countries included are same as figure 2. For MPI, Arab countries included are Comoros, Djibouti, Egypt, Iraq, Jordan, Mauritania, Morocco, OPT, Somalia, Syria, Tunisia and Yemen
Figure 9 shows the poverty headcount and intensity components of the MPI for developing regions and Arab sub-regions. The average intensity of deprivation for developing regions in the sample is 53.1%. Sub-Saharan Africa, has the highest intensity (58.2%) occurs while the lowest (42.1%) intensity occurs in Europe & Central Asia. The Arab Region’s average intensity of 49.3% is below world average but both Latin America & Caribbean and East Asia& Pacific have significantly lower intensities (46.2 and 46.5%, respectively). As observed from the figures, whether for developing regions or Arab sub-regions, the intensity of deprivation is clearly the less significant source for the variation in the MPI. Figure 9: MPI components for developing regions (A) and Arab sub-regions (B), 2000-2008
(A) (B)
Source: Authors estimates for Arab countries and sub-regions and OPHI, 2010 Note: Arab countries included for LDCs are Comoros, Djibouti, Mauritania, Somalia and Yemen. For Maghreb: Morocco and Tunisia. For Mashreq: Egypt, Iraq, Jordan, OPT and Syria
0%
10%
20%
30%
40%
0%
200%
400%
600%
DR
SA
S
EC
A
EA
P
SS
A
LA
C
AC
HPI & MPI
HPI/MPI
HPI/MPI HPI MPI
0
5
10
15
20
25
30
35
40
UA
E
Kazakhsta
n
OP
T
South
Afr
ica
G
eorg
ia
Russia
n F
ed.
Tunis
ia
Thaila
nd
Alb
ania
U
zbekis
tan
Serb
ia
Bosnia
and H
erz
. E
gyp
t E
cuador
Sri L
anka
Hungary
U
kra
ine
Beliz
e
Mold
ova
Jord
an
Syr
ia
Azerb
aija
n
Uru
guay
Monte
negro
A
rmenia
M
acedonia
K
yrgyzsta
n
Mexic
o
Moro
cco
Iraq
Arg
entina
Tri
n.&
Tobago
Cro
atia
Tajik
ista
n
Mya
nm
ar
Surinam
e
0%
10%
20%
30%
40%
50%
60%
70%
0%
10%
20%
30%
40%
50%
60%
70%
DR SAS EAP SSA LAC ECA AC
Headcount Intensity
0.602
0.150
0.076
0.573 0.466
0.403
0%
10%
20%
30%
40%
50%
60%
70%
0%
10%
20%
30%
40%
50%
60%
70%
LDCs Maghreb Mashreq
Headcount Intensity Linear (Intensity)
11
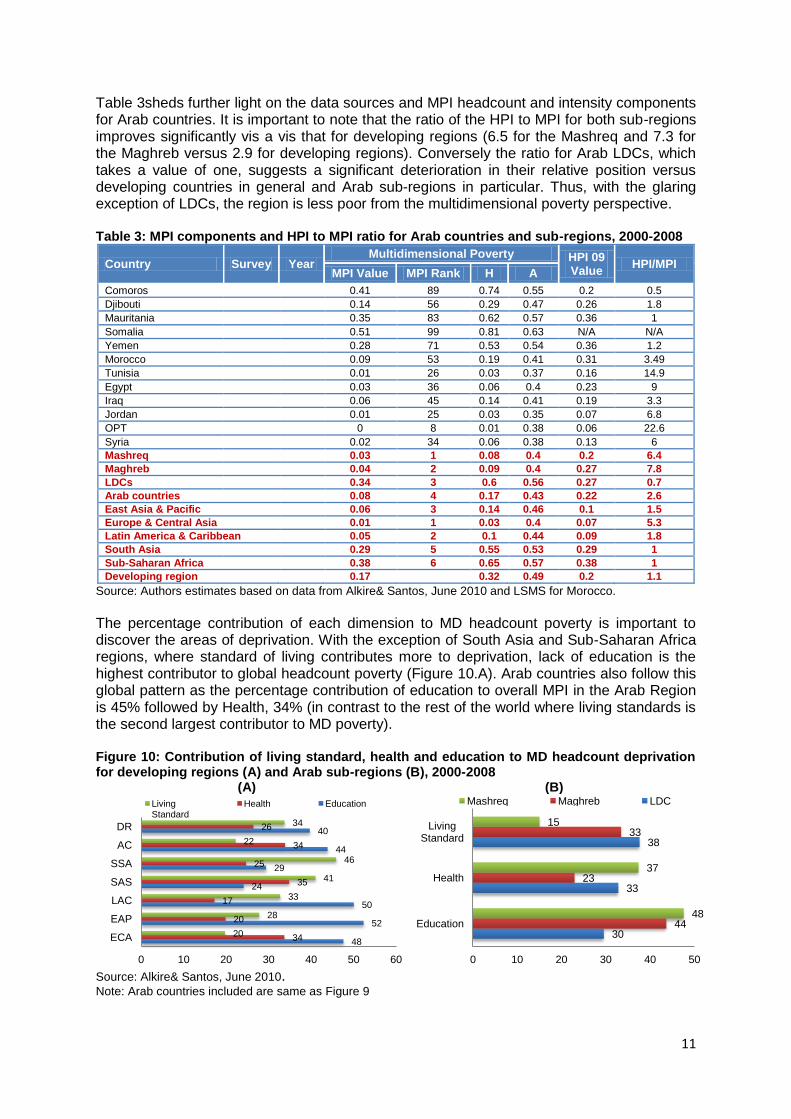
Table 3sheds further light on the data sources and MPI headcount and intensity components for Arab countries. It is important to note that the ratio of the HPI to MPI for both sub-regions improves significantly vis a vis that for developing regions (6.5 for the Mashreq and 7.3 for the Maghreb versus 2.9 for developing regions). Conversely the ratio for Arab LDCs, which takes a value of one, suggests a significant deterioration in their relative position versus developing countries in general and Arab sub-regions in particular. Thus, with the glaring exception of LDCs, the region is less poor from the multidimensional poverty perspective. Table 3: MPI components and HPI to MPI ratio for Arab countries and sub-regions, 2000-2008
Country Survey Year Multidimensional Poverty HPI 09
Value HPI/MPI
MPI Value MPI Rank H A
Comoros MICS 2000 0.41 89 0.74 0.55 0.2 0.5
Djibouti MICS 2006 0.14 56 0.29 0.47 0.26 1.8
Mauritania MICS 2007 0.35 83 0.62 0.57 0.36 1
Somalia MICS 2006 0.51 99 0.81 0.63 N/A N/A
Yemen MICS 2006 0.28 71 0.53 0.54 0.36 1.2
Morocco LSMS 2007 0.09 53 0.19 0.41 0.31 3.49
Tunisia WHS 2003 0.01 26 0.03 0.37 0.16 14.9
Egypt DHS 2008 0.03 36 0.06 0.4 0.23 9
Iraq MICS 2006 0.06 45 0.14 0.41 0.19 3.3
Jordan DHS 2007 0.01 25 0.03 0.35 0.07 6.8
OPT MICS 2006 0 8 0.01 0.38 0.06 22.6
Syria MICS 2006 0.02 34 0.06 0.38 0.13 6
Mashreq
0.03 1 0.08 0.4 0.2 6.4
Maghreb
0.04 2 0.09 0.4 0.27 7.8
LDCs
0.34 3 0.6 0.56 0.27 0.7
Arab countries
0.08 4 0.17 0.43 0.22 2.6
East Asia & Pacific
0.06 3 0.14 0.46 0.1 1.5
Europe & Central Asia
0.01 1 0.03 0.4 0.07 5.3
Latin America & Caribbean 0.05 2 0.1 0.44 0.09 1.8
South Asia
0.29 5 0.55 0.53 0.29 1
Sub-Saharan Africa
0.38 6 0.65 0.57 0.38 1
Developing region
0.17
0.32 0.49 0.2 1.1
Source: Authors estimates based on data from Alkire& Santos, June 2010 and LSMS for Morocco.
The percentage contribution of each dimension to MD headcount poverty is important to discover the areas of deprivation. With the exception of South Asia and Sub-Saharan Africa regions, where standard of living contributes more to deprivation, lack of education is the highest contributor to global headcount poverty (Figure 10.A). Arab countries also follow this global pattern as the percentage contribution of education to overall MPI in the Arab Region is 45% followed by Health, 34% (in contrast to the rest of the world where living standards is the second largest contributor to MD poverty). Figure 10: Contribution of living standard, health and education to MD headcount deprivation for developing regions (A) and Arab sub-regions (B), 2000-2008
(A) (B)
Source: Alkire& Santos, June 2010. Note: Arab countries included are same as Figure 9
48
52
50
24
29
44
40
34
20
17
35
25
34
26
20
28
33
41
46
22
34
0 10 20 30 40 50 60
ECA
EAP
LAC
SAS
SSA
AC
DR
Living Standard
Health Education
30
33
38
44
23
33
48
37
15
0 10 20 30 40 50
Education
Health
Living Standard
Mashreq Maghreb LDC
12
It would seem therefore that the character of multidimensional poverty in Arab states (and particularly the Maghreb) is closer to that in more developed regions of East Asia& Pacific and Latin America& Caribbean while for LDCs there is higher similarity with the poorer regions of Sub-Saharan Africa and South Asia in having higher deprivation in living standards. Indeed, as shown in Table 4: Components of the headcount deprivation component of the MPI for Arab countries (Percent), 2000-2008, the LDCs are far more much deprived in clean drinking water, improved sanitation, clean cooking fuel, electricity, flooring material and assets ownership compared to other Arab countries. Table 4: Components of the headcount deprivation component of the MPI for Arab countries (Percent), 2000-2008
Source: Alkire& Santos, June 2010 and LSMS (2007) for Morocco.
These results yield a mixed bag of conclusions. Arab countries as a whole enjoy low multidimensional poverty compared to developing regions. However, the gap between Arab LDCs and the Mashreq and Maghreb countries is conspicuously higher than expected based on the more conventional HPI. Thus and despite having less than one quarter of the population, Arab LDCs contain half of the Arab States MD poor people with Somalia being the poorest country in that group (Figure 11.A). In fact, Somalia’s MPI ranked 99 out of the 103 countries in the sample. Figure 11: Distribution of the MP Population (millions, percent) in Arab sub-regions (A) MD and poverty headcount and intensity in Arab countries (B), 2007
(A) (B)
Source: Authors estimates based on data from Alkire& Santos, June 2010. Note: Arab countries included are same as figure 9
21.361, 52%
9.177, 22%
10.662, 26%
LDCs Maghrib Mashreq
UAE
Comoros
Djibouti
Mauritania
Somalia
Yemen
Moroco
Tunisia
Egypt Iraq
Jordan
OPT Syria
R² = 0.8932
0.3
0.4
0.5
0.6
0.7
0.0 0.2 0.4 0.6 0.8 1.0
Intensity
Headcount
Arab countries
13
As shown in Figure 11.B, the MPI headcounts are strongly related to average intensity of MD poverty across the Arab countries. The intensity of poverty is therefore commensurate with the headcount poverty leading Mashreq and Maghreb countries to a favourable position with respect to both components as revealed by their location in the lower left quadrant of Figure11.B Conversely, LDCs are situated at a clear distance in the upper right quadrant of the figure. The exceptions however is Djibouti which are located in the lower right quadrant indicating a lower than average intensity and higher than average headcount poverty ratio compared to the average for Arab countries.
Human Deprivation and Income: Summary of Stylized Facts In order to give more informed human poverty stylized facts, the progress (or lack thereof) of poverty indicies should be set against an appropriate measure of the capacity or means available to the state (and its individuals) to reduce such deprivations. Although it is by far not the sole determinant of human poverty, we have chosen per capita GDP (in 2005 PPP) as the appropriate proxy for this capacity. Accordingly, Figure 12.A and B plot the HPI and MPI against per capita GDP, respectively, for the relevant years. The high correlation coefficients displayed on the top left part of the scatter diagrams is expected due to the well established strong cross-country relation between human poverty and income pe capita. Figure 12: GDP per capita (PPP) and HPI (A) and MPI (B), 2005
(A) (B)
Source: Authors estimates based on data from World Bank for GDP per capita, Human Development Reports for the HPI and OPHI for the MPI Note: Arab countries included are same as figure 8 except Iraq, OPT and Somalia for both figures 12.A and B
Using the downward-sloping regression line, we can estimate the expected value of the human poverty index for any given GDP per capita. It should be noted that the regression line is non linear, which implies that the nature of the relationship between both variables changes as GDP per capita increases. This result is not difficult to understand as it would be far more difficult for an incremental rise in GDP per capita to reduce human poverty by the same rate in a country with a very low HPI or MPI than in a country with a very high HPI or MPI. The expected “or estimated” values (HPI* and MPI*) are then compared with the actual HPI and MPI values. If the ratio of the latter to the former is higher than one, this suggests the country or region has a higher than average level of human poverty and vice versa. It follows that the change in the value of this ratio over time represents the change in position of the country or region over time relative to its estimated position on the regression line. A summary of this data is shown in Table 5.
R² = 0.6944
0
10
20
30
40
50
60
70
2 3 4 5
HPI
Log GDP per capita
R² = 0.7733
0
0.1
0.2
0.3
0.4
0.5
0.6
0.7
2.0 2.5 3.0 3.5 4.0 4.5
MPI
Log GDP per capita
14
Table 5: Actual and estimated HPI for Developing regions and Arab countries, 1997-2007 Country/Region
HPI (1997)
HPI* (1997)
HPI (2007) HPI*
(2007) HPI/HPI* (1997)
HPI/HPI* (2007)
Change in HPI/HPI*
Egypt 33.0 23.4 23.4 15.8 1.4 1.5 0.1
Jordan 9.7 21.5 6.6 16.8 0.5 0.4 -0.1
Syria 21.1 22.4 12.6 17.8 0.9 0.7 -0.2
Lebanon 11.2 14.7 7.6 11.1 0.8 0.7 -0.1
Mashreq 28.9 22.8 19.9 16.1 1.3 1.2 0.0
Libya 18.1 13.7 13.4 10.2 1.3 1.3 0.0
Algeria 27.8 17.9 17.5 12.6 1.5 1.4 -0.2
Morocco 37.8 22.1 31.1 19.0 1.7 1.6 -0.1
Tunisia 23.6 15.9 15.6 12.8 1.5 1.2 -0.3
Maghreb 30.4 19.0 22.1 14.9 1.6 1.5 -0.1
Mauritania 48.3 33.0 36.3 31.1 1.5 1.2 -0.3
Sudan 36.6 34.7 34.0 29.7 1.1 1.1 0.1
Yemen 43.3 43.8 35.8 27.8 1.0 1.3 0.3
Comoros 32.3 35.1 20.4 39.7 0.9 0.5 -0.4
Djibouti 38.8 38.2 25.6 29.9 1.0 0.9 -0.2
LDCs 39.2 37.6 34.5 29.2 1.0 1.2 0.1
Bahrain 9.8 10.1 8.0 10.0 1.0 0.8 -0.2
Oman 33.2 11.2 14.8 10.1 3.0 1.5 -1.5
Qatar 14.0 10.1 5.0 3.3 1.4 1.5 0.1
Saudi Arabia 18.8 11.1 12.0 10.1 1.7 1.2 -0.5
Kuwait 13.6 10.1 4.7 8.6 1.3 0.5 -0.8
United Arab Emirates 17.6 10.1 7.7 7.5 1.7 1.0 -0.7
GCC 19.2 10.9 10.8 9.4 1.8 1.1 -0.6
Arab countries 30.5 23.5 22.8 17.9 1.3 1.3 0.0
East Asia & Pacific 18.3 23.4 9.9 17.8 0.8 0.6 -0.2
Latin America & Caribbean 12.8 15.1 8.7 12.5 0.8 0.7 -0.2
South Asia 37.4 34.5 29.4 26.8 1.1 1.1 0.0
Sub-Saharan Africa 40.4 39.2 35.9 34.3 1.0 1.0 0.0
Developing region 27.0 27.9 20.0 22.2 1.0 0.9 -0.1
Source: Authors estimates based on data from Human Development Reports and OPHI
Three important stylized facts can be deduced from the table. First, the observed HPI for Arab countries is significantly higher than their expected HPI (HPI*) compared to any other developing region. The oppostie is true for East Asia& Pacific and Latin America & Caribbean (their ratios were 0.6 and 0.7 in 2007, respectively). Second, within the Arab region, the actual to expected HPI is signifantly larger for Maghreb countries. Third, the Arab region did not witnessed any change in the gap between actual and expected HPI over the period from 1997 to 2007 as indicated by the zero percentage change in the ratio of actual to expected HPI shown in the last column. Fourth, the stagnation of the HPI to HPI* ratio was not uniform within the Arab region. The ratio declined significantly for GCCs which suggests that these countries were able to match the rapid growth in GDP per capita with a more rapid reduction in the HPI. The ratio also decline in Maghreb and Mashreq countries. But the former still sustained a large gap between their actual and expected HPI in 2007. The Arab LDC group, however, was the only Arab sub-region to witness an increase in the gap between actual and expected HPI indicating a retrenchment in human poverty reduction efforts. This retrenchment is even more alarming when we factor in the rapid growth in GDP per capita (in 2005 PPP) for the sub-region which took place over the period from 1997 to 2007 (from approximately $1300 to $2100).
The main conclusion to drive from the cross-country comparisons between GDP per capita and the HPI is that Arab countries have a significantly higher rate of human poverty than what would be expected given their level of income. However, cross-country estimates based on the MPI yield a different conclusion. As shown in Figure 13.A, the actual and expected MPI for the Arab region are identical giving it a MPI/MPI* ratio of one. This ratio places the Arab region in a far more advantageous position compared with the HPI and
15
second to East Asia& Pacific. The improved rank of Arab countries is also due to the sharp slide in the ratios for South Asia and Latin America& Caribbean in particular as confirmed in Figure 13.B. The figure also shows the East Asia & Pacific and Sub-Saharan Africa regions are the only regions where MPI and HPI ratios were consistent. Figure 13: Actual and expected MPI (A) and the ratio of actual to expected HPI and MPI (B), 2007
(A) (B)
Source: ibid. Note: Arab countries included for HPI and MPI are same as figure 8
The discrepancy between the HPI and MPI ratios is not the same across Arab sub-regions. All Arab countries with the exception of Comoros, Mauritania and Yemen had lower HPI ratios. With the striking excpetion of Egypt and Tunisia, the values of HPI and MPI ratios were of commensurate order of magnitude. In fact, given its demoghraphic weight, it can be argued that the bulk of the region-wide discrepancy between HPI and MPI ratios can be mainly attributed to Egypt. The results for Yemen and Mauritania on the other hand are more consistent with the stylized facts observed for LDCs, namely a higher than expected actual to expected ratio for both the HPI and MPI.
Facets of Inequality in Human Development and Deprivation
Human development Unlike the HDI which only measures human achievements in health, education and income -regardless of how they are distributed, inequality-adjusted HDI captures the inequality that HDI does not measure in each dimension, thus one can think of the difference between them as the loss in potential human development due to the unaccounted inequality. The IHDI will be equal to the HDI when there is no inequality across people but falls further below the HDI as inequality rises, in other words, the lower the ratio of IHDI to HDI, the higher inequality in human development.6 As shown in Figure 14.A,Arab countries alongside Sub-Saharan Africa and South Asia have the lowest ratios of IHDI to HDI (72, 67 and 70% respectively), which means they lose the most from inequality in human development, while Europe & Central Asia has the lowest loss due to this inequality. The implementation of the IHDI displayed that losses in health and education were greater than losses in income globally, where as in the Arab countries, inequalities in education contribute to the loss in human development more than inequalities in health and income.
0.0
0.1
0.2
0.3
0.4
0.5
AC
EA
P
LA
C
SA
S
SS
A
DR
Egypt
Jord
an
Syria
Mashre
q
Moro
cco
Tu
nis
ia
Maghre
b
Com
oro
s
Djib
outi
Maurita
nia
Yem
en
LD
Cs
MPI MPI*
0.0
0.5
1.0
1.5
0.0
0.5
1.0
1.5
2.0
AC
EA
P
LA
C
SA
S
SS
A
DR
Egypt
Jo
rda
n
Syria
Mashre
q
Moro
cco
Tu
nis
ia
Maghre
b
Com
oro
s
Djib
ou
ti
Maurita
nia
Yem
en
LD
Cs
MPI/MPI* HPI/HPI*
16
It also seems that countries that have less human development are more likely to have higher inequality and thus larger losses in human development. As shown in Figure 14.B, LDCs (Comoros, Djibouti, Mauritania and Yemen) have the highest inequalities in human development, while the lowest inequality is found in Jordan. Although Egypt is higher than the Arab countries in human development, it loses more in human development due to inequality. Figure 14: Inequality adjusted HDI for developing regions (A) and Arab countries (B), 2010
(A) (B)
Source: Authors estimates based on data from Human Development Report, 2010. Note: All Arab countries are included except Iraq, Lebanon, Oman,OPT and Somalia
Multi-dimensional poverty Inequality in human deprivation has generally received far less attention than inequality in the distribution of expenditure. This is perhaps due to the causal link between money-metric poverty and distribution of expenditure which makes it necessary to report the latter in order to explain overall money-metric poverty dynamics. In this section we make amends by reporting multi-dimensional poverty at the sub-national level from two sources. The first source is based on data reported by OPHI which yields rural versus urban inequalities. The second source is household expenditure surveys for the following Arab countries: Egypt (2008/9), Lebanon (2005) and Syria (2007) from the Mashreq; Morocco (2007) from Maghreb; and Yemen (2005/6) from LDCs. Collectively, these countries comprise of more than half of the Arab population and an even higher share of the Arab poor population. Figure 15: Rural and Urban MPI (A) and the Rural to Urban MPI ratio versus GDP per capita (B), 2000-2007
(A) (B)
Source: Authors estimates based on data from Human Development Reports and OPHI From Figure15.A, we can clearly see a close relationship between urban and rural MPI. In other words, countries which have a low degree of human deprivation in rural areas are also likely to have a low degree of deprivation in urban areas and vice versa. However, as Figure
72% 78%
86% 75%
70% 67%
0%
20%
40%
60%
80%
100%
0.0
0.2
0.4
0.6
0.8
AC EAP EAC LAC SAS SSA
Human Development Index (HDI) Inequality-adjusted HDIa IHDI/HDI
IHDI & HDI
IHDI/HDI
63% 56%
65% 66% 72%
79% 72%
81% 75%
0%
20%
40%
60%
80%
100%
0.0
0.2
0.4
0.6
0.8
Djib
outi
Com
oro
s
Maurita
nia
Yem
en
Moro
cco
Syr
ia
Egyp
t
Jord
an
Tunis
ia
Human Development Index (HDI) Inequality-adjusted HDIa IHDI/HDI
IHDI & HDI
IHDI/HDI
COM DJI
MRT
SOM
YEM MAR
TUN EGY
IRQ
JOR
SYR
LDC
Maghreb
Mashreq
AC
EAP
ECA
LAC
SAS
SSA
DR
0
0.1
0.2
0.3
0.4
0.5
0.6
0.7
0.8
0.0 0.1 0.2 0.3 0.4 0.5
Rural MPI
Urban MPI COM
DJI MRT
YEM
MAR
TUN EGY IRQ
JOR SYR LDC
Maghreb
Mashreq
AC EAP
ECA
LAC
SAS SSA
DR
0
2
4
6
8
10
12
2 3 4 5
Rural/Urban MPI
Log GDP per capita
17
15.B indicates, the ratio of rural to urban deprivation is not linear across country groups. In the poorest countries it tends to be low since both rural and urban areas have relatively high incidence of poverty. As economies undertake structural transformation, economic development is initially concentrated and led by urban areas; thereby one would expect an increase in the rural to urban inequality ratio as countries move from the low to middle income bracket. During the transformation process, as countries move from the middle income to high income category, a broader based pattern of growth is expected to prevail. Thus the rural-urban inequalities are expected to recede. To sum, similar to the 'Kuznets Curve', we expect a U shaped inequality in the distribution of human deprivation as income rises. This shape is plotted in Figure 15.B. where the cluster of a majority of Arab countries can be spotted in the centre of the graph. Hence, we would expect Arab countries to have a higher level of inequality between rural and urban areas relative to other countries. Indeed, this is confirmed in Table 6, where the region is shown to have a higher ratio of rural to urban poverty (3.5) than all other developing regions, with the notable exception of Latin America& Caribbean. At the country level, data from the OPHI also shows Morocco has the highest level of inequality followed by Tunisia, Egypt and Djibouti, respectively. Table 6: MPI for rural and urban regions for Arab countries and developing regions, 2000-2007
Country/Region National Urban Rural R/U
Comoros 0.41 0.30 0.44 1.50
Djibouti 0.14 0.13 0.44 3.46
Mauritania 0.35 0.18 0.51 2.74
Somalia 0.51 0.30 0.65 2.20
Yemen 0.26 0.14 0.35 2.52
Morocco 0.09 0.04 0.28 7.86
Tunisia 0.01 0.00 0.02 4.17
Egypt 0.03 0.01 0.04 3.50
Iraq 0.06 0.03 0.11 3.38
Jordan 0.01 0.01 0.01 1.37
Syria 0.02 0.01 0.03 2.00
OPT 0.00 0.00 0.00 1.06
LDCs 0.33 0.18 0.44 2.46
Maghreb 0.11 0.03 0.22 7.99
Mashreq 0.03 0.02 0.04 2.77
Arab countries 0.09 0.04 0.15 3.56
East Asia & Pacific 0.06 0.02 0.08 3.32
Europe& Central Asia 0.02 0.01 0.03 2.78
Latin America& Caribbean 0.08 0.02 0.12 6.63
South Asia 0.29 0.13 0.36 2.72
Sub-Saharan Africa 0.37 0.18 0.47 2.55
Developing region 0.17 0.06 0.23 3.55
Source: ibid.
Average deprivation in each dimension by urban and rural levels among the different regions
Schooling Generally the average deprivation levels in schooling is higher in the Rural than the Urban for all the different regions (e.g. in Sub-Saharan Africa rural areas are almost four times than in Urban (0.391, 0.110) respectively. The examination of the Arab Region shows that it has significantly higher average deprivation in the rural than the urban (0.139, 0.034 respectively), namely about 4 times higher than its average in the urban.
18
Child enrolment The average deprivation in child enrolment in the Rural area of the Arab Region is 3 times its deprivation in its urban areas (0.179, 0.053) respectively. Additionally, it is also observed that the Arab Region suffer from deprivation in child enrolment higher than the deprivation in schooling (0.115, 0.086) in the national level.
Mortality (any age) The Arab region has average deprivation in mortality at any age higher in Rural areas than urban (0.135, 0.064) respectively. It is also notable that the highest deprivation is found in the Arab LDCs (0.293). Nutrition The examination of nutrition indicator in the Arab Region shows that the deprivation in the Rural areas is higher than Urban (0.065, 0.025) respectively. Rural Maghreb has the highest Nutrition deprivation in the Arab Region (0.133) Thus in the Health dimension, it is noted that the Arab Region suffer from deprivation in mortality at any age higher than deprivation in nutrition respectively. Electricity In the Arab Region, the average deprivation in electricity in the Rural areas is more than 6 times than its average in the urban areas (0.024, 0.161) respectively. The average deprivation in Rural Sub-Saharan Africa and Arab LDC are greatly higher than those in any other region (0.556, 0.420). Sanitation In the Arab Region, the average deprivation in the rural area is higher than those in the urban (0.167 in rural versus 0.025 in urban). Drinking water The average deprivation in the rural Arab Region is higher than the urban (0.173, 0.027) respectively. Floor The average deprivation in the floor is low across the different regions except for high deprivation in Sub-Saharan Africa and South Asia (0.467, 0.403) respectively. The average deprivation in the urban areas of the Arab Region is lower than the average in the rural areas (0.018, 0.157) respectively. Cooking Fuel Similar to the floor, the average deprivations in the cooking fuel are very low in the urban areas of the different regions compared to the averages in the rural areas which are higher. The rural areas in the Arab Region suffer from deprivation almost 5 times higher than the urban areas (0.141, 0.023). Assets The average deprivation in the assets is higher in Arab LDC, South Asia and Sub-Saharan Africa than in the other regions (0.393, 0.365, 0.451) respectively. Examining the average deprivation in the Arab Region shows that the average deprivation is higher in the rural areas than the urban (0.163, 0.029) respectively. Arab Region suffers from higher deprivation in Drinking water, sanitation and assets than the other living conditions indicators (0.101 and 0.097) respectively.
19
Table 7 reports our estimated results based on the household expenditure surveys. At the outset it is important to note that our estimated MPI at the national level closely approximates the MPI reported by the OPHI except in the case of Morocco. This result is important as it implies the broad consistency of our results with the OPHI estimates. However, detailed results and comparative statistics provided in annex 2.2.3 show major differences in terms of the rate of deprivation in education. For example, in the case of Egypt, educational attainment as measured by years of schooling, contributed more than 50% of our estimated MPI at the national level, contrasted with 17% only in the country tables provided by the OPHI. The same conclusion applies in Syria and Yemen where our findings show a much higher level of deprivation in years of schooling compared with the OPHI (35 versus 10% for Syria and 28 versus 7% for Yemen). We also recorded significantly higher rates of deprivation from assets for Egypt and from child enrolment in Yemen. It is worthy to note that years of schooling also contributed approximately half of the MPI for Lebanon. Table 7: MPI for rural and urban regions and highest and lowest expenditure quintiles for selected Arab countries
Region/ quintile MPI H A
Eg
yp
t (2009)
Total 0.05 0.11 0.41
Urban 0.02 0.06 0.39
Rural 0.06 0.16 0.41
Q1 0.11 0.24 0.44
Q5 0.03 0.07 0.37
Rural/Urban 2.6 2.5 1
Q1/Q5 3.9 3.3 1.2
Syria
(2007)
Total 0.03 0.07 0.38
Urban 0.01 0.03 0.36
Rural 0.05 0.12 0.38
Q1 0.06 0.14 0.39
Q5 0.03 0.09 0.38
Rural/Urban 4.6 4.4 1.1
Q1/Q5 1.7 1.6 1
Yem
en
(2006)
Urban 0.19 0.4 0.47
Rural 0.31 0.6 0.52
Q1 0.38 0.7 0.54
Q5 0.19 0.42 0.46
Rural/Urban 1.7 1.5 1.1
Q1/Q5 1.9 1.7 1.2
Le
ban
on
(2
005)
Total 0.03 0.07 0.38
Q1 0.03 0.07 0.36
Q5 0.03 0.07 0.38
Q1/Q5 1 1 1
Source: Authors estimates based on HIESs for Egypt (2008/9), Syria (2007), Yemen (2006) and Lebanon (2005)
Rural-urban disparities reported in the table are quite wide in all surveyed Arab countries. Morocco, however, stands out from the rest with rural to urban MPI ratios of 7.5 in confirmation to the findings reported in Table 6.Syria's rural MPI is also 4.6 times higher than the urban. The corresponding ratios for Egypt and Yemen are 2.6 and 1.7, respectively. Thus based on household survey data, Egypt's rank improves considerably while Syria deteriorates. Household expenditure survey data also gives us the advantage of investigating inequality between the rich and poor. The table shows the disparity between the upper and lower quintiles for Arab countries generally ranges between 1.0 in Lebanon to 3.9 in Egypt, except for Morocco where it is much higher (12.2). This is explained in part by the extremely low
20
MPI for Morocco's upper quintile. Part of the explanation for Morocco’s peculiarity therefore lies in the fact that its urban regions and upper quintile exhibit a human poverty pattern similar to richer advanced countries.
Infant mortality and maternal health Figure 16: Inequality in under-Five mortality rates (A-B), delivery assistance by a skilled health personnel (C-D) and antenatal care visits (E-F), 2006-2008
(A) (B)
(C) (D)
(E) (F)
Source: UNICEF
Using recent household surveys (2006-2008 MICS and DHS), UNICEF has produced important results on profiles on health inequities in ten Arab countries. In this section, we briefly review the main findings of this study with regards to sub-national disparities between the rich and the poor in maternal and child health. The methodology is similar to the one applied in the previous section. The estimate/prevalence of the maternal and child health indicator is computed for poor and rich households (which are classified based on ownership of durable goods, assets and other housing characteristics). Similar to the Gini coefficient, a concentration index, on a scale from zero to one, then measures the degree of inequality across the population.
0
20
40
60
80
100
120
140
Syria
OP
T
Jord
an
Sudan
Egypt
Yem
en
Rate
per
1,0
00 liv
e b
irth
s
Poorest Richest
Egypt
Syria
OPT
Jordan
Yemen
Sudan
0.80
0.85
0.90
0.95
1.00
0 20 40 60 80 100 120 C
oncentr
ation index v
alu
e
Rate (Per 1000 live births)
0
20
40
60
80
100
120
Jord
an
OP
T
Alg
eria
Djib
uti
Tunis
ia
Syr
ia
Iraq
Egyp
t
Sudan
Yem
en D
eliv
eries a
ssis
ted b
y skill
ed
pers
onnel (%
)
Poorest Richest
Egypt
Syria OPT Jordan
Yemen
Sudan
Iraq Djibouti
Tunisia
Algeria
0
0.05
0.1
0.15
0.2
0.25
0.3
0.35
25 50 75 100 125
Concentr
ation index v
alu
es
Deliveries assisted by skilled personnel (%)
0
20
40
60
80
100
120
OP
T
Jord
an
Tunis
ia
Djib
out
i
Alg
eria
Syr
ia
Iraq
Egyp
t
Sudan
Yem
en
% o
f A
NC
(1 o
r m
ore
vis
its)
Poorest Richest
Egypt
Syria
OPT
Jordan
Sudan
Iraq Djibouti
Tunisia
Algeria
0
0.05
0.1
0.15
0.2
0.25
60 65 70 75 80 85 90 95 100
Concentr
ation index v
alu
es
% of ANC coverage (1 or more visits)
21
The first indicator is under five mortality rate (UFMR) which is available for six countries. As shown in Figure16.A, the inequality between the rich and poor populations is quite significant in Yemen (triple the rate for the rich among the poor) and Egypt (more than double). These inequalities are clearly depicted in the Concentration Index in Figure 16.B. Syria's position is quite remarkable. Not only is its UFMR for the poor far less than in more affluent countries (Jordan) and less than half of that in Egypt, which has a similar level of income per capita, but also the disparities between the rich and poor are negligible (in fact they are higher for the rich population). A similar pattern is depicted for the inequities in delivery assistance by skilled health personnel (Figure 16.C and D) and in antenatal care visits (Figure 16.E and F) where profound disparities between the rich and poor exist in Sudan, Yemen and Egypt and to a lesser extent in Iraq, Syria, Tunisia, Djibouti and Algeria.
Concluding Remarks The HDI, as a measure of human progress over time, is definitely superior to a purely income based measure and has been widely adopted by many countries to measure their progress.However, the HDI can be subject to many valid critiques, regarding the arbitrary nature in which itsthree components are given equal weight and also critiques regarding the interconnections between the three indicators used in the HDI. No doubt the simple usefulness of the human development index may also lead to a linearalization idea of development in the sense that simplistic proxy measures of humandevelopment overtake the broader concept of human development. The HDI isa powerful empirical tool but based on limited data and thusit should not be the main driving force behind the way we think about Arab development. As the recent events in the region attest, the index is poorly suited for measuring morequalitative governance-related issues, for example, freedom of expression, quality of institutions, accountability structures and rule of law and political participation and democracy. Notwithstanding these limitations, our comparative analyses of HDI in Arab countries and developing regions yield interesting results. Based on the long-term analysis of the HDI, the region achieves remarkable progress. This is not surprising given the large investments in social services undertaken by most Arab goverments since the 1970s and given that crucial development indicators such as illiteracy and life expectancy were extremely low in 1970 for all Arab countries, particularly when compared to their rising per capita income due to a rapid expansion in oil production and revenues. It is therefore expected that significant improvements in social indicators would ensue as part of the substantial windfall oil revenues that were channeled to the provision and enhancement of social services. The pace of improvement in health and educational indicators however became more difficult to sustain due to a number of factors including the decline in oil prices during the 1980s, fiscal constraints imposed by the implementation of structural adjustment programs during the early 1990s and demand pressures posed by the rising share of youngsters in the overall population or the so called "youth bulge". Hence, human development achievements took a distinctively slower pace since 1990. The most recent Arab MDG report which covers a wider range of development indicators since 1990 confirms this conclusion. Furthermore, when an alternative definition of development progress based on the shorfall between Arab countries and global top performers is adopted, the rate of progress is significantly lower. There is no mircale story there. Our human poverty story which takes the mid 1990s as a base yields a similar conclusion. Based on the HPI, the Arab region as a whole and most Arab countries show a higher than average level of expected deprivation for their given level of income compared to developing regions. However, based on the MPI, human poverty in the Arab region is exactly where it should be compared to its income. Although the discrepancy between both indicies is due
22
mainly to the striking difference between the HPI and MPI for Egypt, any final assessment of this riddle will depend on the strength of each of those methodologies in capturing the reality of human poverty. In this regard, we believe the MPI suffers from many serious drawbacks:
1. Combining micro-data from MICS, WHS and DHS surveys in a single analysis, given the definitional and operational differences between these surveys and between the various rounds of the same survey, make the exercise of the MPI particularly challenging. For example, the MICS 1, MICS 2 and MICS 3 differ in their methodologies. The OPHI introduced a single composite index, MPI, in an attempt to bring together multi-dimensional features of deprivation. Calculating the same MPI from a variety of surveys for all countries may not have been the best alternative. Rather than having a ‘one size fit all’ measure, an MPI-1 for some countries and MPI-2 for other countries would better reflect socio-economic differences among the countries and regions. For example, perhaps including unemployment as dimension at least for those countries for which unemployment data is available in their surveys as a beginning of including such dimension. 7
2. Compared to the MDGs where the representation of the health area holds three out of eight goals (MDG 4 on child mortality, MDG 5 on maternal health and MDG 6 on HIV/AIDS, malaria and other major diseases) that include about one third of the main MDGs indicators, the health dimensions in the MPI are very limited, having only two indicators.
3. Multidimensional deprivation has cut-off, weight points. This is not equivalent to 3 out of the 10 dimensions. For example a household deprived from two dimensions one in Health with weight of 1.6 and one in Education with weight of 1.6 will be considered poor because the weight sum exceeds 3 weight points. However, a household deprived from 5 dimensions in Standard of Living each with a weight of 0.56 will not be considered poor because the weight sum does not exceed 3 weight
points. Thus, holding constant, the result will be sensitive to the imbalance in choosing the number of dimensions within each area. The current version of the MPI adopts, with no justification, a 2: 2: 6 dimensions structure in the Health: Education: Standard of Living areas.
4. The selection of is also arbitrary. For the sake of completion, these partial results
should be augmented by calculating and reporting , where means overall deprivations. Moreover, the cut-off points within each dimension are also debatable. For example, why would one choose below five years of schooling as a measure for deprivation from education rather than completion of primary or secondary education?
5. A key issue in the MPI is the absence of the synergy between dimensions when mapping their impacts on the MPI aggregation method. Contrary to the formula of the HPI, which uses the generalized means 8the MPI aggregation method is ‘neutral’ in that individual ’s poverty level has a vanishing cross partial derivative for
any pair of dimensions in which is deprived. It is often argued that this cross partial derivatives can be positive, reflecting a form of complementarities across dimensions; or negative, reflecting a form of substitutability across dimensions.
Notwithstanding these drawbacks, we should not lose sight of the fact that the MPI and HPI are quite different.Hence, even with a new and improved MPI, it would still be difficult to compare results. The HPI is more macro-oriented and is less “dimensional” while the MPI is geared to capture household-level deprivation and therefore more “microscopic” in nature and is designedto capture the incidence poverty for household that showseveral manifestations of deprivation. Still, judging by what we know from other economic and human development indicators, the MPI fails to capture any stretch of the reality of poverty in Arab MICs (particualry for Morocco, Egypt and Tunisia in the Arab region) and is therefore of little use in poverty monitoring and development planning.
23
As these indicies are reported at the national level we should also not lose sight of the fact that there are large inequalities in the extent and spread of deprivation between rich and poor households and rural and urban residents in many Arab countries. These inequalities are reported for a selected group of Arab countries. Our results show sub-national disparities in multidimensional poverty are significantly higher in Morocco (whether rural resident or for lower quintile) and to a lesser extent in Egypt in Syria. Inequalities in child and maternal health between the rich and poor are also pronounced in Egypt, Yemen and Sudan.
Endnotes 1Ravallion 1994
2 World Bank 2001
3Sen 1999: 38
4Definition of Human Poverty, http://hdr.undp.org/en/statistics/indices/hpi/
5HDR 2010
6 HDR 2010
7 It is noteworthy that the HPI was developed and applied by the UNDP in two versions: HPI-1 for developing
countries and HPI-2 for selected developed countries. 8 This is acknowledged in the paper of Alkaire and Foster (2009) where a -transformation requires dimensions to
be all substitutes or all complements and with a strength that is uniform across all pairs and for all people. This seems unduly restrictive.
REFERENCES Alkire, S. and M. Santos. 2010. “Acute Multidimensional Poverty: A New Index for Developing Countries,” Human Development Research Paper 11, UNDP–HDRO, New York.
Alkire, S. and J.Foster. 2009. “Counting and Multidimensional Poverty Measurement.” OPHI Working Paper 7. Oxford Poverty and Human Development Initiative, Oxford, UK.
Sheth, M.2010.”Inequalities in Maternal & Child Health in the MENA Region”. Presentation at the Regional Management Meeting (RMT), Oct2010, Amman.
UNDP (United Nations Development Programme). 2010a. Human Development Report 2010: The Real Wealth of Nations: Pathways to Human Development. Palgrave Macmillan. New York.
Ravallion, M. 1994. “Poverty Comparisons: Fundamentals in Pure and Applied Economics”. Vol. 56, Harwood Academic Publishers.
Sen, A. 1999. “Development as Freedom”. Oxford, Oxford University Press.
25
ANNEX TABLES
1. Human development and human poverty tables Table1.1: Gross National Income (GNI) vs. Human Development Index (HDI), (Values and ranks), 2010
Country
Gross National Income per capita GNI (PPP US$ 2008)
Source: Consolidated from several successive editions of HDR
29
2. Multi-dimentional poverty tables 2.1 Regional and sub-regional multi-dimensional poverty tables Table 2.1.1 Average deprivation in education at the urban, rural and national level
Source: Authors estimates based on data from Human Development Reports and OPHI
31
2.2 MPI Country Fact Sheets 2.2.1 Egypt Based on Demographic and Health Survey (DHS 2008) and Household Income Expenditure and Consumption Survey (HIES 2008/09)
2.2.1.1 Multi-dimensional poverty Index (MPI) and its two components (Incidence of poverty (H) and average intensity of deprivation faced by the poor (A)) at the national level, for urban areas, for rural areas and by quintile: DHS 2008 and comparisons with HIES 2008/09.
2.2.1.2 Deprivation in each Indicator (%):DHS2008and comparisons with HIES 2008/09
Indicator Deprivation in each Indicator (%)
DHS 2008 HIES 2008/09
Child Mortality 4 N/A
Nutrition 1.8 N/A
Child Enrolment 4.9 2.686
Years of Schooling 2.7 10.197
Drinking water 0.4 0.375
Electricity 0.2 0.425
Cooking Fuel N/A 1.132
Flooring 2.4 2.801
Sanitation 1.1 4.133
Assets 1.5 8.099
Source: OPHI and CAPMAS 2.2.1.3 Contribution of Indicators to the overall MPI (%) at the national level, for urban areas and for rural areas: DHS 2008and comparisons with HIES 2008/09
Years of Schooling 17.2 23.2 15.9 55.007 58.246 53.964
Drinking water 1.2 0.5 1.3 0.673 0.495 0.731
Electricity 0.5 0.2 0.6 0.764 0.5 0.849
Cooking Fuel 0 0 0 2.036 1.578 2.183
Flooring 6.1 2.2 6.9 5.037 2.391 5.889
Sanitation 2.9 2.4 3 7.432 7.932 7.27
Assets 3.8 2.7 4.1 14.563 15.298 14.327
Source: OPHI and CAPMAS
32
2.2.1.4 Contribution of Indicators to the overall MPI (%) by quintile: HIES 2008/09
Indicator Q1 Q2 Q3 Q5 Q5
Child Enrolment 24.047 16.715 14.001 6.438 1.371
Years of Schooling 45.468 54.369 56.08 61.035 67.575
Drinking water 0.76 0.587 0.638 0.838 0.483
Electricity 1.067 0.858 0.537 0.772 0.248
Cooking Fuel 2.456 1.455 2.063 2.026 1.922
Flooring 5.274 4.702 5.381 5.501 4.238
Sanitation 7.439 7.368 7.237 8.021 7.089
Assets 13.487 13.947 14.065 15.369 17.074
Source: OPHI and CAPMAS
2.2.2 Syria Based on Household Income Expenditure and Consumption Survey (HIES 2007) and Multiple Indicator Cluster Survey (MICS 2006). 2.2.2.1 Multi-dimensional poverty Index (MPI) and its two components (Incidence of poverty (H) and average intensity of deprivation faced by the poor (A)), at the national level, for urban areas, for rural areas and by quintile: MICS 2006 and comparisons with HIES 2007.
2.2.2.2 Deprivation in each Indicator (%): MICS 2006and comparisons with HIES 2007
Indicators Deprivation in each Indicator (%)
MICS 2006 HIES 2007
Child Mortality 3.2
Nutrition 2.1
Child Enrolment 4.4 3.4641
Years of Schooling 1.3 3.6389
Drinking water 1.7 1.8819
Electricity 0.2 0.1582
Cooking Fuel 0.1 0.2998
Flooring 1 0.6662
Sanitation 1 4.7881
Assets 0.5 2.0235
OPHI and Central Bureau of Statistics
33
2.2.2.3 Contribution of Indicators to the overall MPI (%) at the national level, for urban areas and for rural areas: MICS 2006and comparisons with HIES 2007.
Indicator Contribution of Indicators to the overall MPI (%)
Years of schooling 10.3 10.1 10.4 35.072 34.8432 35.1408
Drinking water 4.4 1.9 5.9 6.046 9.7561 4.9357
Electricity 0.4 0.3 0.5 0.508 0.4646 0.5214
Cooking fuel 0.4 0.2 0.5 0.963 0.1161 1.2165
Flooring 2.7 0.5 3.9 2.14 1.3937 2.3636
Sanitation 2.7 0.2 3.5 15.383 5.6911 18.2829
Assets 1.2 0.7 1.5 6.501 5.5749 6.7779
OPHI and Central Bureau of Statistics
2.2.2.4 Contribution of Indicators to the overall MPI (%) by quintile: HIES 2007
Indicator Contribution of Indicators to the overall MPI (%)
Q1 Q2 Q3 Q5 Q5
Child Enrolment 36.67 33.46 28.9 33.45 31.77
Years of Schooling 26.74 37.59 39.94 37.7 40.94
Drinking water 5.772 6.14 6.232 5.664 6.721
Electricity 0.594 0.376 0.708 0.354 0.407
Cooking Fuel 1.443 1.003 0.425 0.885 0.611
Flooring 3.735 1.128 2.125 1.947 0.204
Sanitation 18.08 15.41 14.73 13.27 12.22
Assets 6.961 4.887 6.941 6.726 7.128
OPHI and Central Bureau of Statistics
2.2.3 Morocco Based on Living Standards Measurement Study (LSMS) and Multiple Indicator Cluster Survey (MICS 2006). 2.2.3.1 Multidimensional poverty Index (MPI) and its two components (Incidence of poverty (H) and average intensity of deprivation faced by the poor (A)) at the national level, for urban areas, for rural areas and by quintile: MICS 2006.
Index MICS 2006
All Morocco Urban Rural Q1 Q5
MultidimensionalPoverty Index (MPI = HxA)
0.133 0.038 0.254 0.41 0.004
Incidence of Poverty (H) 26.63% 9.43% 48.52% 73.56% 0.96%
Average Intensity Across the Poor (A)
50.01% 40.65% 52.33% 55.76% 40%
OPHI and National Institute of Statistics and Applied Economics
34
2.2.3.2 Deprivation in each Indicator (%): LSMS 2007 and comparisons with MICS 2006
Indicator Deprivation in each Indicator (%)
LSMS 2007 MICS 2006
Child Mortality 0.63 NA
Nutrition 18.54 NA
Years of Schooling 32.26 24.88
ChildEnrolment 13.67 18.71
Electricity 14.86 12.93
Drinking water 29.28 18.38
Sanitation 18.26 22.31
Flooring N/A 17.77
Cooking Fuel 11.04 8.59
Assets 12.09 15.13
OPHI and National Institute of Statistics and Applied Economics
2.2.3.3 Contribution of Indicators to the overall MPI (%) at the national level, for urban areas and for rural areas: MICS 2006
Indicator MICS 2006
National Urban Rural
Child Mortality NA NA NA
Nutrition NA NA NA
Years of Schooling 35.54 42.96 34.12
Child Enrolment 21.54 28.39 20.22
Electricity 6.54 4.31 6.97
Drinking water 7.33 3.97 7.97
Sanitation 9.49 8.87 9.61
Flooring 7.86 1.57 9.07
Cooking Fuel 4.26 0.64 4.95
Assets 7.43 9.27 7.08
OPHI and National Institute of Statistics and Applied Economics 2.2.3.4 Contribution of Indicators to the overall MPI (%) at the national level, for urban areas, by quintile: MICS 2006
Indicator MICS 2006
Q1 Q5
Child Mortality NA NA
Nutrition NA NA
Years of Schooling 31.94 25
Child Enrolment 16.96 62.5
Electricity 8.59 0
Drinking water 7.58 1.39
Sanitation 10.54 8.33
Flooring 10.56 0
Cooking Fuel 6.09 2.78
Assets 7.73 0
OPHI and National Institute of Statistics and Applied Economics
35
2.2.4 Lebanon
Based on Household Income Expenditure and Consumption Survey (HIES 2005). 2.2.4.1 Multidimensional poverty rate (MPI) and its two components by quintile (Incidence of poverty (H) and average intensity of deprivation faced by the poor (A)) at the national level and by quintile: HIES 2005.
Index (HIES 2005)
All Lebanon Q1 Q2 Q3 Q4 Q5
Multidimensional Poverty Index (MPI = HxA)
0.027 0.025 0.026 0.030 0.025 0.030
Incidence of Poverty (H) 0.073 0.069 0.071 0.078 0.066 0.078
Average Intensity Across the Poor (A)
0.378 0.365 0.374 0.379 0.383 0.380
OPHI and Central Administration of Statistics (CAS)
2.2.4.2 Deprivation in each Indicator (%): HIES 2005.
Indicators Deprivation in each Indicator (%)
(HIES 2005)
Child Enrolment 1.4693
Years of Schooling 0.0425
Drinking water 0.16
Electricity 0.0756
Cooking Fuel 2.7669
Flooring 6.3164
Sanitation 1.8956
Assets 5.4875
OPHI and Central Administration of Statistics (CAS)
2.2.4.3 Contribution of Indicators to the overall MPI (%) at the national level and by quintile: HIES 2005
Indicator All Lebanon Contribution of Indicators to the overall MPI (%)
Years of Schooling 49.917 53.488 53.68 51.24 44.536 48.731
Drinking water 4.455 5.819 6.146 4.39 4.178 2.988
Electricity 0.129 0.255 0 0 0.164 0.219
Cooking Fuel 0.485 0 0.402 0.339 0.9 0.586
Flooring 0.229 0 0.175 0 0.331 0.478
Sanitation 8.39 7.728 6.552 8.654 8.747 9.387
Assets 19.152 18.372 19.696 19.852 19.27 18.582
OPHI and Central Administration of Statistics (CAS)
36
2.2.5 Yemen
Based on Household Income Expenditure and Consumption Survey (HIES 2006) and Multiple Indicator Cluster Survey (MICS 2006). 2.2.5.1 Multidimensional poverty rate (MPI) and its two components by quintile (Incidence of poverty (H) and average intensity of deprivation faced by the poor (A)) at the national level, for urban areas, for rural areas and by quintile: MICS 2006 and comparisons with HIES 2006.
2.2.5.2 Deprivation in each Indicator (%): MICS 2006 and comparisons with HIES 2006.
Indicators Deprivations in each Indicator (%)
MICS 2006 HIES 2006
Child Mortality 34.4
Child Enrolment 33.5 28.57447
Years of Schooling 12.5 31.1929
Drinking water 31.9 30.52136
Electricity 31.2 22.39229
Cooking Fuel 28.4 20.27074
Flooring 20.8 22.72451
Sanitation 25.7 25.61209
Assets 27.4 27.69266
OPHI and Central Statistical Organization (CSO)
2.2.5.3 Contribution of Indicators to the overall MPI (%) at the national level, for urban areas and for rural areas: MICS 2006and comparisons with HIES 2006.
Indicator
Contribution of Indicators to the overall MPI in %