17
The Effect of Water Salinity Levels on Water Acidity (pH) and Water Conductivity in Jeddah Intermediate gifted school Jeddah / Saudi Arabia 2019

The Effect of Water Salinity
Levels on Water Acidity (pH)
and Water Conductivity in
Jeddah
Intermediate gifted school
Jeddah / Saudi Arabia
2019

The Effect of Water Salinity Levels on Water
Acidity (pH) and Water Conductivity in Jeddah
By: Lamar Yahya Tomahi
Gifted School, Intermediate Level
Jeddah/ Saudi Arabia
Supervisor: Hind Al-jehani
21 of January – 16 of March
Index:
1 Abstract 4
2 Key words 5
3 The Problem 5
4 Research Question 5
5 Hypothesis 5
6 Steps 6
7 Experiment tools 9
8 Results 10
9 Conclusions 14
10 Discussions 14
11 References 15
12 Thanks 16
Abstract:
Water is an important element of our life. It is composed of oxygen and
hydrogen. Saltwater characteristics differ from fresh water. Seawater
average salinity equal to 3.5%. The average of sea water density at the
ocean surface is 1.025, which is higher than the fresh and pure water
density because dissolved salts increase the mass of water. Some ions
have a great precipitation velocity. The percentage of dissolved solids
in seawater is much higher than that of freshwater solvents.
Conductivity is a measure of the water's ability to pass an electric flow.
It decreases with increasing of salinity and increases with the increases
of temperature. The pH is abbreviation of " power of hydrogen " and it
measures the molten concentration of the hydrogen ions in the water.
The study indicates the effect of water salinity on the value of the
conductivity and acidity (pH) and the relationship between them. In
the study of this relationship, GLOBE devices were used: hydrometer
(specific gravity), the alcohol thermometer (temperature), the
conductivity meter, the pH meter as well as the salinity table. In the
research experiment, the following were used: fresh, salt, pure water.
This study showed several conclusions .
Key Words:
Water pH
Water salinity
Water conductivity
Problem: Study the effect of increased salinity on
water acidity (pH) and conductivity
Research Question: Does increasing salinity level
influence water acidity (pH) and water conductivity?
Hypothesis:
1. Increasing salinity level influence water conductivity.
2. Increasing salinity level does not influence water
conductivity.
3. Increasing salinity level influence water acidity (pH).
4. Increasing salinity level does not influence water
acidity (pH).
Time limits: 12:30
Place limits: Intermediate gifted school
Steps:
1. Put 190 ml of fresh water in a glass tube and
measuring the water temperature using alcohol
thermometer and measuring water specific gravity
using a hydrometer to find the level of salinity in the
fresh water based on the table. Then, measuring
water acidity using water acidity measuring device
and the same for water conductivity level. Then,
adding 190 ml of seawater into a glass tube and doing
the same measurement as above.
2. In the first experiment, I add seawater to the 190 ml
of fresh water and then I measure: water
temperature using alcohol thermometer, water
specific gravity using a hydrometer, water acidity and
water conductivity. I noticed that salinity level
increased while conductivity and water acidity
decreased. In the second time, I added 60 ml of
seawater to 190 ml of fresh water. Then, I did the
same measurement as above. I noticed this time that
salinity level increased and water acidity (pH)
decreased while water conductivity remained stable.
In the third time, I added 90 ml of seawater to 190 ml
of fresh water. I did the same measurements of water
temperature, acidity and conductivity as above. In the
third experiment, I noticed that salinity level
increased and water acidity decreased while
conductivity remained the same. In the fourth time, I
added 120 ml of seawater to 190 ml of fresh water.
Then, I did the same measurements as above. I
noticed this time that water slat level increased and
water acidity decreased while conductivity did not
change. After repeating this 5-11 times, I noticed that
water acidity reached a saturation level and did not
change while conductivity remained stable in all the
trials.
3. In the second experiment, I used pure water to verify
the above results because seawater has ions that
might influence the results. Therefore, I put 190 ml of
fresh water in a glass tube I added 2 gm. of natural
salt to 30 ml of pure water. And then I measure:
water temperature using alcohol thermometer, water
specific gravity using a hydrometer, water acidity and
water conductivity. I noticed that salinity level
increased while conductivity decreased while water
acidity (pH) increased. In the second time, I added 60
ml of pure water and 4gm. of natural salt to 190 ml of
fresh water. Then, I did the same measurement as
above. I noticed this time that salinity level increased
and water acidity (pH) increased while water
conductivity remained stable. In the third time, I
added 90 ml of pure water and 6gm. of natural salt to
190 ml of fresh water. Then, I did the same
measurement as above. I noticed this time that
salinity level increased and water acidity (pH)
increased while water conductivity remained stable.
In the fourth time, I added 120 ml of pure water and
8gm. of natural salt to 190 ml of fresh water. Then, I
did the same measurement as above. I noticed this
time that water slat level increased and water acidity
(pH) increased while conductivity did not change. In
the fifth time, I added 150 ml of pure water and
10gm. of natural salt to 190 ml of fresh water. Then, I
did the same measurement as above. I noticed this
time that water slat level increased and water acidity
(pH) increased while conductivity did not change.
After repeating this 6-11 times, I noticed that water
acidity (pH) reached a saturation level and did not
change while conductivity remained stable in all the
trials.
1 3 2 4
5 6 7 8
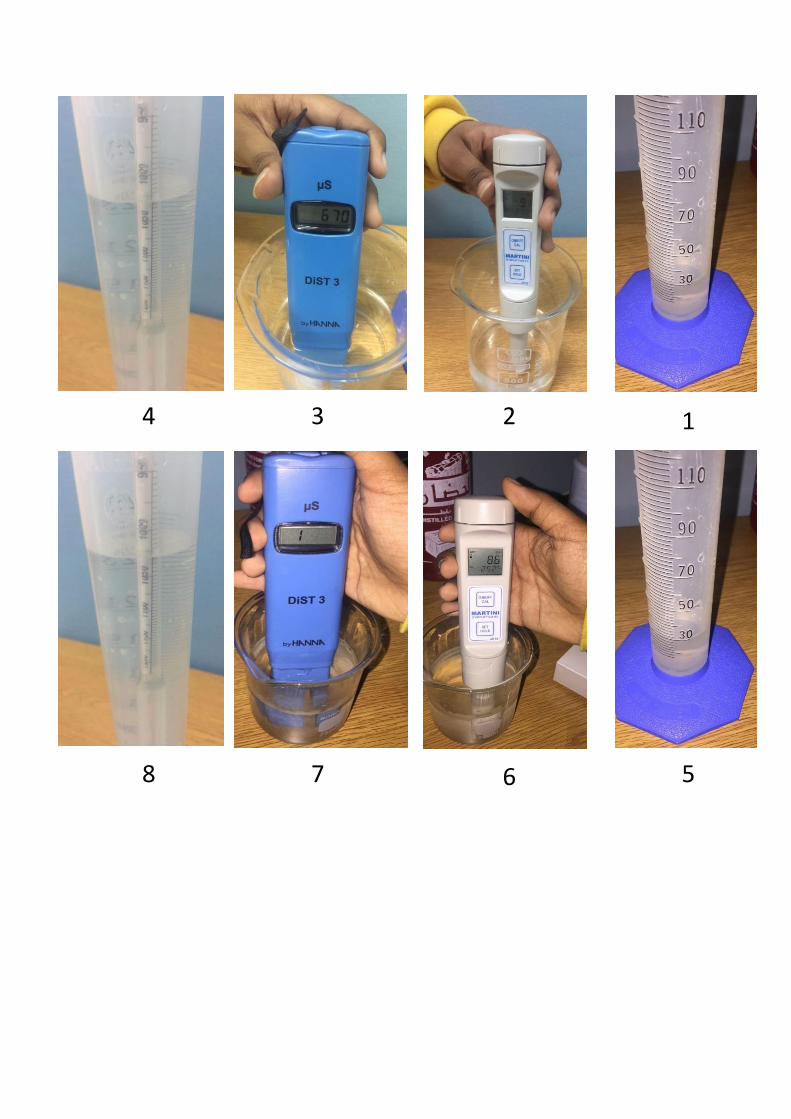
Experiment tools :
Water acidity measuring device, water conductivity
value measurement device, salinity table, alcohol
thermometer, hydrometer, pen and a paper, computer
for data analysis, glass tube.
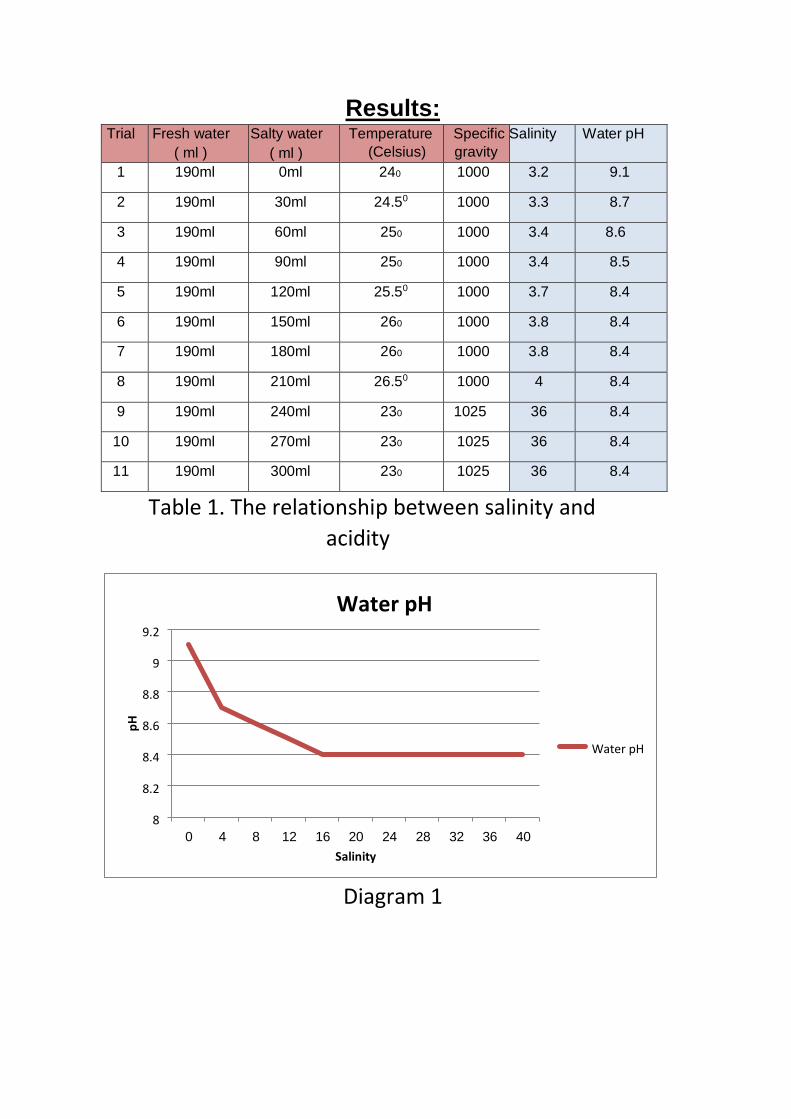
Results: Trial Fresh water
( ml ) Salty water
( ml ) Temperature
(Celsius) Specific
gravity Salinity Water pH
1 190ml 0ml 240 1000 3.2 9.1
2 190ml 30ml 24.50 1000 3.3 8.7
3 190ml 60ml 250 1000 3.4 8.6 4 190ml 90ml 250 1000 3.4 8.5
5 190ml 120ml 25.50 1000 3.7 8.4
6 190ml 150ml 260 1000 3.8 8.4 7 190ml 180ml 260 1000 3.8 8.4
8 190ml 210ml 26.50 1000 4 8.4
9 190ml 240ml 230 1025 36 8.4
10 190ml 270ml 230 1025 36 8.4 11 190ml 300ml 230 1025 36 8.4
Table 1. The relationship between salinity and
acidity
Diagram 1
8
8.2
8.4
8.6
8.8
9
9.2
0 4
8 12
16 20
24 28
32 36
40
Salinity
Water pH
Water pH
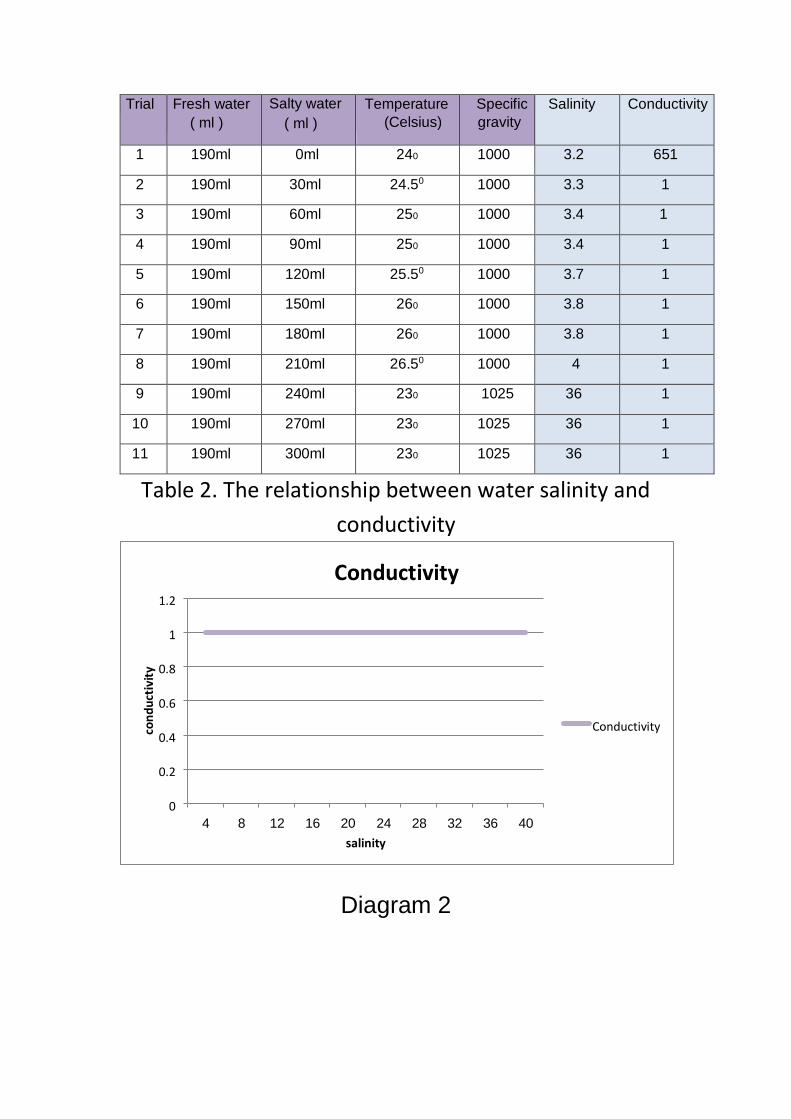
Trial Fresh water ( ml )
Salty water ( ml )
Temperature
(Celsius) Specific
gravity Salinity Conductivity
1 190ml 0ml 240 1000 3.2 651
2 190ml 30ml 24.50 1000 3.3 1 3 190ml 60ml 250 1000 3.4 1
4 190ml 90ml 250 1000 3.4 1
5 190ml 120ml 25.50 1000 3.7 1 6 190ml 150ml 260 1000 3.8 1
7 190ml 180ml 260 1000 3.8 1
8 190ml 210ml 26.50 1000 4 1 9 190ml 240ml 230 1025 36 1
10 190ml 270ml 230 1025 36 1
11 190ml 300ml 230 1025 36 1
Table 2. The relationship between water salinity and
conductivity
Diagram 2
0
0.2
0.4
0.6
0.8
1
1.2
4 8
12 16
20 24
28 32
36 40
salinity
Conductivity
Conductivity
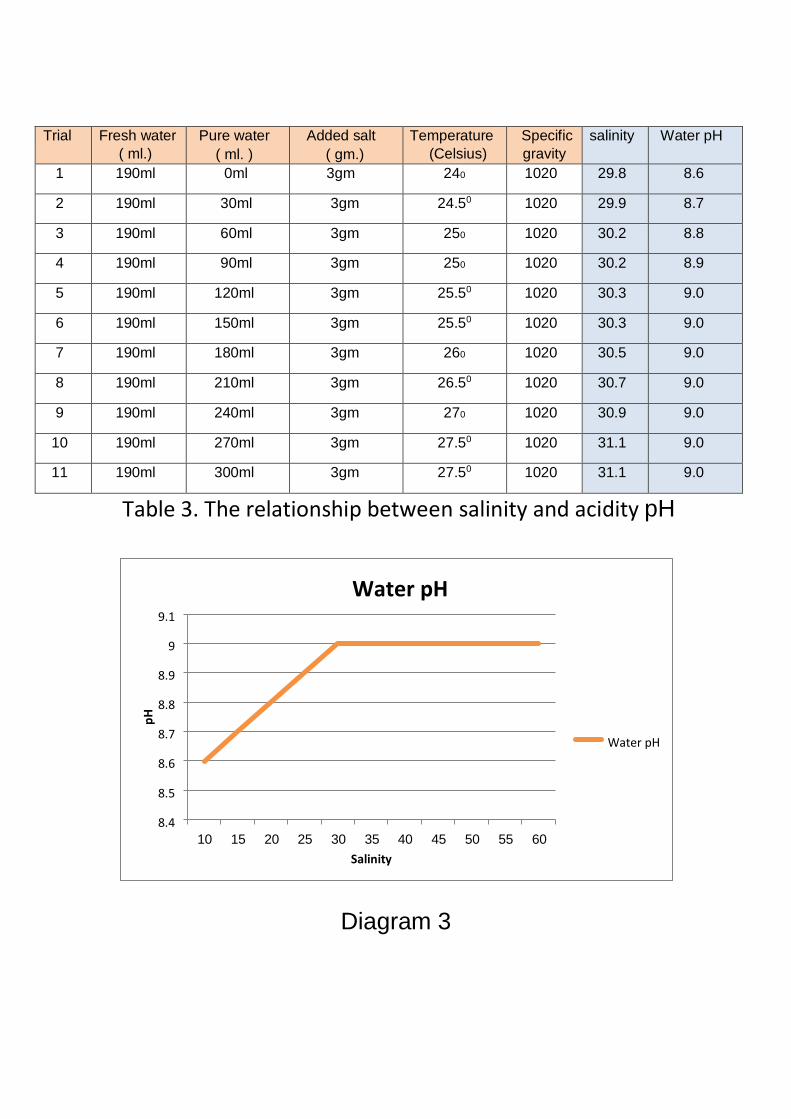
Trial Fresh water
( ml.) Pure water
( ml. ) Added salt
( gm.) Temperature
(Celsius) Specific
gravity salinity Water pH
1 190ml 0ml 3gm 240 1020 29.8 8.6
2 190ml 30ml 3gm 24.50 1020 29.9 8.7
3 190ml 60ml 3gm 250 1020 30.2 8.8 4 190ml 90ml 3gm 250 1020 30.2 8.9
5 190ml 120ml 3gm 25.50 1020 30.3 9.0
6 190ml 150ml 3gm 25.50 1020 30.3 9.0 7 190ml 180ml 3gm 260 1020 30.5 9.0
8 190ml 210ml 3gm 26.50 1020 30.7 9.0
9 190ml 240ml 3gm 270 1020 30.9 9.0
10 190ml 270ml 3gm 27.50 1020 31.1 9.0 11 190ml 300ml 3gm 27.50 1020 31.1 9.0
Table 3. The relationship between salinity and acidity pH
Diagram 3
8.4 8.5 8.6 8.7 8.8 8.9
9 9.1
10 15
20 25
30 35
40 45
50 55
60
Salinity
Water pH
Water pH
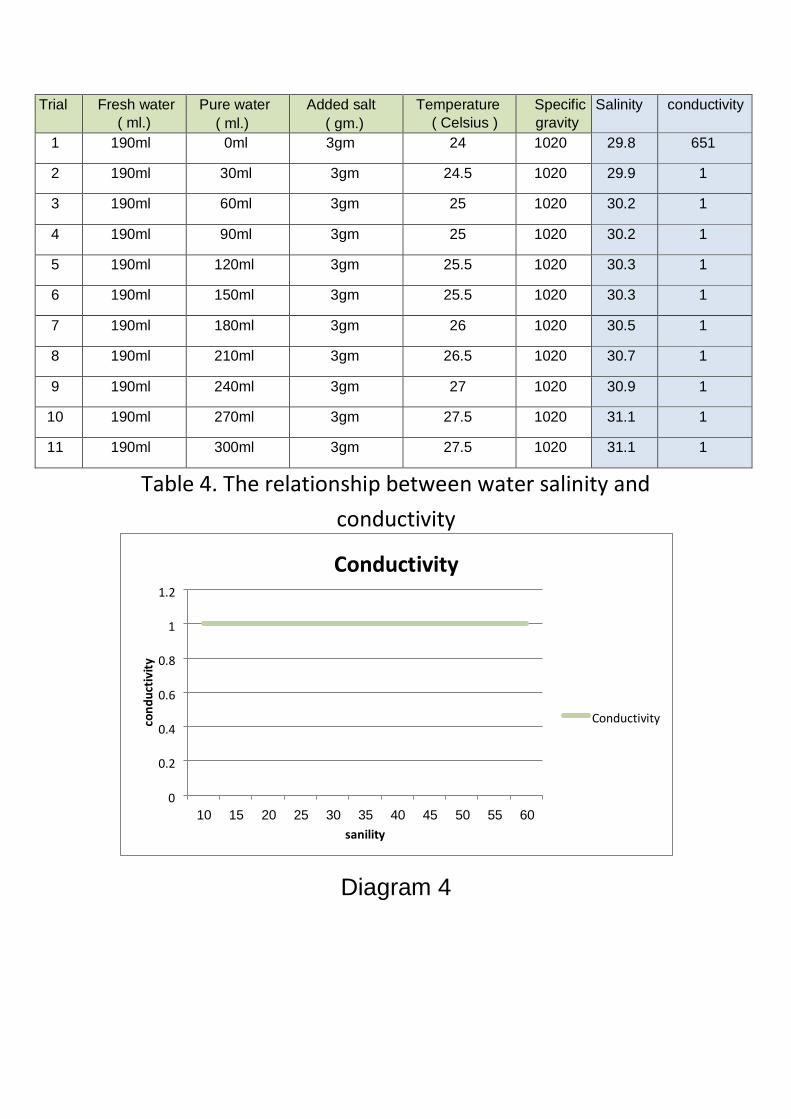
Trial Fresh water
( ml.) Pure water
( ml.) Added salt
( gm.) Temperature
( Celsius ) Specific
gravity Salinity conductivity
1 190ml 0ml 3gm 24 1020 29.8 651
2 190ml 30ml 3gm 24.5 1020 29.9 1
3 190ml 60ml 3gm 25 1020 30.2 1
4 190ml 90ml 3gm 25 1020 30.2 1
5 190ml 120ml 3gm 25.5 1020 30.3 1
6 190ml 150ml 3gm 25.5 1020 30.3 1
7 190ml 180ml 3gm 26 1020 30.5 1
8 190ml 210ml 3gm 26.5 1020 30.7 1
9 190ml 240ml 3gm 27 1020 30.9 1
10 190ml 270ml 3gm 27.5 1020 31.1 1
11 190ml 300ml 3gm 27.5 1020 31.1 1
Table 4. The relationship between water salinity and
Diagram 4
conductivity
0
0.2
0.4
0.6
0.8
1
1.2
10 15
20 25
30 35
40 45
50 55
60
sanility
Conductivity
Conductivity
Conclusion:
A- Diagram (1) shows that the increase of water
salinity is inversely proportional to water acidity (pH).
It was observed from experiment (5-11) that water
reaches the status of saturation. Diagram (2) shows
that increase of water salinity leads to the. stability of
water conductivity
B- In Diagram (3) there are different results, as the
increase of water salinity is directly proportional to
water acidity in case of using distilled water and salt
to make the sample of salt water; it was observed
from experiment (6-11) that water reaches the status
of saturation, this could be due to the change of the
percentage of the ions in salt water and the decrease
of the of (pH) in water to 8, meaning, the medium is
low alkaline. In Diagram (4), it was clear that the
increase of salinity leads to the stability of
water conductivity as in the previous experiment.
Discussions:
There are several studies that were concerned with
water which proved that conductivity decreases
whenever salinity of water increases, and increases
whenever the water temperature increases. Further,
they demonstrated that the ions existent in seawater
influence the decrease of water (pH). The higher the
water salinity, its acidity increases, such studies are
in agreement with my current Study
References:
EPA. (2012). 5.9 Conductivity. In Water: Monitoring and Assessment. Retrieved from http://water.epa.gov/type/rsl/monitoring/vms59.cfm
2. Perlman, H. (2014). Electrical Conductivity and Water. In The USGS Water Science School. Retrieved from http://ga.water.usgs.gov/edu/electrical-conductivity.html
3. Miller, R. L., Bradford, W. L., & Peters, N. E. (1988). Specific Conductance: Theoretical Considerations and Application to Analytical Quality Control. In U.S. Geological Survey Water-Supply Paper. Retrieved from http://pubs.usgs.gov/wsp/2311/report.pdf
Globe program profile copy 2015

Thanks:
Thanks to my family for pushing me forward, to my
teacher Mrs. Hind Al-jehani and Mrs. Manal Al-nami
for guiding me, to my school for giving me their
support, Globe for giving me the supplies, Dr. fatoon
for her help and guidance.


