THE APPLICABILITY OF SODA ASH MANUFACTURING WASTES TO FLUE GAS DESULFURIZATION by JAMES EDWIN SCROGGINS, B.S. A THESIS IN CIVIL ENGINEERING Submitted to the Graduate Faculity of Texas Tech University in Particial Fulfillment of the Requirements for the Degree of MASTER OF SCIENCE IN CIVIL ENGINEERING May, 1984
Transcript
THE APPLICABILITY OF SODA ASH MANUFACTURING
WASTES TO FLUE GAS DESULFURIZATION
by
JAMES EDWIN SCROGGINS, B.S.
A THESIS
IN
CIVIL ENGINEERING
Submitted to the Graduate Faculity of Texas Tech University in Particial Fulfillment of
the Requirements for the Degree of
MASTER OF SCIENCE IN
CIVIL ENGINEERING
May, 1984
1 •
^>''" ACKNOWLEDGEMENTS
The research from which this report was derived was financed
by Texasgulf Chemicals Co. of Raliegh N. C. Sincere appreciation is
extended to this organization and their support is gratefully
acknowledged.
Sincere appreciation is expressed to Dr. R. H. Ramsey for his
guidance throughout the project, in addition to Dr. L.V. Urban, Dr.
B. J. Claborn, and Dr. R. M. Bethea for their helpful criticism.
n
TABLE OF CONTENTS
ACKNOWLEDGEMENTS i i
ABSTRACT v
LIST OF TABLES vi
LIST OF FIGURES vi 11
I. INTRODUCTION 1
II. LITERATURE REVIEW 5
Sulfur Dioxide Scrubbing Process 5
Rate of Contact 6
SOp Absorption 6
Scrubber Design * 10
Spray Tower 12
Sieve Tray 12
Corrosion Protection 13
Cost Information 16
Capital 18
Operations 19
Maintenance 20
Availability 20
III. EXPERIMENTAL PROCEDURES 22
Test Facil ities 22
Test Procedures 25
Test Series One 25
111
Test Series Two 30
Test Series Three 33
Test Series Four 34
Cost Data 36
Capital 36
Operating Costs 37
Maintenance 38
Aval 1 abl i ty 38
Cost Equation 39
IV. PRESENTATION OF DATA 40
Test Series One 40
Reagent Usage 40
SO^ Removal Efficiency 44
Corrosion 44
Seal ing 48
Test Series Two 50
Reagent Usage and SOp Removal Efficiency... 50
Scaling 54
Test Series Three 54
Test Series Four 59
Cost Comparisons 63
Capital Cost Estimates 63
Operating and Maintenance Costs 67
Availablity Costs 72
Limestone vs Sodium Alkali Comparison 73
IV
V. CONCLUSIONS AND RECOMMENDATIONS 78
LIST OF REFERENCES oi
V
ABSTRACT
The objectives of this study were two-fold: 1) to determine the
efficacy of low grade sodium alkalies in wet SOp scrubber
applications and 2) to use a simplified method for comparing the
costs of sodium alkali SOp scrubbing systems and limestone scrubbing
systems. The materials tested were waste streams produced in the
manufacturing of soda ash. Experiments were conducted on full scale
industrial SOp scrubbers to determine optium scrubber operating
conditions for each of the streams that were tested. All the
materials tested performed well in the test scrubber removing up to
97 per cent of the SOp from the gas stream. Crystallizer purge
liquor was found to cause silica scale in the test scrubber which
could be controlled by chemical treatment.
A standardized method of cost estimation was used to obtain
relative costs for sodium alkali and limestone scrubbers. The tests
which were conducted showed that capital, operating and maintenance
costs of sodium alkali scrubbers should be less than a limestone
scrubber of the same size and type. The availablity of the test
scrubber was higher than the availablity given in the literature for
a limestone scrubber. This information was then used to develop
generalized descriptions of SOp scrubbing applications where sodium
carbonate chemicals were more cost effective than limestone systems.
It was found that sodium alkalies could be competitive with
limestone in applications where the sulfur content of the coal is 3
per cent and the cost of the sodium alkali was less than $75/ton.
vi
LIST OF TABLES
Table Page
1. Corrosion Rates for Various Alloys Exposed to
Flue Gas Desulfurization Environment 14
2. Reported Capital and Annual Costs 17
3. Scrubber Scale Analysis 28
4. Evaporator Purge Liquor Analysis 30
5. Mine-water Analysis 33
6. Typical Analysis of Run-off 35 7. Test Series One, Test One: Reagent Usage and SOp
Removal Efficiency Results 41
8. Test Series One, Test Two: Reagent Usage and SOp Removal Efficiency Results 42
9. Test Series One, Test Three: Reagent Usage and SOp Removal Efficiency Results 43
10. Stoichiometric Ratio at Various pH Values 46
11. Comparison of Coupon Corrosion Weight and Rate Changes 47
12. Increases in Scrubber Back Pressure from Calcium Sulfite Scale Formation at 80% Boiler Load 49
13. Test Series Two, Test One: Reagent Usage and SOp Removal Efficiency Results 51
14. Test Series Two, Test Two: Reagent Usage and SOp Removal Efficiency Results 52
15. Test Series Two, Test Three: Reagent Usage and SOp Removal Efficiency Results 53
16. Incease in Scrubber Back-Pressure as a Result of Silica Scale Formation at 80% Boiler Load 55
v n
Table Page
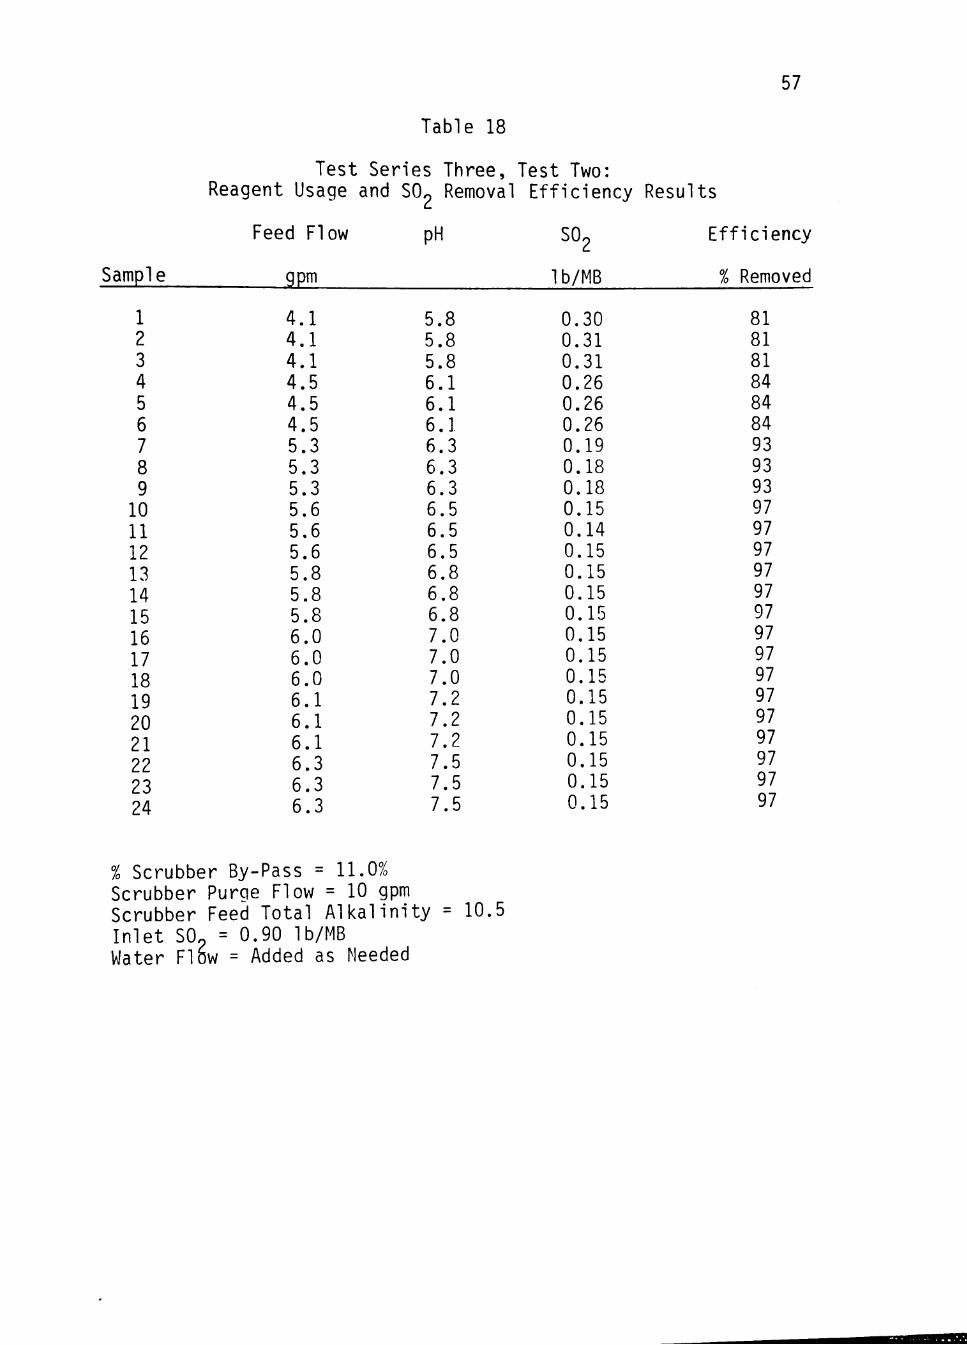
17. Test Series Three, Test One: Reagent Usage and SO^ Removal Efficiency Results 56
18. Test Series Three, Test Two: Reagent Usage and SO^ Removal Efficiency Results. 1 57
19. Test Series Three, Test Three: Reagent Usage and SO^ Removal Efficiency Results 58
20. Test Series Four, Test One: Reagent Usage and SOp Removal Efficiency Results 7. 60
21. Test Series Four, Test Two: Removal Usage and SOp Removal Efficiency Results ;. 61
22. Test Series Four, Test Three: Removal Usage and Removal Efficiency Results 62
23. Limestone Scrubbing Process Capital Investment 64
24. Acid Soda Ash Scrubbing Process Capital Investment. 65
25. Basic Soda Ash Scrubbing Process Capital Investment 66
26. Limestone Scrubbing Process Annual Operating Costs Less Reagent Costs 68
27. Acid Soda Ash Scrubbing Process Annual Operating Costs Less Reagent Costs 69
28. Basic Soda Ash Scrubbing Process Annual Operating Costs Less Reagent Costs 70
29. Sodi um Al kal 1 Reagent Costs 71
30. Annualized Costs Less Reagent Cost 74
31. Total Annual Costs for a Limestone Scrubber 74
32. Competitive Sodium Alkali Reagent Costs 75
VT n
LIST OF FIGURES
Figure Page
1. Diagram of Test Scrubber 23
2. General Arrangement of Air Pollution Control Equipment 26
3. Scrubber Efficiency vs pH 45
4. Annual Costs as a Function of Percent Sulfur in Coal and Reaoent Costs 77
IX
CHAPTER I
INTRODUCTION
Most fossil fuels contain sulfur and produce sulfur oxides when
burned. Sulfur dioxide, the most abundant of the oxides, has been
found to cause morphological changes in the cells of the upper
respiratory tract of humans similar to the cellular changes caused
by cigarette smoking. It has also been determined that high ambient
SOp concentrations can cause the premature death of individuals with
weakened cardio-pulmonary systems [11.
In addition to adverse health effects, SOp can cause costly
corrosive damage to vegetation and manmade structures. Atmospheric
SOp combines with water and oxygen to form sulfuric acid which comes
in contact with the surface of the earth either as "dry deposition"
or "acid rain" [2]. Much attention has recently been given to the
effect of acid rain on oligotrophic mountain lakes. Because such
lakes are characteristically low in alkalinity, acid rains lower the
pH of the lake water below the point at which fish can survive. In
Canada near the Sudbury smelters the ph in 33 near by lakes have
dropped 100 fold [26]. Thousands of these lakes in the Adirondack
Mountains are being threatened by the effects of acid rains [3].
In an effort to protect the public health and to mitigate the
deleterious effects of acid rain, federal and state regulations have
been promulgated to limit the release of SOo. The federal standard
2
for new large coal-fired boilers has been set at 1.2 pounds SOp per
million British thermal units (MB) of heat input to the boiler [27],
Many western states, where low-sulfur coal is abundant and the
alpine aquatic habitat is highly prized, have enacted SOp regula
tions which are much more stringent than the federal regulations.
For example, the state of Wyoming has enacted an emission limit of
0.2 lb SO^/MB of heat input [4]. While certainly providing
protection for the environment, this stringent standard poses a
sizeable technical and economic obstacle to the construction of any
large coal-burning facility in the state of Wyoming.
Currently, the best available control technology for SOp
removal is to contact the SOp laden gases with water containing
soluble alkali chemicals. This contact is achieved in various ways
in wet or dry SOp scrubbers [8]. To meet the Wyoming standard, a
power generation facility which uses western sub-bituminous coal
with a sulfur content of 1 per cent would require an SOo scrubber
that was 90 per cent efficient. It is often necessary to bypass a
portion of the stack gas to keep the temperature in the exit flue
above the dew point to prevent corrosion and stack rain-out. In
those situations, the SOp scrubber would have to be 95 per cent
efficient.
Conventional lime or limestone SOp scrubbers typically operate
at 80 per cent to 85 per cent efficiency [5]. As a result of the
low efficiencies obtained with these materials, some coal-fired
power plants, and industrial facilities, are equipped with SOp
scrubbers which use sodium carbonate (soda ash) as the absorbent.
These units have demonstrated removal efficiencies of 95 per cent
3
and greater [9]. Additionally, the delivered cost of soda ash in
Wyoming is relatively low because there are five soda ash
manufacturing facilities located in the southwestern part of the
state of Wyoming. In the processing of trona ore
(Na^CO^+NaHCO^'H^O) to refined soda ash, the ore is dissolved in
water and the insoluble impurities are separated from the sodium
carbonate liquor. This liquor is then fed to multi-stage
crystallizers which drive off water and re-crystalize the sodium
carbonate. The levels of soluble impurities in the crystal 1izers
which were introduced with the sodium carbonate liquor are
controlled by purging from the last crystallizer effect. One power
generating facility currently buys this purge liquor from a soda ash
manufacturer, which further reduces cost [6]. There is
approximately 1.3 million tons of this material produced each year
and 30 per cent by weight is sodium carbonate. In a raw state it is
only practical to use this material within a 100 mile radius of a
soda ash facility. The purge liquor has to remain heated to prevent
the precipitation of sodium carbonate and the freight penialty from
shipping 70 per cent water increases with distance. Trona ore or
process intermediates could be more cost effective over a wider
range of applications. As a result of requiring less auxiliary
equipment and a less corrosive scrubbing environment, soda ash
scrubbers could be less expensive than lime or limestone scrubbers
in some applications.
The purpose of this study is to determine 1) the efficacy of
various low grade sources of sodium alkalies which could be used as
SO^ absorbants and 2) the cost effectiveness of operating a sodium
alkali scrubber compared to a limestone scrubber. This information
is then used in a cost comparison of sodium alkali and
lime/limestone scrubbers for new installations using cost estimating
procedures developed by the Tennessee Valley Authority. All cost
analysis is based on the facilities needed for a 500 MW power
generation facility.
CHAPTER II
LITERATURE REVIEW
As an aid to accomplishing the objectives of this study, a
review of available literature was conducted. A search was first
made for information relative to SOp scrubbing processes. Specif
ically, sources were sought that gave information about the opera
ting parameters, chemistry and process layout of various SOp
scrubbing techniques. Design information for several SOp scrubbers
has been included in this review. Emphasis was given to those
design aspects which may be affected by operating the scrubber in
the alkaline pH range. Finally, cost information for several
existing scrubber operations was examined.
Sulfur Dioxide Scrubbing Process
At the present, the vast majority of SO^ scrubbers are "wet"
scrubbers [7]. Wet scrubbers circulate alkali liquors in a contact
chamber through which the SO^-laden flue gas is forced. The SOp
removal efficiency of a particular scrubber is primarily dependent
upon three factors:
1. Rate of contact of the flue gas with the recirculating
1iquor,
2. The dissolution rate and concentration of the
absorbent, and
3. Liquor saturation with respect to sulfite and sulfate
ions.
These factors will be discussed in the following sections.
Rate of Contact
The physical configuration of the interior of the contacting
vessel and liquor recirculation rate will determine the rate of
contact in the scrubber. The internals of the contacting vessel are
designed to induce intimate contact of the flue gas and the
scrubbing liquor. This is achieved primarily by increasing the
surface area of the scrubbing liquor and promoting turbulent flow.
Provided the concentration of alkali remains constant,
increasing the recirculation rate of a scrubber will increase the
rate of contact. Eventually the relationship becomes asymptotic as
other factors become rate limiting.
SOp Absorption
After the SOp comes into contact with the alkali liquor, it
dissolves and combines with oxygen to form sulfite or sulfate ions.
The chemistry and reaction products will vary with each absorbent.
Lime or Limestone
In a lime or limestone scrubber, the sulfite and sulfate ions
combine with calcium to form calcium sulfite and calcium sulfate,
which precipitate out of the solution and are blown down or purged
from the system [8].
H^O + CaO—»Ca(0H)2
Ca(0H)2 + CO2—>CaC03 + HpO
COp + HpO + CaC03—»Ca(HC03)2
SOp + Ca(HC03)p " ^ CaS03 + 200^ + HpO
CaS03 + iOp - ^ CaSO^
1-1)
1-2)
1-3)
1-4)
1-5)
The dissolution of CaC03 '" ^ ^ presence of water to calcium
and bicarbonate ions is a relatively slow process and therefore, it
is difficult to achieve a removal efficiency greater than 80 per
cent in lime/limestone scrubbers [9].
In an attempt to increase the solubility of the limestone in
the recirculation liquor and consequently the rate of reaction, a
scrubbing process has been developed which incorporates weak organic
acids (primarily adipic acid) [10]. Although removal efficiencies of
over 95 per cent have been reported from full scale field tests,
there are some serious drawbacks associated with this process. One
major deficiency is calcium sulfite "blinding." As a result of the
Increased absorption rate, the recirculation slurry becomes
super-saturated with calcium sulfite. As the excess calcium sulfite
begins to precipitate, the undissolved limestone particles in the
slurry act as seed crystals and become coated with calcium sulfite.
The result of this phenomenon is a drastic reduction in limestone
utilization. One study reports that reagent utilization will drop
to 47 per cent during these events [10].
Other shortcomings of this system are the objectionable odor of
adipic acid and increased heavy metal mobilization in the flue gas
desulfurization (FGD) wastes which are caused by the addition of
8
organic acids. As as result of these problems. Industry, for the
most part, has not accepted organic acid addition as a viable
alternative for flue gas desulfurization.
Soda Ash
The absorption reaction begins with SOp dissolving in the
soda ash liquor. Then the following reactions are thought
to occur [8]:
Na2C03 + SOp—^NapS03 ^ ^^2 ' " ^
Na2S03 + iOp-^^NapSO^ (1-7)
Na2S03 + SOp + HpO —>2NaHS03 (1-8)
2NaHS03 + Op—>2NaHS04 ' " ^
All of these reaction products can be found in solution and
their relative concentrations will vary with pH and the dissolved
oxygen content in the scrubbing solution.
Soda ash processes for SOp removal are characteristically
more efficient than limestone scrubbers due to the greater solubil
ity and dissolution rate of soda ash in comparison with lime
stone [9]. Most manufacturers of soda ash scrubbers guarantee 95
per cent removal efficiency [5].
The rate limiting factor in a soda ash scrubber is the rate of
contact of the SOp with the soda ash liquor. The efficiency of a
soda ash scrubber is, therefore, dependent upon both the scrubber
design and the concentration of the recirculation liquor.
Scrubber feed water often contains calcium ions. These
combine with SOp in the scrubber to form calcium sulfite which
precipitates to form a hard, tenacious scale which can plug spray
9
heads, sieve trays, mist eliminators, etc. Given the calcium
concentration in the make-up water and the solubility of calcium
sulfite at a given pH, it is possible to calculate the blow-down
rate from the system needed to prevent the formation of CaSO^. It
may also be feasible in some processes to use condensate or softened
water in the scrubber, thereby greatly reducing the potential for
calcium scaling [11].
Calcium sulfite scale also can be controlled with water treat
ment chemicals. Several companies have proprietary chemicals which
cause distortions in the crystalline structure of calcium sulfite,
preventing the scale accumulation [12]. A thin layer may form on
the scrubber's surface but the scale will not continue to grow. The
calcium sulfite continues to precipitate but is in a non-adhering
form that stays in suspension and can be blown down from the system.
These proprietary scale inhibitors are surface active and,
therefore, are affected by particulate matter in the recirculation
liquor. These inhibitors are of little use in the combination
scrubbers which remove both SOp and particulate or in systems with
inefficient particulate control equipment preceeding the scrubber
[12].
Dual-Alkali
In this process the recirculation liquor is a sodium sulfite
solution that is regenerated with lime. The primary chemical
reactions which occur in the dual-alkali scrubber are probably the
same as those in a soda ash scrubber. The resulting sodium
sulfite/sodium bisulfite liquor is then regenerated with lime in a
10
clarifler where the following reactions occur [8]:
Na2S03 + Ca(OH)p — > 2NaOH + CaS03 (1-10)
NapSO^ + Ca(0H)2 — ^ 2NaOH + CaSO^ (1-11)
NaHS03 ^ ^^i^^)2 — ^ ^ ^ " ^^03 + HpO (1-12)
NaHSO^ + Ca(0H)2 — ^ NaOH + CaSO^ + HpO (1-13)
The soluble sodium compounds leave with the overflow of the clari
fler and are pumped back to the SOp scrubber. The calcium precipi
tates are discharged with the clarifier underflow, dewatered and
then disposed as a semi-dry solid. Most of the sodium values are
conserved with this system. Only a small amount of sodium carbonate
make-up is required to replace the sodium which is lost with the
dewatered solids and from mist eliminator carry-over [13]. This
system is superior to a limestone system for the following reasons
[9]:
1. scaling, plugging and erosion potentials are reduced,
2. SOp removal efficiency is greater than for limestone,
3. lower recirculation rates are required,and
4. greater utilization of lime and fev/er solid wastes.
Scrubber Design
A number of SOp scrubber designs are presently used in
industry. The current trend is away from combination scrubbers
which remove both particulate and SOp from the flue gas to
separate units for removal of SOp and particulates. The pressure
drop across combination scrubbers is high and the entrained
particulate matter aggravates scaling problems. Also, when these
11
scrubbers malfunction, both particulate and SOp emission control
is lost. Most of the utility and large industrial boilers being
built today are designed with electrostatic precipitators or bag-
houses preceeding SOp scrubbers [5].
SOp scrubbers can be classified into two broad categories:
throwaway and regenerative [8]. Regenerative processes regenerate
the absorbing solution and recover elemental sulfur or sulfuric acid
in the process. Generally, these processes are more capital
intensive and more difficult to operate than throwaway processes.
The economics of regenerative processes generally are not very
attractive and as a result, few of these processes are in current
use [5].
Throwaway processes are categorized into two basic types:
so-called "dry" scrubbers, and wet scrubbers. Dry scrubbers are
elementary spray drying units. An alkali liquor is forced through
an atomizing spray head which discharges into the flue gas stream.
The resulting fine mist contacts the flue gas and the SOp is
absorbed by the dissolved alkali. The heat in the flue gas
evaporates the water associated with the alkali forming dry
particulate matter. There is no liquid recirculating nor blowdown
as a waste stream from this type of scrubber. Since particulate
matter is generated by this scrubber system, it is necessary for the
particulate pollution control device to follow the SOp scrubber.
This is usually a baghouse since it has been found that additional
SOp removal occurs on the surface of the bags [14].
Wet scrubbers are the most numerous SOo removal devices [7].
There are several wet scrubber designs which are currently in use
12
such as weir, cascading, venturi and constant level contact tank
scrubbers, but the most common are spray towers and sieve tray
scrubbers.
Spray Tower
In these scrubbers, several levels of spray heads are mounted
in the scrubber vessel which produce an alkali liquor "rain" through
which the flue gas is forced. The two main advantages of spray
towers are that they have a low pressure drop and scaling is not a
major problem. The main disadvantages are that they are not as
efficient as other designs and require high liquid/gas (L/G) circu
lation ratios (e.g., 30 to 40 gpm of recirculating liquor: 1000
actual cubic feet per minute (ACFM)) [7].
Sieve Tray
Flue gas is forced through a perforated plate which is flooded
with alkali liquor. As the flue gas flows through the holes in the
trays, it is forced into intimate contact with the liquor. Sieve
tray scrubbers are usually more efficient than spray towers but the
pressure drop across this type of scrubber is relatively high.
Sieve tray scrubbers typically require liquid/gas ratios of about
10:1. Fan horsepower requirements are higher than for spray towers
than sieve tray units. Scaling can seriously affect any scrubber's
on stream availability [7].
13
Corrosion Protection
The environment inside SOp scrubbers is extremely corrosive as
a result of low pH values and high chloride concentration (chloride
is Introduced to the scrubber from entrained fly ash). As a result,
special-heat resistant and acid resistant materials are needed for
scrubber construction [16].
The inlet of the SOp scrubber is a difficult area to protect
against corrosion. The SOp concentration in this area is greater
than anywhere else in the system, and the temperature is also
higher.The only effective methods of dealing with this problem is to
construct the inlet section of the scrubber using a stainless steel
with a high molybdenum content. Tests have shown that stainless
steel which contains at least four percent molybdenum withstands
acid/chloride attack exceptionally well [16]. Table 1 gives the
corrosion rates for various alloys in an acid/chloride environment.
The corrosion rates presented in Table 1 are an average of five
corrosion tests which were performed on each of these metals in
several different SOp scrubbers. The maximum pit depth which was
observed during these tests is also presented for each metal.
Alloys high in molybdenum are very expensive; Inconel^ 625 or
Hastalloy^C costs approximately 25 times as much as mild steel.
These alloys can be clad in steel but the clads are nearly as
expensive as the alloy alone.
Inside the scrubber vessel, the environment is corrosive but
the temperature is in the range where flake glass polymeric resin
14
Table 1
Corrosion Rates for Various Alloys Exposed
to Flue Gas Desulfurization Environment [16]
Alloy Molybdenum
Content (%)
Average Corrosion Rate
(mils/yr)
Max Pit Depth (mils/yr)
Hastalloy C-276 16.0 0
Inconel 625 9.0
Allegheny AL-GX 6.5
Hastalloy C 6.5
Incoloy 825 3.0
317 Stainless 325
Carpenter 20-3 2.50 0
304 Stainless 0 181 31
AISI 1010 Steel 0 7324 Corroded Away
15
linings can be used. The scrubber is usually constructed of mild
steel with several coats of the flaked glass troweled on the inside
of the vessel.
These linings are effective in protecting the mild steel shell
but require considerable maintenance. High temperature excursions
and years of use will cause the lining to crack and peel, thus
exposing the exterior shell to the corrosive environment in the
scrubber. It is often difficult to detect flaws in the lining until
the outer shell has been perforated with corrosion.
In an attempt to eliminate this problem. Basin Electric Power
Corporation [17] has built two SOp scrubbers of 316 stainless steel.
It is not clear at this time if the extra capital costs will be
justified by lower maintenance costs and increased availability.
The spray headers, spray heads and support beams are also made
of acid-resistant metals or plastics. Sieve trays are typically
made of stainless steel [5]. Mist eliminators are commercially
available in various plastics and acid resistant metals. Here
again, metal is much more costly. If plastic mist eliminators are
installed, they should be made of high temperature material to allow
for occasional recirculation pump failure. Without the
recirculation liquor to quench the flue gas, the temperature in the
scrubber increases.
Auxiliary equipment such as pumps, strainers and piping also
must be constructed of acid-resistant materials. Recirculation
pumps are generally a high-maintenance item. There are varying
reports in the literature describing the success of rubber-lined
(R) pumps [5, 12]. Carpenter 2 0 ^ has been used in recirculation pumps
16
with good success. Pump seals are often a problem, as scale can
form in and around the seal and eventually causes leaks [11].
Scrubber piping is usually made of plastic to prevent corrosion;
however, plastic pipe is easily broken. Periodically, recirculation
lines become clogged with scale. Plastic pipes can be damaged when
attempting to clean them out. [11]
Cost Information
Cost information for a number of scrubbing processes including
limestone, sodium carbonate, and regenerative processes in both
industrial and utility applications is presented in the literature
[7, 19, 20]. A summary of reported costs is given in Table 2 [7].
This summary lists five non-regenerable and two regenerable
processes. The ranges and average reported costs for these two
categories are reported as well as the range and average for each
individual process. The results show capital costs for all existing
lime/limestone, sodium carbonate, and fly ash throw-away systems to
be comparable. Operating costs for the different throw-away
scrubbing systems are competitive. Lime systems are the most
expensive due to the relatively high cost of lime and poor reagent
utilization. Reagent utiliztion averages about 70 per cent for both
lime and limestone scrubbers. Fly ash/limestone systems have the
lowest operating cost since a portion of the scrubbing reagent is
flyash which decreases the amount of limestone needed.
In 1978, 93 per cent of all utility scrubbers were lime or
limestone processes [7] whereas 90 per cent of all industrial
17
Table 2
Reported Capital and Annual Costs [7]
Type
All
New
Retrofit
Non-regenerable
Regenerable
Limestone
Lime
Alkaline fly ash/limestone
Alkaline fly ash/1ime
Sodium carbonate
Magnesium oxide
Wellman-Lord
Capital
Range $/kW
29.3-156.9
47.5-120.7
29.3-156.
29.3-120.7
156.8-156.9
47.5-99.5
29.3-120.7
47.9
77.1-86.0
42.9-113.6
156.8
156.9
Costs
Average $/kW
78.0
78.8
77.2
71.7
156.8
71.4
75.3
47.9
81.6
78.3
156.8
156.9
Annual
Range mills/kWhr
0.27-14.86
0.27-14.35
2.10-14.86
0.27-14.35
14.86
1.61-2.99
2.75-14.35
1.99
0.27
2.10
NA
14.86
Costs
Average milIs/kWhr
5.6
4.3
7.4
5.2
14.9
2.1
9.3
1.99
0.27
2.1
NA
14.86
NA = Not Available
18
scrubbers were sodium based systems [19]. The average capital costs
for an Industrial scrubber as reported by Tuttle are approximately
$30/kW and operating costs are 1.9 mils/kWhr [19]. The average size
of an industrial scrubber is about 20 MW or 40,000 scfm inlet flow.
No explanation was found for the difference in cost per unit between
utility scrubbers and industrial scrubbers.
The cost for a SOp scrubber system can be distributed using
four basic areas: capital, operations, maintenance and system
availability. These costs can vary as a function of the absorbent
for which the system is designed. The Tennessee Valley Authority
(TVA), a major electric utlity located in the southeastern United
States, has developed a scrubber cost estimating procedure which
breaks each of these main categories into component parts[20]. The
TVA method assumes an availability (total operating hours of the
scrubber divided by the total operating hours of the power
generation unit) of 80 per cent. Means of modifying the TVA
procedure to allow for differing availability rates is discussed in
Chapter III.
Capital
Table 2 indicates that the capital investment for limestone
scrubbers and soda ash scrubbers has approximately the range for
similar sized units that are operated in the acid pH range [5].
However, soda ash scrubbers do not require classifiers or vacuum
filters for solids separation. Also, soda ash arc more efficient at
neutral or alkaline pH values. Therefore, smaller units would be
required and the scrubber could possible be constructed of mild
19
steel. Scrubbers operated in the acid pH range must be lined with
an acid-resistant lining such as a glass flake polyester resin
mastic. Since these linings are susceptible to heat and
delamination, some manufacturers now use stainless steel or steel
clad with exotic alloys such as Hastalloy'-'C or InconeV- 625 [16].
Either of these alternatives are much more expensive than mild steel
construction. Although the waste disposal facilities for limestone
and sodium alkali systems are Nevy different the cost of disposal
would be similar. A limestone system would require a land fill and
solids conveying system. The sodium system would require a lined
pond and possibly a seepage control system but the waste stream
would be pumpable.
Operations
Included in operating costs are reagents, electricity, and
labor. Reagent costs are determined by the amount of a particular
reagent needed to remove a given amount of SOp. As shown
previously, one mole of soda ash can absorb two moles of SOp. In
practice, this ratio will vary as a result of a portion of the
NapSO« being oxidized to NapSO^ in the scrubber vessel [8].
Electrical costs would be the same for similar units of the same
size regardless of the absorbent used. However, if scrubber
efficiency is improved, more of the flue gas can be by-passed around
the scrubber. The installation could be scaled down and horsepower
requirements for the system would be reduced. Labor for operations
is primarily a function of the system's complexity.
20
Scrubbers which require solids removal require more service time
than systems which do not require solids removal.
Maintenance
Maintenance costs are affected by 1) the complexity of the
system, 2) extent and rate of corrosion, and 3) degree and rate of
deposition [7]. As each additional piece of equipment is added to a
system, the chances for malfunction increase. Most malfunctions of
scrubbers, however, are caused by corrosion or deposition.
Maintenance costs for sodium-based scrubbers are reported to
be about 2.25 per cent of the initial investment per year and about
4.5 per cent of the initial investments for limestone systems [5].
In the limestone process, a 6 to 12 per cent limestone slurry is
pumped through the scrubber, whereas virtually clear liquor is used
in the sodium system. The abrasion and deposition caused by the
limestone slurry is one cause for the increased maintenance costs.
Availability
These costs are assessed by loss of production and lost oppor
tunities for profit as a result of scrubber failures. A scrubber
system which requires two overhauls per year, as opposed to once
QMery two years can have significant effects on profitability.
Availability acts as a common denominator for comparing FGD
systems costs. For example, if the total expenditure for a system
over a ten year period is $20 million and its average availability
21
is 70 per cent, 1t is quite possible that a system which costs $30
million and whose availability was 97 per cent percent would be .ore
cost effective.
CHAPTER III
EXPERIMENTAL PROCEDURES
Often it is difficult to extrapolate the data generated by
pilot or bench scale experiments to full scale operations.
Therefore, a full scale industrial flue gas desulfurization system
was used for this study. The following sections describe this
facility and the experiments which were conducted.
Test Facilities
The two scrubbers which were used in this study are identical
Swemco sieve tray scrubbers. These scrubbers are illustrated in
Figure 1. The scrubbers are installed on two Foster Wheeler stoker-
fired boilers. The boilers are rated at 250 million BTU's/hr and
supply steam for the Texasgulf Inc. soda ash production facility
near Green River, Wyoming. The inlet gas flow to each scrubber is
225,000 ACFM at 300°F and a pressure of 24.0 inches of mercury. The
inlet SOp concentration varies with the sulfur content of the coal
which is burned and ranges from 1200 ppm to 5000 ppm. The scrubbers
are guaranteed by the manufacturer to be 90 per cent efficient but
the demonstrated efficiencies are higher.
The main scrubber vessel is preceded by a prequench section
which is constructed of Inconel 625. The prequench is designed
primarily to cool the inlet gas so as to reduce its volume. The
22
A ) PREQUENCH
B) BYPASS DUCT
23
CJ SIEVE TRAYS
(D^ DEMISTERS ^
(E^ COUPON LOCATIONS
Figure 1. Diagram of Test Scrubber [21]
24
water which is added to maintain the liquid level in the
recirculation tank is added at the prequench section. The makeup
flow is approximately 70 gpm at full load. In addition, 200 gpm of
recirculation liquor is routed to the prequench. The inlet gas
temperature to the prequench remains fairly constant at 300°F and
the gas temperature at the exit was constant at 120°F.
The main scrubber vessel is 15 feet in diameter and 25 feet
tall. The scrubber contains a bilevel sieve tray arrangement which
is isolated by seal legs. The upper tray is flooded with a 400 gpm
flow of recirculating liquor which is transferred first to the lower
level and then to the recirculation tank. An additional 400 gpm is
sprayed on the bottom side of the lower sieve tray. The gas flow is
counter-current to liquor flow.
After leaving the sieve trays, the gas stream passes through a
high efficiency mist eliminator before entering the stack. A
portion (up to 20 per cent) of the gas stream can be diverted around
the scrubbers either through a 48-inch manually controlled by-pass
or a 24-inch automated by-pass which controls the temperature in the
stack by regulating the amount of gas flow which is by-passed.
The scrubbers are preceded by cyclone separators and
electrostatic precipitators which together remove 99.2 per cent of
the particulate matter in the flue gas stream. A small amount of
particulate matter is entrained in the SOp scrubber but its
concentration is controlled by purging the system. An induced draft
fan driven by a steam turbine is located between the electrostatic
precipitator and the SOp scrubber. This fan maintains a negative
25
draft in the boiler and forces the flue gas through the scrubber.
Figure 2 illustrates the general arrangement of the air pollution
control equipment. These pollution control devices are common to
the Industry and the information gathered from this system should be
applicable to most other wet scrubber systems.
Test Procedures
The tests which were conducted for this study were designed to
determine the applicability and cost effectiveness of utilizing soda
ash and waste streams produced in the manufacturing of soda ash as
SOp absorbents. Specifically, the purpose of these tests was to
determine if it is more cost effective to operate sodium carbonate
scrubbers at an alkaline or acid pH and to determine if crystallizer
purge liquor, dissolved trona or contaminated storm water run-off
could be used effectively as SOp absorbents without causing severe
operation problems. A total of four tests were conducted to supply
this needed information.
Test Series One
This test was to determine, if an SOp scrubber that was operated
at an alkaline pH could be made of mild steel, and if so, what would
be the cost in terms of additional absorbent usage and scale
prevention. The deposition rate of calcium sulfite was also
measured as a part of this test. Three different conditions were
26
c E o.
o S -r-
o
O Q-
<
O
c
en
i . S-
03
a
CD
CsJ
cu s -CD
a: UJ _i
o cu
27
examined. These were as follows:
1) scrubber make-up water containing 100 ppm calcium
carbonate with no chemical treatment,
2) scrubber make-up water containing 100 ppm calcium
carbonate with chemical treatment, and
3) scrubber make-up water containing 0 ppm calcium carbonate,
The chemical treatment used was a proprietary acrylic acid
derivative (Betz Chemical Company Product 436). The chemical feed
rate was set at 3 gallons per day and the blow-down rate from the
SOp scrubber was set at 5 gpm. The acrylic acid additive is
designed to distort the crystalline structure of CaoSO-, so that
it can not form a crystal lattice [12].
To obtain the goals of this test series, it was necessary to
measure the following parameters:
1) corrosion and deposition rates,
2) sodium carbonate usage, and
3) pH of the scrubber recirculation liquor.
The following sections describe how each of these parameters were
monitored.
Deposition/Corrosion Rates
The deposition and corrosion rates were studied through the
observation of mild steel coupons installed in the scrubber and
through the measurement of differential pressure across the
scrubber. The mild steel coupons, which measured 2 x 6 x 0.125
inches, were installed in the test scrubbers at the location
28
specified In Figure 1. These coupons were first weighed and then
the end which was to be attached to the coupon holder was covered
with a water- resistant tape. The tape was applied to prevent bias
in the data from scale sluffing off the coupon when it was detached
from the coupon holder. The coupons were weighed and replaced with
new coupons at one-month intervals. Scale samples were then scraped
from the coupons. The chemical constituents and the methods used
for analysis are listed in Table 3.
Table 3
Scrubber Scale Analysis
Test Method Calcium Instrumentation Laboratory Inc.
Atomic Absorption/Spec-trophotometer Model 951
Sulfite Standard Methods [22], lodide-lodate
Sulfate Dionex'-' Ion Chromatograph, Model 125
Silica Hatch Co. Silica Test Kit Model SI-5
Alkalinity Standard Methods [22], Titri-metric to methyl orange end point
The proportions of these chemical constituents in the scale
samples varied with changes in scrubber operations but together they
accounted for over 95 per cent of the total mass. A 0.375 inch
diameter hole was drilled through each coupon one inch on center
from the distal end of the coupon. The percent occlusion of these
29
holes was also measured monthly. The purpose of the holes was to
simulate the holes in the scrubber contact sieve trays.
In addition to the corrosion/deposition coupons which were
Installed in the scrubber, another test for deposition was devised
using the differential pressure across the SOp scrubber. A
differential pressure cell had been installed on the SOp scrubber
that measures the static pressure at the inlet of the scrubber
Instantaneously in pounds per square inch. As scale forms on the
sieve trays, the perforations in the trays become restricted. This
subsequently restricts the air flow through the scrubber and in
creases the scrubber inlet static pressure. This test does not
measure deposition rate as a function of scale thickness but as a
function of back-pressure in the scrubber. In this way the problem
of reduced air flow and reduced boiler capacity are addressed
directly.
Reagent Usage
A 10 per cent by weight sodium carbonate solution was used as
the scrubbing reagent in this test series. The solution was made in
batches so the sodium carbonate concentration remained constant at
10 per cent during this test series. To determine usage rate during
the test period, the reagent flow was measured by magnetic flow
meter.
pH Determinations
The pH in the scrubber during the tests was determined with a
continuous pH meter manufactured by TBI of Carson City, Nevada.
30
Samples were collected every eight hours during the test period and
checked against a laboratory pH meter which was calibrated with
prepared pH standards. Compensation was made for any drift in the
continuous pH monitor.
Test Series Two
This series was designed to determine the suitability of soda ash
crystal lizer train purge liquor as an SOp scrubbing agent.
Parameters of importance included determining reagent usage, removal
efficiency and the cost of controlling silica scale which resulted
from using this material.
A typical analysis of this liquor is presented in Table 4.
Table 4
Evaporator Purge Liquor Analysis
Constituent Wt. %
Sodium Carbonate 30.0
Sodium Cloride 0.2
Sodium Sulfate 1.1
Silica 0.4
Sodium Phosphate 0.07
Water 68.0
31
Reagent Usage
To determine SOp absorbent usage at various pH values, the flow
of crystallizer purge liquor added to the scrubber was measured by
magnetic flow meter and the total alkalinity of this liquor was
measured every two hours by titration [22]. The amount of scrubbing
agent added to the scrubber per unit time was then calculated.
Each test started with the scrubber recirculation liquor at a
pH of 6.5. The reagent feed was increased stepwise until the
recirculation liquor pH reached approximately 7.5. After the
reagent feed was increased, it was not increased again until the
system had reached steady state. The system was considered to have
reached steady state when three consecutive pH measurements taken at
30 minute intervals showed no variation.
Silica Scale
It was anticipated that the silica in this liquor would
precipitate in the scrubber. Coupon weights were used to determine
deposition rates. The coupons were placed and removed monthly and
weighed. The differential pressure across the sieve trays was also
monitored and used as an indication of scale formation. Make-up
water used to maintain operating levels in the scrubber contained no
calcium so as to prevent bias in the data from the formation of
calcium sulfite scale. These parameters were monitored for a period
of four months.
32
SOp Removal Efficiency
The scrubber inlet SOp concentration was measured by two
methods. The first method was the U.S. EPA Stack Sampling Method 5
[4]. The second method entailed shutting down the SOp scrubber
recirculation pump. The scrubbing liquor thus would not contact the
flue gas and would allow untreated gas to flow through the SOp
scrubber.
The gas was measured in both tests at the scrubber outlet with
a Lear Seigler Inc. model SM-810 continuous SOp emissions monitor.
This monitor has been certified by the U.S EPA and the State of
Wyoming for its capibility to meet state and federal accuracy
requirements. Agreement between the two methods was within the ^10
per cent required by these regulations. The results from the
continuous emissions monitor for inlet and outlet SOp concentrations
were used to calculate scrubber efficiencies.
As the feed rate of scrubbing agent to the scrubber was varied,
removal efficiency was calculated using the following formula:
[SOp] J - [SOp] Q
Efficiency = X 100
[SOp] J
The inlet and outlet SOp concentrations were measured every two
hours during each test. Efficiency tests were conducted during all
three repetitions.
33
pH Determinations
The pH determinations for test series two Were made the same as
in the first test series. A continuous pH meter was used and
calibrated once every eight hours.
Test Series Three
The purpose of this test was to determine the suitability of
dissolved trona as a SOp scrubbing agent; specifically, waste water
and water generated in the mining of trona. Trona is a naturally
occurring ore of sodium sesqui-carbonate (NapC03 + NaHCO^ * 2H^0)
[23]. This mineral is water-soluble and in the process of mining
the ore, water containing dissolved trona is generated.
Three samples of this water were collected on three consecutive
days and the analysis of these samples are presented in Table 5.
Table 5 Mine-water Analysis
Weight %
Constituent
Total Alkalinity
Sodium Chloride
Sodium Sulfate
Silica
Sodium Phosphate
Calcium Carbonate
Water
Sample 1
12
> 0.20
> 0.01
> 0.01
? 0.01
> 0.01
87
Sample 2
12
0.20
> 0.01
> 0.01
> 0.01
> 0.01
87
Sample 3
10
0.20
>0.01
>0.01
>0.01
>0.01
89
34
In determining the suitability of this material, scale
deposition did not have to be considered. Since the levels of
calcium and silica in these materials were less than 50 ppm, it was
anticipated that scaling would not be a problem. As a result, only
SOp removal efficiency and reagent usage were measured.
Reagent Usage
As in test series 2, the reagent flow was measured by a
magnetic flow meter during the three individual tests in this
series. The total alkalinity of the scrubber feed liquor was
measured every two hours during this test by titration.
SOp Removal Efficiency
Inlet SO9 concentration was measured in this test series one at
the beginning of each of the three individual tests by shutting down
the scrubber recirculation pumps and allowing untreated flue gas to
go through the scrubber. This gas was then analyzed by the Lear
Seigler continuous emissions monitor. During the actual tests, the
scrubber effluent SOp was measured continuously by the Lear Seigler
monitors.
Test Series Four
The purpose of this test was to determine the efficacy of storm
water runoff collected from a soda ash manufacturing facility as an
SOp absorbent. A typical analysis of this water is presented in
Table 6.
35
Table 6
Typical Analysis of Runoff
Constituent %
NapC03
NaHC03
NaCl
NaSO^
CaC03
Organics
HpO
2.0
>0.1
>0.1
>0.1
>0.1
0.2
97.5
Runoff waters contain sodium carbonate values as a result of
coming in contact with the surface ore stockpile and any soda ash
that is inadvertantly spilled within the site containment area.
Low levels of dissolved silica and calcium were observed in
this water and as a result, no scale inhibitors were added.
Reagent Usage
To establish the amount of reagent used per time interval, the
total alkalinity was measured by titration and the flow of the
scrubbing agent was measured by a magnetic flow meter. This flow
and concentration data was then used to determine the amount of
sodium alkali entering the scrubber per unit time.
36
Scrubber Efficiency
The inlet SOp concentration was measured in this test series
solely by allowing untreated gas to be passed through the SO.
scrubber prior to the start of the three individual tests.
Again the scrubber recirculation pump was turned off and the scrubber
liquor drained out of the scrubber so as not to contact the flue gas.
Cost Data
An objective of this study was to compare the total costs for a
limestone SOp scrubbing system, a soda ash system operated in an
acidic pH range, and a soda ash system operated in a basic pH range.
As has been previously discussed, the FGD costs can be expressed as
capital, operating, maintenance and availability costs. The follow
ing paragraphs present mathematical descriptions of these costs and
factors which may affect them.
Capital
Capital expenditures were derived by assuming a ten-year loan
at 10 per cent compound interest. The 10 per cent interest figure
was selected because it currently does not appear that the interest
rate will fall below this mark in the near future. The capital cost
estimating procedures used by the Tennessee Valley Authority were
used in estimating the cost/kw. Assuming monthly payments, capital
costs are then expressed as [24]:
C ^ = (3-1)
1-(1 + i) -n
37
where:
C^ = Annual Capital Costs
C = Total Investment
1 = Interest Rate/pay period
n = Number of Pay Periods
Operating Costs
Annual operating cost is primarily the sum of the reagent
costs, labor costs and energy costs. Labor costs and energy costs
are dependent upon the physical size of a particular unit. Reagent
costs are a function of reagent utilization and amount of SOp which
is to be removed.
The amount of SOp which is to be removed is dependent upon the
type of coal used and the SOp emission standards which a facility
must meet. The following equation was used for determining reagent
costs:
where:
R^ = (M) (I^) (U^) (MW^) (KJ / 2000 lb/ton (3-3)
R = Reagent Cost/Year c
M = Moles SOp Produced/Year
I = Required Removal Efficiency
U = Reagent Utilization in Tons r ^
MW = Molecular Weight of Reagent
K = Cost/Ton
38
Total operating costs can then be expressed as:
C„ = C + C +C + C-, (1-^) 0 r e w 1 ^'^ ^^ where
CQ = Annual Operating Costs
C^ = Annual Reagent Costs
Cg = Annual Energy Costs
C^ = Annual Water Treatment Costs
C-j = Annual Labor Costs
Maintenance
Maintenance costs are a function of physical size of the unit
and the type of operating system which is employed. For use in this
paper, the maintenance costs were calculated as follows:
where
c^ = (C,) (S,)
C = Annual Maintenance Costs m C = Total Annual Maintenance Cost s
for a limestone Scrubber
S^ = System Factor
The system factor is based on the findings of Smith [5] that were
discussed in Chapter II. The system factor for a limestone scrubber
is 1 and the system factor for a soda ash scrubber is 1/2.
Availability
The TVA estimating procedure which is used in this study
assumes 1700 operating hours per year or 80 per cent availability of
the generation unit annually. In comparing costs with this method,
39
variances in availability are calculated in the following manner:
Cg = (T^ - 1700)(C^ + Cp) (3-6)
where: C^ = Availabilitv a
Cr = Fixed Production Costs
C = Lost Profit Costs
T • = Downtime
If a system availability is better than the 80 per cent, then
the system will receive a credit equal to the above equation.
Cost Equation
The culmination of the various costs can be expressed in the
following equation as a total annual cost.
where:
C. = C^ + C^ + C^ + C^ (3-7) t c 0 m a
C. = Total Annual Costs
C = Annual Capital Costs c
C = Annual Operating Costs
C = Annual Maintenance Costs m
C = Annual Availability Costs a
The following equation will then give the total cost for the
life of the facility:
C^ = Y (C^) + Y^ (C^ - C^) (3-8)
where:
C. = Total Facility Lifetime Costs
Y = Years of Loan
Y^ = Life of Facility in Years
CHAPTER IV
PRESENTATION OF DATA
During the study period, the test boiler operated at between
70 and 78 per cent of its rated capacity. The sulfur content of the
coal burned during the study period varied between 0.4 and 0.6 per
cent. Water was added to the scrubber as needed to maintain the
level in the scrubber recirculation tank. The water flow during the
test was approximately 70 gpm. The results from the tests which
were conducted are presented in the following sections.
Test Series One
The goal of the first series of tests was to determine the
effects of operating a sodium carbonate SOp scrubber in an alkaline
pH range with respect to reagent usage, corrosion, and scaling. The
results of the tests which were conducted are presented in the
following sections.
Reagent Usage
The data presented in Tables 7, 8 and 9 show that as pH
increases, the amount of reagent used per unit time increases. This
was caused by three factors:
1) The removal efficiency increased with increased pH. Since
% Scrubber By-Pass = 11.0% Scrubber Purge Flow = 10 gpm Scrubber Feed Total A l ka l i n i t y = 15.2% as NapCU3 In le t SOp = 1.03 Ib/MB Water Flow = Added as Needed
A cost of $7/ton was assumed for limestone [25] to obtain the
following reagent costs of a limestone system:
% Sulfur in Coal R^ ($10^/yr) c
1 0.8 3 2.4 5 4.1
Availability Costs
The TVA model assumes an 85 per cent availability for limestone
scrubbers. After reviewing the operational history of the test
scrubbers, it was found that the availability while operating at
acid pH values was approximately 92 per cent. Under alkali
conditions and proper scale control, the availability of the test
scrubbers was virtually 100 per cent. Often times maintenance was
performed on the scrubber during boiler outages but during the time
the scrubber was operated at basic pH the test scubber was not sited
as the limiting factor which caused the outage. As the result of
redundency in the system or modifing operating procedures the
scrubber could be kept in operation and emissions within limits
until the boiler was taken out of service.
To calculate the cost of the lack of availablity, the total
number of kWhr's a 500 MW facility would produce in a year was
multiplied by a factor which was the product of the per cent
downtime multiplied by the cost of a kWhr minus the cost of
73
consumables not used when the plant is non-operational. Assuming a
selling price of $0.03/kWhr and a consumables cost of $0.01/kWhr,
the net cost of down time to a utility would be $0.02/kWhr. For a
500 MW utility, the 15 per cent downtime for a limestone scrubber
would result in 12.0 million dollars in lost revenue over a year.
According to the data which was collected on the test scrubbers, a
soda ash scrubber would have an availablity of at least 92 per cent.
The lost revenue for a soda ash scrubber a year would then be 6.4
million dollars. Utility scrubbers are much larger than the test
scrubbers and it may be invalid to assume that a utility scrubber
could attain the availability of an industrial scrubber. Therefore,
these findings should not be considered conclusive.
Limestone vs Sodium Alkali Comparisons
As the data presented in this study indicates, all of the
sodium alkali materials tested worked well to remove SO2. At the
present time, there are no published prices for low grade materials
that were tested in this study. A price which v/ould make a sodium
system competitive with limestone systems can be calculated.
Table 30 is a summary of the annual cost that do not vary due
to the sulfur in the coal or to reagent prices. Additions have been
made to the annual power costs for the two sodium systems to
compensate for their higher availabity. These units would be on
line a greater percentage of the time than a limestone scrubber and
would consume more power.
74
Table 30
Annualized Costs Less Reagent Costs
^$10^/yr
Cost Limestone Sodium Alkali Sodium Alkali
(acidic) (basic)
Capital
Operating & Maint. Less Reagent (C +C -R ) ^ 0 m c
Availablity
Total Less Reagent
( t- c
10.1
5.1
12.0
27.2
7.0
4.3
6.4
>17.7
6.8
3.5
0.0
10.3
The total cost for a limestone system burning 1, 3, and
5 per cent sulfur coals are presented in Table 31.
Table 31
Total Annual Costs for Limestone Scrubber
$10Sr
Reagent Total Total Less Availablity
% Sulfur in Coal (R.) (C^) ^^t'^a'
1
3
5
0.8 28.0 16.0
2.4 29.6 17.6
4.1 31.3 19.3
To be competitive then, a sodium alkali system would have to
gave an annual cost less than C^ for a limestone unit. A
75
competitive price for sodium alkalies can be calculated by
substituting C^ of a limestone unit for the C^ of a sodium alkali
unit and solving for R^. Table 32 gives R^ for both types of sodium
alkali scrubbers that would make them competitive with a limestone
system with and without the benefit of increased availablity.
Table 32
Competitive Sodium Alkali Reagent Costs
$10^/yr
85% Availability Increased Availablity
% S in Coal Acidic Basic Acidic Basic
1 4.7 5.7 10.3 17.7
3 6.3 7.3 11.9 19.3
5 8.0 9.3 13.6 21.0
This data along with the data in Table 29 shows that situations
occur in which sodium alkali scrubbers would be more cost effective
than limestone scrubbers. Primarily the soda ash scrubbers would be
competitive when the delivered cost of the sodium alkali reagent is
below $75/ton and the power generation facility is burning 1 per
cent sulfur coal. Sodium alkali scrubbers could also be cost
effective on facilities burning 3 per cent sulfur coal provided the
avalliblity of limestone scrubbers remains low and a utility sodium
alkali scrubber performs as the test scrubber has to this point.
BBS
76
To illustrate the point, consider a 500 MW utility burning 3
per cent sulfur coal. Figure 4 shows that a basic sodium alkali
scrubber would be competitive if reagent costs were approximately
$70/ton or less. For the acidic sodium alkali scrubber to be
competitive the reagent cost would have to be less than $50/ton.
Where a power plant burns 1 per cent coal a sodium alkali scrubber
is more cost effective than limestone with reagent costs at over
$100/ton.
BfiS^SS^^
77
>•>
VD O
-be-
•4-> 0_)
to O C_J
o
60
50
40
30
20
10
0
60
50
40 I-
30
20
10
I 0 0
Limestone Sodium Alkali
Sodium Alkali, Acidic
Sodium Alkali, Basic
$100/ton
$ 75/ton
$ 50/ton
$100/ton
$ 75/ton
$ 50/ton
% Sulfur in Coal
Figure 4. Annual Costs as a Function of Percent Sulfur in Coal and Reagent Costs.
CHAPTER V
CONCLUSIONS AND RECOMMENDATIONS
This study has outlined a means to make SO2 removal less
costly.
The results of this study have shown that:
1. Low grade sodium alkali materials such as trona and
crystallizer purge liquor can be effectively used as an
SO2 scrubbing agent. The SO2 removal efficiency results
were very much the same for each of the materials tested.
In all cases the efficiencies varied from approximately 80
per cent at a pH of 5.8 and stoichiometeric ratio of 0.9
to 97 per cent at pH 6.8 and a stoichiometric ratio of
1.05.
2. Operating a sodium carbonate scrubber at an alkaline pH
reduces corrosion and can lower capital costs by
approximately 6 per cent. However, controlling the pH in
the scrubber in the basic range increases reagent costs.
It was found that a stoichiometric ratio of 1.1 was needed
to maintain the scrubber above pH 7.0.
3. Low grade sodium alkali can be cost competitive with
limestone wet scrubber systems when the sulfur in the coal
78
79
being burned is 3 per cent or less, and the cost of the
sodium alkali is less than $75/ton. These materials could
also be competitive if SOp regulations require greater
removal efficiencies than a limestone system can meet.
4. The main problem observed in operating a sodium alkali
scrubber at an alkaline pH is the formation of calcium
sulfite scale. It was found that this problem could be
controlled either by eliminating the source of calcium
ions or by chemical treatment.
5. Of the materials tested, crystallizer purge liquor was the
only one which demonstrated a significant operating
problem. Silica scale formed in the scrubber as a result
of using this material can also be controlled by chemical
treatment.
It is recommended that companies planning to build either
Industrial or utility scrubbers contact the soda ash producers and
negotiate a price for their low-grade sodium alkali and determine
which system, sodium alkali or limestone, would be the most cost
effective for their situation. A sodium alkali system could be
particularly attractive if a utility has a choice between a higher
priced low sulfur coal or a less expensive, higher sulfur coal and
SOp removal restrictions prohibit the use of a limestone scrubber.
Another situation where a sodium alkali scrubber is cost effective
would be where a plant is to be sited in Wyoming where scrubbers are
required and coal with less than 1 per cent sulfur is abundant.
80
Little information is currently available on the disposal of
sodium sulfite and sodium sulfate wastes produced by SO^ scrubbers.
These sodium salts are very soluble and could be leached into ground
water. More research needs to be done on developing methods of
containing sodium FGD wastes. The cost analysis of these methods
would be valuable in determining economic justification for proposed
sodium scrubbers.
More research is also needed to obtain realistic costs for low
grade sodium alkalies. The price at which these materials can be
sold v/111 be the most important factor in the economic evaluation of
a proposed scrubbing system.
LIST OF REFERENCES
1. Carnow, B.W.; Bouchard E. "Health Effects of SO. and SO,." Proceedings: Symposium on Flue Gas Desulfurization - ^ Las Vegas, March 1979. pages 21l47~
2. United States Environmental Protection Agency. The Acid Deposition Phenomenon and Its Effects. Vol. 1, 1983:
3. Gage, S. J. "Keynote Address for the 1980 EPA Symposium on Flue Gas Desulfurization." Proceedings: Symposium on Flue Gas Desulfurization - Houston", October 1980; Volume 1. page 11.
4. Wyoming Department of Environmental Quality,Air Quality Division.Wyoming Air Quality Standards and Regulations 1982, Cheyenne, Wyoming, pages 5, 6.
5. Smith, M.P.; Melia, M.T.; Laseke, B.A., Jr.; and Kaplan, N. "Recent Trends in Utility Flue Gas Desulfurization" Proceedings: Symposium on Flue Gas Desulfurization - Houston, October 1980, Vol 1, pages 143 - 157.
6. Stark,R. Environmental Engineer for Pacific Power and Light Co., Point of Rocks, Wyoming. Interview, 18 September 1981.
7. Leseke, B. A.; and Devitt, T. W. "Status of Flue Gas Desulfurization in the United States." Proceedings: Symposium on Flue Gas Desulfurization - Las Vegas, March 1979, pages 3,4.
8. Wark, K.; Warner, C. F. Air Pollution, Its Origin and Control. New York, Dun-Donnelley Publisher, pages 327 - 351.
9. Kaplan, N. "Summary of Utility Dual Alkali System" Proceeding: Symposium on Flue Gas Desulfurization - Las Vegas, March 1979.
10. Burbank, D.A.; Wang, S.C; and McKinsey, R.R. "Test Results on Adipic Acid - Enhanced Limestone Scrubbing at the EPA Shawnee Test Facility - Third Report." Proceedings: Symposium on Flue Gas Desulfurization - Las Vegas, March 1979.
11. Whittish, J. Steam Plant Foreman for Texasgulf Inc., Granger, Wyoming. Interview, October 1979.
12. Yantis, M. Sales Engineer for the Nalco Chemical Co. Interview, 15 May 1980.
81
82
^^' "nn^!l:J* -.i ^^"^el, E. R.; Piasecki, E. J.; Phillips, R. J. nni.hi M u History and Present Status of the General Motors uouDie Alkali SOp Control System" Proceedings: Symposium on j-iue Gas Desulfufization - Las Vegli, March 1979.
14. Stevens, N. J. "Dry SOp Scrubbing Pilot Test Results" Kroceedmqs: Symposiufri on Flue Gas Desulfurization - Houston, October 198U. paopc; llTZmv
15. Muela, C. A.; Menzies, W. R. "Stack Gas Reheat Benefits and Associated Energy Penalties." Proceedings: Symposium on Flue Gas Desulfurization-Las Vagas,March 1979;pages 1-16.
16. "The Corrosion Resistance of Nickel Containing Alloys in Flue Gas Desulfurization and Other Scrubbing Processes." The Internation Nickel Company Inc., One New York Plaza, New York 10004, 1978.
17. Rourke, E. T. "Power Plant Scrubber Using Special Stainless Steels is Under Construction in Wyoming." Nickel Topics, Vol. 32, No. 4, 1979, pages 7-12.
18. Hewitt, R. A. "Operating and Maintenance Experience of the World's Largest Spray Tower SOp Scrubbers" Proceedings: Symposium on Flue Gas Desulfurization - Houston, October 1980, page 7.
19. Tuttle, J.; Patkar, A. "The Status of Industrial Boiler Application in the United States." Proceedings: Symposium on Flue Gas Desulfurization-Las Vagas, March,1979.
20. McGlamery, G.G., O'Brien, W.E., Stephanson, C D . , and Veitch, J.D.; "FGD Economics in 1980." Proceedings: Symposium on Flue Gas Desulfurization - Houston, October 1980, pages 49 - 83.
21. Swemco Inc. Drawing Number D-4360-R-19, 1974 New York, New York.
22. American Public Health Association. Standard Methods for Examination of Water and Waste Water, Thirteenth Edition, Washington D.C. American Public Health Association Publica-tions, 1975.
23. Lowenhelm,F. A.; Moran, M. K. Industrial Chemicals, New York, John Wiley and Sons, 1975, page 709.
24. Welch, G. A.; Zlatkovich, C. T.; White, J. A. Intermediate Accounting, Homewood, ILL; Richard D. Irwin, Inc., pages 190, T9T: "
83
25. M m 2 ! ? ^ ^'M^- Chemistry and Technology of Lime and Limestone, New YorK, John Wiley and Sons, 1980, pages 122 and
^ * Fnwr^' ^"\^r Bo^niann, F. H. "Acid Rain: A Serious Regional tnvironmental Problem." Science, Vol. 184, 1974, page 1178.
27. United States Environmental Protection Agency. "Standards of Performance for New Stationary Sources, Title 40 , Chapter 1, Subpart D, 60.43." Fed. Reg. Vol. 36, No. 249, December 23,1971, page 24877.