GGG, PTT Exploration and Production Co. Ltd. GGG, PTT Exploration and Production Co. Ltd. Supaporn Supaporn Pisutha Pisutha - - Arnond Arnond , Cambodia, 2004 , Cambodia, 2004 9-Apr-04 Applications of Geochemistry to Source Rock Appraisals The Applications of Organic Geochemistry to Source Rock Appraisal and Hydrocarbon Characteristics By Supaporn Pisutha-Arnond
Transcript
GGG, PTT Exploration and Production Co. Ltd.GGG, PTT Exploration and Production Co. Ltd.Supaporn Supaporn PisuthaPisutha--ArnondArnond, Cambodia, 2004, Cambodia, 20049-Apr-04
Applications of Geochemistry to Source Rock Appraisals
The Applications of Organic Geochemistry to Source Rock Appraisal and Hydrocarbon Characteristics
By Supaporn Pisutha-Arnond
GGG, PTT Exploration and Production Co. Ltd.GGG, PTT Exploration and Production Co. Ltd.Supaporn Supaporn PisuthaPisutha--ArnondArnond, Cambodia, 2004, Cambodia, 20049-Apr-04
Applications of Geochemistry to Source Rock Appraisals
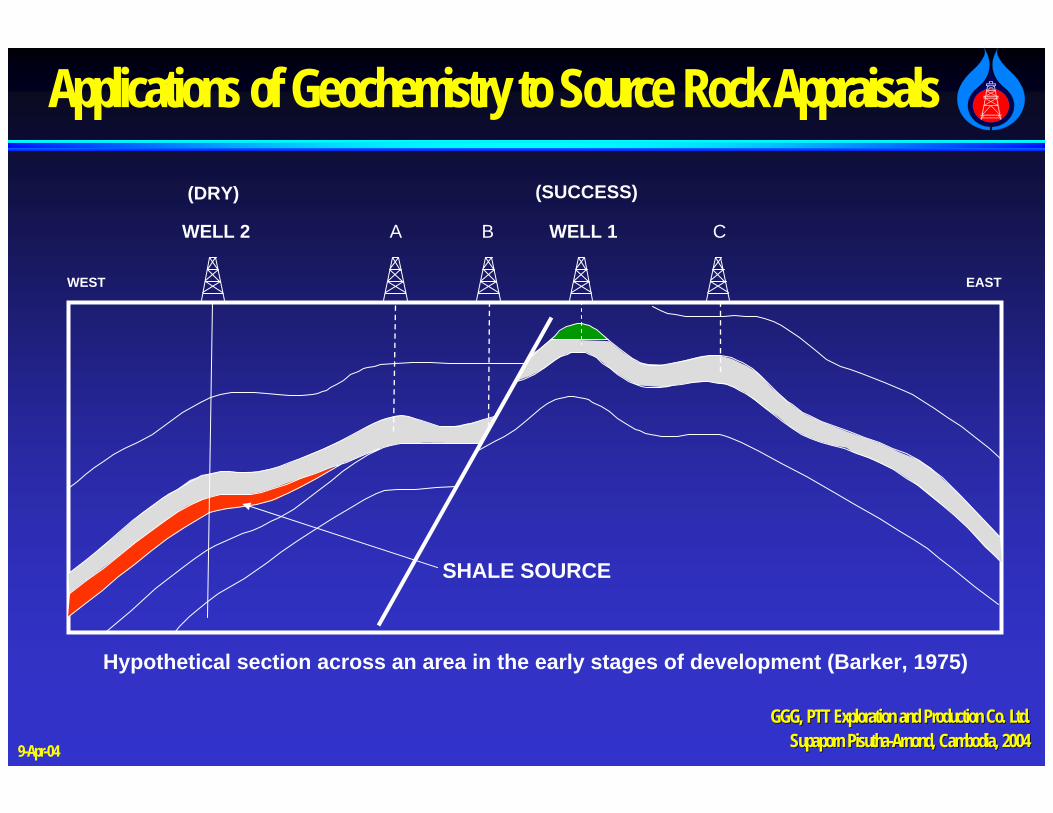
WEST EAST
WELL 2 WELL 1A B C
SHALE SOURCE
Hypothetical section across an area in the early stages of development (Barker, 1975)
(DRY) (SUCCESS)
GGG, PTT Exploration and Production Co. Ltd.GGG, PTT Exploration and Production Co. Ltd.Supaporn Supaporn PisuthaPisutha--ArnondArnond, Cambodia, 2004, Cambodia, 20049-Apr-04
Applications of Geochemistry to Source Rock Appraisals
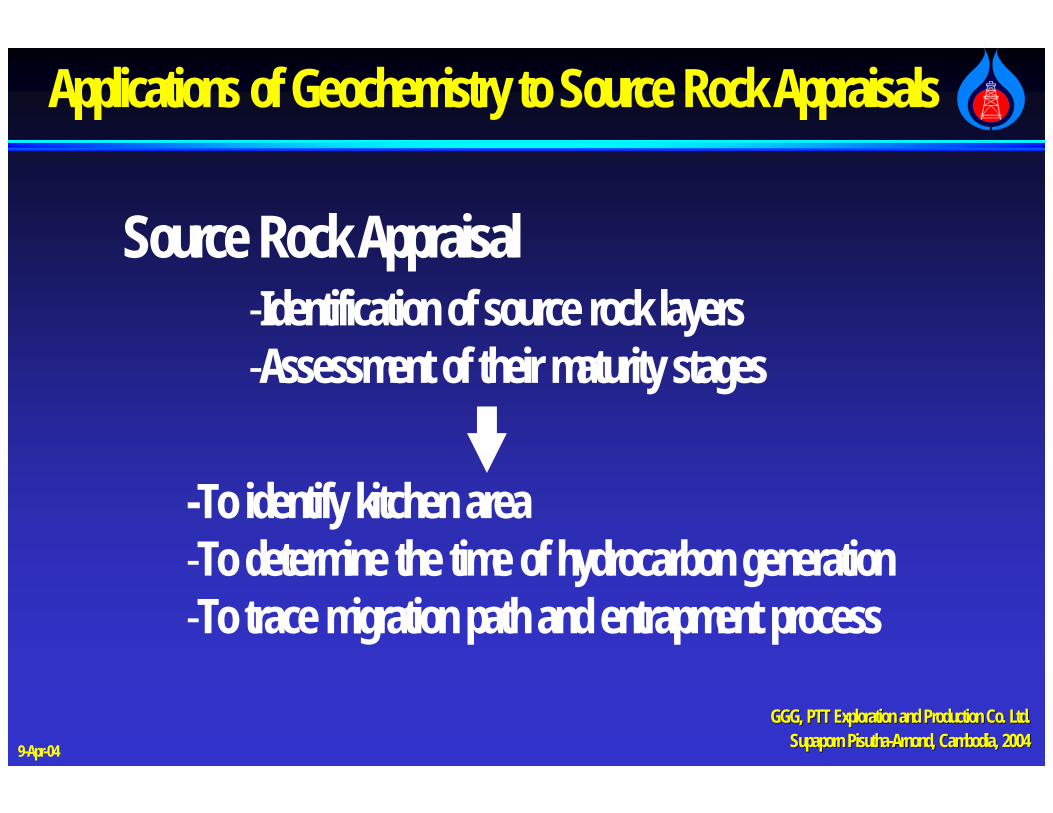
Source Rock Appraisal-Identification of source rock layers-Assessment of their maturity stages
-To identify kitchen area-To determine the time of hydrocarbon generation-To trace migration path and entrapment process
GGG, PTT Exploration and Production Co. Ltd.GGG, PTT Exploration and Production Co. Ltd.Supaporn Supaporn PisuthaPisutha--ArnondArnond, Cambodia, 2004, Cambodia, 20049-Apr-04
Applications of Geochemistry to Source Rock Appraisals
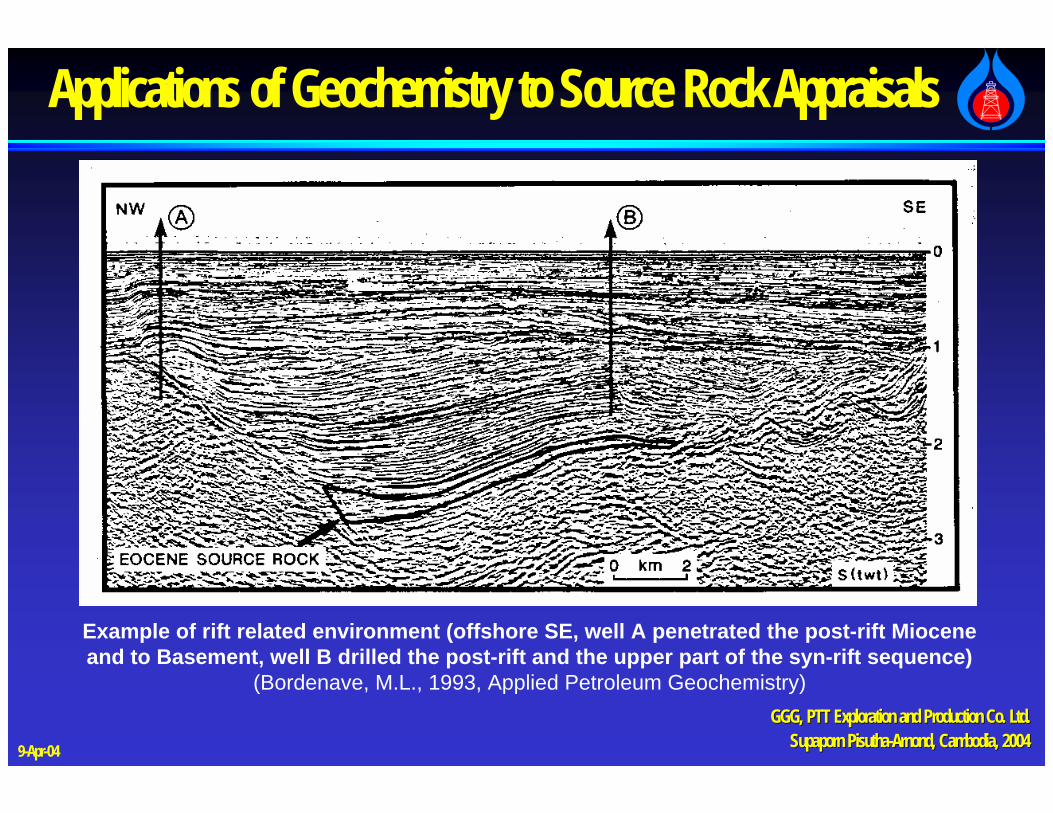
Example of rift related environment (offshore SE, well A penetrated the post-rift Mioceneand to Basement, well B drilled the post-rift and the upper part of the syn-rift sequence)
GGG, PTT Exploration and Production Co. Ltd.GGG, PTT Exploration and Production Co. Ltd.Supaporn Supaporn PisuthaPisutha--ArnondArnond, Cambodia, 2004, Cambodia, 20049-Apr-04
Applications of Geochemistry to Source Rock Appraisals
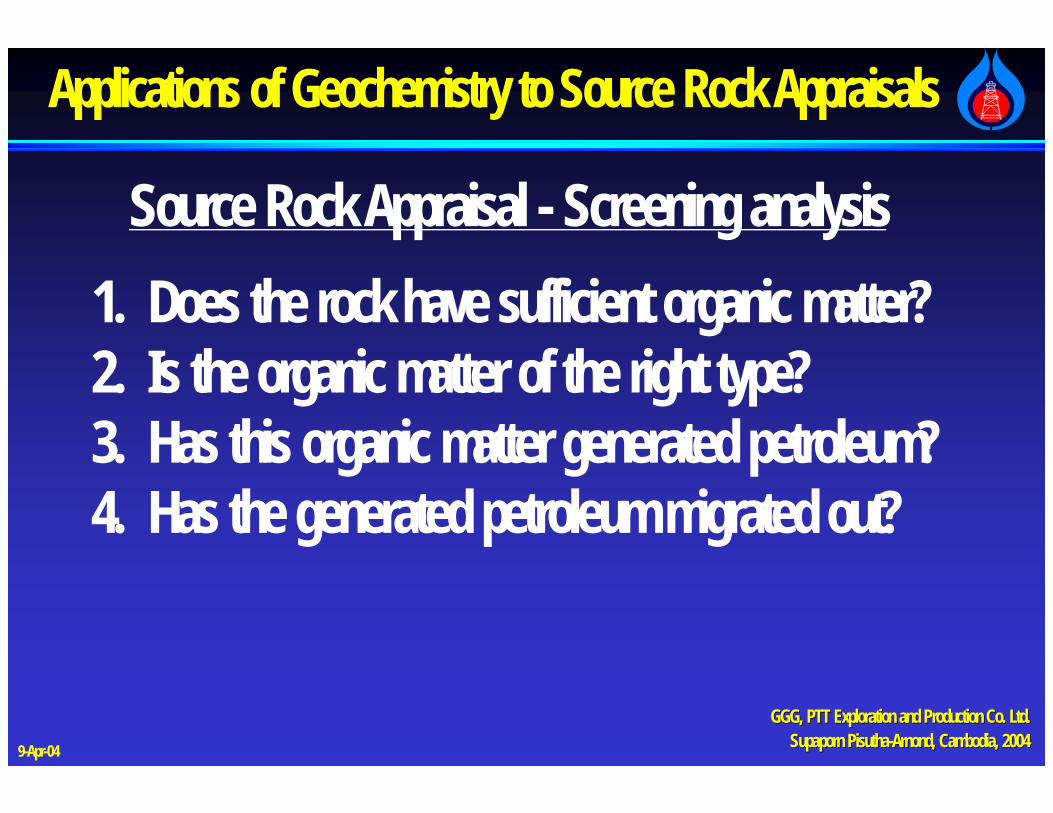
1. Does the rock have sufficient organic matter?2. Is the organic matter of the right type?3. Has this organic matter generated petroleum?4. Has the generated petroleum migrated out?
Source Rock Appraisal - Screening analysis
GGG, PTT Exploration and Production Co. Ltd.GGG, PTT Exploration and Production Co. Ltd.Supaporn Supaporn PisuthaPisutha--ArnondArnond, Cambodia, 2004, Cambodia, 20049-Apr-04
Applications of Geochemistry to Source Rock Appraisals
KEROGEN
GGG, PTT Exploration and Production Co. Ltd.GGG, PTT Exploration and Production Co. Ltd.Supaporn Supaporn PisuthaPisutha--ArnondArnond, Cambodia, 2004, Cambodia, 20049-Apr-04
Applications of Geochemistry to Source Rock Appraisals
GGG, PTT Exploration and Production Co. Ltd.GGG, PTT Exploration and Production Co. Ltd.Supaporn Supaporn PisuthaPisutha--ArnondArnond, Cambodia, 2004, Cambodia, 20049-Apr-04
Applications of Geochemistry to Source Rock Appraisals
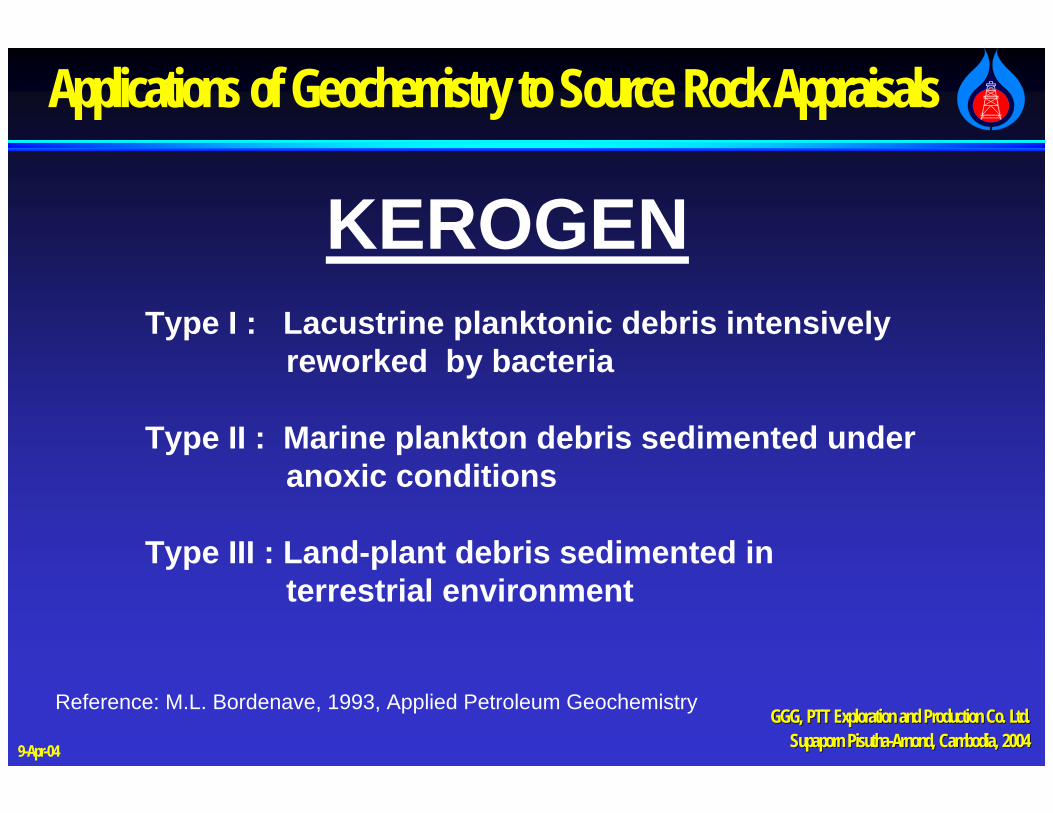
KEROGENType I : Lacustrine planktonic debris intensively
reworked by bacteria
Type II : Marine plankton debris sedimented under anoxic conditions
Type III : Land-plant debris sedimented in terrestrial environment
GGG, PTT Exploration and Production Co. Ltd.GGG, PTT Exploration and Production Co. Ltd.Supaporn Supaporn PisuthaPisutha--ArnondArnond, Cambodia, 2004, Cambodia, 20049-Apr-04
Applications of Geochemistry to Source Rock Appraisals
GGG, PTT Exploration and Production Co. Ltd.GGG, PTT Exploration and Production Co. Ltd.Supaporn Supaporn PisuthaPisutha--ArnondArnond, Cambodia, 2004, Cambodia, 20049-Apr-04
Applications of Geochemistry to Source Rock Appraisals
S1 S2 S3
Increasing temp.Of pyrolysis
Increasing temp.of trapped CO2
Time
VolatilizationOf existing
HC
PyrolysisOf
kerogen
S1 S2
Time
Tmax
Cooling
1000 3000
3900
5500
S3
Trapping CO2
Tem
pera
ture
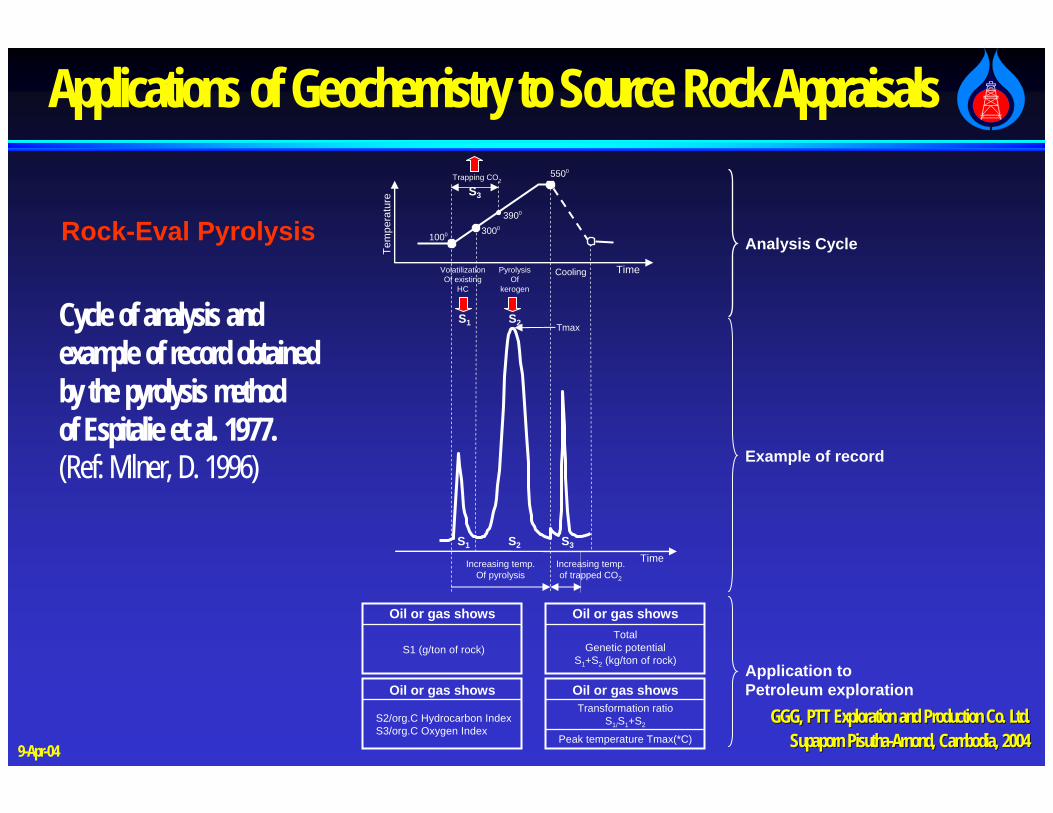
Oil or gas shows
S1 (g/ton of rock)
Oil or gas showsTotal
Genetic potentialS1+S2 (kg/ton of rock)
Oil or gas shows
S2/org.C Hydrocarbon IndexS3/org.C Oxygen Index
Oil or gas showsTransformation ratio
S1/S1+S2
Analysis Cycle
Example of record
Application toPetroleum exploration
Peak temperature Tmax(*C)
Cycle of analysis andexample of record obtainedby the pyrolysis methodof Espitalie et al. 1977.(Ref: Milner, D. 1996)
Rock-Eval Pyrolysis
GGG, PTT Exploration and Production Co. Ltd.GGG, PTT Exploration and Production Co. Ltd.Supaporn Supaporn PisuthaPisutha--ArnondArnond, Cambodia, 2004, Cambodia, 20049-Apr-04
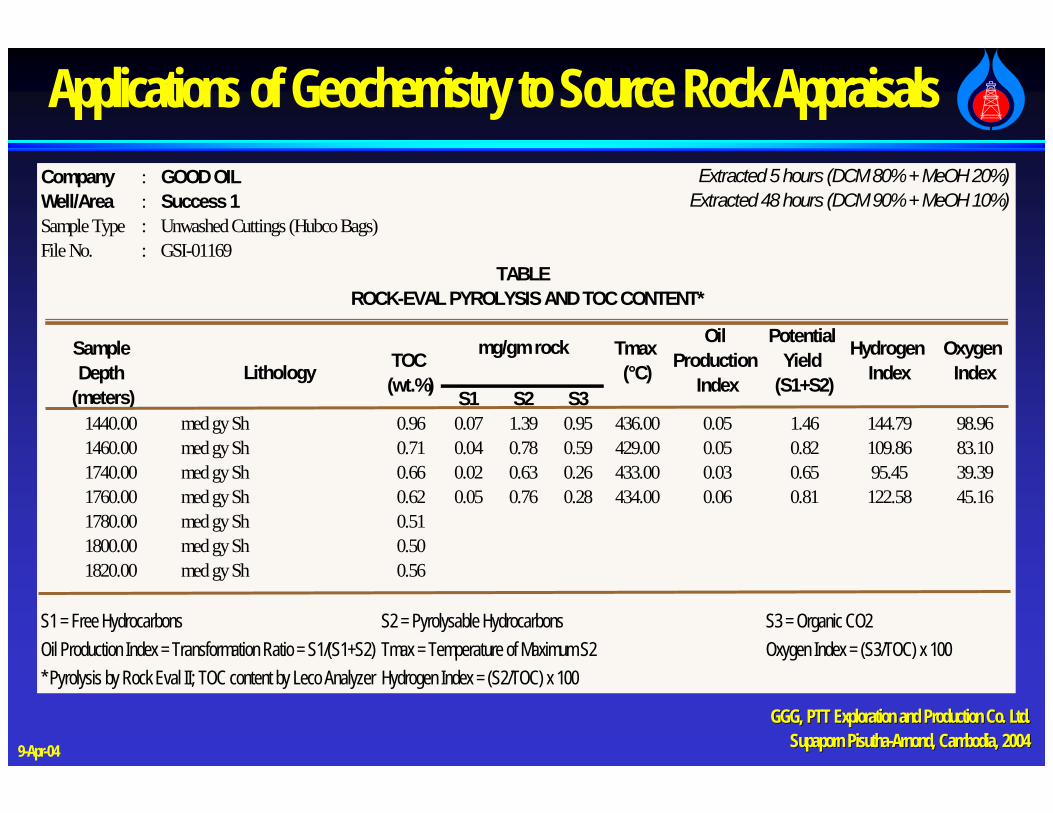
Applications of Geochemistry to Source Rock AppraisalsCompany : GOOD OILWell/Area : Success 1Sample Type : Unwashed Cuttings (Hubco Bags)File No. : GSI-01169
S1 S2 S31440.00 med gy Sh 0.96 0.07 1.39 0.95 436.00 0.05 1.46 144.79 98.961460.00 med gy Sh 0.71 0.04 0.78 0.59 429.00 0.05 0.82 109.86 83.101740.00 med gy Sh 0.66 0.02 0.63 0.26 433.00 0.03 0.65 95.45 39.391760.00 med gy Sh 0.62 0.05 0.76 0.28 434.00 0.06 0.81 122.58 45.161780.00 med gy Sh 0.511800.00 med gy Sh 0.501820.00 med gy Sh 0.56
S1 = Free Hydrocarbons S2 = Pyrolysable Hydrocarbons S3 = Organic CO2Oil Production Index = Transformation Ratio = S1/(S1+S2) Tmax = Temperature of Maximum S2 Oxygen Index = (S3/TOC) x 100* Pyrolysis by Rock Eval II; TOC content by Leco Analyzer Hydrogen Index = (S2/TOC) x 100
GGG, PTT Exploration and Production Co. Ltd.GGG, PTT Exploration and Production Co. Ltd.Supaporn Supaporn PisuthaPisutha--ArnondArnond, Cambodia, 2004, Cambodia, 20049-Apr-04
Applications of Geochemistry to Source Rock Appraisals
GGG, PTT Exploration and Production Co. Ltd.GGG, PTT Exploration and Production Co. Ltd.Supaporn Supaporn PisuthaPisutha--ArnondArnond, Cambodia, 2004, Cambodia, 20049-Apr-04
Applications of Geochemistry to Source Rock Appraisals
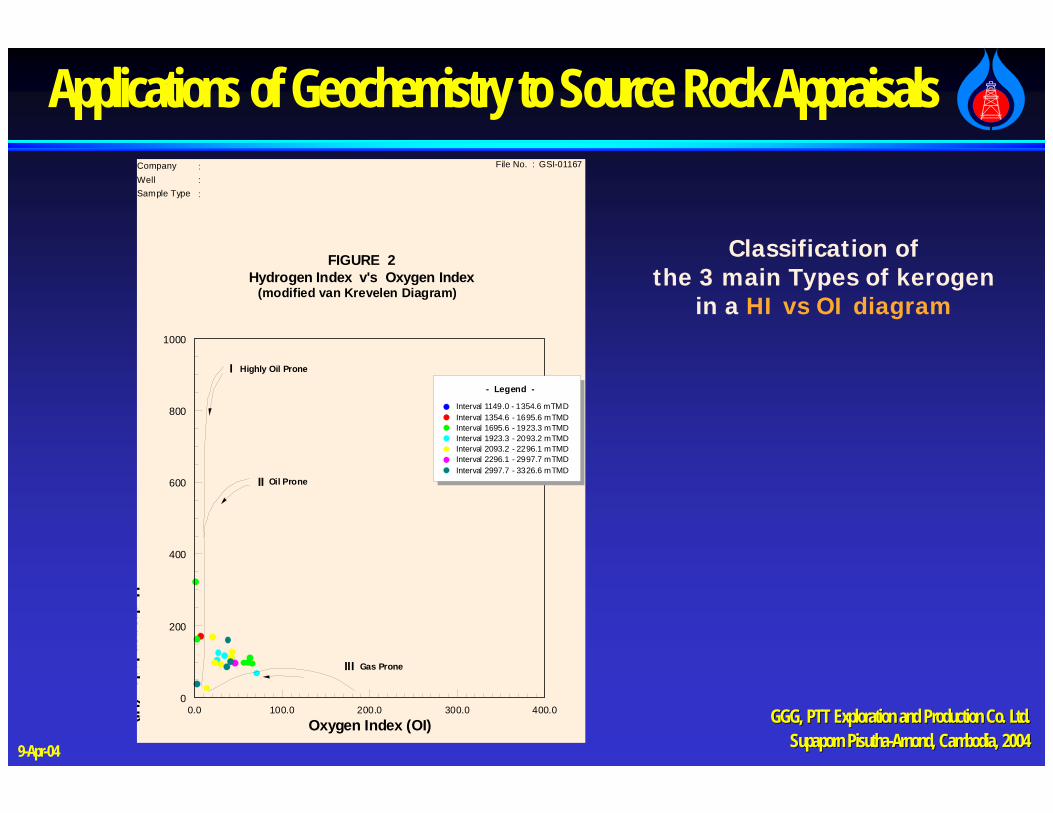
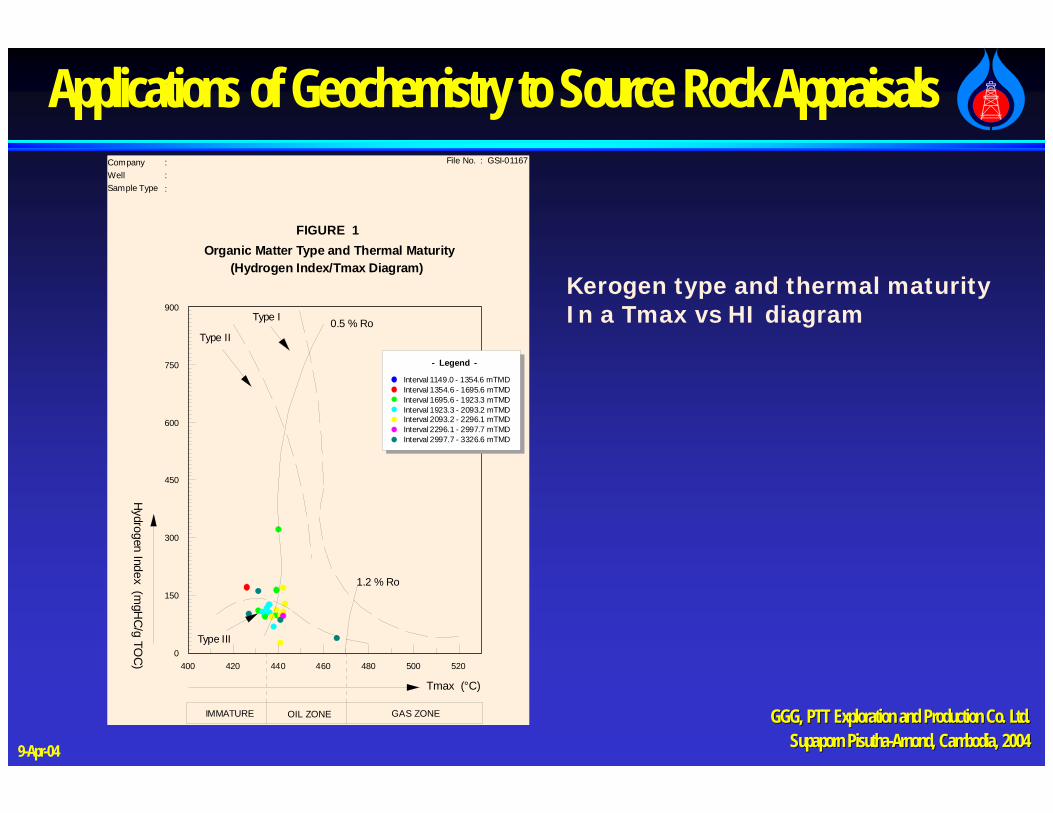
Organic Matter Type and Thermal Maturity(Hydrogen Index/Tmax Diagram)
Kerogen type and thermal maturityIn a Tmax vs HI diagram
GGG, PTT Exploration and Production Co. Ltd.GGG, PTT Exploration and Production Co. Ltd.Supaporn Supaporn PisuthaPisutha--ArnondArnond, Cambodia, 2004, Cambodia, 20049-Apr-04
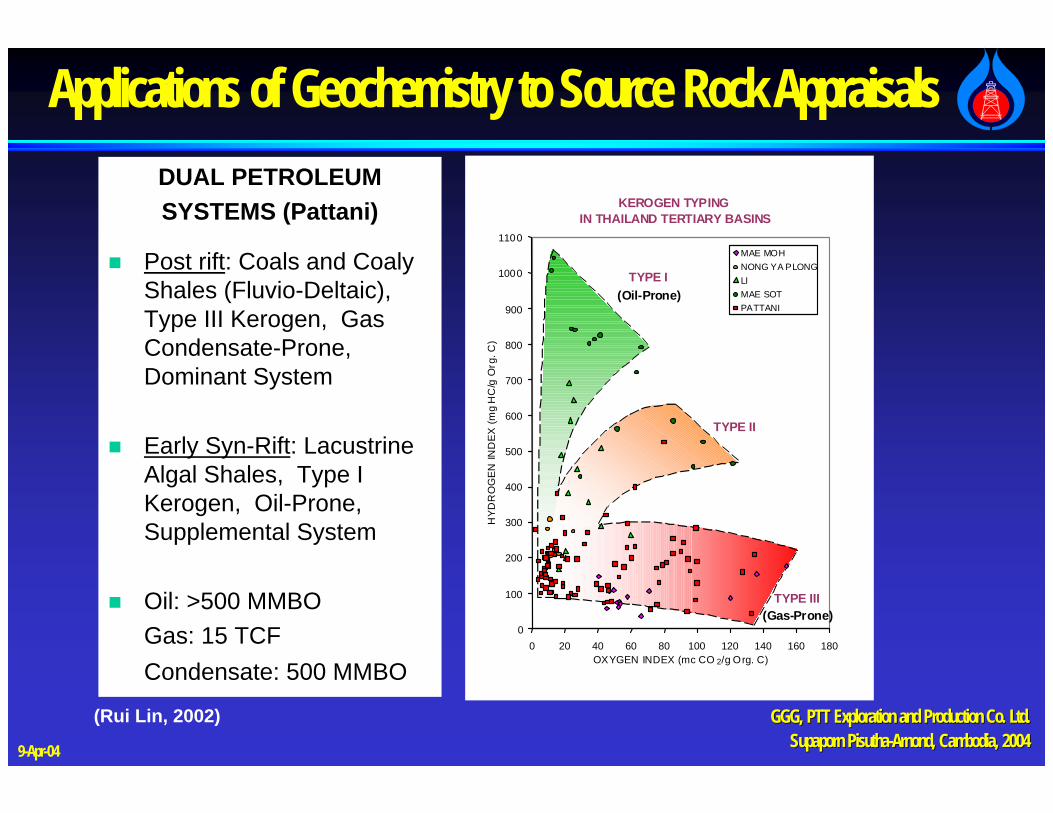
Applications of Geochemistry to Source Rock AppraisalsDUAL PETROLEUMSYSTEMS (Pattani)
Post rift: Coals and Coaly Shales (Fluvio-Deltaic), Type III Kerogen, Gas Condensate-Prone, Dominant System
Early Syn-Rift: LacustrineAlgal Shales, Type I Kerogen, Oil-Prone, Supplemental System
Oil: >500 MMBOGas: 15 TCFCondensate: 500 MMBO
KEROGEN TYPING IN THAILAND TERTIARY BASINS
0
100
200
300
400
500
600
700
800
900
1000
1100
0 20 40 60 80 100 120 140 160 180OXYGEN INDEX (mc CO 2/g Org. C)
HY
DR
OG
EN
IND
EX
(m
g H
C/g
Org
. C)
MAE MOHNONG YA PLONGLIMAE SOTPATTANI
TYPE I(Oil-Prone)
TYPE II
TYPE III(Gas-Prone)
(Rui Lin, 2002)
GGG, PTT Exploration and Production Co. Ltd.GGG, PTT Exploration and Production Co. Ltd.Supaporn Supaporn PisuthaPisutha--ArnondArnond, Cambodia, 2004, Cambodia, 20049-Apr-04
Applications of Geochemistry to Source Rock Appraisals
Optical Method to identify organic richness
Developed from Coal Petrology, the descriptionOf organic matter uses the maceral classification.
These techniques are still in their infacy and should beConsidered as aids to research rather than commonlyUsed tools. (Bordenave, M.L. 1993, Applied Petroleum Geochemistry)
VISUAL KEROGEN
GGG, PTT Exploration and Production Co. Ltd.GGG, PTT Exploration and Production Co. Ltd.Supaporn Supaporn PisuthaPisutha--ArnondArnond, Cambodia, 2004, Cambodia, 20049-Apr-04
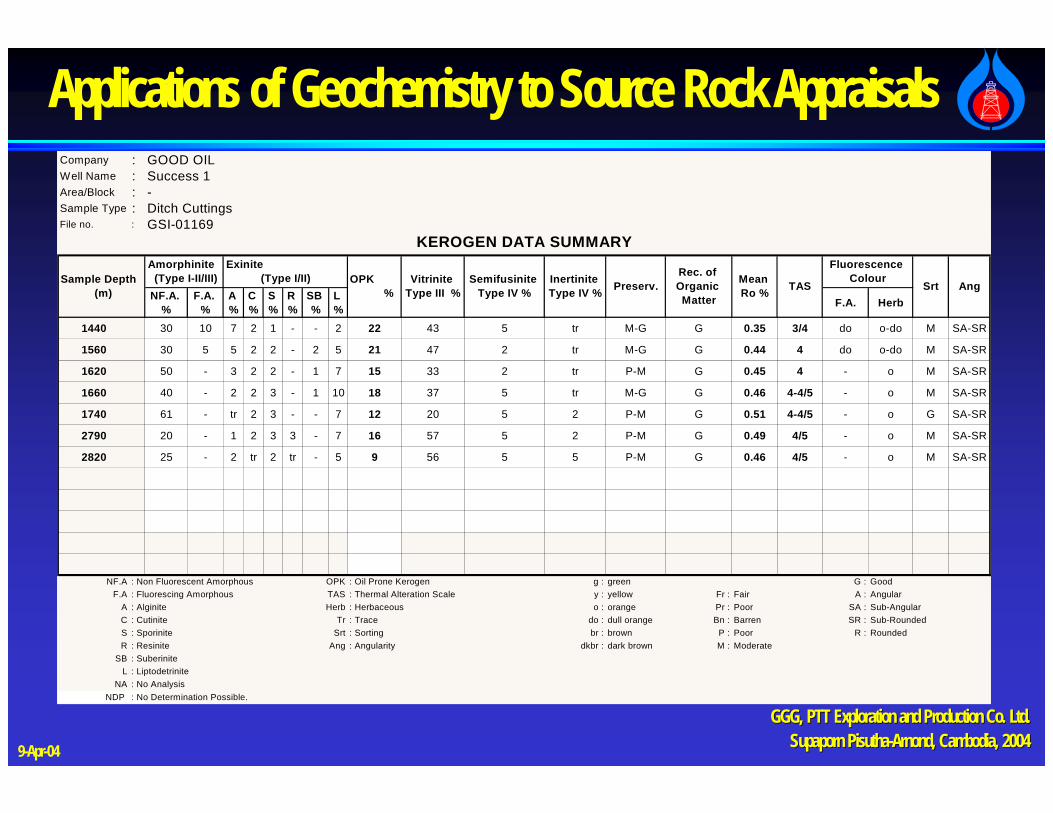
Applications of Geochemistry to Source Rock AppraisalsCompany : GOOD OILWell Name : Success 1Area/Block : -Sample Type : Ditch CuttingsFile no. : GSI-01169
NF.A. %
F.A. %
A %
C %
S %
R %
SB %
L % F.A. Herb
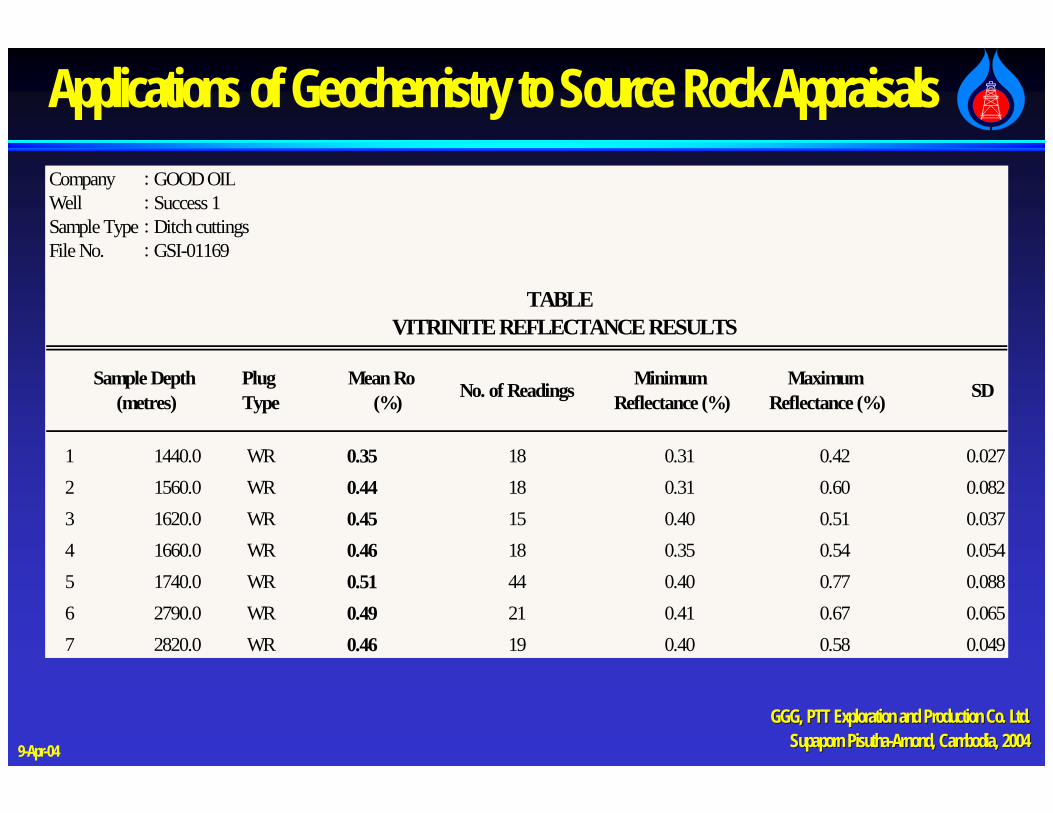
1440 30 10 7 2 1 - - 2 22 43 5 tr M-G G 0.35 3/4 do o-do M SA-SR
1560 30 5 5 2 2 - 2 5 21 47 2 tr M-G G 0.44 4 do o-do M SA-SR
1620 50 - 3 2 2 - 1 7 15 33 2 tr P-M G 0.45 4 - o M SA-SR
1660 40 - 2 2 3 - 1 10 18 37 5 tr M-G G 0.46 4-4/5 - o M SA-SR
1740 61 - tr 2 3 - - 7 12 20 5 2 P-M G 0.51 4-4/5 - o G SA-SR
2790 20 - 1 2 3 3 - 7 16 57 5 2 P-M G 0.49 4/5 - o M SA-SR
2820 25 - 2 tr 2 tr - 5 9 56 5 5 P-M G 0.46 4/5 - o M SA-SR
NF.A : Non Fluorescent Amorphous OPK : Oil Prone Kerogen g : green G : GoodF.A : Fluorescing Amorphous TAS : Thermal Alteration Scale y : yellow Fr : Fair A : Angular
A : Alginite Herb : Herbaceous o : orange Pr : Poor SA : Sub-AngularC : Cutinite Tr : Trace do : dull orange Bn : Barren SR : Sub-RoundedS : Sporinite Srt : Sorting br : brown P : Poor R : RoundedR : Resinite Ang : Angularity dkbr : dark brown M : Moderate
SB : SuberiniteL : Liptodetrinite
NA : No AnalysisNDP : No Determination Possible.
KEROGEN DATA SUMMARY
Sample Depth (m)
Amorphinite (Type I-II/III)
Exinite (Type I/II) OPK
%Vitrinite
Type III %Semifusinite
Type IV %Inertinite Type IV %
Rec. of Organic Matter
Mean Ro % AngPreserv. TAS
Fluorescence Colour
Srt
GGG, PTT Exploration and Production Co. Ltd.GGG, PTT Exploration and Production Co. Ltd.Supaporn Supaporn PisuthaPisutha--ArnondArnond, Cambodia, 2004, Cambodia, 20049-Apr-04
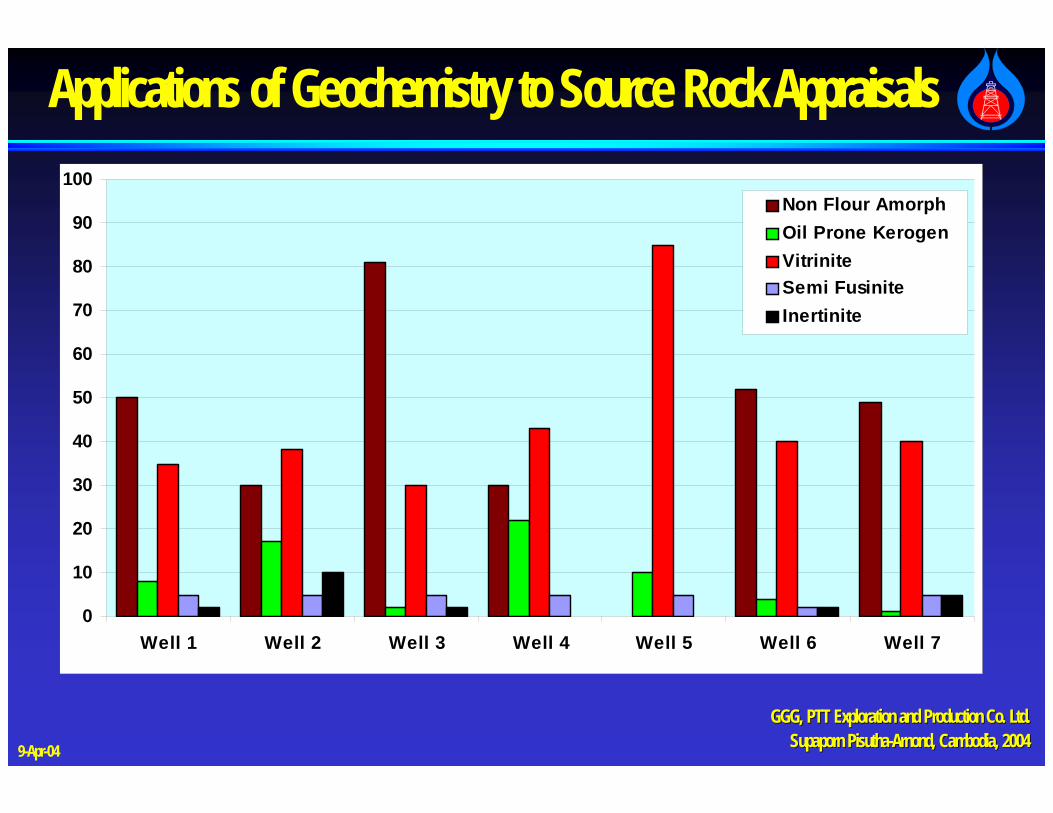
Applications of Geochemistry to Source Rock Appraisals
0
10
20
30
40
50
60
70
80
90
100
Well 1 Well 2 Well 3 Well 4 Well 5 Well 6 Well 7
Non Flour AmorphOil Prone KerogenVitriniteSemi FusiniteInertinite
GGG, PTT Exploration and Production Co. Ltd.GGG, PTT Exploration and Production Co. Ltd.Supaporn Supaporn PisuthaPisutha--ArnondArnond, Cambodia, 2004, Cambodia, 20049-Apr-04
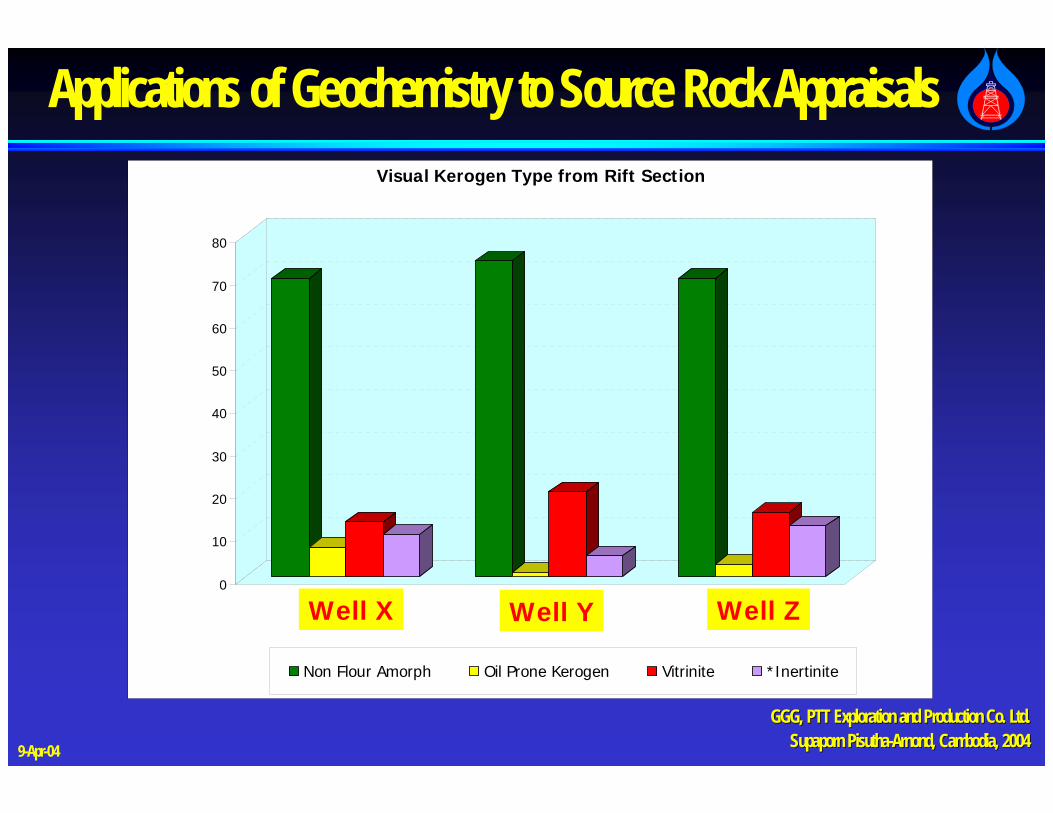
Applications of Geochemistry to Source Rock Appraisals
0
10
20
30
40
50
60
70
80
14-1X3110
14-5(ST)3770
14-6X3280
Visual Kerogen Type from Rift Section
Non Flour Amorph Oil Prone Kerogen Vitrinite *Inertinite
Well X Well Y Well Z
GGG, PTT Exploration and Production Co. Ltd.GGG, PTT Exploration and Production Co. Ltd.Supaporn Supaporn PisuthaPisutha--ArnondArnond, Cambodia, 2004, Cambodia, 20049-Apr-04
Applications of Geochemistry to Source Rock Appraisals
MATURITY
GGG, PTT Exploration and Production Co. Ltd.GGG, PTT Exploration and Production Co. Ltd.Supaporn Supaporn PisuthaPisutha--ArnondArnond, Cambodia, 2004, Cambodia, 20049-Apr-04
Applications of Geochemistry to Source Rock Appraisals
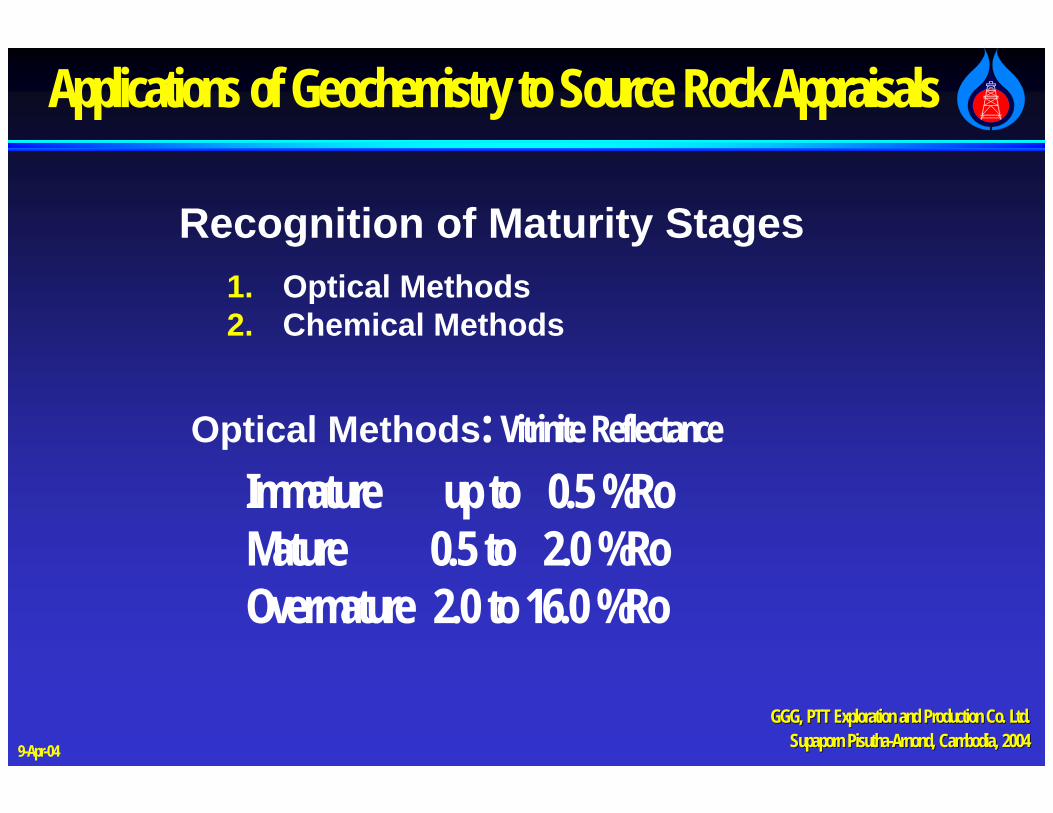
Recognition of Maturity Stages1. Optical Methods2. Chemical Methods
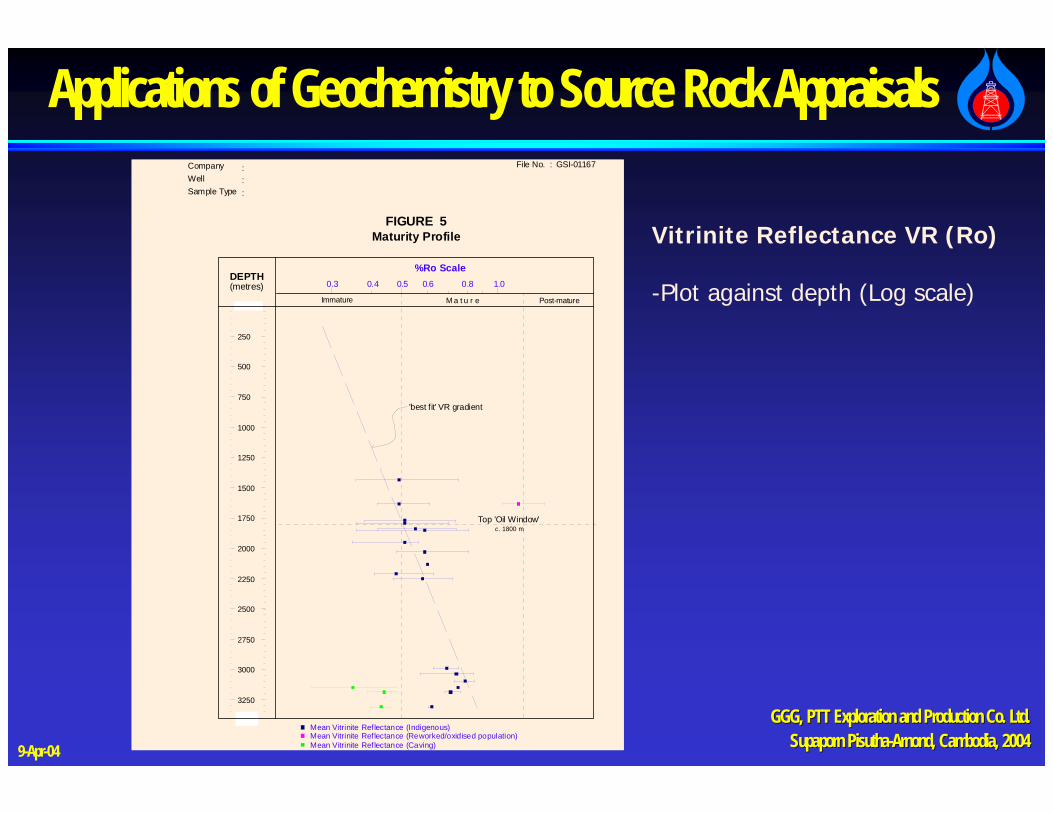
Optical Methods: Vitrinite Reflectance
Immature up to 0.5 %RoMature 0.5 to 2.0 %RoOvermature 2.0 to 16.0 %Ro
GGG, PTT Exploration and Production Co. Ltd.GGG, PTT Exploration and Production Co. Ltd.Supaporn Supaporn PisuthaPisutha--ArnondArnond, Cambodia, 2004, Cambodia, 20049-Apr-04
Applications of Geochemistry to Source Rock AppraisalsCompany : GOOD OILWell : Success 1Sample Type : Ditch cuttingsFile No. : GSI-01169
GGG, PTT Exploration and Production Co. Ltd.GGG, PTT Exploration and Production Co. Ltd.Supaporn Supaporn PisuthaPisutha--ArnondArnond, Cambodia, 2004, Cambodia, 20049-Apr-04
Applications of Geochemistry to Source Rock Appraisals
GGG, PTT Exploration and Production Co. Ltd.GGG, PTT Exploration and Production Co. Ltd.Supaporn Supaporn PisuthaPisutha--ArnondArnond, Cambodia, 2004, Cambodia, 20049-Apr-04
Applications of Geochemistry to Source Rock Appraisals
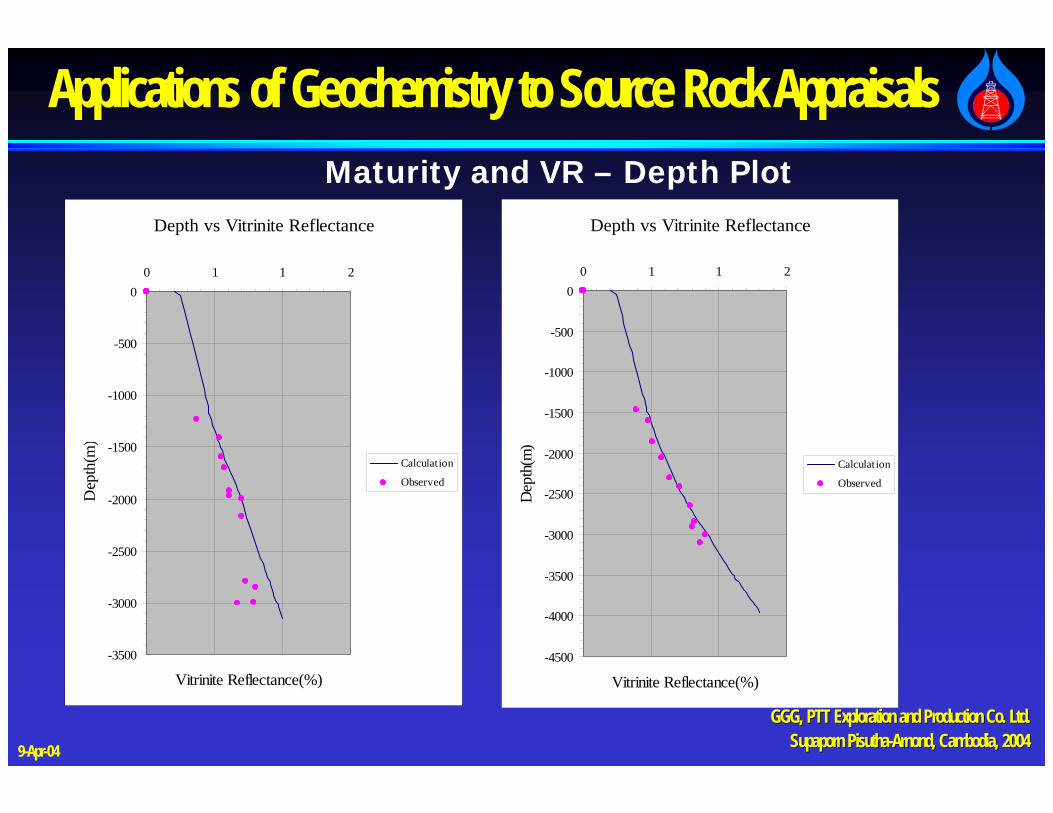
Depth vs Vitrinite Reflectance
-3500
-3000
-2500
-2000
-1500
-1000
-500
00 1 1 2
Vitrinite Reflectance(%)
Dep
th(m
)
Calculation
Observed
Depth vs Vitrinite Reflectance
-4500
-4000
-3500
-3000
-2500
-2000
-1500
-1000
-500
00 1 1 2
Vitrinite Reflectance(%)
Dep
th(m
)
Calculation
Observed
Maturity and VR – Depth Plot
GGG, PTT Exploration and Production Co. Ltd.GGG, PTT Exploration and Production Co. Ltd.Supaporn Supaporn PisuthaPisutha--ArnondArnond, Cambodia, 2004, Cambodia, 20049-Apr-04
Applications of Geochemistry to Source Rock Appraisals
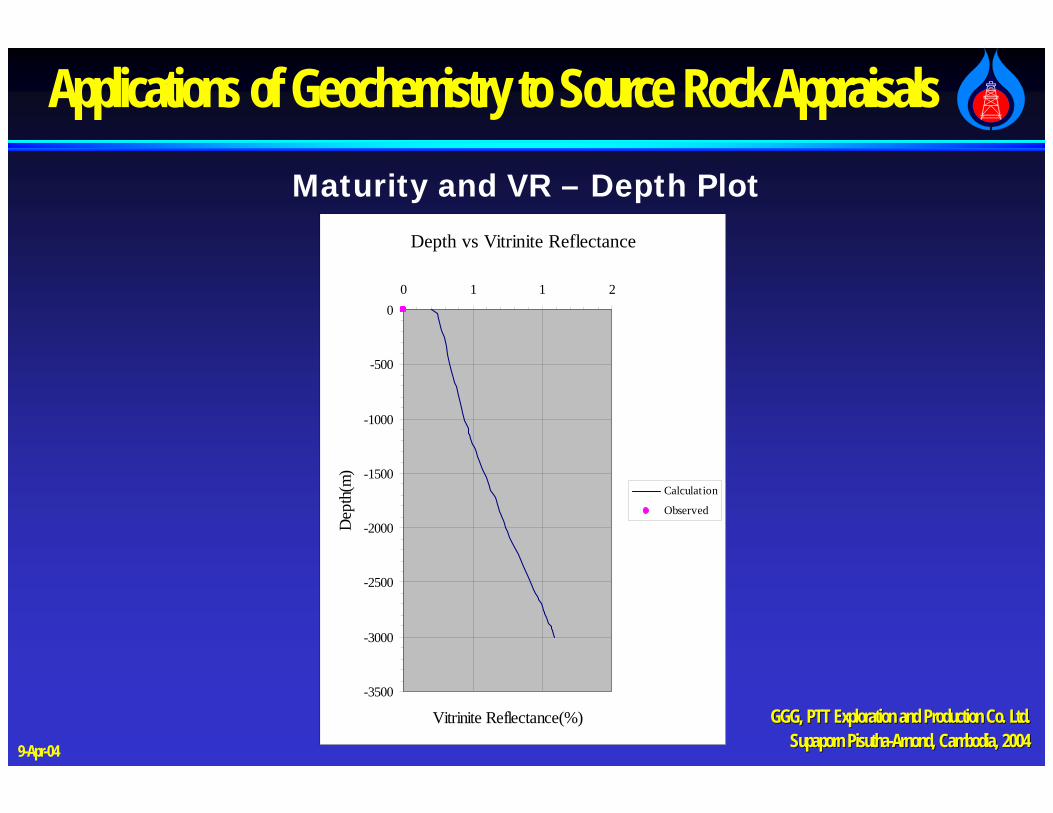
Depth vs Vitrinite Reflectance
-3500
-3000
-2500
-2000
-1500
-1000
-500
00 1 1 2
Vitrinite Reflectance(%)
Dep
th(m
)
Calculation
Observed
Maturity and VR – Depth Plot
GGG, PTT Exploration and Production Co. Ltd.GGG, PTT Exploration and Production Co. Ltd.Supaporn Supaporn PisuthaPisutha--ArnondArnond, Cambodia, 2004, Cambodia, 20049-Apr-04
Applications of Geochemistry to Source Rock Appraisals
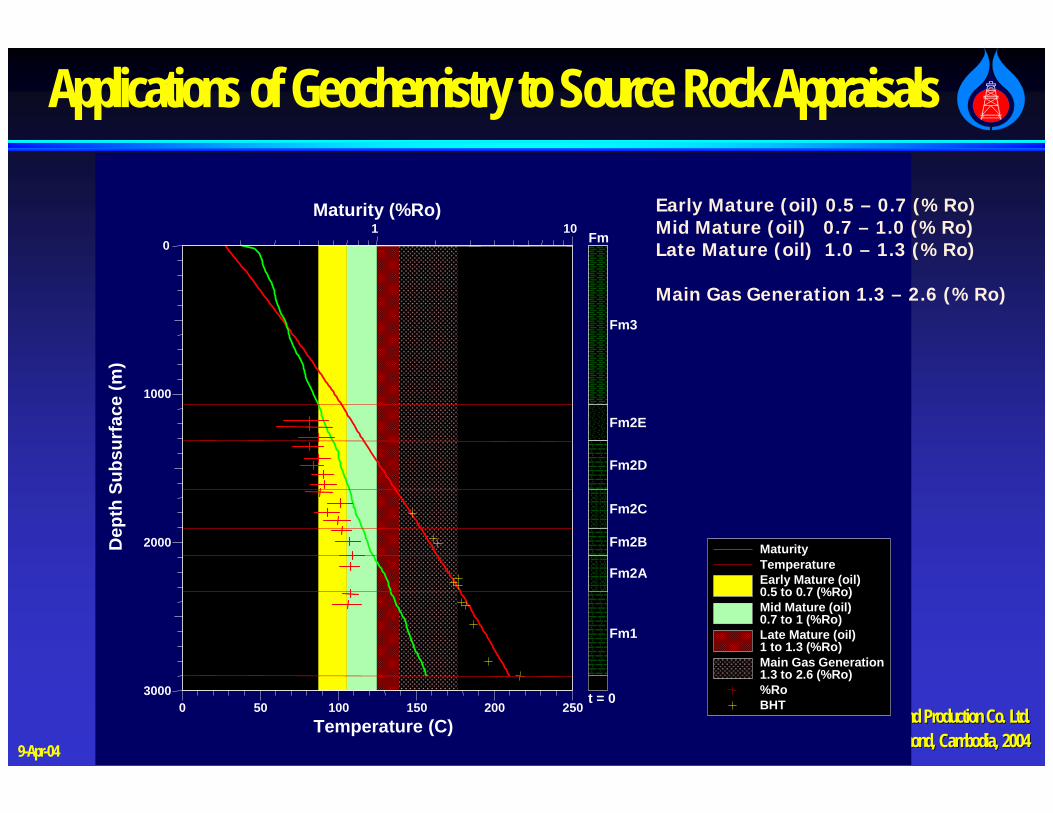
Temperature (C)0 50 100 150 200 250
Dep
th S
ubsu
rfac
e (m
)
0
1000
2000
3000
Maturity (%Ro)1 10
Fm3
Fm2E
Fm2D
Fm2C
Fm2B
Fm2A
Fm1
Fm
t = 0
MaturityTemperatureEarly Mature (oil)0.5 to 0.7 (%Ro)Mid Mature (oil)0.7 to 1 (%Ro)Late Mature (oil)1 to 1.3 (%Ro)Main Gas Generation1.3 to 2.6 (%Ro)%Ro BHT
Temperature (C)0 50 100 150 200 250
Dep
th S
ubsu
rfac
e (m
)
0
1000
2000
3000
Maturity (%Ro)1 10
Fm3
Fm2E
Fm2D
Fm2C
Fm2B
Fm2A
Fm1
Fm
t = 0
MaturityTemperatureEarly Mature (oil)0.5 to 0.7 (%Ro)Mid Mature (oil)0.7 to 1 (%Ro)Late Mature (oil)1 to 1.3 (%Ro)Main Gas Generation1.3 to 2.6 (%Ro)%Ro BHT
GGG, PTT Exploration and Production Co. Ltd.GGG, PTT Exploration and Production Co. Ltd.Supaporn Supaporn PisuthaPisutha--ArnondArnond, Cambodia, 2004, Cambodia, 20049-Apr-04
Applications of Geochemistry to Source Rock Appraisals
Hydrocarbon Volume Calculation
GGG, PTT Exploration and Production Co. Ltd.GGG, PTT Exploration and Production Co. Ltd.Supaporn Supaporn PisuthaPisutha--ArnondArnond, Cambodia, 2004, Cambodia, 20049-Apr-04
Applications of Geochemistry to Source Rock Appraisals
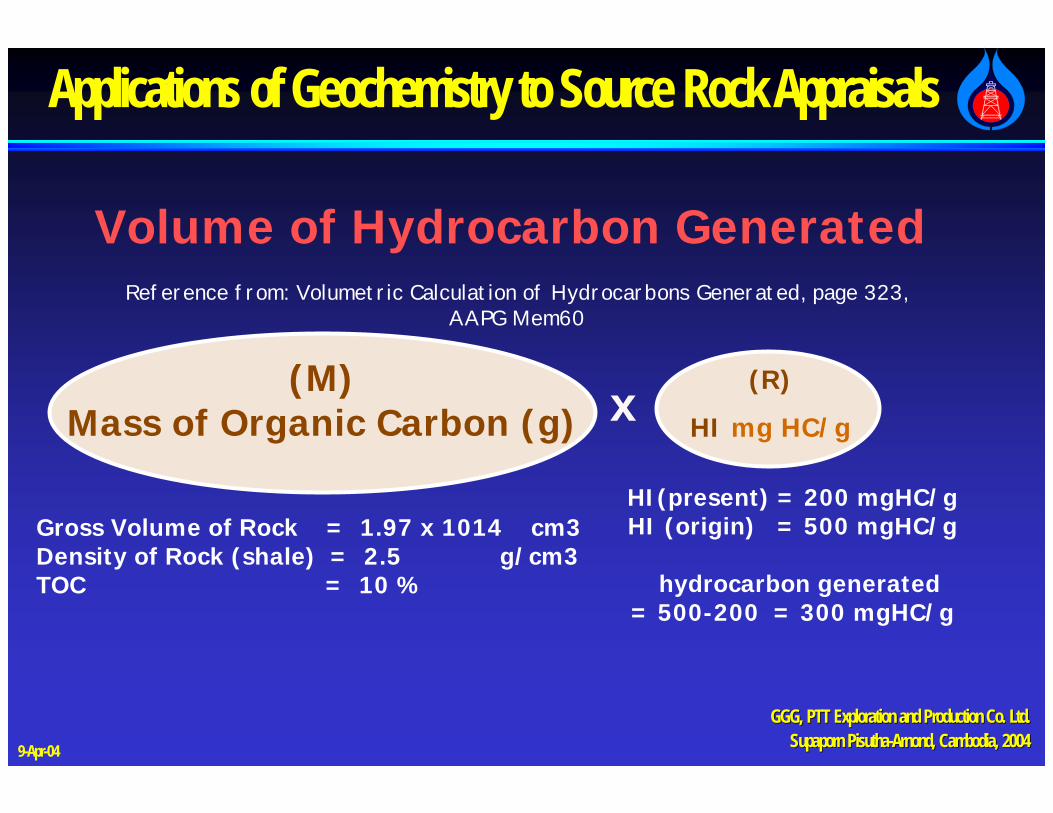
Gross Volume of Rock = 1.97 x 1014 cm3Density of Rock (shale) = 2.5 g/cm3TOC = 10 %
HI(present) = 200 mgHC/gHI (origin) = 500 mgHC/g
hydrocarbon generated = 500-200 = 300 mgHC/g
GGG, PTT Exploration and Production Co. Ltd.GGG, PTT Exploration and Production Co. Ltd.Supaporn Supaporn PisuthaPisutha--ArnondArnond, Cambodia, 2004, Cambodia, 20049-Apr-04
Applications of Geochemistry to Source Rock Appraisals
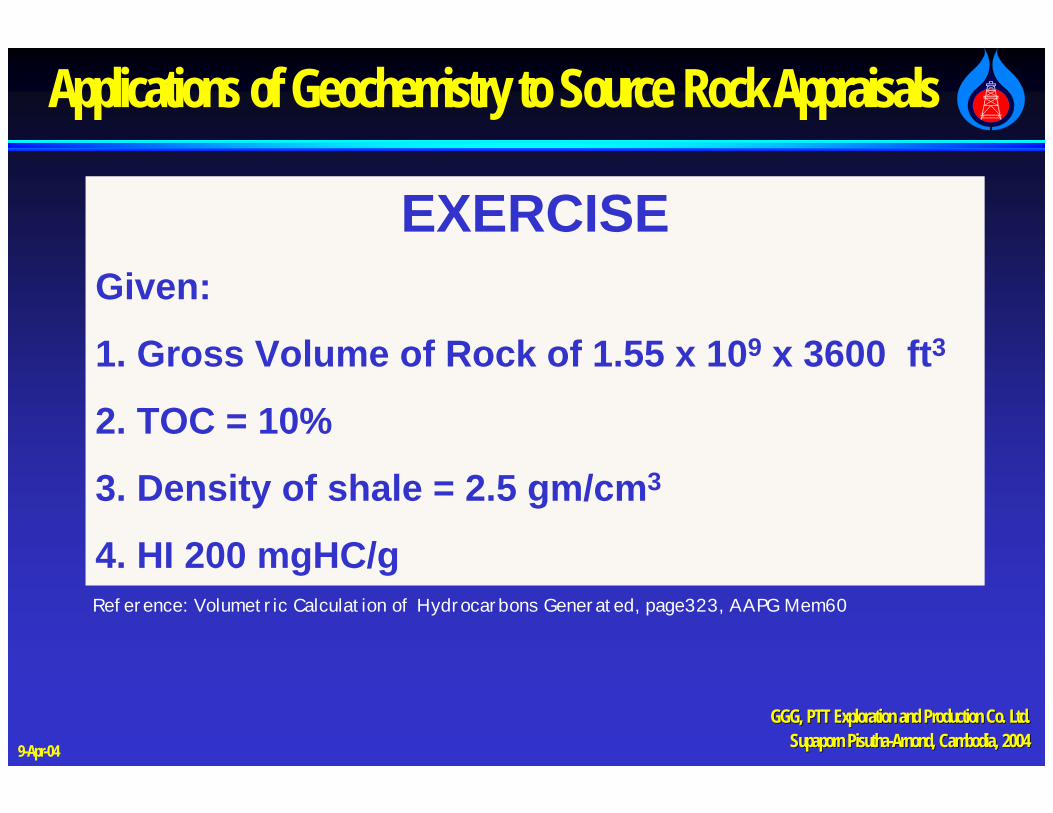
EXERCISEGiven:
1. Gross Volume of Rock of 1.55 x 109 x 3600 ft3
2. TOC = 10%
3. Density of shale = 2.5 gm/cm3
4. HI 200 mgHC/gReference: Volumetric Calculation of Hydrocarbons Generated, page323, AAPG Mem60
GGG, PTT Exploration and Production Co. Ltd.GGG, PTT Exploration and Production Co. Ltd.Supaporn Supaporn PisuthaPisutha--ArnondArnond, Cambodia, 2004, Cambodia, 20049-Apr-04
Applications of Geochemistry to Source Rock Appraisals
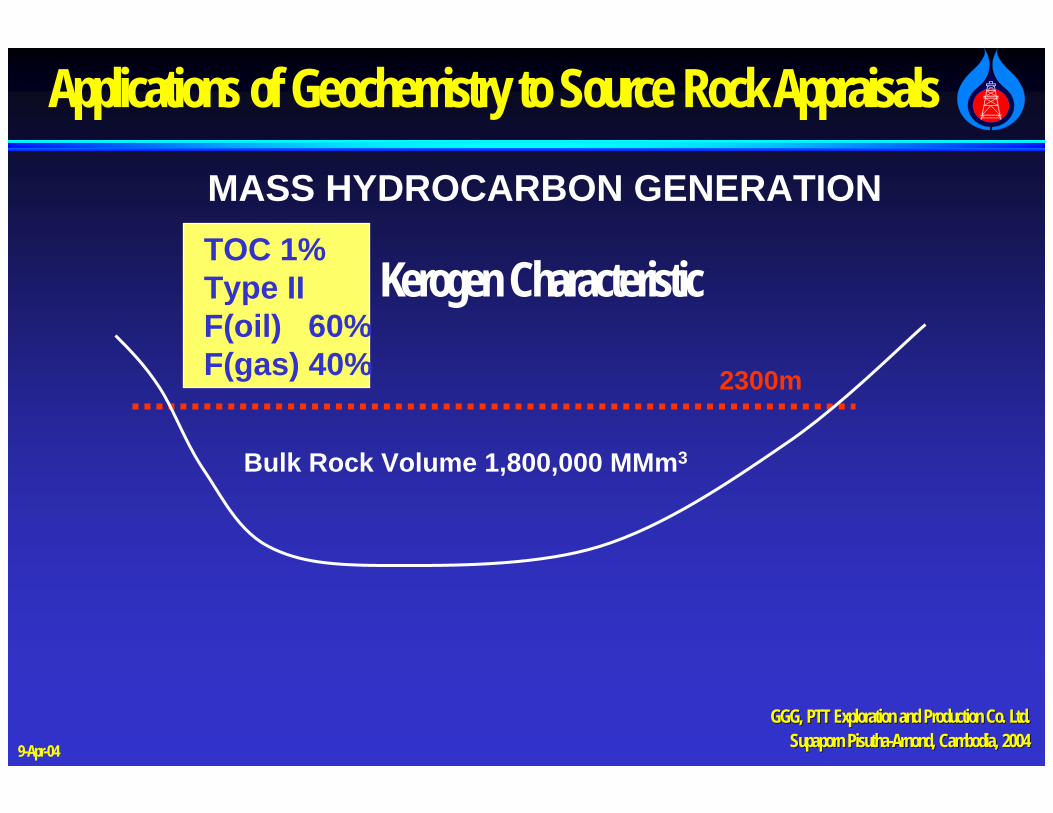
2300m
MASS HYDROCARBON GENERATION
Bulk Rock Volume 1,800,000 MMm3
TOC 1%Type II F(oil) 60%F(gas) 40%
Kerogen Characteristic
GGG, PTT Exploration and Production Co. Ltd.GGG, PTT Exploration and Production Co. Ltd.Supaporn Supaporn PisuthaPisutha--ArnondArnond, Cambodia, 2004, Cambodia, 20049-Apr-04
Applications of Geochemistry to Source Rock Appraisals
TOC 1%
Type II
F(oil) 60%
F(gas)40%
@ 2300m
Bulk Rock Volume 1,800,000 MMm3
MASS Hydrocarbon Generated
OIL 43,000 MMBBL
GAS 970 BCF
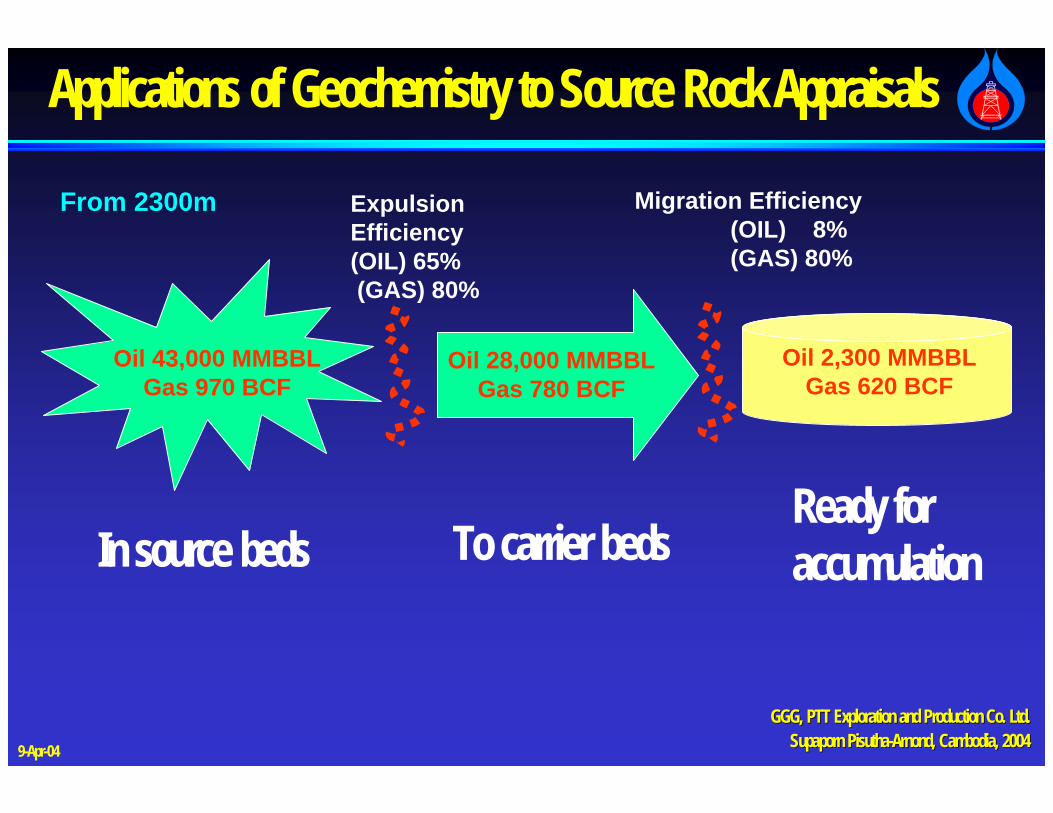
Expulsion efficiency for oil 65% for gas 80%
Migration efficiency for oil 8%for gas 80%
Mass HC generated (Oil) subjected to traps 2,300 MMBBL
Mass HC generated (Gas) subjected to traps 620 BCF
GGG, PTT Exploration and Production Co. Ltd.GGG, PTT Exploration and Production Co. Ltd.Supaporn Supaporn PisuthaPisutha--ArnondArnond, Cambodia, 2004, Cambodia, 20049-Apr-04
Applications of Geochemistry to Source Rock Appraisals
Oil 43,000 MMBBLGas 970 BCF
Expulsion Efficiency (OIL) 65%(GAS) 80%
Oil 28,000 MMBBLGas 780 BCF
Oil 2,300 MMBBLGas 620 BCF
Migration Efficiency (OIL) 8%(GAS) 80%
From 2300m
In source beds To carrier bedsReady for accumulation
GGG, PTT Exploration and Production Co. Ltd.GGG, PTT Exploration and Production Co. Ltd.Supaporn Supaporn PisuthaPisutha--ArnondArnond, Cambodia, 2004, Cambodia, 20049-Apr-04
Applications of Geochemistry to Source Rock Appraisals
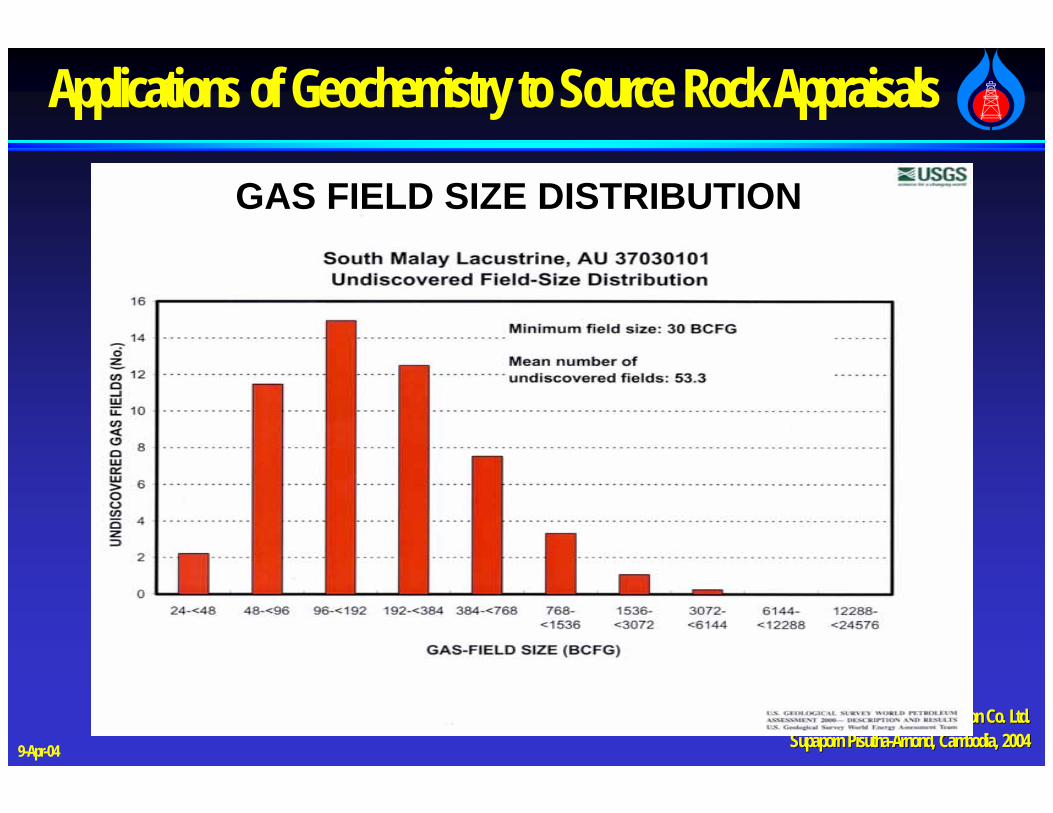
GAS FIELD SIZE DISTRIBUTION
GGG, PTT Exploration and Production Co. Ltd.GGG, PTT Exploration and Production Co. Ltd.Supaporn Supaporn PisuthaPisutha--ArnondArnond, Cambodia, 2004, Cambodia, 20049-Apr-04
Applications of Geochemistry to Source Rock Appraisals
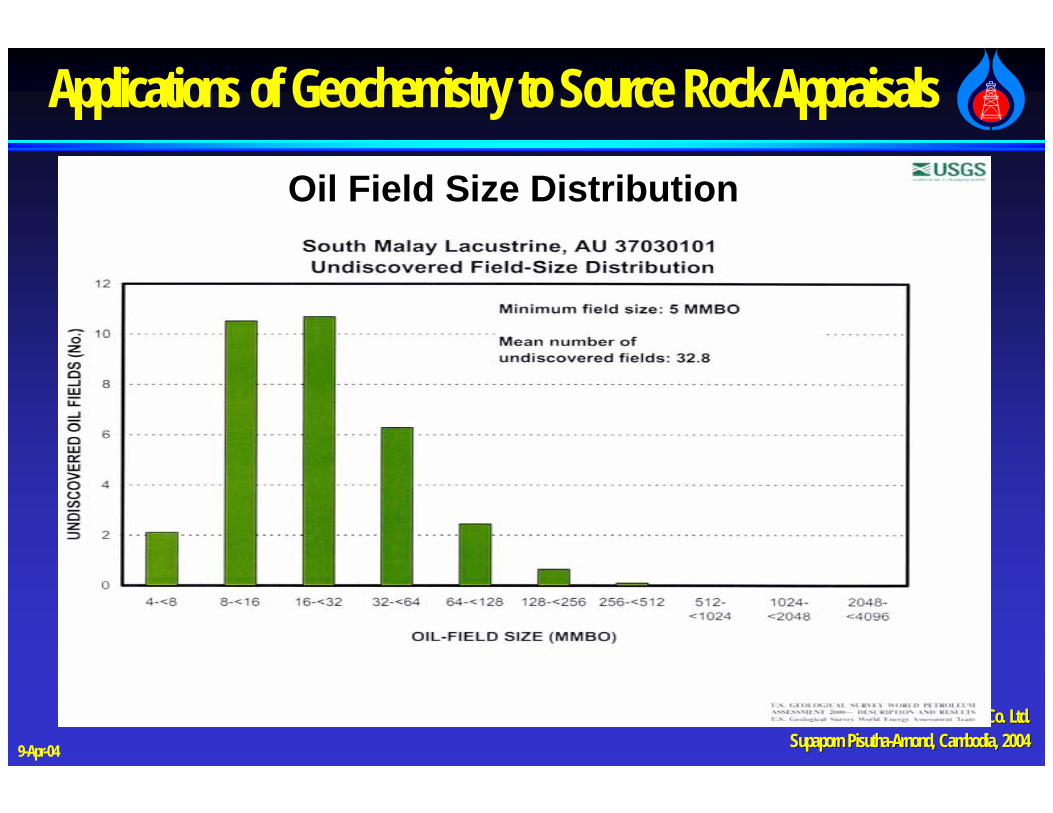
Oil Field Size DistributionOil Field Size Distribution
GGG, PTT Exploration and Production Co. Ltd.GGG, PTT Exploration and Production Co. Ltd.Supaporn Supaporn PisuthaPisutha--ArnondArnond, Cambodia, 2004, Cambodia, 20049-Apr-04
Applications of Geochemistry to Source Rock Appraisals
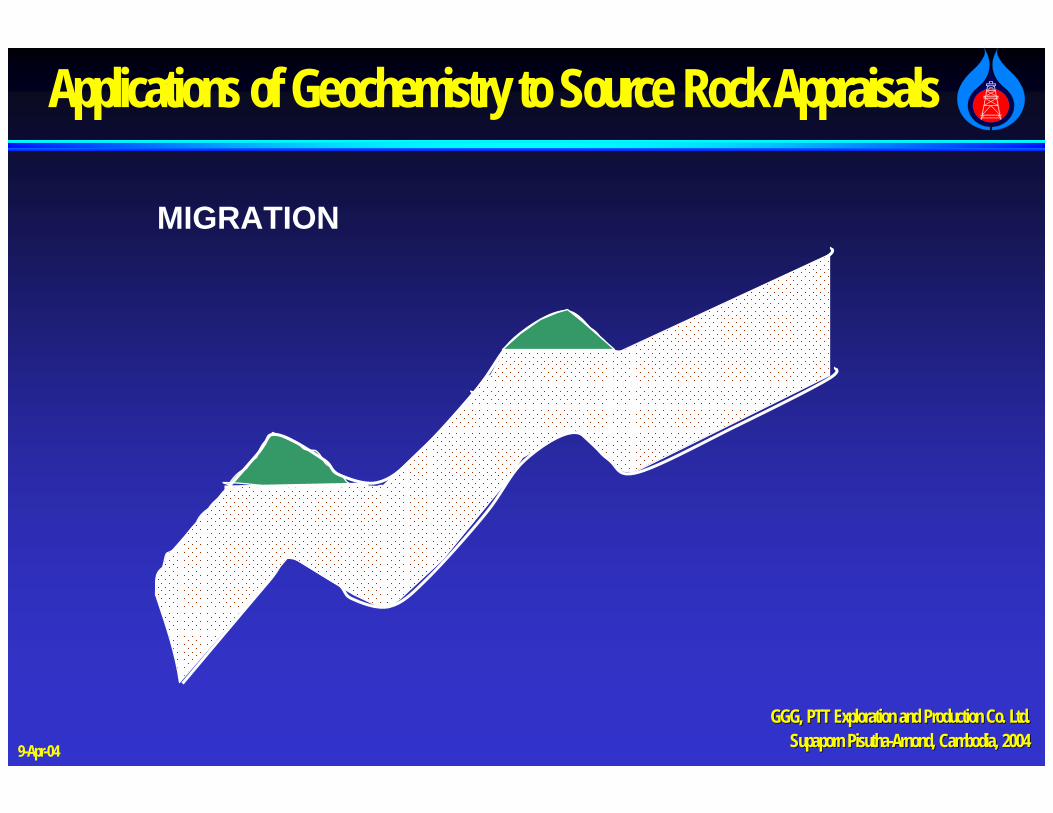
MIGRATION
GGG, PTT Exploration and Production Co. Ltd.GGG, PTT Exploration and Production Co. Ltd.Supaporn Supaporn PisuthaPisutha--ArnondArnond, Cambodia, 2004, Cambodia, 20049-Apr-04
Applications of Geochemistry to Source Rock Appraisals
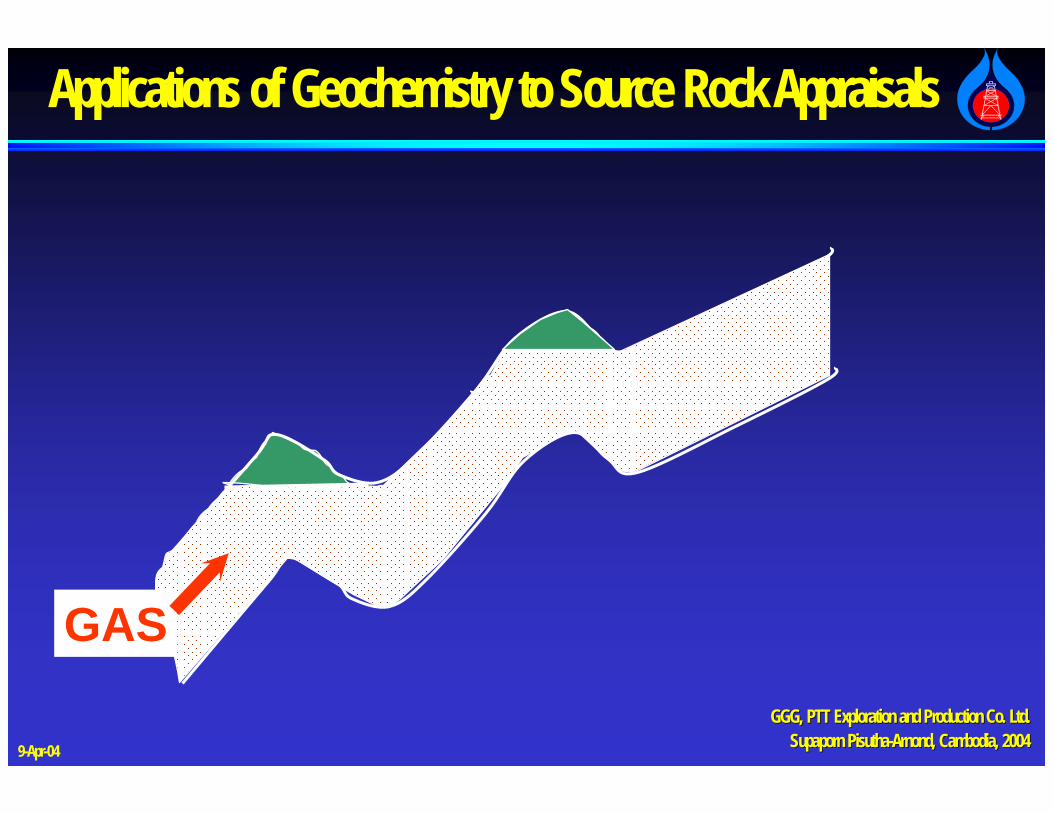
GAS
GGG, PTT Exploration and Production Co. Ltd.GGG, PTT Exploration and Production Co. Ltd.Supaporn Supaporn PisuthaPisutha--ArnondArnond, Cambodia, 2004, Cambodia, 20049-Apr-04
Applications of Geochemistry to Source Rock Appraisals
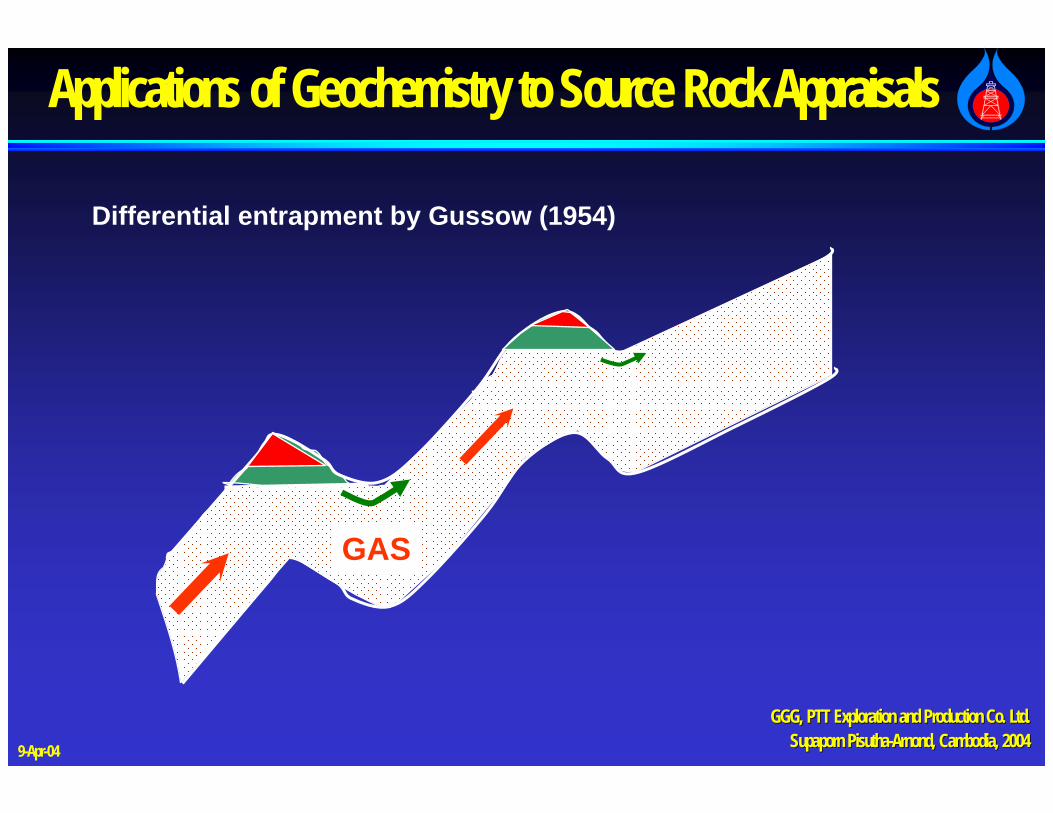
GAS
Differential entrapment by Gussow (1954)
GGG, PTT Exploration and Production Co. Ltd.GGG, PTT Exploration and Production Co. Ltd.Supaporn Supaporn PisuthaPisutha--ArnondArnond, Cambodia, 2004, Cambodia, 20049-Apr-04
Applications of Geochemistry to Source Rock Appraisals
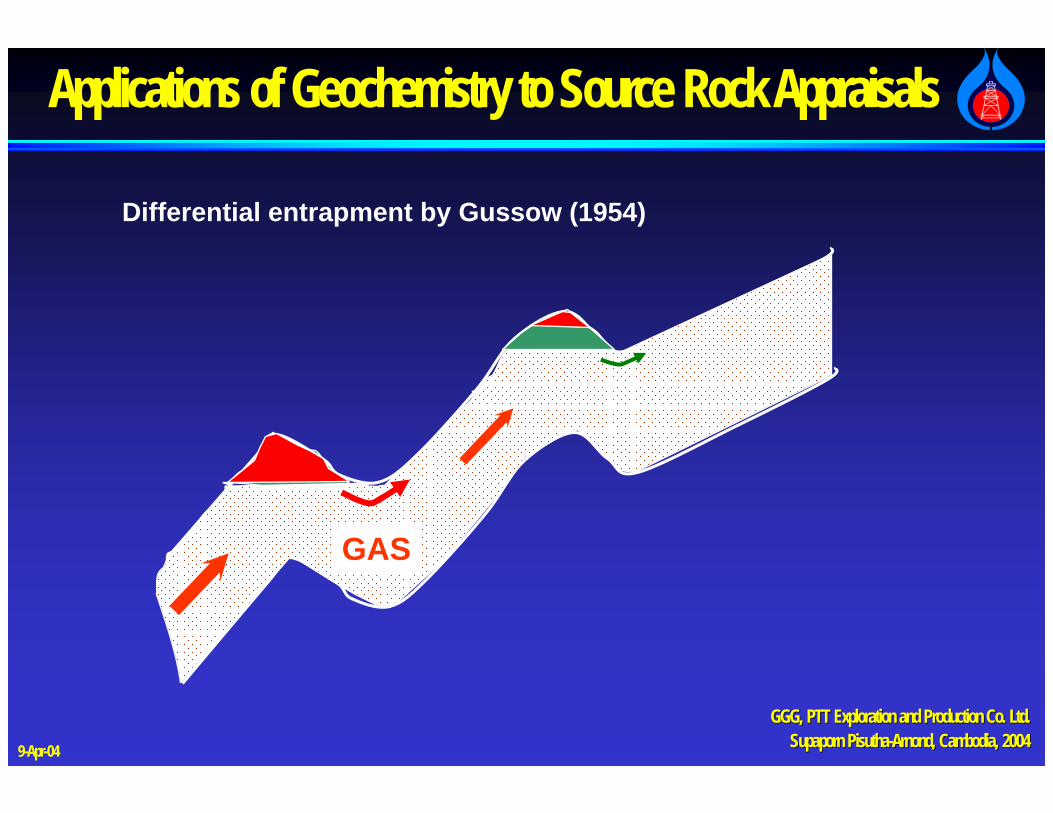
GAS
Differential entrapment by Gussow (1954)
GGG, PTT Exploration and Production Co. Ltd.GGG, PTT Exploration and Production Co. Ltd.Supaporn Supaporn PisuthaPisutha--ArnondArnond, Cambodia, 2004, Cambodia, 20049-Apr-04
Applications of Geochemistry to Source Rock Appraisals
HYDROCARBON FLUIDS
GAS
OIL/CONDENSATE
GGG, PTT Exploration and Production Co. Ltd.GGG, PTT Exploration and Production Co. Ltd.Supaporn Supaporn PisuthaPisutha--ArnondArnond, Cambodia, 2004, Cambodia, 20049-Apr-04
Applications of Geochemistry to Source Rock Appraisals
CO2
GGG, PTT Exploration and Production Co. Ltd.GGG, PTT Exploration and Production Co. Ltd.Supaporn Supaporn PisuthaPisutha--ArnondArnond, Cambodia, 2004, Cambodia, 20049-Apr-04
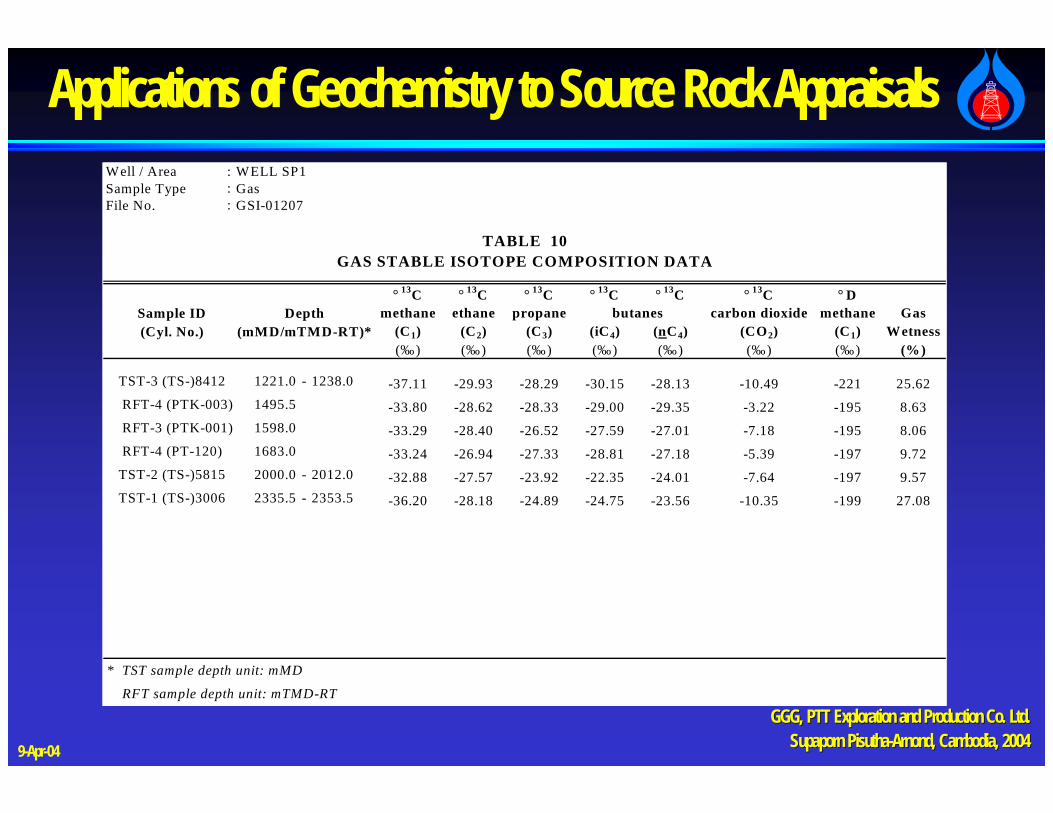
Applications of Geochemistry to Source Rock AppraisalsWell / Area : WELL SP1Sample Type : GasFile No. : GSI-01207
GGG, PTT Exploration and Production Co. Ltd.GGG, PTT Exploration and Production Co. Ltd.Supaporn Supaporn PisuthaPisutha--ArnondArnond, Cambodia, 2004, Cambodia, 20049-Apr-04
Applications of Geochemistry to Source Rock Appraisals
Basement
Arthit-15-1X
Arthit-15-4X Arthit-15-6X
0 20 40 60 80 100-3,100
-3,000
-2,900
-2,800
-2,700
-2,600
-2,500
-2,400
-2,300
-2,200
-2,100
-2,000
-1,900
-1,800
-1,700
-1,600
-1,500
-1,400
-1,300
-1,200
-1,100
-1,000
0 20 40 60 80 100-3,100
-3,000
-2,900
-2,800
-2,700
-2,600
-2,500
-2,400
-2,300
-2,200
-2,100
-2,000
-1,900
-1,800
-1,700
-1,600
-1,500
-1,400
-1,300
-1,200
-1,100
-1,000
0 20 40 60 80 100-3,100
-3,000
-2,900
-2,800
-2,700
-2,600
-2,500
-2,400
-2,300
-2,200
-2,100
-2,000
-1,900
-1,800
-1,700
-1,600
-1,500
-1,400
-1,300
-1,200
-1,100
-1,000
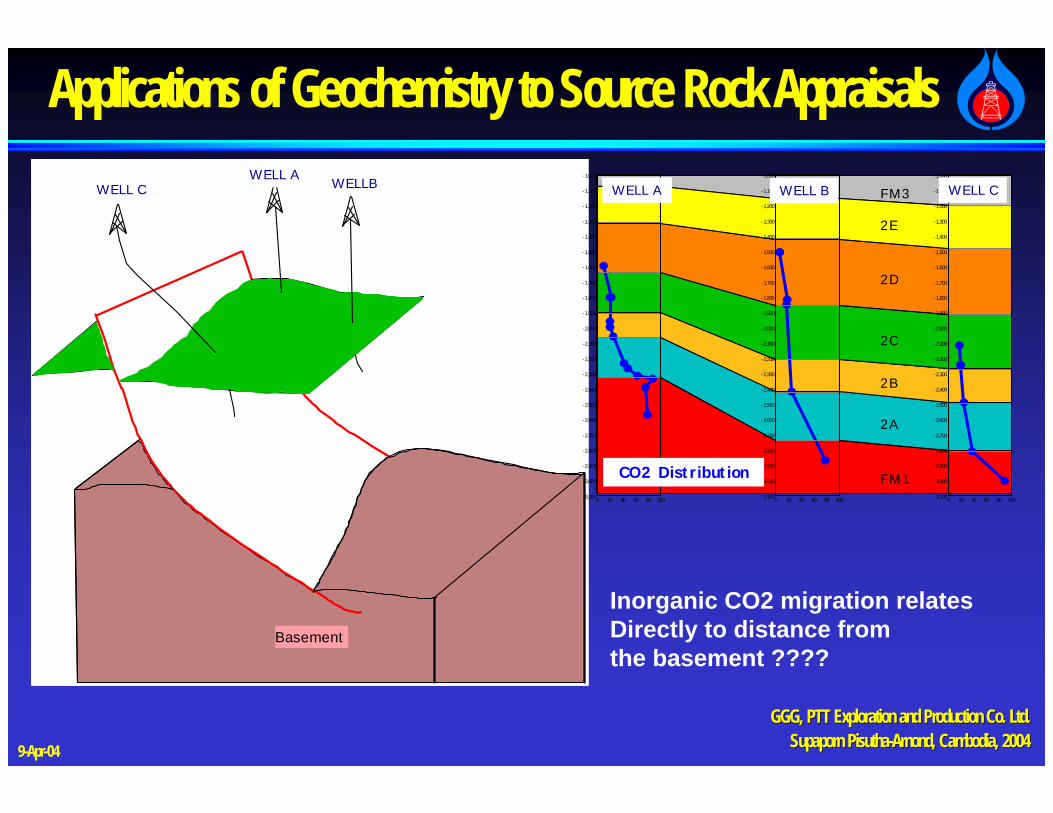
FM3
2E
2D
2C
FM1
2A
2B
CO2 Distribution
WELL A WELL B WELL C
Inorganic CO2 migration relates Directly to distance from the basement ????
WELL CWELL A WELLB
GGG, PTT Exploration and Production Co. Ltd.GGG, PTT Exploration and Production Co. Ltd.Supaporn Supaporn PisuthaPisutha--ArnondArnond, Cambodia, 2004, Cambodia, 20049-Apr-04
Applications of Geochemistry to Source Rock Appraisals
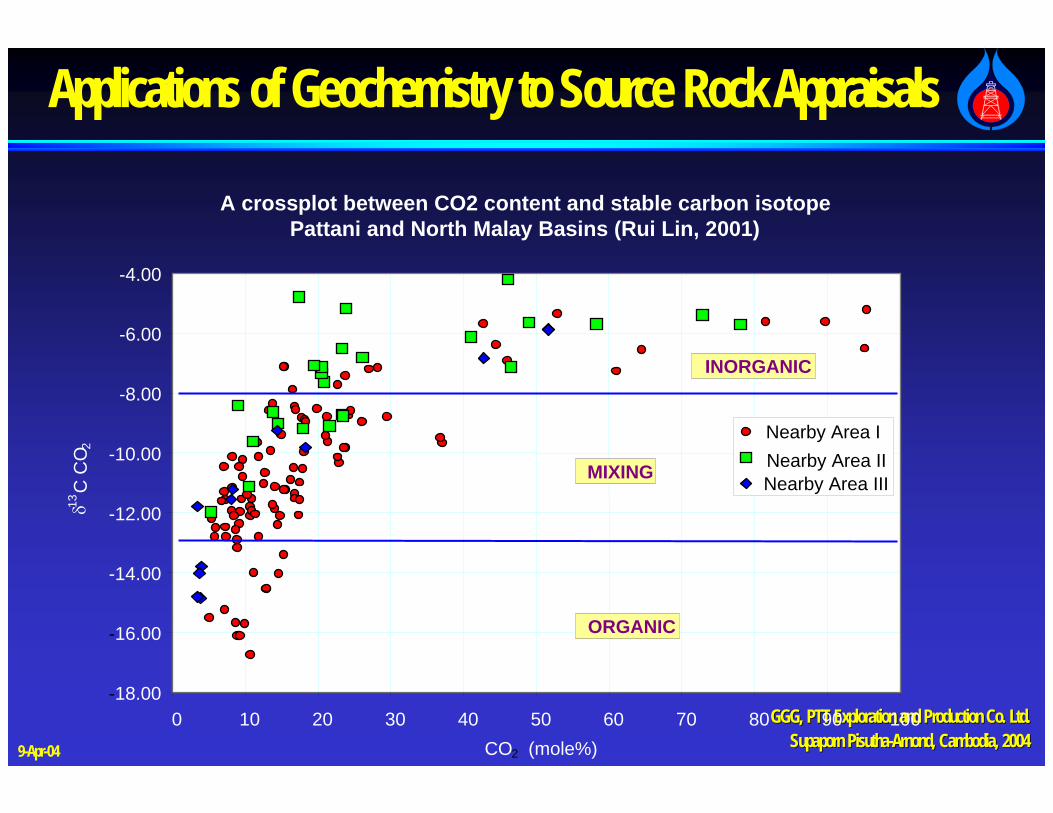
A crossplot between CO2 content and stable carbon isotopePattani and North Malay Basins (Rui Lin, 2001)
-18.00
-16.00
-14.00
-12.00
-10.00
-8.00
-6.00
-4.00
0 10 20 30 40 50 60 70 80 90 100CO2 (mole%)
δ13C
CO 2
Nearby Area INearby Area IINearby Area III
INORGANIC
MIXING
ORGANIC
GGG, PTT Exploration and Production Co. Ltd.GGG, PTT Exploration and Production Co. Ltd.Supaporn Supaporn PisuthaPisutha--ArnondArnond, Cambodia, 2004, Cambodia, 20049-Apr-04
Applications of Geochemistry to Source Rock Appraisals
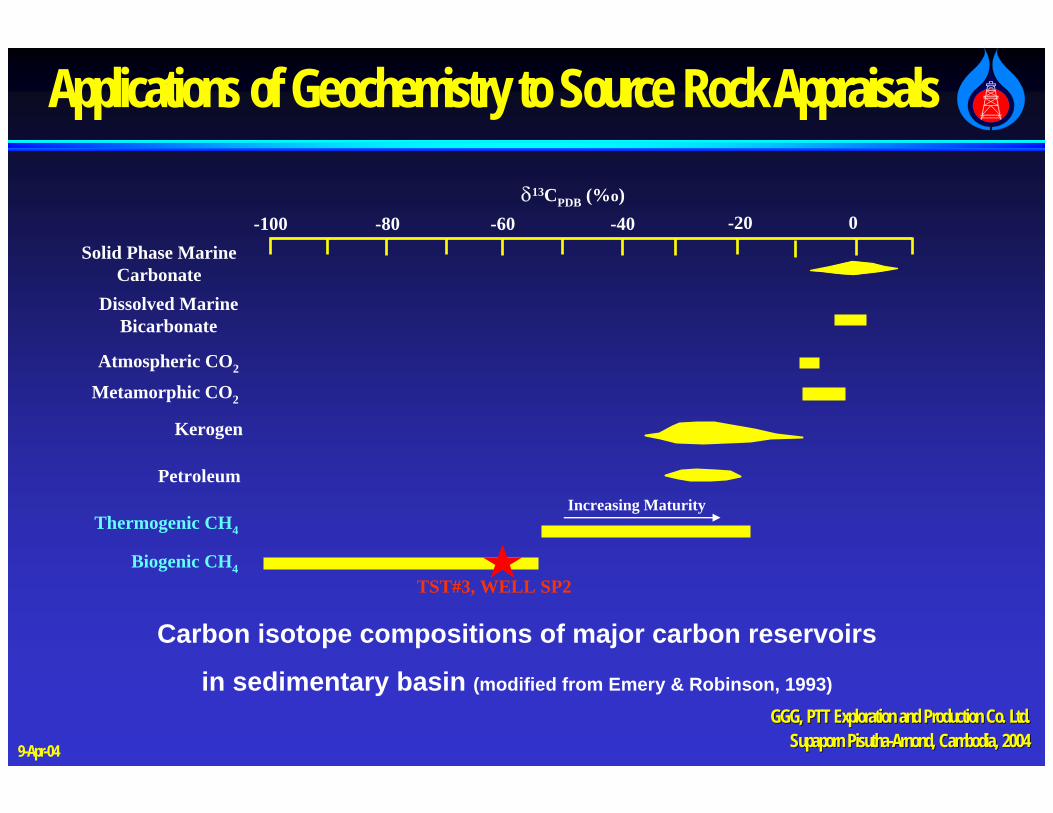
-100 -80 -60 -40 -20 0Solid Phase Marine
CarbonateDissolved Marine
Bicarbonate
Atmospheric CO2
Metamorphic CO2
Kerogen
Petroleum
Thermogenic CH4
Biogenic CH4
Increasing Maturity
δ13CPDB (%o)
TST#3, WELL SP2
Carbon isotope compositions of major carbon reservoirs
in sedimentary basin (modified from Emery & Robinson, 1993)
GGG, PTT Exploration and Production Co. Ltd.GGG, PTT Exploration and Production Co. Ltd.Supaporn Supaporn PisuthaPisutha--ArnondArnond, Cambodia, 2004, Cambodia, 20049-Apr-04
Applications of Geochemistry to Source Rock Appraisals
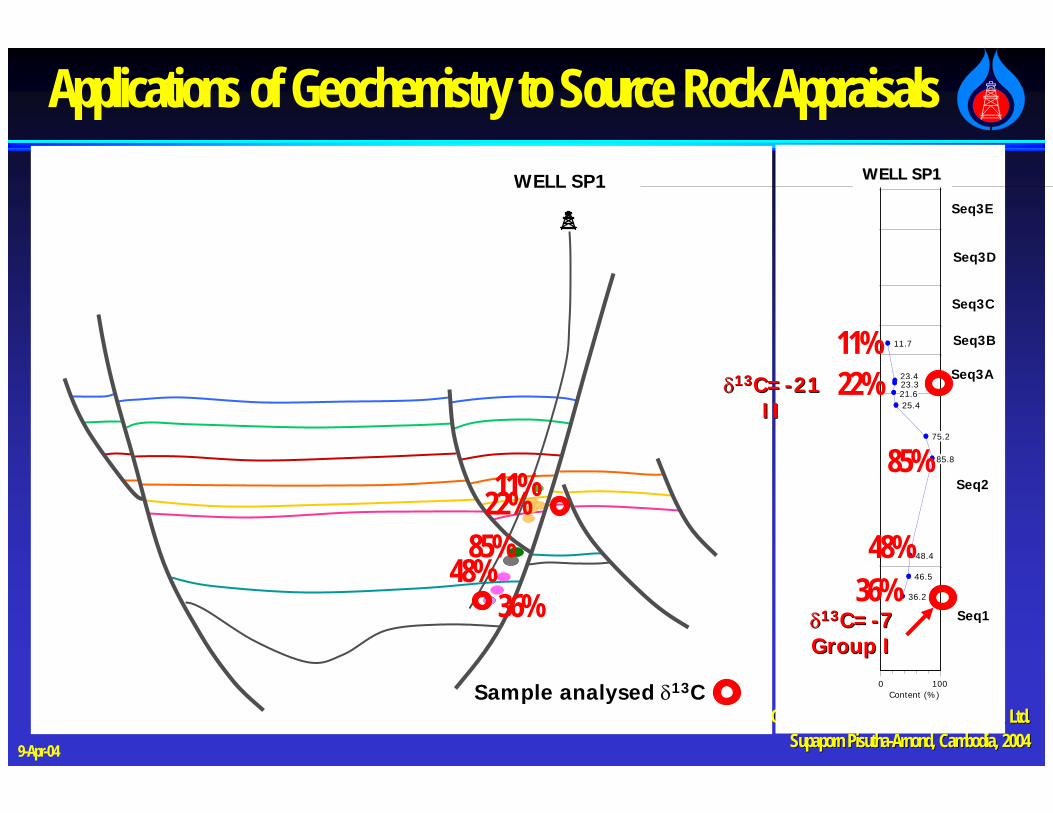
Three Possible CO2 ModelsThree Possible CO2 ModelsWELL SP1WELL SP1
36%
11%
85%22%
48%Seq 1
Seq 2
Seq 4 11.7
23.423.321.625.4
75.
8
48.4
46.5
36.2
11.7
23.423.321.625.4
75.2
85.8
48.4
46.5
36.2
0 100Content (%)
Arthit Arthit 1515--33XX
11.7
23.423.321.625.4
75.
8
48.4
46.5
36.2
11.7
23.423.321.625.4
75.2
85.8
48.4
46.5
36.2
0 100Content (%)
Arthit Arthit 1515--33XX
Seq3E
Seq3D
Seq3C
Seq3B
Seq3A
Seq2
Seq136%48%
85%
22%11%
δδ1313C=C=--77Group IGroup I
δδ1313C=C=--2121IIII
Sample analysed δ13C
WELL SP1WELL SP1
GGG, PTT Exploration and Production Co. Ltd.GGG, PTT Exploration and Production Co. Ltd.Supaporn Supaporn PisuthaPisutha--ArnondArnond, Cambodia, 2004, Cambodia, 20049-Apr-04
Applications of Geochemistry to Source Rock Appraisals
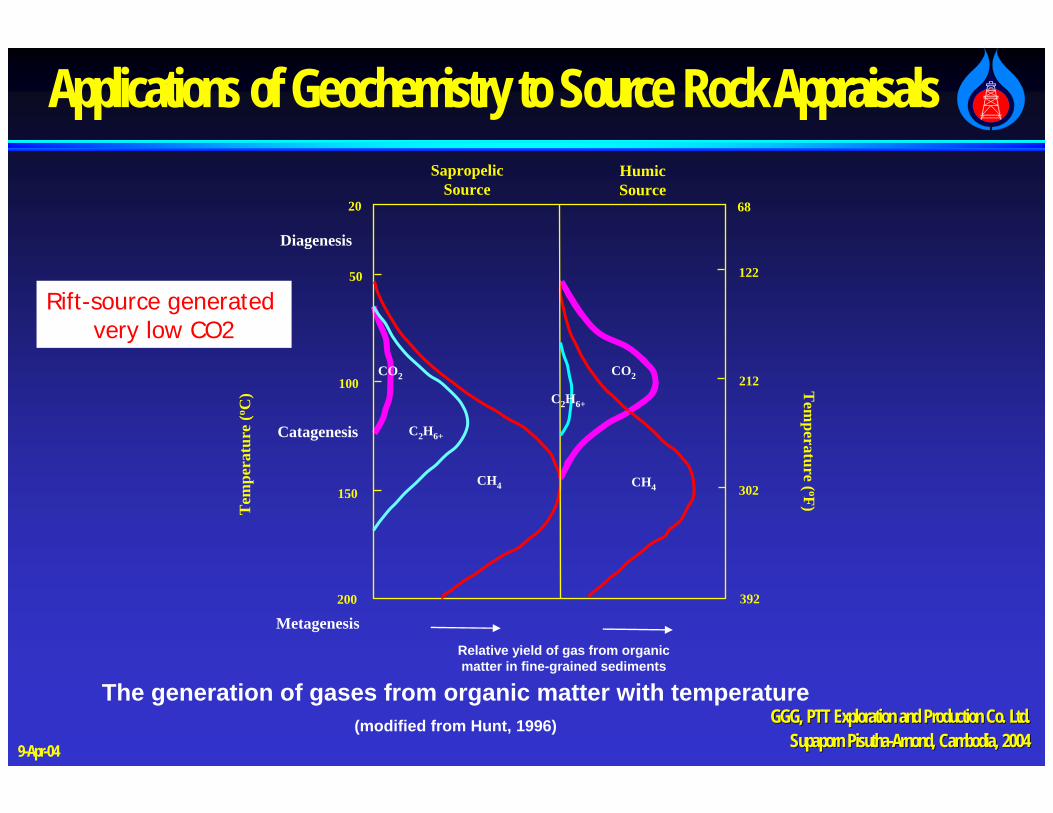
The generation of gases from organic matter with temperature(modified from Hunt, 1996)
Rift-source generated very low CO2
SapropelicSource
HumicSource
CO2 CO2
CH4 CH4
20
50
100
150
200
68
122
212
302
392
Tem
pera
ture
(o C) T
emperature ( oF)
Diagenesis
Catagenesis
Metagenesis
Relative yield of gas from organic matter in fine-grained sediments
C2H6+
C2H6+
GGG, PTT Exploration and Production Co. Ltd.GGG, PTT Exploration and Production Co. Ltd.Supaporn Supaporn PisuthaPisutha--ArnondArnond, Cambodia, 2004, Cambodia, 20049-Apr-04
Applications of Geochemistry to Source Rock Appraisals
HYDROCARBON FLUIDS
GAS
OIL/CONDENSATE
GGG, PTT Exploration and Production Co. Ltd.GGG, PTT Exploration and Production Co. Ltd.Supaporn Supaporn PisuthaPisutha--ArnondArnond, Cambodia, 2004, Cambodia, 20049-Apr-04
Applications of Geochemistry to Source Rock Appraisals
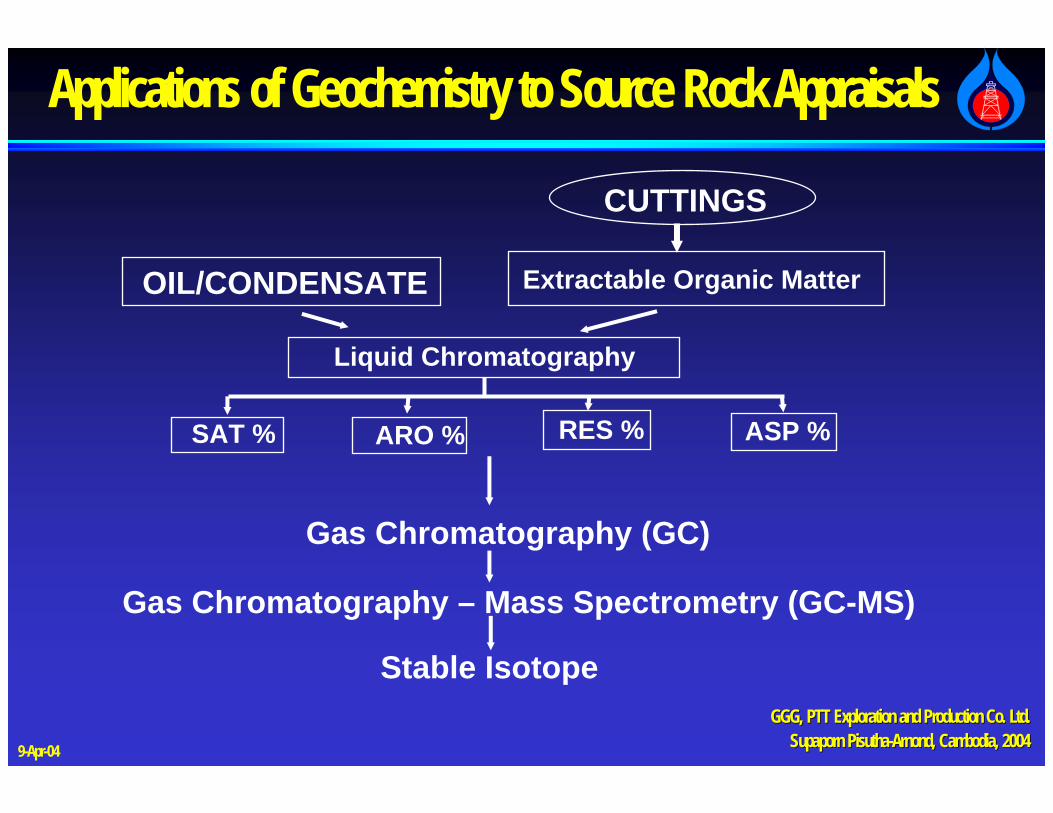
OIL/CONDENSATE
CUTTINGS
Extractable Organic Matter
Liquid Chromatography
SAT % ARO % RES % ASP %
Gas Chromatography (GC)
Gas Chromatography – Mass Spectrometry (GC-MS)
Stable Isotope
GGG, PTT Exploration and Production Co. Ltd.GGG, PTT Exploration and Production Co. Ltd.Supaporn Supaporn PisuthaPisutha--ArnondArnond, Cambodia, 2004, Cambodia, 20049-Apr-04
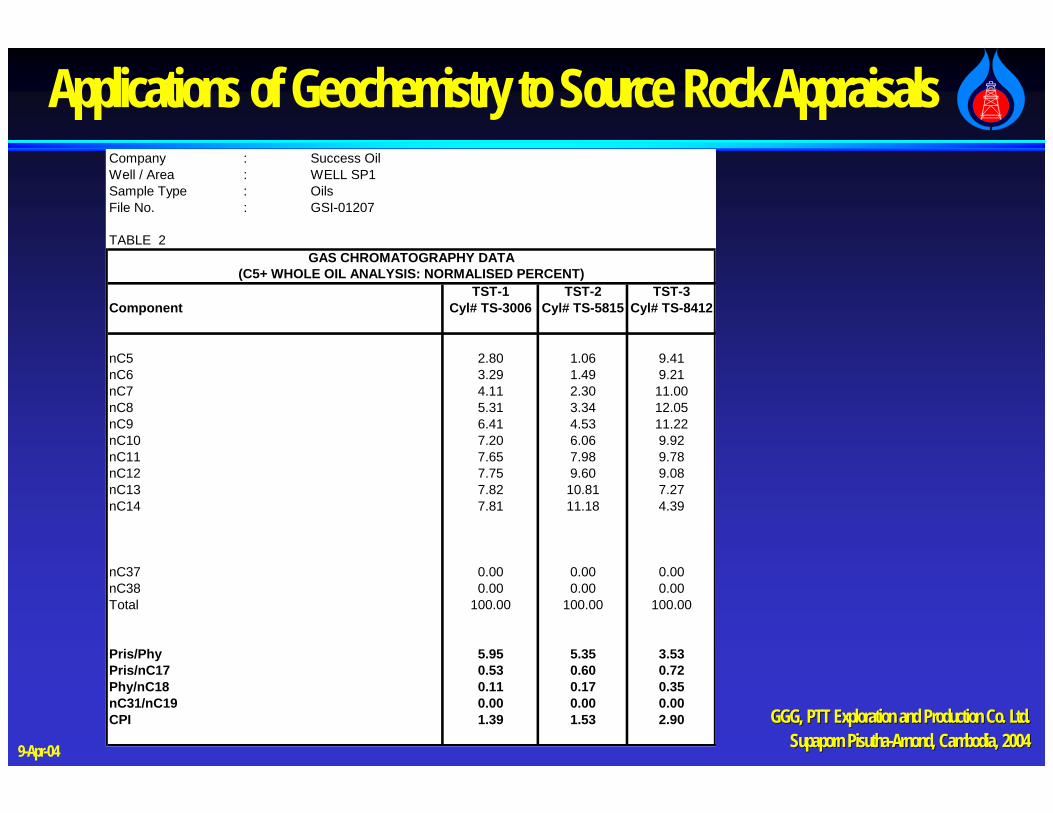
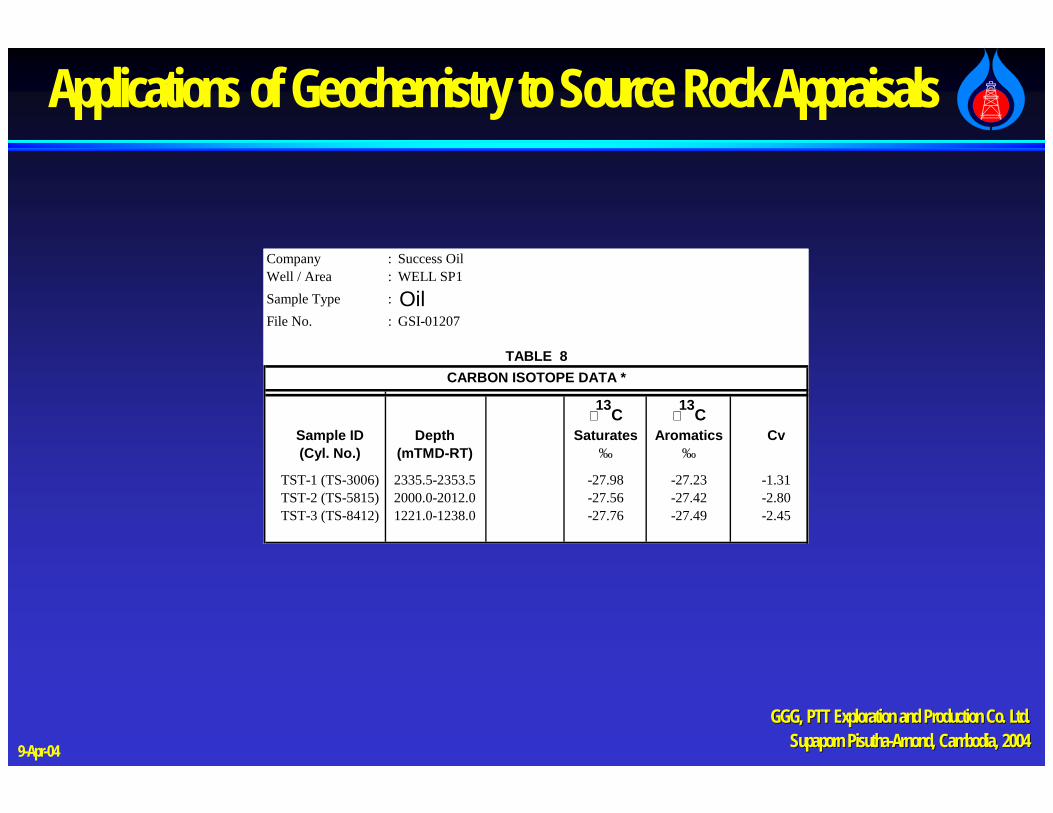
Applications of Geochemistry to Source Rock AppraisalsCompany : Success OilWell / Area : WELL SP1Sample Type : OilsFile No. : GSI-01207
GAS CHROMATOGRAPHY DATA(C5+ WHOLE OIL ANALYSIS: NORMALISED PERCENT)
GGG, PTT Exploration and Production Co. Ltd.GGG, PTT Exploration and Production Co. Ltd.Supaporn Supaporn PisuthaPisutha--ArnondArnond, Cambodia, 2004, Cambodia, 20049-Apr-04
Applications of Geochemistry to Source Rock Appraisals
10000
15000
20000
25000
30000
5 10 15 20 25 30 35 40
Arbitrary Y / Arbitrary X Paged Y-Zoom CURSORFile # 5 = TST4 Res=None
nC15
nC10
nC20
Arthit-15-1XDepth (m) : 2,338Test #4
nC25
nC30
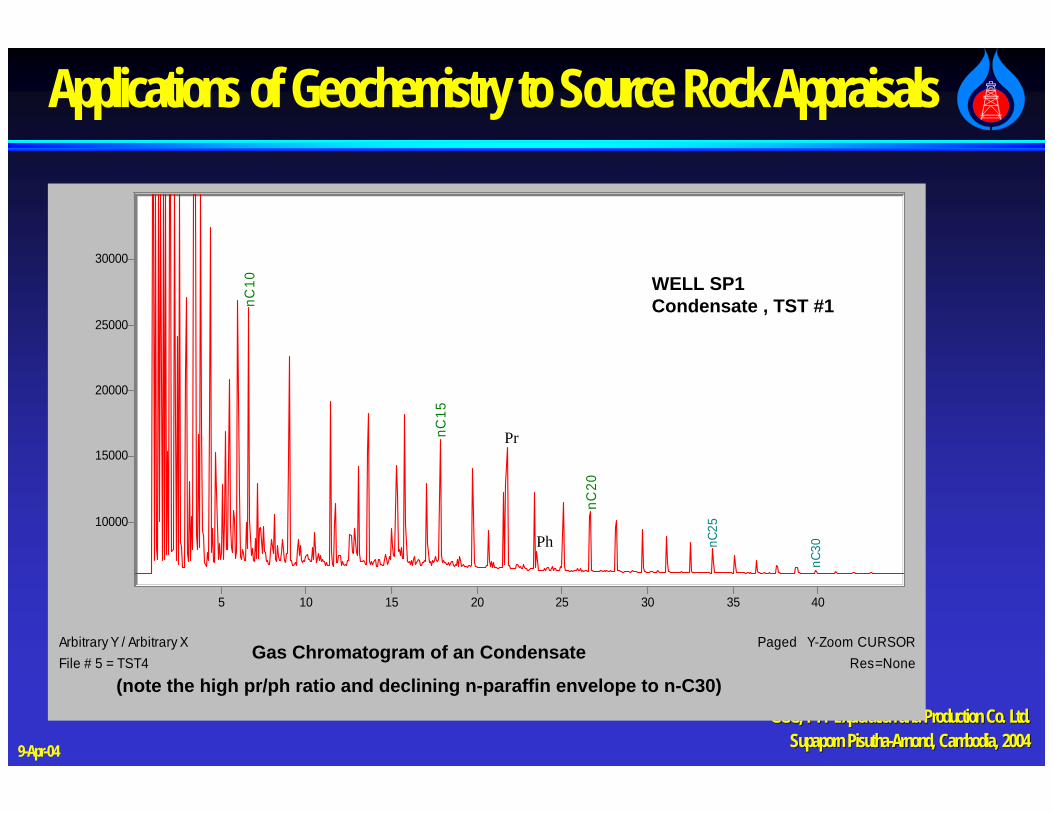
Gas Chromatogram of an Condensate
(note the high pr/ph ratio and declining n-paraffin envelope to n-C30)
Pr
Ph
WELL SP1Condensate , TST #1
GGG, PTT Exploration and Production Co. Ltd.GGG, PTT Exploration and Production Co. Ltd.Supaporn Supaporn PisuthaPisutha--ArnondArnond, Cambodia, 2004, Cambodia, 20049-Apr-04
Applications of Geochemistry to Source Rock Appraisals
Company : Success OilWell / Area : WELL SP1Sample Type : OilFile No. : GSI-01207
GGG, PTT Exploration and Production Co. Ltd.GGG, PTT Exploration and Production Co. Ltd.Supaporn Supaporn PisuthaPisutha--ArnondArnond, Cambodia, 2004, Cambodia, 20049-Apr-04
Applications of Geochemistry to Source Rock Appraisals
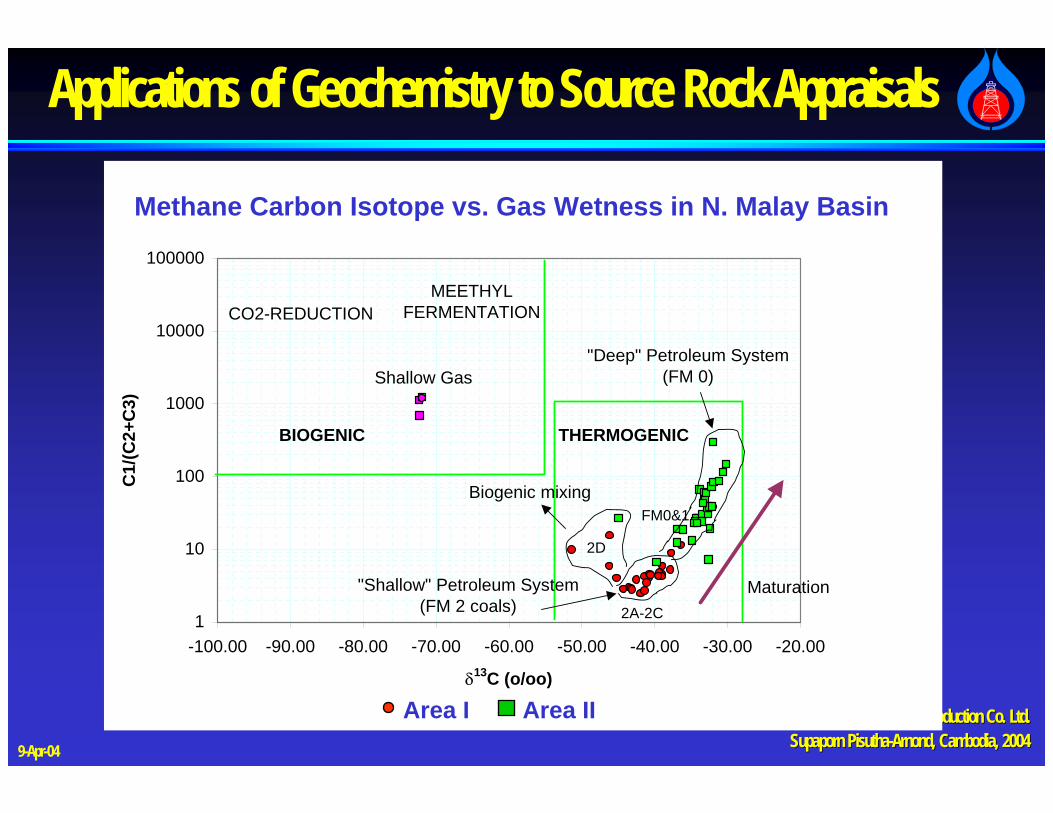
Methane Carbon Isotope vs. Gas Wetnessin the North Malay Basin (Arthit and Nearby Area)
Methane Carbon Isotope vs. Gas Wetness in N. Malay Basin
Area I Area II
GGG, PTT Exploration and Production Co. Ltd.GGG, PTT Exploration and Production Co. Ltd.Supaporn Supaporn PisuthaPisutha--ArnondArnond, Cambodia, 2004, Cambodia, 20049-Apr-04
Applications of Geochemistry to Source Rock Appraisals
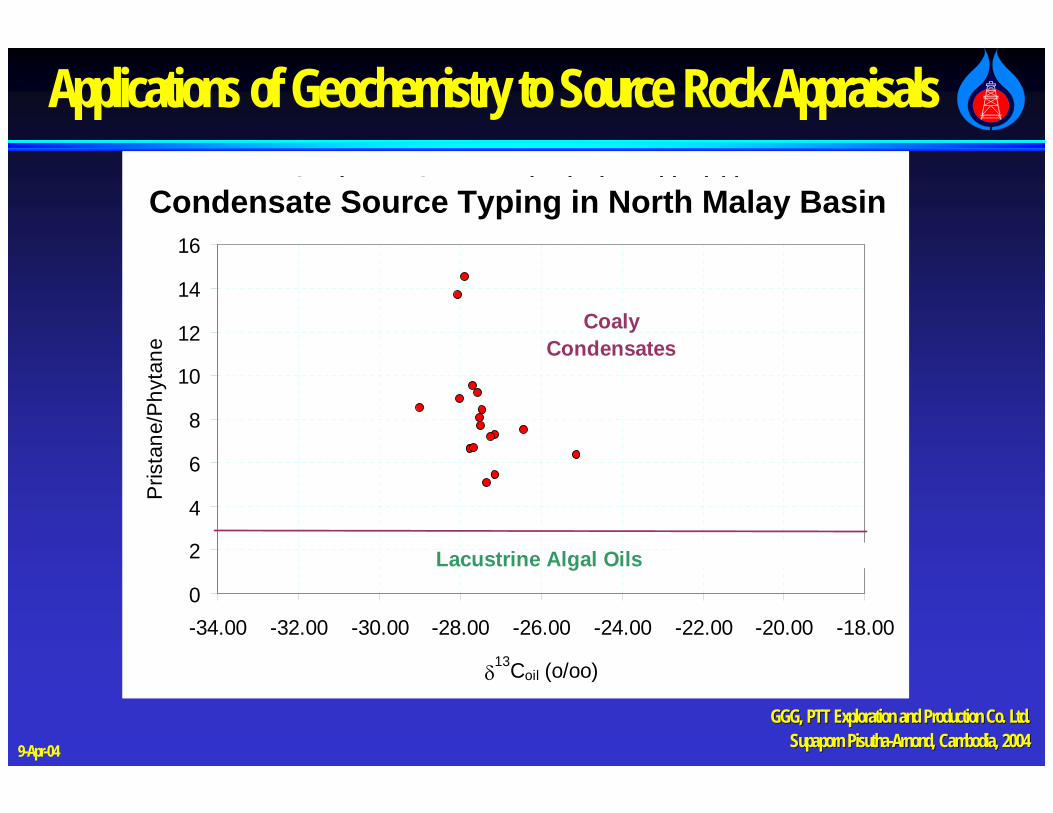
Condensate Source Typing in the Arthit FieldNorth Malay Basin
GGG, PTT Exploration and Production Co. Ltd.GGG, PTT Exploration and Production Co. Ltd.Supaporn Supaporn PisuthaPisutha--ArnondArnond, Cambodia, 2004, Cambodia, 20049-Apr-04
Applications of Geochemistry to Source Rock Appraisals
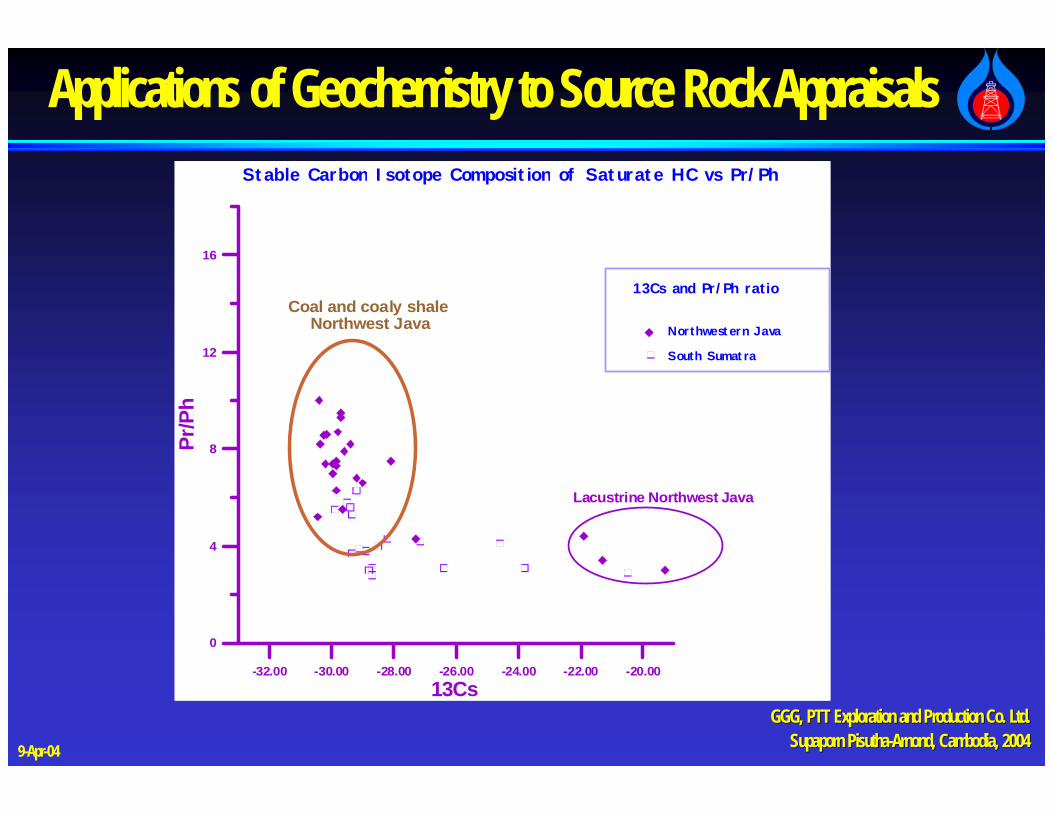
Stable Carbon Isotope Composition of Saturate HC vs Pr/Ph
Coal and coaly shale Northwest Java
Lacustrine Northwest Java
GGG, PTT Exploration and Production Co. Ltd.GGG, PTT Exploration and Production Co. Ltd.Supaporn Supaporn PisuthaPisutha--ArnondArnond, Cambodia, 2004, Cambodia, 20049-Apr-04
Applications of Geochemistry to Source Rock Appraisals
Geochemical Correlation
Exploration no guessing
GGG, PTT Exploration and Production Co. Ltd.GGG, PTT Exploration and Production Co. Ltd.Supaporn Supaporn PisuthaPisutha--ArnondArnond, Cambodia, 2004, Cambodia, 20049-Apr-04
Applications of Geochemistry to Source Rock Appraisals