213
e Asian Development Fund Operations A Decade of Supporting Poverty Reduction in the Asia and Pacific Region Evaluation Independent
| Date post: | 22-Mar-2016 |
| Category: |
Documents |
| Upload: | independent-evaluation-at-asian-development-bank |
| View: | 218 times |
| Download: | 1 times |

The Asian Development Fund Operations
A Decade of Supporting Poverty Reduction in the Asia and Pacific Region
EvaluationIndependent


iEvaluationIndependent
The Asian Development Fund Operations
A Decade of Supporting Poverty Reduction in the Asia and Pacific Region
© 2012 Asian Development Bank
All rights reserved. Published in 2012.Printed in the Philippines
ISBN 978-92-9092-664-1 (Print), 978-92-9092-665-8 (PDF)Publication Stock No. RPT124483
Cataloging-In-Publication Data
Asian Development Bank
W�������������� ���������� �������5������������� ������ �������������������������������������������&�;����������City, Philippines: Asian Development Bank, 2012.
$&������������ ���������&���&����������������&�9&����������������&�'&������������ �����,��*&
W������3���Z ��������������� �.����������������������������������������������������[�����������3������ ������������������Development Bank (ADB), its Board of Governors, or the governments they represent.
ADB does not guarantee the accuracy of the data included in this publication and accepts no responsibility for any consequence of their use.
By making any designation of or reference to a particular territory or geographic area, or by using the term “country” in this document, ADB does not intend to make any judgments as to the legal or other status of any territory or area.
ADB encourages printing or copying information exclusively for personal and noncommercial use with proper acknowledgment of ADB. Users are restricted from reselling, redistributing, or creating derivative works for commercial purposes without the express, written consent of ADB.
Note:In this report, “$” refers to US dollars.
Asian Development Bank<���,�������+�;����������?���$::!�;����;�����+������ ����Tel +63 2 632 4444Fax +63 2 636 2444www.adb.org
For orders, please contact:Department of External RelationsFax +63 2 636 [email protected]
iii
Contents
LIST OF TABLES AND FIGURES . . . . . . . . . . . . . . . . . . . . . . . . . . . . . . . . . . . . . . . . . . . . . . . . . . . . . . ivABBREVIATIONS . . . . . . . . . . . . . . . . . . . . . . . . . . . . . . . . . . . . . . . . . . . . . . . . . . . . . . . . . . . . . . . . . vACKNOWLEDGMENTS . . . . . . . . . . . . . . . . . . . . . . . . . . . . . . . . . . . . . . . . . . . . . . . . . . . . . . . . . . . . . vi FOREWORD . . . . . . . . . . . . . . . . . . . . . . . . . . . . . . . . . . . . . . . . . . . . . . . . . . . . . . . . . . . . . . . . . . . . .viiEXECUTIVE SUMMARY . . . . . . . . . . . . . . . . . . . . . . . . . . . . . . . . . . . . . . . . . . . . . . . . . . . . . . . . . . . . ixMANAGEMENT RESPONSE . . . . . . . . . . . . . . . . . . . . . . . . . . . . . . . . . . . . . . . . . . . . . . . . . . . . . . . xviiCHAIR’S SUMMARY: DEVELOPMENT EFFECTIVENESS COMMITTEE . . . . . . . . . . . . . . . . . . . . . . . . xxvI. INTRODUCTION . . . . . . . . . . . . . . . . . . . . . . . . . . . . . . . . . . . . . . . . . . . . . . . . . . . . . . . . . . . . 1 The Asian Development Fund . . . . . . . . . . . . . . . . . . . . . . . . . . . . . . . . . . . . . . . . . . . . . . . . . . 1 Previous Evaluations of ADF Operations . . . . . . . . . . . . . . . . . . . . . . . . . . . . . . . . . . . . . . . . . . 1 Purpose and Scope . . . . . . . . . . . . . . . . . . . . . . . . . . . . . . . . . . . . . . . . . . . . . . . . . . . . . . . . . 3� � ;������� . . . . . . . . . . . . . . . . . . . . . . . . . . . . . . . . . . . . . . . . . . . . . . . . . . . . . . . . . . . . . . 4II. FINANCING ADF OPERATIONS (2001–2010) . . . . . . . . . . . . . . . . . . . . . . . . . . . . . . . . . . . . . 5 Introduction . . . . . . . . . . . . . . . . . . . . . . . . . . . . . . . . . . . . . . . . . . . . . . . . . . . . . . . . . . . . . . . 5 Overall Availability of ADF Resources . . . . . . . . . . . . . . . . . . . . . . . . . . . . . . . . . . . . . . . . . . . . 6 Allocation of ADF Resources by Region and Country . . . . . . . . . . . . . . . . . . . . . . . . . . . . . . . . 7 Allocation of ADF Resources by Sector and Theme. . . . . . . . . . . . . . . . . . . . . . . . . . . . . . . . . . 9 Other ADF Resource Allocation Patterns . . . . . . . . . . . . . . . . . . . . . . . . . . . . . . . . . . . . . . . . . 11III. PERFORMANCE OF ADF OPERATIONS . . . . . . . . . . . . . . . . . . . . . . . . . . . . . . . . . . . . . . . . . 17 Overall Success Rates for Country and Sector Strategies and Programs, and Projects . . . . . . 17� � �������������������������������+����������+�{�������+�{����������+� Sustainability, and Development Impact of ADF Support . . . . . . . . . . . . . . . . . . . . . . . . . . . . 24IV. PROGRESS IN AREAS RELEVANT TO ADF OPERATIONS . . . . . . . . . . . . . . . . . . . . . . . . . . . 39� � ��������������������;��������������� �����|��� . . . . . . . . . . . . . . . . . . . . . . . . . . . . . 39 Good Governance . . . . . . . . . . . . . . . . . . . . . . . . . . . . . . . . . . . . . . . . . . . . . . . . . . . . . . . . . 42� � |������;������������������,�} ������� . . . . . . . . . . . . . . . . . . . . . . . . . . . . . . . . . . . . . . 45 Private Sector Development . . . . . . . . . . . . . . . . . . . . . . . . . . . . . . . . . . . . . . . . . . . . . . . . . . 47 Regional Cooperation and Integration . . . . . . . . . . . . . . . . . . . . . . . . . . . . . . . . . . . . . . . . . . 48 Environmental Sustainability . . . . . . . . . . . . . . . . . . . . . . . . . . . . . . . . . . . . . . . . . . . . . . . . . 50 Sector Selectivity and Concentration . . . . . . . . . . . . . . . . . . . . . . . . . . . . . . . . . . . . . . . . . . . 53 Partnerships, Aid Coordination, and Harmonization . . . . . . . . . . . . . . . . . . . . . . . . . . . . . . . 55 Performance-Based Allocation of ADF Resources . . . . . . . . . . . . . . . . . . . . . . . . . . . . . . . . . . 58� � ������������?�[���4���������������� . . . . . . . . . . . . . . . . . . . . . . . . . . . . . . . . . . . . . . . . . 60 Technical Assistance Performance . . . . . . . . . . . . . . . . . . . . . . . . . . . . . . . . . . . . . . . . . . . . . 61 Progress in Implementing Recommendations of the 2007 SES on ADF VIII–IX Operations . . 62V. DMC STAKEHOLDER CONSULTATION WORKSHOP . . . . . . . . . . . . . . . . . . . . . . . . . . . . . . . 65 Usefulness . . . . . . . . . . . . . . . . . . . . . . . . . . . . . . . . . . . . . . . . . . . . . . . . . . . . . . . . . . . . . . . 65 Relevance . . . . . . . . . . . . . . . . . . . . . . . . . . . . . . . . . . . . . . . . . . . . . . . . . . . . . . . . . . . . . . . . 65 Overall Effectiveness of ADF Operations . . . . . . . . . . . . . . . . . . . . . . . . . . . . . . . . . . . . . . . . . 66 Other Suggested Areas for Improvement . . . . . . . . . . . . . . . . . . . . . . . . . . . . . . . . . . . . . . . 67VI. KEY FINDINGS, ISSUES, AND RECOMMENDATIONS . . . . . . . . . . . . . . . . . . . . . . . . . . . . . . 69 Key Findings . . . . . . . . . . . . . . . . . . . . . . . . . . . . . . . . . . . . . . . . . . . . . . . . . . . . . . . . . . . . . . 69 Issues . . . . . . . . . . . . . . . . . . . . . . . . . . . . . . . . . . . . . . . . . . . . . . . . . . . . . . . . . . . . . . . . . . . 75 Recommendations: Looking Forward . . . . . . . . . . . . . . . . . . . . . . . . . . . . . . . . . . . . . . . . . . . 78APPENDIXES . . . . . . . . . . . . . . . . . . . . . . . . . . . . . . . . . . . . . . . . . . . . . . . . . . . . . . . . . . . . . . . . . . . 80

iv
List of Tables and Figures
Tables
1 Regional Distribution of ADF Approvals, 2001–2010 . . . . . . . . . . . . . . . . . . . . . . . . . . . . . . . . 7 2 Top Recipients of ADF Resources, by ADF Cycle, 2001–2010 . . . . . . . . . . . . . . . . . . . . . . . . . . 8 3 Population and Per Capita ADF Approval, by developing member country . . . . . . . . . . . . . . . 8 4 Amount of ADF Loan and Grant Approvals, by Sector . . . . . . . . . . . . . . . . . . . . . . . . . . . . . . . 9 5 Thematic Distribution of ADF Operations . . . . . . . . . . . . . . . . . . . . . . . . . . . . . . . . . . . . . . . . 11 6 ADB Financing of Projects in Blend Countries, by Sector . . . . . . . . . . . . . . . . . . . . . . . . . . . . 11 7 Trend in Targeted Interventions in ADF Operations, by Country Group . . . . . . . . . . . . . . . . . 12� 6� ������.����������|�����+�.��?������?����������� . . . . . . . . . . . . . . . . . . . . . . . . . . . . . . 13 9 ADF Grant Approvals, by Sector and Replenishment . . . . . . . . . . . . . . . . . . . . . . . . . . . . . . . 14� $!� ����������;������+�.�������� ���������������� . . . . . . . . . . . . . . . . . . . . . . . . . . . . . . . . . 14 11 Approved Technical Assistance from All Sources for ADF Operations . . . . . . . . . . . . . . . . . . . 15 12 Country Assistance Program Evaluation Report Ratings for ADF Countries . . . . . . . . . . . . . . 18 13 ADF Project Success Ratings, by Country . . . . . . . . . . . . . . . . . . . . . . . . . . . . . . . . . . . . . . . . 20 14 Comparison of Assessments of Case Study Projects, by 2007 and 2011 Special Evaluation Studies . . . . . . . . . . . . . . . . . . . . . . . . . . . . . . . . . . . . . . . . . . . . . . . . . . . 22 15 ADF Project Success Ratings, by Sector . . . . . . . . . . . . . . . . . . . . . . . . . . . . . . . . . . . . . . . . . 23 16 CAPE Component Ratings, by Type of ADF Country . . . . . . . . . . . . . . . . . . . . . . . . . . . . . . . . 24 17 Project Component Ratings, by Type of ADF Country . . . . . . . . . . . . . . . . . . . . . . . . . . . . . . . 24 18 Indicative and Actual Allocation of ADF Resources . . . . . . . . . . . . . . . . . . . . . . . . . . . . . . . . . 53
Figures
1 ADF Resource and Net Resource Flows (ADF IV–ADF X) . . . . . . . . . . . . . . . . . . . . . . . . . . . . . . 6 2 Success Rates of ADF Operations . . . . . . . . . . . . . . . . . . . . . . . . . . . . . . . . . . . . . . . . . . . . . . 19
v
Abbreviations
ADB – Asian Development BankADF – Asian Development FundANR – agriculture and natural resourcesCAPE – country assistance program evaluationCPR – country portfolio review CPS – country partnership strategyDFID – Department for International Development�;? – developing member countryEIRR – economic internal rate of returnFCAS – �������������[���4���������������GACAP – Governance and Anticorruption Action PlanGAD – gender and developmentGHG – greenhouse gas|;� – |�������;�*�����.�����HSP – health and social protectionICT – information and communication technologyIDA – International Development AssociationIED – Independent Evaluation DepartmentLao PDR – Lao People’s Democratic Republic;�| – ;��������������� �����|��;�� – ;��������������� ������������NGO – nongovernment organization}�; – operation and maintenanceOCR – ordinary capital resourcesOECD – Organisation for Economic Co-operation and DevelopmentPBA – performance-based allocationPCR – project completion reportPPP – public–private partnershipPSD – private sector developmentPSDS – Private Sector Development Strategy��; – public sector managementPVR – project/program completion report validation reportRCI – regional cooperation and integrationRSDD – Regional and Sustainable Development DepartmentSDR – special drawing rightsSES – special evaluation study�;{� – small and medium-sized enterprisesSPD – Strategy and Policy DepartmentSWAp – sector-wide approachTA – technical assistanceTASF – Technical Assistance Special Fund�;'� – water and other municipal infrastructure and servicesWSS – water supply and sanitation

vi
Acknowledgments
This report was prepared by a team led by Ganesh Rauniyar. Team members included Henrike Feig, Kenneth Francis Watson and Brahm ���*���������������%+����������.+���������;��+����������.����+�����Christine Infantado.
Begum Shamsun Nahar, Phanmany Khamphilavong, Champak Pokharel, Zafar Ahmed, and Viet Cuong Nguyen (consultants) contributed to the assssment of the case study projects in Bangladesh, the Lao People’s Democratic Republic, Nepal, Pakistan, and Viet Nam, respectively.
Rafaelita Jamon, Rashel Pardo-Dimaano, and Ronald Cartagena �����������%��������;�����+�,��.�����������+���������|������������the team with selected portfolio data analysis and background research. Tulasidhar Vankina, Njoman Bestari, and Hemamala Hettige were peer reviewers.
W��� �� ��� ���� .�������� ��� �� ����������� 3�*�� � ����� ���,���**+� W�������� 3���� ������ ������� ��� ����� ���� ���.���countries. Nils Fostvedt (consultant) provided additional suggestions. The earlier versions of the draft reports were reviewed by all relevant �� ��������������������������������� �����,��*&���� ����,�����and Gloria Argosino edited the report.
The evaluation was prepared under the overall guidance and supervision of H. Satish Rao (former Director General, IED); Ramesh ����*���� ������ �������+� �������� $+� '{�%�� �����*�� ����� �}����4��4?�����+� ��������$+� '{�%�� ���� ��������� �������� �}����4��4?�����+�IED). It was approved by Vinod Thomas (Director General, IED).

vii
Foreword
Faced with growing development challenges—especially external economic shocks, climate change, and natural disasters—several ����� ��������������������������������������������*������������������4������ ;���������� ����� ����� |��� �������� .�� �!$:&� W�����is therefore a need for stronger action as well as for more resources from the Asian Development Bank’s (ADB) Asian Development Fund (ADF), especially for the poorer countries. The ADF offers loans at very low interest rates and grants to help reduce poverty in ADB’s poorest member countries.
W����������������������������������������������������������������share of countries’ investment expenditures, it has likely contributed to economic growth by helping them improve connectivity through transport investments; increase the level and reliability of power supplies; develop legal, regulatory, and institutional frameworks for ���������������������������������������������� �������&�W��������*�record is encouraging. On a smaller scale, the ADF has also supported efforts to improve access to resources for smaller enterprises and for better social infrastructure.
,�����������������������������������������������������������������stronger effort to encourage inclusive and sustainable development and strengthen the capacity of client institutions. Investments need to be better geared towards enhancing the access of smaller enterprises to investments; improving urban, social, and environmental services; ����������������������������������������������������.�������������participation.
Furthermore, to get stronger results from ADF projects, it is vital to pay close attention to ways in which these projects can complement other efforts within and across sectors. In that context, coordination of cross-sectoral efforts with other development partners might be the preferred approach, rather than seeking complex, multi-sectoral projects run by a single institution. ADB also needs to monitor ADF operations better to improve performance and give more attention to outcomes, and their documentation. This will also facilitate future evaluations of ADF support.
Vinod ThomasDirector General
Independent Evaluation Department


ix
Executive Summary
Development Context
The past decade was marked by strong economic growth and a reduction in income poverty in the developing world, particularly in �������������������&��3����+�3����������� ���������������������down substantially, population growth has meant that the absolute numbers of poor have declined far less. In some countries eligible for Asian Development Fund (ADF) support (i.e., Lao People’s Democratic Republic, Nepal, Papua New Guinea, and Timor-Leste), the numbers of �Z�����������������.��� ����������������.��������������&�;��������300 million people in ADF countries still live on less than $2 a day.
;�����+� ������ ���� .���� ����������� ������� 3���� ������� ������������� �����������4������;��������������� �����|�����;�|�%� �������+� �� �������� ������� ��������� �� �����+� ��������� 3����� ���� ���������� ���� ������ ��������&� ;���3����+� ��3����inequities and environmental degradation present severe challenges to the sustainability of progress. ADF countries and others are facing the �� ���������3���3������������������������������+�3�������������change and related natural disasters threaten lives, livelihoods, and well-being.
The ADF seeks to promote economic and social development ��� ���� ����� ���� ���.��� ��������� ��;?�%� � ���� ������Development Bank (ADB). From 2001–2010 alone, ADB approved $20 billion in ADF loans and grants for 29 countries. The largest recipients were Bangladesh, Viet Nam, Pakistan, Afghanistan, and Nepal, in that order, accounting for 64% of loan and grant approvals, although less ������+��������+���������������������������������������������� ���capita ADF resource allocation regardless of their relative levels of human development. The continuing and tough challenges expected for ADF countries will require additional resources and, equally, their more effective utilization for greater development effectiveness. In these circumstances, ADB’s engagement remains crucial. Pressure on achieving stronger outcomes from any volume of resources is �����������.�� ���� ���������.�������������� ������� ����&� ���stronger results, involvement in ADF countries will need to be two-fold: to help meet the need for resources, and at the same time, help achieve better outcomes from their use.
This special evaluation study (SES) reviews the development effectiveness of ADF operations approved during ADF VIII and ADF IX ��!!$#�!!6%������� ������ ������������������������������ ����������ADF X (2009–2010). It focuses on the development effectiveness of ���4�������� �������&� W��� '��� ������� {��������� �� ���������'{�%� ��� �� ������ �� �� ������ �{�� �� ;�������� �� ����� ������������� �;��%� �������� ��,-�� �������� ���������&� W���� ������ ���3��

x
Executive
Summary������������������������������� ������������������?��{�%�����sector assistance program evaluations in 12 ADF countries, completion reports for projects approved during ADF VIII–X, project case studies ��� ���� ��������+� ���� ���.��*� .������� ��� ������ �;?� �������������� �� ����������� 3�*�� &� '�� ���������� *��� ������� ���� �������������������������������������� ������������;?�&�
Development Effectiveness of ADF Support
Seventeen of the 31 ADF-eligible countries had average annual gross domestic product growth in excess of 5% during the review period, the most notable exceptions among larger countries being Kyrgyz �� �.���+� �� ��+� ���� ��*�����+� ���� ��������� ������� .�� �����������political instability. In the majority of ADF countries, relatively high economic growth rates have also translated into a reduction of income poverty rates, although the impact of economic growth on poverty has been reduced by persisting or increasing inequality between rich and poor, and urban and rural populations. Better development outcomes are closely linked to the pace of growth and, crucially, to improvements in its inclusiveness and its social and environmental sustainability.
{���� ������ �����.����� ��� �������� �� ����.����� ������ ��������� �������� ���� �� ������ ������ � ���� ����� ��������-� �����������expenditures, ADF has likely contributed to economic growth by helping countries (i) improve connectivity through transport investments; (ii) increase power supplies and their reliability; (iii) develop legal, ���������� ���� ������������� ����3�*�� �� ������� ���� ���������and (iv) increase agricultural production. To a far lesser extent, ADF also sought to support efforts to make growth more inclusive and promote social development through measures to enhance access of smaller enterprises to resources and investments in rural and social infrastructure, albeit on a somewhat smaller scale than its support for core infrastructure investments. In a number of ADF countries, this seems to have helped to expand and improve urban and social ��������+� ��������� ������ ������������ ���� �������������� ������+� ����enhance economic participation levels.
Seven out of 12 recent CAPEs assessed the development effectiveness of ADF operations to be satisfactory. While countries affected by political instability had lower performance ratings, this was also linked to several factors, including a lack of sector or geographical focus and an absence of rigorous analysis of development problems, unaddressed government capacity weaknesses—particularly in ��������� �� �������������������������������������������������� �.�����������������������������&�'���������� �������� �����������support and suboptimal use of resident missions also affected performance, as did systemic sustainability problems with physical and social infrastructure. Governance weaknesses and the lack of sustained reform commitment due to government changes also contributed.
An analysis of CAPEs and sector assistance program evaluations shows that physical infrastructure investments (particularly in energy and transport) were relatively effective in achieving envisaged development outputs and outcomes, but not the support related to capacity development and institutional or policy reforms. However, unless issues affecting the utilization and maintenance of assets or

xi
Executive
Summarydemand for services had been effectively addressed, infrastructure �������������������������������������� �������������.������&�
{����������������������������������������������+��������are the results of individual projects and their sustainability important, but vitally, so is their connectivity within and across sectors—with each other and with reforms in policies, administration and governance. ��������� ���������� .������� � ��3� �� �� ����� ������ �����were not fully realized in the absence of efforts to enhance rural income opportunities, and improvements in education and health facilities. Financed irrigation systems did not always translate into land improvements or increases in agricultural productivity in the absence of adequate extension services, marketing support, or value chains. Some rural water supply schemes did not result in expected increases in household connections due to affordability issues and ���*�� � ���������� �������� .������&��������� ������������� ���the education sector substantially delivered most envisaged outputs in terms of classrooms built or upgraded, teachers trained, and institutional measures, in a number of cases, these did not translate into expected school enrollment rates or student performance due to a lack of effective measures to attract and retain teachers, improve the quality of teaching, enable poor children to attend schools, and maintain facilities.
The corporate success rate of ADF projects remains low at 66%. W��������� ��� �������� ��[�������.����*������ �������3������ ��������rate of only 19%. Excluding Pakistan, the rate rises to 80%, an improvement over the success of ADF projects approved before 2001. ADF investment projects have performed somewhat better than ADF ������ ����� �<"�� ��&� <9�%+� 3����� ������� ���� ?��{� �������+�although differences in performance have narrowed.
Pressing Themes
The performance of ADF operations improved with respect to key operational ADF commitments. Aid coordination and harmonization ����� �� �����.��3������,����� ���� �������+�����3�����;?�&���,�has met Paris Declaration targets for alignment, technical assistance �W�%+������ �.�������������������������������+����������� ��������project implementation units, and coordination of missions with other development partners. It has also made progress in meeting its commitments under the Accra Agenda for Action.
W��� � ����� �� ������� ���� ��[���4������� ���������� ��?��%�through the ADF in concert with other development partners has .���� ������� ������������ ��� ����������� ������ ������[�Z�.��� �������a differentiated approach based on country contexts and capacity development support requirements.
�����������������������������;?���������������������&���,�is currently reviewing its governance agenda of the past 15 years to identify key areas for improvement. The performance of public sector ����������� �������+�3��������������������������������������projects with governance objectives, is not satisfactory with a success rate of 54%.

xii
Executive
SummaryADB is on track for meeting ADF targets for gender mainstreaming
and private sector development. A special IED evaluation found that �����������������������3�������������������������� ��������������implementation. Stronger efforts are needed to ensure results through .�������������������������������������������;?��� �����&�W������������� ������������ ����������� ���������� 3���� �������������� �������objectives in infrastructure operation and the need for sector-based gender assessments and strategies. The effectiveness of support for strengthening the enabling environment for private sector operations is being assessed under an ongoing IED study.
Work is ongoing on several environmental initiatives related to ��������������+��������������������������+����������������+���������.���transport, and the nexus between environment and poverty. These have contributed to an increase in the share of projects with environmental sustainability objectives from 8% in ADF VIII to 34% in ADF X. As these initiatives are fairly new, it is too early to assess their results, but in ���3��������3���������������������������+�������������������3����.��vital to the development prospects of the region.
Four major regional cooperation and integration strategies and ������� ����� |������� ;�*��� ��.�������� {������ ? �������Program, the Central Asia Regional Economic Cooperation Program, ���� ����� ����� ��.�������� ? ������� ������+� ���� �������Approach) were initiated. The appearance of regional cooperation and integration as a theme has increased from 7% in ADF VIII to 31% in ADF X. The difference in the outcomes achieved with regional programs in ����|�������;�*�����.�������������������������������������������of regional programs is largely dependent on the level of interest of participating countries and their incentives for cooperation.
New Challenges
�� �����4��������������������������������������������.����������ADB and its development partners, and new challenges have emerged that exert more pressure on ADF’s resources over the coming decade. Examples are lack of food security and soaring food prices; increasing competition for natural resources; the adverse impact of climate change and increased vulnerability to natural disasters; environmental fragility; rapid urbanization and its implications for water, sanitation, and waste management services; and macroeconomic volatility. ADB, together with its development partners, will need to respond with far greater effectiveness to address these challenges.
Importantly, income inequality is increasing in 9 out of 16 ADF countries for which data are available. Also, progress towards ����� ���4�����%� ;�|� �������� ��� �������� ���� ��������� ���� .����inadequate. Comparatively limited ADF support was provided to enhance access to health, education, and water supply and sanitation. While the share of energy and transport sector operations in total ADF approvals almost doubled from 22% during ADF VIII to 40% during ADF X, the share of approvals for education, a core area under Strategy 2020, declined from 15% to 5%. The share of water and sanitation projects, another Strategy 2020 operational priority, increased only marginally from 11% to 12% during the period, as did the share of health and social protection sector approvals (3% to 4%). These

xiii
Executive
Summarytrends, together with low or reduced levels of investment in rural ����������������������������+�����+�3������� ����������������%�����rural environment, suggest that the ADF must contribute more to �������������������4������;�|����������������������3����inequalities.
Financing Needs
The growing vulnerability of ADF countries to external shocks, climate change, and natural disasters signal the need for adequate resources as well as their effective use. In recent replenishment periods, the ������.������ � ���� ��������� ���� ���������� ���� �� ��3���� ��[3�+�which in ADF X has accounted for 59% of ADF resources. The donors’ contributions have increased only marginally in real terms since ADF �'&� '�� � ���� � ���� ��3���� ��[3�+� ���� �������� [3�� ���������positive for most recipient countries throughout the review period, �Z�� ������������;?�����������������&��3����+���������������������ADF grants rather than loans may cause a gradual depletion of ADF’s capital after 2013 in the absence of growing donor contributions. The grant mechanism introduced in 2005 has accounted for a relatively higher share of ADF approvals in ADF X (30%) than in ADF IX (22%).
W��� ��.��� ������� ���� ��������� ������� � �!!6#�!!"� ������������������������34���������;?�+����������������������3��������countries. There is no established mechanism to support responses to economic crises in ADF countries. ADB responded to the 2008–�!!"���������� �������3�������������������� �������� ��������������������7>!!������������� �����������������������������������&�In addition, front-loading of up to 100% of their biennial allocation for 2009–2010 to support eligible borrowers in facing the global economic crisis provided additional relief. However, countries most affected by the crisis received relatively less additional resources, in part due to the ��[�Z�.������������� ��������4.����������������������&
There is also need for additional TA resources at the country level. ADF X has an earmarked allocation for TA activities (TA Special Fund IV), and 49% of this allocation has been used for funding regional W�&� ;���3����+� W�� ��������� ��� ���� ������� ������.��� �� ������4level TA, particularly for project preparation, have been declining in relation to lending volumes, which may have adverse impact during implementation and ultimately negative impact on project success.
Stronger Actions
Efforts must be made to improve and sustain project and country-level performance. The reasons for underperformance of ADF operations �������������������������������� ����������������������� �.����������management) need to be further investigated and addressed.
��*������3����������������������������������+������������ �����for 15% of ADF loans and grants during the period under review. While the success rates for Pakistan projects approved during ADF VI–VII were already lower than the portfolio performance average of 72% for that period, substantial increases in lending to the country during ADF VIII–IX possibly compounded existing capacity problems in an increasingly
xiv
Executive
Summary��������������������������� ������������������&�;����������is undertaking steps to improve the portfolio performance. In addition, identifying the fundamental causes of project failure would enable lessons to be drawn for operations that are forthcoming. IED plans to do a CAPE for Pakistan in 2013 to feed into the next country partnership strategy.
Only 63% of completed ADF projects were assessed as effective or highly effective, 57% �������� or ��� ��������� and 61% likely or ���� ������ �����������.
Forty-two percent of completed program loans that had been approved from 2001–2010 were not effective. Although more than 90% of program policy conditions were technically met, many of them failed to produce adequate levels of meaningful outputs or outcomes, as they failed to address binding constraints to sector development. Lack of wider political support for substantial policy reforms rather than inadequate problem analysis was responsible for the selection of ineffective policy actions under program loans. Also, the focus of ADB’s policy dialogue during program design and implementation was on policy conditions rather than outcomes. Thirty-one percent of the reviewed project loans were not effective. Of these, almost all had problems achieving most of their envisaged project outputs. The reasons for this included lack of stakeholder support, design and construction issues, lack of counterpart funds and weak implementation capacity, changes in external conditions, and the cancellation of project �� �����������������������&�'���������������������������������to be addressed through better project design and proactive project implementation support, both of which require adequate staff and consultant resources. Particular emphasis needs to be on advocacy work and the development of a range of project design/policy options, based on which stakeholder consensus can be built to achieve the best approach.
;���� ������� ������� ��� ������ ��������� ������&� ��,�introduced a number of measures during the review period to �� ���� ������ �������������&� W����� ������������� �������� ������implementation delays for ongoing loans.
The sustainability of ADF-supported investment and policy reform �����������;?���������������������&���� ����������+���������.������issues were generally related to weak institutional capacity of relevant ������������������+������/�����.������ �������������4���������mechanisms for the operation and maintenance of infrastructure assets, ���������� ����������� ���� �������� ��� �������4����������� ������+�and limited local ownership of ADB operations. For program loans, ��������.������ �������3���������������������3��������������� ��������reform commitment due to government changes, vested interests, or lack of wider support. ADB needs to improve the sustainability of its operations through more effective policy analysis and stakeholder consultations, systemic policy dialogue on adequate budget provisions �� ���4�������������������� �� ���� ������������������������infrastructure, more attention to sustainability and their mitigation during project preparation and implementation, monitoring of selected projects after completion, as well as support for developing related institutional capacity in central and local governments.

xv
Weak institutional capacity is a threat to project effectiveness and sustainability. Past support for capacity development has not always achieved the institutional capability or change envisaged. Capacity constraints are particularly severe at subnational levels. Country evaluations have found that ADB did not systematically assess institutional capacity and capacity constraints, or use a capacity development strategy to guide its assistance. The majority of capacity development efforts involved the provision of one-off TA rather than holistic approaches addressing institutional effectiveness, including ���������� ���������������+� ������������������ 3���+������������������+� ���� ���� ����������&� ?��{�� ������ ���� �������� � ���IED evaluation of the effectiveness of ADB’s capacity development assistance, which concluded that the following features enhance the success of capacity development: (i) basing capacity development strategies on comprehensive and adequate capacity assessments; (ii) using results-based approaches to implementing capacity development; (iii) having long-term engagement; (iv) encouraging participatory approaches to enhance government ownership; and (v) cooperating with other development partners for preparing capacity development programs. Apart from strengthening technical capabilities, capacity development should also cover organizational and contextual issues.
Recommendations
W����������������������� ��������������������������������������������������� �.��������.�������������/�����������������+����the same time, greater effectiveness in their use. They concern both ���������4����������������� �����4� �������������������������������3����������������&�
�� Seek additional funding for ADF operations, particularly for ADF-only countries, to further reduce poverty (income and non-income) and enable them to better cope with vulnerabilities. Additional ADF resources would help ADF countries reduce comparatively higher poverty levels and vulnerability to natural ����������.���������������������������� ��������Z����������������of development projects and programs. A special crisis facility 3���� ��� � ��,� ��� ��� ���� [�Z�.��� ���� ��.����������� �� ����needs of poorer and smaller crisis-affected countries (para. 212).
�� Increase education, rural infrastructure, water and sanitation, and environment operations to help achieve related MDG targets. Further attention needs to be given to sectors that cater �� ��4������ ;�|�� ���� ����� ������� ����� ����� ���rural areas. Balancing infrastructure investments with institutional reforms and complementary investments by ADB and development partners in education, environment, health, social protection, agriculture and natural resources, and efforts to create income-earning opportunities will be crucial to making growth inclusive, helping arrest the widening inequities seen in many countries, and making development more socially and environmentally ��������.��&� {��������� �������� �������� ����� ���������� �sector-based support efforts is preferable to complex multisector projects with a large number of non-core sector components (para. 213).
Executive
Summary

xvi
�� Strengthen capacity development efforts on the basis of capacity development strategies at country and sector levels. ������������������������ ���������������;?�+���������������to have lower capacity. Support for capacity development has not achieved envisaged levels of institutional improvement mainly due to unresolved issues related to sector policies, institutional powers and incentives for change, which need to be addressed on the basis of agreed upon sector-based capacity development strategies. Cross-sector issues that have a bearing on the performance of institutions (e.g., decentralization, devolution of services, civil service conditions, state enterprise restructuring, budget allocation �������%� ����� �� .�� ���������� ���� ���������� ������� ����effective policy dialogue on public sector management reforms (para. 214).
�� Strengthen ADF operations through adequate allocation of TA resources to improve project design and country institutional capacity. TA allocations for country-level project preparation and ��������������������������������������������������������������������assistance volumes, which is likely going to exacerbate project design and implementation issues related to inadequate problem ��������+����*�����������������+������;?���������������� �����&�Adequate levels of project preparatory TA resources would facilitate better project design and buy-in. TA resources are also needed to �� ������������ ���������������;?�������������� ���&��$:%&�
�� Improve the development effectiveness of ADF operations further by adopting a proactive, holistic approach to addressing sustainability concerns in country strategies and programs. The sustainability of ADF-supported investments and policy reforms remains a challenge. At the country level, only 5 of the 12 reviewed CAPEs assigned a rating of ����������� or better. Only 61% of projects achieved a rating of ����������� or better. A recent IED report focusing on postcompletion sustainability suggested that to improve sustainability it is necessary to identify and mitigate risks to project sustainability during country and sector assistance programming, pay more attention to risks to sustainability and their mitigation during project preparation and implementation, and monitor selected projects after completion (para. 216).
Executive
Summary

xvii
Management Response
On 21 October 2011, the Director General, Independent Evaluation �� �������+� ��������� ���� ��3���� ��� ���� ��� ���� ;����������������|���������.������;���������5
I. General Comments
1. We welcome IED’s Special Evaluation Study (SES) on the Asian Development Fund (ADF) operations, which serves as an important input in the ongoing ADF XI replenishment exercise. We note from the SES assessment that: (i) ADB’s engagement in ADF countries remains crucial; (ii) ADF performance at the country level has been mixed; (iii) performance at the project level has been improving, though more can be done; (iv) the performance of ADF operations improved with respect to key operational commitments; and (v) ADF contributed towards development impact. In particular, ADF contributed to economic growth by helping countries improve connectivity; increase the level and reliability of power supplies; develop legal and ������������� ����3�*�� �� ������� ���� ��������� ���� ���������agricultural production. ADF also sought to support efforts to make growth more inclusive and promote social development primarily through improved access to resources for smaller enterprises and .�������������������������&�}������ ������������ ��-��*�����������and recommendations are provided below.
II. Key Findings
A. Performance of ADF Operations
1. Country Level Performance
2. We note that 7 out of 12 country assistance program evaluation (CAPE) studies completed over the period 2001–2010 assessed the development effectiveness of ADF operations as satisfactory. ADB has taken steps in recent years to improve the quality of country partnership strategies and programs. These measures should help to further strengthen ADF performance at the country level in the future. ADB institutionalized the results-based country partnership strategy (CPS) in �!!<������� ���������������������������������3�����;?� ��������&���,�also introduced the biennial assessment of CPS quality-at-entry (QAE) in 2006 to identify lessons and aid CPS quality assurance. This complements the CAPE studies carried out by IED. ADB systematically applies the ������� ���������� ��� ���� ?��� ��{� ������������ ���� ?��{�+� 3����� ����led to steady improvements in QAE. As noted in the 2010 Development Effectiveness Review (DEfR), the proportion of CPSs for ADF countries rated satisfactory on QAE increased from 33% in 2006 to 100% in 2010.
Management Response

xviii
3. Furthermore, as part of the 2010 streamlined CPS business �������+� ��,� ������� ���� ����������� �� ?��� ���� ������ ��������frameworks to (i) improve the alignment of CPS with country priorities and ADB’s Strategy 2020, (ii) strengthen sector outcomes and outputs monitoring and reporting, and (iii) integrate results monitoring in the regular country portfolio reviews. To guide staff in using country results management tools, ADB in 2010 upgraded its training programs on CPS preparation, updating and monitoring. To ensure that effective results monitoring is anchored in the country’s own system, ADB has ���� ������������� ���� �� ��� �� �;?�� �� �������� ��������� ����evaluation.
4. The SES notes that political instability and civil strife affected ADF operations in most of the countries with less satisfactory ��������&� ��� ������ ����� �������� ��� ������ �������� ���������is challenging. To improve effectiveness, ADB developed in 2007 a �������������� ���������� ������ ��������������������������������?�[���� ������� ���������� ��?��%&� W��� � ����� ��� .����� �� �3�main pillars: (i) selectivity and (ii) strategic partnerships. It stresses �����������[�Z�.��� ������������� ��� ������������������+�3�*����3���� �������������������������������������������� �+������������������levels, and strengthening incentives to enhance staff motivation to work and locate in FCAS.
5. This approach provides a framework for planning and implementing interventions and offers a menu of options allowing ADB �� ����������[�Z�.��+��� ����������������� �������������������&�The approach was recently assessed by IED as relevant, timely and effective in addressing the needs of affected countries. Looking forward, ADB will continue to implement the approach, building on the momentum achieved so far. In particular, ADB will focus on: (i) sustaining long-term commitments; (ii) concentrating on capacity development, and (iii) intensifying strategic partnerships further. This should help to further strengthen performance in these countries.
2. Project Performance
6. We note that success rates of ADF projects improved over the review period. Despite these improvements, ADB is well aware that the success rate of ADF operations remains below ADB’s targets for 2012 (even though, as the SES rightly points out, the average is adversely affected by a recent period of particularly poor performance in Pakistan). We agree with the SES broad statement that project success rates depend on a number of factors, including the quality of project design and implementation, and project sustainability. In recent years, ADB has taken a series of measure to improve project performance, targeting each of these factors.
(i) To improve project design, ADB introduced a design checklist following the 2006 biennial review of QAE of projects. To reinforce the quality of the project design and monitoring frameworks, ADB improved quality assurance mechanisms and has conducted training for its staff and country executing and implementing agencies. As a result of these initiatives, the design quality of ADF operations improved steadily during 2006–2010. To underpin this positive trend, ADB introduced additional quality measures
Management
Response
xix
under the 2010 streamlined business processes for loan delivery. In 2011, ADB approved a project design facility to ���������������������������������������.������ ������and program preparatory work.
(ii) To ensure effective project implementation, in 2010, ADB adopted the recommendations of the working group on project implementation which had been established following the 2009 DEfR commitment.1 In 2011, ADB introduced a new portfolio performance rating system using a more stringent methodology that will enable ADB and borrowing member countries to identify and solve project implementation problems as they arise. New initiatives to improve procurement and consulting services systems have also been introduced.
Following the 2010 DEfR commitment, ADB scrutinized the underlying constraints to project success and has put in place an action plan to improve project outcomes. The ��������� �.�������������������������%������/�����capacity building and ownership measures during project ������+� ���%� ������������� ������� ��,� ��������� �����3+� (iii) inadequate technical analysis or inappropriate project ������+� ���� ���%� ����������� ��,� �� �������� �������implementation. Noting that the ongoing reforms are already targeting these issues, the plan stresses the importance of successfully implementing measures introduced since 2008 and paying special attention to projects currently in their “mid-life”. The plan also emphasizes the need to continue to improve the quality of sector assessments, roadmaps, and results frameworks to ensure the relevance of projects and sharpen their results orientation. It introduced a checklist for staff to promote a strong outcome focus at all stages of the project cycle. Each regional department developed its own action plan ��[�������� ��������.������������������&�
We are pleased to note that the SES recognizes that ADB has introduced a number of measures to improve project administration, which have led to reduced project implementation delays, as well as improved disbursement �������������3���������+������������.�������!$!��������Portfolio Performance Report, now nearing completion to be soon shared with the DEC. The reforms that have been recently instituted should lead to further improvements in the future.
(iii) To promote sustainability of project outcomes, ADB is improving monitoring and assessment of project outcome sustainability. It has introduced assessment of sector outcomes and outputs, and outputs of ADB-funded projects in the country portfolio review exercise. The information is used to capture lessons and update sector results frameworks. Impact evaluation studies initiated under
1 ADB. 2010. Good Project Implementation Practice: Report of the Project Implementation Working Group. Manila.
Management
Response

xx
a technical assistance approved in 2010 and additional studies being undertaken by regional departments will also identify lessons related to project sustainability and the ���*�� .��3���� ������ �� ���� ���� � ������ ����� �����outcomes. An interdepartmental impact evaluation committee established in 2011 oversees the implementation of these studies. In 2010, ADB introduced a staff training module on impact evaluation methodologies as a regular ADB-wide learning and development program.
7. The SES highlights the poor performance of ADF operations in Pakistan as an issue. For Pakistan, the period of review, 2001–2010, ����.���� ���������������.�����+�3���������������������������������������including political crisis, natural disasters, external and internal shocks, and more recently, serious insecurity. As the SES acknowledges (para. 37) this has been a major contributing factor constraining ADF operations. The report provides a good account of the underlying factors directly affecting portfolio performance, including problems with sector focus, complexity of design, weak and often changing political commitment, ���������� �������������������������� �������&�'�����������:������+�ADB has made concerted effort to address the following challenges:
(i) Strategic shift in focus. Following the directions of Strategy 2020, ADB’s operational program in Pakistan was narrowed to infrastructure (energy, transport, and irrigation), urban services, and reforms. Previously, ADB was in nearly all sectors.
(ii) Rationalized portfolio. During the last three years, there has been a spring cleaning of the portfolio, which has impacted the success rates of Pakistan (and ADF as a whole), as nonperforming projects were closed. The portfolio has been reduced from 52 projects to 20 projects. This allowed cancelled funds to be reused and will ultimately boost portfolio performance.
(iii) Introduced programmatic approach. To provide greater continuity, capacity development and more holistic and �����4����� �� ��+� ���� ������������� ��������� ��������modality has been applied successfully to infrastructure operations. From ADB’s perspective, this allows more time spent on portfolio management relative to stand-alone project processing. To support project operations, policy-based lending was used to unlock key policy impediments ���� �� �� ��� .������ �.���� ��������� ����������&�Operations moved away from multisector and complex ������+� 3����� 3���� �������� �� �� ������� ���� ��������were unsuccessful.
(iv) Strengthened portfolio management. Headquarters ���� ��*������ ��������� ;������ ���;%� ����3�*� ����been enhanced. In 2008, a joint venture approach was ���������+� 3����� �������� ������������ ���� ������ ��;����� ����� ���������� ������ ������ ���� � ������� ������focal points who provide the link with sector divisions and represent 100% of the portfolio in country. Along with better teamwork, safeguards, procurement and other
Management
Response

xxi
skills have been augmented. In addition, there are now high level tripartite portfolio reviews undertaken regularly with the government and executing agencies.
B. Progress in Other Areas
8. The SES acknowledges that ADB has made solid progress with ��� ������*������� �������������������&�;���� ���������+���%���,-��focus on private sector development has been increasing; (ii) gender mainstreaming has been back on track in recent years after some setbacks, (iii) environmental sustainability as a theme has grown in ADF operations, (iv) regional cooperation and integration is becoming more prominent in ADF operations, (v) harmonization and alignment have improved, and (vi) progress in implementing the recommendations of the previous SES on ADF operations has been good. In recent years, ADB has implemented many initiatives to improve its operational effectiveness and has made ����������� ��������������������������������������������� �������,-��2004 reform agenda, the ADF X donors’ report and the previous SES on ADF operations. We are pleased to see that our efforts and accomplishments are being recognized.
9. However, the SES singles out governance as an area of concern. In our view, this point deserves further discussion. Section '�&,� � ���� �{�+� 3����� ������ ���������+� ��� �������� �� ����� ���&�,��������������������������������� ������+�����������������������5� ��%�3������������� ������ �.��������������������������.����������������� ���%� �3� �� �� �.��� ����� ����&� ;���������� 3���� 3����������������.������������������������������� ����&���,-��� �����to governance and capacity development is guided by the Second Governance and Anticorruption Action Plan (GACAP II).2 GACAP ''� ������ �� ��%� �������������� ������� �������� ��� �.���� ���������management, procurement, and combating corruption; (ii) adopting of risk-based approaches to governance assessment; and (iii) developing risk management plans in ADB priority sectors. GACAP II outlines a comprehensive risk-based approach to managing governance risks, including corruption risks.
10. Given the region’s weak governance capacity, governance risk assessments, with their focus on key public sector management systems, are increasingly being used as the starting point for wider, �����4� ������ �� ������ ����� ����� �� ��� �� ������� ���� ������strategies. As noted in para. 194 of the SES, GACAP II guidelines were � ����� ��� ;��� �!!6&� W���+� ���� �{�� �����3� ����� � �!!$#�!$!�captures only a limited time slice since GACAP II became operational ADB-wide. We hope that wider and more sustained implementation of the approach will help further strengthen ADF support in this challenging area in the future.
C. Financing of ADF Operations
11. The SES highlights a number of important issues related to the �������������� �������5� ��%�3����� ���� �������������� ����������������������� ���� ���� �����+� ���� ������ � ����-� �����.������ ����declined; (ii) the increase in the share of grants in total ADF approvals ����� ����� �� ����������� �� ���� �� ���� ��������� ��������.������ �
2 ADB. 2006. Second Governance and Anticorruption Action Plan (GACAP II). Manila.
Management
Response
xxii
ADF over the longer term, in the absence of further increases in donor contributions; and (iii) the performance-based allocation system may be too rigid to allow ADB to respond adequately in time of crisis, especially in smaller and poorer ADF-only countries. ;���������� ���������� ����� ������ ���� ������ ������� ���� ���� .�����discussed as part of the ongoing ADF XI replenishment negotiations.
III. Comments on Specific Recommendations
12. Recommendation 1: Seek increased donor funding for ADF operations, particularly for ADF-only countries, to further reduce both income and non-income poverty and enable them to better cope with vulnerabilities. We agree. ADF countries (and even more so ADF-only countries and countries in FCAS) continue to face huge development challenges and must intensify their efforts to achieve ����;��������������� �����|�����;�|�%&�W����3�������������������������� �������������������&�}����������������������������������������������������������{�+������ ���������5���%������� ������remains a persistent problem in ADF countries; (ii) progress on the non-������;�|������.��������3���������������������������.���!$:��(iii) inequalities have been rising both within and across countries; (iv) ADF countries are very vulnerable to external shocks, including rising food and fuel prices, economic shock, natural disasters, and the impact of climate change. We also agree with the SES assertion that ADF ����������[�Z�.����������� ����������������������������Z������economic shocks. As part of the ADF XI replenishment discussions, ADB is exploring the possibility of establishing a crisis response facility �����3�����������[�Z�.������ �������������*�&�
13. Recommendation 2: Increase education, rural infrastructure, water, sanitation, and environment operations to help achieve related MDG targets. We agree. These areas are highlighted as priorities under Strategy 2020, and ADB is planning to do even more under ADF XI, in each of these areas.
(i) While operations in education had decreased from $837 million in ADF VIII to $690 million in ADF IX, education operations have been given renewed emphasis through Strategy 2020 and are expected to exceed $1 billion under ADF X. This trend is expected to continue under ADF XI. In 2010, ADB introduced a pilot results delivery scheme linking OCR allocations to performance in education operations.
(ii) ADF support to infrastructure has increased in recent years and this trend is highlighted in the SES. However, as the SES correctly notes in Table A6.5 (Appendix 6), ADB does not report disaggregated approvals, differentiating ������ ������� ��.��� �������������&� W��� ������� /����� ���the report are IED estimates based on content analysis. In our view, these estimates should be treated with caution. According to Table A6.5 on page 158, there were no rural water supply and sanitation projects under ADF X. However, based on a quick review of our project database, it would appear that ADF has indeed delivered rural water supply and sanitation projects in at least 3 countries (Bangladesh,
Management
Response

xxiii
?��.���+�������������%����������������������������3. In �������+� ��������������������� ����� ����������������������projects for water supply and sanitation) quoted in Table A6.5 are not fully consistent with our database.
(iii) As noted by the SES in para. 131, the importance of environmental sustainability as a theme has grown ������������� ������ ���� �'''&� W���� ������ ��� �Z ������ ��continue under ADF XI.
14. Recommendation 3: Strengthen capacity development efforts on the basis of capacity development strategies at country and sector levels. We agree. Capacity development strategies could be better implemented by incorporating capacity development results in sector assessments, road maps, and sector results framework. Regional departments are strengthening their sector assessments, including the �� �������� ������������ �.������������������������;%+��������their county partnership strategies and business plans. ADB has assisted ������;?��������� ���� ��������������������������������� ������� ��������������������������4.�������;&�,����������������Z �������+�3������also developing a staff guidance note on integrating the results-based ��;�������������������������������&
15. Recommendation 4: Strengthen ADF operations through adequate allocation of technical assistance (TA) resources to improve project design and country institutional capacity. We agree. TA resources are important in the ADF context, as they can facilitate capacity development at the country level, knowledge building and project preparation. However, we feel that this recommendation ��������.���������/�������&�}�������������+������{��������������the decline in project preparatory TAs may have negatively affected project success rates (para. 207). On the other, the SES recognizes improvements in the success rate of ADF projects (para. 185), despite this decline. The SES also seems to argue that the use of TA resources for capacity development has not been very effective (paras. 164 and 214). Hence, in our view, the link between project success rates and allocation of TA resources needs to be further investigated (not just how much TA resources were allocated but also how effectively they were used, for what purpose, and how that ultimately affected project success rates). Based on this additional analysis, the recommendation ������.�����������������&
16. Recommendation 5: Improve the development effectiveness further by adopting a proactive, holistic approach to addressing sustainability concerns in country strategies and programs. We �����&�'�����;������������� �����$������.����!$!������������SES on post-completion sustainability of ADB assisted projects, we reported that all CPS now require prior country risk assessments and risk management plans. These plans focus on procurement, public �������������������+��������� �������*����������������3����*�������direct links with sustainability concerns. Aware of the importance of sustainability, regional departments will strive to improve the quality
3 BAN Participatory Small-Scale Water Resources Sector project (loan worth $55M approved in 2009). VIE Central Regions Rural Water Supply and Sanitation project (loan worth $45M approved in 2009). CAM Second Rural Water Supply and Sanitation Sector project (grant worth $21M approved in 2009). This list is not meant to be exhaustive.
Management
Response

xxiv
���������������������������������3�������������-���������&����������sector assessments are mandatory for each CPS and are disclosed. The new format stresses analysis of such risk factors as government policy, regulatory frameworks, the capacity of concerned agencies, the critical areas for developing capacity, and the commitment to institutional reform; along with the sustainability of investments.
17. Our Regional and Sustainable Development Department (RSDD) will continue to support regional departments in ensuring the quality of the assessments by developing better tools and methodologies, and through training programs. RSDD, in consultation with the communities of practice, is also developing guidance notes on sector risk assessments. The extensive supplementary template for the ?�������������3+��������������� ���.����!$!+���/��������������departments to include an assessment and rating of sustainability of CPS outcomes. We seek IED’s support in improving the evaluation methodology for assessing sustainability, and in developing related �*���������,����������;?�&
Management
Response

xxv
Chair’s Summary: Development
Effectiveness Committee
1. IED indicated that the report provided an evaluation of ADB’s past record with regard to ADF’s operations, which should be looked at within the context of rapid change and complex challenges in many ADF countries.
Sectors and Areas of Focus
2. DEC members inquired what could be done by ADB’s projects and programs to improve performance in supporting good governance, as some thought this was not clear from the report. With regard to �������������������������������������.������������������+����{?����.��� /��������� ���� .����� �� ����� ������&� ��� 3��� � ���� ���3�that IED, in looking at public sector management, had considered governance as a separate sector, whereas governance was a cross-cutting theme which affected every project. He opined that the report did not do justice to what ADB was doing in the area of governance. IED staff explained that there were concrete project ratings for public sector management, while IED did not conduct governance ratings other than assessments under CAPEs and CAPE assessments showed that this was an issue. The member welcomed IED’s separate evaluation on governance which has started in 2011. The member also requested �����;������������������� ���������������������������������3�on governance.
3. IED staff indicated that governance was related to institutional performance and many of the ADF countries tended to have lower capacity than OCR countries. In this respect, other methods might be needed to strengthen institutional performance. IED staff noted that looking at all the CAPEs for various ADF countries, regardless of whether blend or ADF-only, there was a pattern. Of the following elements: (i) sustainable growth, (ii) inclusive social development, and (iii) good governance, the third pillar of good governance performed �����3���� ��������� �� '{�-���������&����� �����3��� ���*��� �� ���*��progress on policy and institutional reforms. IED found that often there was no concrete buy-in from government to any institutional changes ������� �� �� ���� ���� ��������� ���� ������������ � �������������performance.
>&� �{?����.�����������3��������������������.������������������within and across sectors was needed. A DEC member highlighted the differences between ADF VIII and ADF IX in terms of the substantial increase in allocation to energy and transport, and the decrease in education. He noted that the allocation remained fairly similar in 3������������������+�������� �.�������������������������������&�Furthermore, while ADF IX gave the latter sectors a high priority, this was not the case with ADF X. The member was of the opinion that ADB should have a larger say in determining the sectors for allocating
xxvi
��������&�W����3��� ����������������������,���������������Z ��������and knowledge, and has been continuously interacting with the governments of the borrowing countries. The member noted that ADB should place regional integration and cooperation as a priority area only after an evaluation and assessment of the performance to date in this area.
5. With regard to the report’s second recommendation, namely increased focus on education, rural infrastructure, water sanitation, and environment, DEC inquired whether, given the limited resources, a corresponding reduction in interventions in other sectors would be required. IED indicated that the report suggested certain areas that should receive increased attention for greater effectiveness, such as ��4������;��������������� �����|�����;�|�%�����W�&�'{�������������������� ����������� ����������������3��������������������������receive less resources if the ADF pool remained the same or declined.
Sustainability
<&� �{?����.�����������3��������������������������.������.���some members considered the suggestions in the report were not � �����������&��{?����.�����������������������������3������ �and incentives were critical for the sustainability of ADF-supported policy reforms. In this respect, some DEC members considered that policy reform projects and programs should be supported by lending modalities rather than grants. Grants may result in disincentives due to a lack of ownership from the government in carrying out necessary reforms and ultimately undermine the sustainability of the reform because there is no need for repayment.
Performance
7. IED staff noted that compared to earlier decades, ADF �������� ����� �� ����+� �� �������� �� ��������� ���� ���������+�but less in terms of effectiveness and sustainability. They noted the ��������� ��� ������������� �� �������� 3���� ������� �� ��������.�����+�indicating that it was harder to measure outcomes and results compared to inputs and outputs, and that further work was required on the results side.
8. DEC members commented on the impact of the poor performance of ADF operations in Pakistan and how this affected overall ADF performance, and questioned whether the appropriate measurement methodology was being applied for Pakistan and other ������� ���� ��[���4������� ��������&� '{�� ��������� �������*������is a blend country and that the same criteria have been used for all countries to make the evaluation uniform. IED noted that the performance of ADF-only and blend countries is the same if Pakistan is not considered.
9. IED staff indicated that the report, drawing on the evidence, ��[�������� �����������*�������� �����������3����������.���returns, and proposed some improvements in areas where more was required in light of the growing needs of the region.
Chair’s
Summary

xxvii
Inclusive Growth and Achievement of Millennium
Development Goals
10. With regard to the limited progress in achieving non-income ;�|�������;?���������3�������/��������+���{?������������������� ���indicated that ADB should increase its programming on non-income ;�|�+����������������������3������������������&�
11. IED staff noted that ADB appears to have contributed to growth in ADF countries, but progress has been limited in terms of inclusive growth, and this was an area for future focus. Findings from Bhutan, Lao PDR, Cambodia, Viet Nam, and other countries showed that where efforts on infrastructure were linked, for example with efforts in education and health, results with regard to effectiveness, sustainability, and inclusive growth were better.
12. DEC members agreed with the assessment that ADF must �����.�������� �� �������������������4������;�|������ ����reduction of growing inequalities in a growing number of countries. Some DEC members supported the use of ADF resources to enhance governance, public management, and capacity development because they were the critical pillars for inclusive growth. Some members suggested this should be further discussed as this was an important issue for some ADF donor countries.
Technical Assistance
$9&� �{?������;���������-�������������������������������to strengthen ADF operations through adequate allocation of technical assistance (TA) resources to improve project design and country institutional capacity. TA and capacity development were important, and there was a strong correlation between project success ���� ���/����� W�&� '{�� ���� ��������� ����� ���� �� ��� ���� ������� ��continuous strengthening of TA performance.
14. A DEC member noted the linkage between TA and sustainability, governance, commitment to a budget process, and long-term involvement of ADB and other donors. He asked about ADB’s openness to cooperating with other donors, and to share lessons and learn from others. Another DEC member noted that in supporting capacity building, it was important to provide TA in the local language.
$:&� �{?� ����� '{�-�� ������� ����� ������� 3����� ����� ���������project preparatory TA (PPTA) performed better than projects without PPTA. It was of the view that good project design and good project preparation led to better outcomes, but considered that TA was not the only way to achieve this. IED staff agreed that PPTA was not the only driving factor but its analysis showed it was one of the key contributors. IED noted that a number of other project design issues 3���� ���������� ����� ����� .�� ���������� ������� ����� ��������+�such as appropriate costing and broader stakeholder consultations. IED found that many projects suffered from a lack of proper design or awareness of country conditions. One possible lesson suggested was the need for close involvement of resident missions at the project design stage.
Chair’s
Summary

xxviii
16. With regard to room for improvement in the performance of ��,-��W�+� '{������ ��������� ����� �����3������������������?��{�&�DEC suggested that IED could look at TAs in a more holistic way; IED staff agreed that it was important to review how TA instruments were .���������&� '{�������������������������������� �����3��� ������� ��������������������������*��������������Z�������������� ������������������+���� ������ ����������������������������������+� ������3���a consistent message that there was no sustainable mechanism to institutionalize the knowledge imparted by a TA. Often ownership of project-supported TA did not rest with the implementing or the executing agency. IED suggested that ADB needed to look at how it could handle TA differently, perhaps from a more strategic perspective, looking at the critical gaps and how to strengthen institutions.
Capacity Development
17. IED staff noted that progress could be made in improving effectiveness and sustainability, including through capacity building. IED staff suggested the preparation of long-term sector-based strategies for capacity development in key institutions that ADB was dealing with, in coordination with other donors. TA, together with policy dialogue and other mechanisms, would support the implementation of such a strategy.
18. A DEC member noted the difference between capacity building and capacity development which involved long-term involvement, and suggested ADB focus more on the latter.
Program Lending
19. A DEC member noted that the report indicated that a considerable proportion of program loans had been ineffective, and the reasons thereof. He noted that the timing of the introduction of policy changes was important. Whether the timing was suitable and favorable needed to be considered within the country context.
�!&� ���{?����.����Z ������������������������������������ ���on the usefulness and the priority for program loans or policy-based operations. It indicated that although the success rate of policy-based loans or program loans improved with 90 per cent of program policy conditions technically met, many of them failed to produce adequate levels of meaningful outputs in terms of actual reform.
�$&� '{�� ���� ������� ����� ���� ������� �� ������ �������� 3���surprising with 43 per cent of program loans rated as not effective. Elements required for success included (i) strong political support, (ii) adequate problem analysis, and (iii) a robust set of policy actions that address binding constraints. IED found that in cases of failure ������3���������������.��4���������������������+���������3����shifts in government commitment due to political changes. A DEC member indicated that, in his view, project design should be made in such a way that it was not affected by changes in government.
22. IED staff explained that analysis in a number of studies, �������������������� ����4.������������+��������������������.���
Chair’s
Summary

xxix
of causes for failure of program loan effectiveness. One of the causes was lack of adequate problem analysis. Political pressure for budget support often overlooked a certain lack of commitment on the government’s part. The result was a lot of conditions that appeared to be meaningful but that ultimately did not translate into meaningful outputs or reform outcomes. On the design side, to make a program loan more resistant to political changes, various IED studies had recommended more policy dialogue with other stakeholders, not only current government but possibly parliamentary commissions, etc. This may ensure that successor governments also had buy-in for program loans.
ADF Support
23. With regard to donor support, DEC noted a reduction in ��[3�� ���� ���� ������ ������ ���� ��/������ �.��� ������ ���������plan for ADF. Some DEC members suggested that the recommendation be rephrased in a more general fashion, highlighting the need to increase the overall size of the ADF but without specifying the source of funding and singling out donor funding.
24. IED indicated that IED was not taking a view on the ������������ � ���� .����� �� ���� ������ � ��������&� W��� �� ����� ������������������������������������������ ��������������be strengthened. The staff agreed that there could be ambiguity in the ����� ���������'{�-��������������+������������������������������������������������3��������������������������������������other sources to maintain current level of ADF resources in the face of �����Z ���������������������[3�&�W����3����� ���������������.���income and non-income poverty and enable ADF countries to better � ��3�����������.�������&�'{��3���������������������������������in the report accordingly.
25. With regard to the Special Crisis Facility, a DEC member highlighted the importance of taking into consideration the needs of ADF countries.
26. DEC noted that donor contributions have declined since ADF V, and in the context of the next ADF donors’ meetings which would decide the framework for ADF, asked if the framework should .�� ��������� ��� �� �������� ����Z�� ������� ����� ����� � ���� ����&�SPD explained that in previous rounds of ADF replenishment, donors and ADB had discussed the possibility of a self-sustained ADF. The staff noted that the current crisis, unfortunately, was affecting many donors and the prospects for increased contributions were affected by this. SPD reiterated that the study clearly showed that there had been constant improvement in performance in ADF. There were certain areas needing improvement, but overall, ADF was performing reasonably well. ADF operations gave good value for money in terms ������� ������ ����������������������������&�W������+���,�3����like to see an ADF of larger size. The sources of possible funding would .������������.��3����;��������������������������� ����������negotiations in Dhaka in December.
Chair’s
Summary

xxx
Regional Departments
�=&� ���������|������+� ������+�?������� �������������+� ���������Asia Departments provided their views on the SES’ recommendations, responded to questions from DEC members, and provided examples � ����������������� ��������������� ����������������������+�������+�and countries.
28. Regional department staff appreciated the value of IED’s evaluations and the lessons that can be extracted from them, and overall supported IED’s recommendations. It was noted that selectivity is essential to avoid overambitious goals in too many sectors, as well as the focus on country context and on improving sustainability. They also agreed that the quality of TAs could be looked at as a separate issue. With regard to the methodology used to assess program loans, it was suggested that IED could look into this.
Content and Format of the Report
29. A DEC member expressed dissatisfaction with the report because in his view some formulations were ambiguous and not always accurate, and provided examples from the report that in his opinion should have been expressed more accurately. He also considered that the Executive Summary could have summarized the �������+� ������+� ������+� ���� �������������� .������ �� ��� � �������������������� �;��������������� ��&�W����{?����.�������noted that the report aimed to offer recommendations for donors ��������,�;�����������������������������������,�,����������have been included.
30. Some inconsistencies were noted between IED and ;����������3���� ��� ���� �� �������.���� ������3������� �������sanitation projects delivered through ADF; IED indicated that these would be corrected, and that comments received on clarity and presentation of the report would be taken into consideration.
Conclusion
31. DEC welcomed the Special Evaluation Study on the Asian Development Fund Operations for the period 2001 to 2010. It endorsed IED’s recommendation that ADB seek increased funding for ADF operations but without specifying the source of funding and singling out donor funding, particularly for ADF-only countries to further reduce poverty, income and non-income related, and enable them to better cope with vulnerabilities.
32. DEC noted that ADF has improved its operations not only over time but particularly in the last decade. DEC appreciated the improved ratings of projects approved during ADF IX, with more than two-thirds of the case study projects expected to be successful or highly successful. Nevertheless, members noted that while ADB has done well ��������������������������������+��������3�����������.��������improvement as far as effectiveness and sustainability was concerned.
Chair’s
Summary

xxxi
99&� ���������+��������*�� ���������������4������;����������Development Goals underscored the need for focusing on inclusive growth. In this context, the need for extra resources under ADF and 3����� ����� ���������3�������� ��������� �������������� ��[3��from a move from loans to grants, was a concern of the DEC members.
34. On technical assistance, members emphasized the need for sector-based strategies as well as the need to strengthen ADF operations through adequate allocation of TA resources to improve project design and country institutional capacity.
9:&� ;��.����������������,�3������������������������������ �����bank to adopt in 1995 a special policy on governance with focus on accountability, participation, predictability, and transparency followed by a policy of anticorruption in 1998 and the launch of the Governance and Anti-Corruption Action Plan (GACAP-II) in 2006. DEC encouraged staff to make further progress on the governance issue as they believed ���������������3���*�������������������;�|�&
Chair’s
Summary


11
Introduction
Chapter 1
Introduction
A. The Asian Development Fund
1. The Asian Development Bank (ADB) established the Asian Development Fund (ADF) for concessionary lending to poorer ����� ���� ���.��� ��������� ��;?�%� .�� �������������� ��� ��������Special Fund in 1974. The ADF’s purpose is to promote economic and ����������� ��������������;?�&1 Its resources are replenished every 3–5 years2�.�������������������������������.����;?���������������formula (known as performance-based allocation [PBA])3 that is based on the country performance assessment rating, per capita income (or gross national product where national income estimates are not available), and population. ADF donors’ reports, prepared at the conclusion of replenishment negotiations, provide the framework for ADF resource allocation to eligible countries. These reports also contain commitments or statements agreed upon during negotiations. ADF resources are used for providing loans;4 technical assistance (TA); and, since 2005, grants under certain conditions.
B. Previous Evaluations of ADF Operations
2. During the past decade, there have been three special evaluation studies (SESs) of the ADF (in 2001, 2003, and 2007). The ������{�+������������� '#�� �������� �$"=9#$""$%+5 concluded that
1 “The purpose of the Fund shall be to enable the Bank more effectively to carry out its purpose and functions by providing resources on concessional terms for the economic and social development of the DMCs of the Bank, having due regard to the economic situation of such countries and to the needs of the less developed members.” Source: ADB. 2006. Regulations of the Asian Development Fund. Manila (Section 1.01).
2 Every 4 years since 1997.3 ADB. 2001. Policy on Performance-Based Allocation for Asian Development Fund Resources.
Manila. 4 ADF loan projects (including TA loans) have a maturity of 32 years, programs and emergency
assistance have maturities of 24 years and 40 years, respectively. The grace period is 8 years for project and program loans and 10 years for emergency assistance. Project and program loans incur an annual interest rate of 1.5% during amortization and 1% during the grace period. Emergency assistance loans carry an annual interest rate of 1%, with principal repayment at 2% per year for the first 10 years after the grace period, and 4% per year thereafter. ADB does not charge a commitment fee, but all loans are equally amortized. The hard-term facility loan has an interest rate of 150 basis points below the weighted average of the 10-year fixed swap rates of the special drawing rights basket of currencies plus the ordinary capital resources (OCR) lending spread or current ADF rates, whichever is higher. The rest of the hard-term facility terms are the same as current ADF terms. The ADF grant framework resembles the World Bank’s International Development Assistance approach. Grants are expected to ease the debt burden of the poorest countries and to support post-conflict ADF countries in their transition to peace and stability. Details are available in Sections A3/BP, D2/BP, D7/BP and D12/BP of the Operations Manual, and http://www.adb.org/ADF/about.asp. The grant mechanism for ADF operations was introduced in ADF IX (2005 onward) on a pilot basis.
5 Independent Evaluation Department (IED). 2001. Special Evaluation Study: A Review of the Asian Development Fund I–V Operations. Manila:ADB.
ADF promotes economic
and social development in
poorer DMCs
Chapter 1
Introduction

22
The Asian
Development
Fund
Operations
the operations were partly successful and estimated the project success rate to be 45%. It found that projects aimed directly at the poor to promote employment and income generation had limited �������&�W����{�������������.������������������������������ ��.�����������&
3. The second SES, covering ADF VI–VII operations (1992–2000),6�����.��������������������������������� �� ����� ���� �����performance, become more selective in its lending allocations, recast its mission to address poverty reduction, and strengthened the country focus of operations. It concluded that more effort was needed in linking country assistance strategies to project selection and poverty outcomes, ensuring greater consistency in program lending, dedicating ������������������������������������������������ ��������������objectives in projects.
4. The third SES, covering ADF VIII–IX7 from 2001 to 2008, found the operations �������� for many of the ADF countries and ������ �� �������+�.���������������� �������������������������overall.8 The study concluded that ADF VIII outcomes were likely to be less effective because increased goal congestion in ADF operations and more complex project designs due to the inclusion of pro-poor components and governance ambitions in regular investment projects led to implementation problems in the absence of commensurate staff resources. Although ADF IX outcomes were not rated, the SES saw some signs of improved performance and noted that ADB’s Enhanced Poverty Reduction Strategy of December 2004 had appropriately done away with setting targets for operations directly aimed at helping the poor. Country assistance programming was considered somewhat less burdensome over the period of ADF IX than before, thereby freeing up more time for project processing and administration. The study regarded the PBA policy ����������� but viewed some recent changes ��� � � �������� .��������� 3��*��� �������� ��������&� W��� �{������ ����� ����� ������� � ���� �� ��Z� �,�� ���������� �� �;?�governments, as well as the staff time needed to maintain it, remained a concern. A number of internal ADB reforms and business process changes approved in 2004–2006 were, however, seen as likely to �� ���������������������������������������������������������.������of the ADF.
5. The SES made 10 recommendations: (i) the ADF’s size should ��������� �� ��� ��� �� ����������� ���� ������������ � ���� ;��������������� ����� |���� �;�|�%�� ���%� ���� ����� ������ �������� ����role and credibility of ADF as ADB’s main special purpose vehicle for ����������� �������������������� ����;�|�� ������������ ������������(iii) ADF X should avoid goal congestion in operations and in ADB as a whole; (iv) the ADF needs to be more selective in its support for sectors (and within these, subsectors) in many countries; (v) poverty reductionis an appropriate goal for ADF operations and requires more than direct targeting of the poor in each country; (vi) an ADF geared to poverty reduction and governance is staff intensive and needs specialized skills; (vii) aid harmonization and coordination remain
6 IED. 2003. Special Evaluation Study: Asian Development Fund VI–VII Operations. Manila:ADB.7 IED. 2007. Special Evaluation Study: Asian Development Fund VIII and IX Operations.
Manila:ADB.8 82% of the poor live in countries that do not have access to ADF resources.

33
Introductionnecessary elements of the ADF approach; (viii) major governance issues should be primarily addressed through program lending, with agreed reforms being supported by advisory and capacity building TA; (ix) ADB should undertake a rigorous analysis to test the validity of the various country performance assessment indicators; and (x) ADB needs to pursue a varied approach to debt distress of ADF countries and not rely mainly on the institution of an ADF grant mechanism. Progress in the implementation of these recommendations is discussed in paras. 166–168.
C. Purpose and Scope
6. This current SES was undertaken to (i) identify what has worked well for the ADF and what further improvements are needed to guide future ADF operations by ADB, and (ii) provide the Independent Evaluation Department’s (IED’s) feedback to the ADB Board members, ���� ������� ����+� �� ���� ����� ���� ��,� ;���������� ��� ����context of forthcoming discussions for the 10th replenishment (ADF Xl). The SES focuses on operational aspects related to development effectiveness rather than on organizational aspects.9 It gives an update �������'''�����'�� ����������!!$#�!!6%������� �������������������of ADF X (2009–2010).10
7. Chapter II analyzes key trends in ADF allocations over the last three ADF cycles and Chapter III provides an assessment of ADF performance at the country, sector, and project levels. Chapter IV reports on progress made in addressing key commitments/statements pertaining to several crosscutting areas summarized in Appendix 1, Table A1.1. The areas discussed include poverty reduction and ����������� � ���� ;�|�+� ��� ���������+� ������� ��������������in ADF operations, environmental sustainability, private sector development, regional cooperation and integration, sector selectivity and concentration, partnerships and aid coordination/harmonization, the PBA system, addressing the needs of ADF countries in fragile ���� ��[���4������� ���������� ��?��%+� ���� W�� ��������� ��� ����countries. As the previous SES (footnote 7) undertook a detailed �����������,�� ����+���������� ���������������������������������������remain valid, a similar analysis has not been undertaken. Likewise, the SES does not cover ADB’s results framework, which IED is assessing in another stand-alone SES. The other remaining reform agenda items emphasized in the ADF X report and not discussed in the SES are ��3������ ����Z�$+�W�.����$&�&�W����������� ����������{�� ��������*���������������������+������������������������������������,�;�������������������&�
9 Progress on organizational aspects including reform agenda was presented by ADB Management and discussed during the 2010 Midterm Review of ADF X in November 2010.
10 The discussion in the SES relates primarily to the first 2 years of ADF X, i.e., 2009 and 2010, which are referred to as ADF X for the sake of brevity. When the complete cycle of ADF X, 2009–2012, is meant, it is explicitly stated.
The study focuses on
operational aspects
related to development
effectiveness
44
The Asian
Development
Fund
Operations
D. Methodology
8. The SES adopted a similar methodology to that used in preparing the ADF VIII–IX SES in 2007 (footnote 7). It analyzed portfolio data for 590 ADF loan and grant operations (466 projects) approved by ADB from 1 January 2001 to 31 December 2010 (the report period), 95 of which had project completion reports (PCRs).11
9. Information for the study was obtained from (i) ADB databases; (ii) interviews with ADB staff at Headquarters and in resident missions; (iii) recent IED evaluation studies including 12 country assistance program evaluations (CAPEs) and associated sector assistance program evaluations, three impact evaluation studies, SESs (on capacity development, project sustainability, support for countries in FCAS, and ADB’s implementation of the Paris Declaration), and 32 PCR validation reports (PVRs); (iv) interviews with stakeholders in 4 recipient countries regarding ADF themes and issues; and (v) 51 ADF case study projects in �����;?��,���������+������ ��-�������������� �.�����������%+�Nepal, Pakistan, and Viet Nam. The case studies include 25 projects covered in the last SES on ADF operations (footnote 7) approved ������������������������������'''+�������������<� �������� ������������������������������'�&������������������������3�������������������� ���������� ������ ��� ����� ���� �� ������� ��������� ������������ �������� ���������� ��������;?������������������3� ����&�A stakeholder consultation workshop was held in Bangkok (27–28 �������� �!$$%� 3���� $:� ������ ������� ��� $!� �;?�12 to discuss ������������������ ���� ���������� �� ���*� ������ ����-��Z ��������and perspectives on the ADF. The detailed methodology adopted for the study appears in Appendix 2.
11 By comparison, the 2007 SES on ADF VIII–IX covered 245 ADF operations, of which only 22 had been completed and only 8 had PCRs.
12 Represented countries included Bangladesh, Bhutan, Lao PDR, Mongolia, Nepal, Pakistan, Solomon Islands, Sri Lanka, Timor-Leste, and Viet Nam. Representatives from Afghanistan, Cambodia, and Kyrgyz Republic could not attend the workshop.
The study is based on
different sources of
information and five
country case studies
55
Chapter 2
Financing ADF Operations (2001–2010)
A. Introduction
10. This chapter provides a brief background of key attributes of ADF VIII, IX, and X and presents ADF resource allocation over the three replenishment periods13 under four broad categories: ��%��������������.������������������������%�����������������.����;?���(iii) allocation by sector and theme; and (iv) other areas covering allocation to blend ��������+����������+� �������������������+�����������������+�������������������+�����W����������&�,������������������eligible for funding both from ordinary capital resources (OCR) and ADF support.
11. As evident from the key commitments and statements of the ��������-��� ���+� ������������������ �����;?������������������remained the focus of ADF support in all three ADF cycles covered by this SES.14 ADF VIII introduced three new initiatives: (i) a PBA system, ���%��� ����� ��4��[�������������������������������������*�+�����(iii) increased emphasis on regional cooperation and integration (RCI). These initiatives have been strengthened over time and integrated into ADB operations. During ADF VIII, Azerbaijan became a new ADF recipient.
12. In ADF IX, donors recognized special problems faced by small ��������;?��.������������������� ���������������������� , high transaction costs, lack of natural resources, and limited access to credit markets; hence, they approved a dedicated share (4.5% of the ���������������.������������,�%�������������� �&�'���������+������also approved use of ADF resources for a grant mechanism mainly to ��� � ���4�����.��� �;?�� 3���� ��.�� ��������� �.����� �� � �� $6�� �total ADF IX operations). Armenia, Georgia, and Timor-Leste became additional ADF-recipient countries.
$9&� '�������+������,���������3������������������������������of the weakest performing countries while simultaneously upholding the principle of rewarding performance.15 In addition, a portion of ADF
13 The decade 2001–2010 covers the seventh, eighth, and ninth ADF replenishments (correspondingly ADF VIII, ADF IX, and ADF X).
14 ADB. 2000. ADF VIII Donors’ Report: Fighting Poverty in Asia. Manila; ADB. 2004. ADF IX Donors’ Report: Development Effectiveness for Poverty Reduction. Manila; and ADB. 2008. ADF X Donors’ Report: Towards an Asia and Pacific Region Free of Poverty. Manila.
15 Refinement of PBA included modification of the PBA of blend borrowers, which was expected to free up resources that could be redistributed among other ADF countries according to the PBA mechanism, with the exception of Pacific DMCs, for which 4.5% of resources was earmarked.
Donors approved 4.5 of
the resources distributed
under the performance-
based allocation for the
Pacific pool and up to 18
ADF IX operations for a
grant mechanism
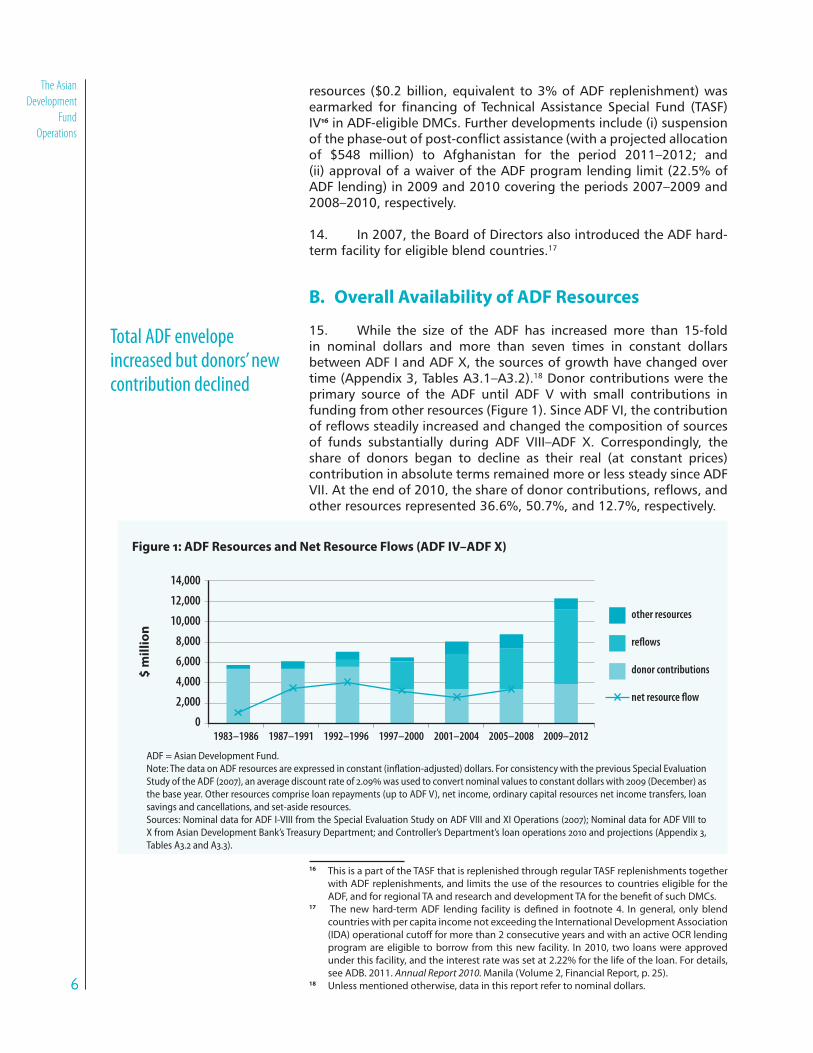
66
The Asian
Development
Fund
Operations
resources ($0.2 billion, equivalent to 3% of ADF replenishment) was ������*��� �� ��������� � W��������� ����������� � ������ ����� �W���%�IV16�������4�����.����;?�&�������������� ����������������%���� ����������� ����4���� ��4��[����������������3������ �����������������of $548 million) to Afghanistan for the period 2011–2012; and (ii) approval of a waiver of the ADF program lending limit (22.5% of ADF lending) in 2009 and 2010 covering the periods 2007–2009 and 2008–2010, respectively.
14. In 2007, the Board of Directors also introduced the ADF hard-term facility for eligible blend countries.17
B. Overall Availability of ADF Resources
15. While the size of the ADF has increased more than 15-fold in nominal dollars and more than seven times in constant dollars between ADF I and ADF X, the sources of growth have changed over time (Appendix 3, Tables A3.1–A3.2).18 Donor contributions were the primary source of the ADF until ADF V with small contributions in funding from other resources (Figure 1). Since ADF VI, the contribution ���[3��������������������������������������� ��������������of funds substantially during ADF VIII–ADF X. Correspondingly, the share of donors began to decline as their real (at constant prices) contribution in absolute terms remained more or less steady since ADF �''&��������������!$!+���������������������.�����+���[3�+�����other resources represented 36.6%, 50.7%, and 12.7%, respectively.
16 This is a part of the TASF that is replenished through regular TASF replenishments together with ADF replenishments, and limits the use of the resources to countries eligible for the ADF, and for regional TA and research and development TA for the benefit of such DMCs.
17 The new hard-term ADF lending facility is defined in footnote 4. In general, only blend countries with per capita income not exceeding the International Development Association (IDA) operational cutoff for more than 2 consecutive years and with an active OCR lending program are eligible to borrow from this new facility. In 2010, two loans were approved under this facility, and the interest rate was set at 2.22% for the life of the loan. For details, see ADB. 2011. Annual Report 2010. Manila (Volume 2, Financial Report, p. 25).
18 Unless mentioned otherwise, data in this report refer to nominal dollars.
Total ADF envelope
increased but donors’ new
contribution declined
ADF = Asian Development Fund. Note: The data on ADF resources are expressed in constant (inflation-adjusted) dollars. For consistency with the previous Special Evaluation Study of the ADF (2007), an average discount rate of 2.09% was used to convert nominal values to constant dollars with 2009 (December) as the base year. Other resources comprise loan repayments (up to ADF V), net income, ordinary capital resources net income transfers, loan savings and cancellations, and set-aside resources. Sources: Nominal data for ADF I-VIII from the Special Evaluation Study on ADF VIII and XI Operations (2007); Nominal data for ADF VIII to X from Asian Development Bank’s Treasury Department; and Controller’s Department’s loan operations 2010 and projections (Appendix 3, Tables A3.2 and A3.3).
Figure 1: ADF Resources and Net Resource Flows (ADF IV–ADF X)

77
Financing ADF
Operations
(2001–2010)
$<&� ���� �������� [3�19 were positive throughout 1981–2010 (Appendix 3, Table A3.3). They registered the highest level in 2009, due largely to frontloading of ADF allocations for 2009–2010, and provision of an additional ADF commitment authority of $400 million to meet ����������4�� �����������;?�&�������������[3�����!$!����������sharply due to the front loading. At the country level, most of the ����������;?����������� �������������������[3��������������'''4�����+�3���������Z�� ��������������������������������������&�&+�?*�Islands, Papua New Guinea, Solomon Islands, Tonga, and Vanuatu) ������������� ����Z�9+�W�.����9&>%&�W���������������[3�.������cycle (Figure 1) shows a continued to increase until ADF VI, largely due to high donor contributions. It then dropped during ADF VIII as a result of a relative decline in contributions, which became smaller than ��[3�����������.�������������������������.����&�'������'�����������������������������+�����������+������ ��������������!!:+�represented about 22% and 30% of total approved loans and grants, respectively. ADB’s Treasury Department expects the ADF principal to decline from 2013 onwards. This could have an adverse impact on net ��������[3�����������������������.���������3����������.������or additional funding from other sources.
C. Allocation of ADF Resources by Region and
Country
17. The Central and West Asia region received the largest share of ADF approvals in all three ADF cycles due mostly to approvals for operations in Afghanistan and Pakistan (Table 1). The allocation to ��������;?����.���� ������� '���� �����3���������'''+������������by donors through the creation of a dedicated allocation to meet the region’s unique needs. The allocation under ADF X appears on track to achieving the target of 4.5% of the resources distributed under PBA �����������������������;?�&����+�������������[3�����������������;?��3�����������������������4� ��������������������.����������crisis of 2008–2009 (Appendix 3, Table A3.4).
Table 1: Regional Distribution of ADF Approvals, 2001–2010 ()
Region
Regional Share Total
ADF VIII–ADF X(2001–2010)
ADF VIII(2001 –2004)
ADF IX(2005–2008)
ADF X(2009–2010)
East Asia 2.4 1.8 2.9 2.3
Southeast Asia 30.9 25.6 26.4 27.4
South Asia 31.7 30.4 28.5 30.2
Central and West Asia 33.1 38.1 38.4 36.7
Pacific 1.8 3.7 4.0 3.2
Regional 0.0 0.4 0.0 0.2
Total 100.0 100.0 100.0 100.0
ADF = Asian Development Fund.Source: Asian Development Bank Database on Loan, Technical Assistance, Grant and Equity Approvals (Appendix 3, Table A3.5).
19 Net resource flow = loan disbursements – loan repayments (including any prepayments) – other charges. It excludes private sector operations. Other charges include interest and/or service charges collected and capitalized.
ADF principal is likely to
decline from 2013 onwards
Many Pacific DMCs
received negative resource
flows in the run-up to
and during the global
economic crisis

88
The Asian
Development
Fund
Operations
Country
Population (million)a Per Capita ADF Approval per Year ()
2000 2004 2008 ADF VIII ADF IX ADF X
A. ADF-only Countries
Ordinary Situationb
Bhutan 0.6 0.6 0.7 6.8 57.9 43.1
Cambodia 12.5 13.3 14.0 7.1 5.1 10.9
Kyrgyz Republic 4.9 5.1 5.3 7.4 7.9 23.4
Maldives 0.3 0.3 0.3 23.8 17.2 60.8
Mongolia 2.4 2.5 2.8 14.2 14.5 32.5
Samoaa 175.1 178.2 182.5 20.0 85.5 43.8
Tongaa 99.4 101.1 102.8 25.2 27.9 48.6
Exited FCAS
Lao PDR 5.1 5.5 6.0 11.1 5.1 21.2
Nepal 22.3 24.4 26.6 4.0 4.3 11.3
Tajikistan 6.2 6.7 7.3 5.9 7.9 12.5
Current FCAS
Afghanistan 21.3 23.2 25.0 5.7 9.3 13.7
Kiribatia 84.5 90.4 97.7 0.0 0.0 61.4
Solomon Islandsa 420.5 469.6 524.0 0.0 10.3 30.5
Timor-Lestea 779.0 952.0 1,081.0 0.0 4.2 21.3
Tuvalua 9.5 10.0 11.0 100.4 81.0 0.0
B. Blend Countriesc
Ordinary Situation
Armenia 3.2 3.2 3.2 0.0 6.6 21.9
Bangladesh 128.1 135.2 142.4 1.7 2.8 3.1
Cook Islandsa, d 17.9 20.3 22.1 30.7 119.6 0.0
Georgia 4.4 4.3 4.4 0.0 6.4 35.7
Indonesiad 205.8 217.1 228.5 0.4 0.5 0.0
Pakistan 139.8 151.1 162.4 1.9 2.4 1.6
Sri Lanka 18.5 19.5 20.2 6.8 4.8 5.5
Viet Nam 77.6 81.4 85.1 2.7 3.8 6.5
Exited FCAS
Azerbaijan 8.1 8.4 8.8 1.3 0.4 0.0
Uzbekistan 24.7 25.9 27.3 0.0 1.5 6.0
Current FCAS
Marshall Islandsa 50.7 51.5 53.9 74.0 0.0 88.1
Micronesiaa 107.0 107.8 108.0 63.6 0.0 0.0
Palaua 19.1 19.8 20.3 0.0 0.0 83.7
Papua New Guineaa 5,190.0 5,689.1 6,213.3 1.5 7.6 10.0
Table 3: Population and Per Capita ADF Approval, by developing member country
ADB = Asian Development Bank, ADF = Asian Development Fund, DMC = developing member country, FCAS = fragile and conflict-affected situations, Lao PDR = Lao People’s Democratic Republic, TA = technical assistance.a Population data for Pacific countries is expressed in thousands.b Excludes Myanmar, which currently has no access to the ADF.c Only the ADF-financed component of loans is counted for blend countries; excludes India, which currently has no access to the ADF. d At the time of loan approval, these countries were still ADF eligible.Sources: ADB Database on Loan, TA, Grant and Equity Approvals (as of 31 December 2010); ADB Key Indicators for Asia and the Pacific 2010.
Country ADF VIII ADF IX ADF X Total ADF VIII–ADF X
Afghanistan 487.2 865.0 685.1 2,037.3
Bangladesh 873.7 1,490.6 876.9 3,241.2
Nepal 359.3 418.2 598.7 1,376.2
Pakistan 1,045.6 1,458.8 515.0 3,019.4
Viet Nam 832.0 1,245.0 1,103.0 3,180.0
Table 2: Top Recipients of ADF Resources, by ADF Cycle, 2001–2010
( million)
ADF = Asian Development Fund.Source: Asian Development Bank Database on Loan, Technical Assistance, Grant and Equity Approvals (Appendix 3, Table A3.7).

99
Financing ADF
Operations
(2001–2010)
$6&� W������.�������4�����.����;?�20 increased from 29 in ADF VIII to 31 in ADF X (Appendix 3, Table A3.6).21 Country allocations for ���������3� �������3����������� ������;?���,���������+���������+�Pakistan, Afghanistan, and Nepal, in descending order) collectively accounted for 64% of total approvals (Table 2) and about a similar share of actual disbursements.22 Average annual per capita ADF approvals by ADF cycle are presented in Table 3, which shows that, as �Z �����+��������+������ ������+�������������;?������������������ ���capita ADF approvals.
D. Allocation of ADF Resources by Sector and
Theme
19. The combined share of energy, and transport and information and communication technology [ICT] projects (largely dominated by road construction and rehabilitation) almost doubled to 40% from ADF VIII to ADF X, while the combined share of agriculture and natural resources (ANR) and education projects declined from 36% to 17% during the review period (Table 4). The share of other sectors did not ������� ������������&� W��� ������ �� ���� �������������� ��������� ����been pronounced in ADF-only countries, where the share of energy and
20 Includes India, which accounts for 50% of the total number of poor in Asia and the Pacific (960 million) as per the international poverty line of $1.25 (purchasing power parity); however, India does not currently have access to ADF.
21 Azerbaijan became eligible during ADF VIII, followed by Armenia, Georgia, Palau, and Timor-Leste during ADF IX. In early 2009, Indonesia graduated from being ADF eligible. Only 17 countries were eligible for ADF resources when the Fund was established.
22 Examining the actual ADF disbursement for the period under review, the highest amount of ADF resources has been disbursed to Pakistan ($3.2 billion), followed by Bangladesh ($2.4 billion), Viet Nam ($2.3 billion), Sri Lanka ($1.4 billion), and Indonesia ($0.74 billion). All these are blend countries. The next in order, having the highest ADF disbursements among ADF-only countries, is Cambodia with $0.69 billion.
The number
of ADF-eligible DMCs
increased from 29 in ADF
VIII to 31 in ADF X
Sector
Country Classification/Replenishment Period
ADF-Only Blendb Total
ADF VIII
ADF IX
ADF X ADF VIII
ADF IX
ADF X ADF VIII
ADF IX
ADF X
Agriculture and Natural Resources 17.2 15.3 10.4 23.0 12.6 13.4 21.0 13.4 12.2
Education 10.9 6.2 6.9 16.9 9.7 3.6 14.9 8.6 5.0
Energy 6.1 18.0 13.8 4.7 1.8 9.0 5.2 6.7 11.1
Finance 3.9 8.3 3.7 3.7 3.6 2.0 3.8 5.0 2.7
Health and Social Protection 3.3 2.2 3.7 2.5 6.3 4.9 2.8 5.4 4.4
Industry and Trade 4.7 1.7 0.6 4.4 1.5 2.8 4.5 1.6 1.8
Multisector 17.8 0.9 9.0 8.5 26.4 10.0 11.7 18.5 9.6
Public Sector Management 7.3 8.8 3.2 10.2 9.7 18.6 9.2 9.4 12.1
Transport and ICT 21.2 33.0 40.9 13.8 13.7 20.8 16.3 19.6 29.3
Water and Other Municipal Infrastructure and Services 7.7 5.7 7.8 12.5 14.6 14.9 10.8 11.8 11.9
Total 100.0 100.0 100.0 100.0 100.0 100.0 100.0 100.0 100.0
Total Approved Amount ( million) 1,927.3 2,453.4 2,668.3 3,705.3 5,548.6 3,633.1 5,632.6 8,001.9 6,301.4
Table 4: Amount of ADF Loan and Grant Approvals,a by Sector
(percent share of ADF replenishment period total)
ADF = Asian Development Fund, ICT = information and communication technology. a Excludes regional loans and grant approvals in ADF IX amounting to $34.5 million ($33.0 million in the health and social protection sector, and $1.5
million in transport and ICT).b Only the ADF component of a blend financing is counted. Includes Cook Islands and Indonesia, which at the time of loan approval were still ADF
eligible.Source: Controller’s Department (Appendix 3, Table A3.8, which shows ADF approvals by sector during the review period 2001–2010).

1010
The Asian
Development
Fund
Operations
transport projects increased to 55% of ADF approvals during ADF X. By comparison, blend countries received more ADF funds for operations ����������������������������+� �.������������������������;%+�����3�������������������� ��� ��������������������������� �;'�¡&�;��������<!�������� �������������������������������������3������projects in core areas of operations under Strategy 2020. The share was substantially higher in ADF-only countries (more than 66%) than in blend countries (more than 47%).
20. Except for some deviations, ADB’s allocation of ADF resources to different sectors generally followed the indicative sector allocations provided in ADF donor reports. In ADF X (2009–2010), the approval ������� ��� ������������� �� �������������������������������3�������������������������������������������������������������������Strategy 2020. Similarly, the share of ANR deviated from the indicative �������$������������&�:������������%��� ����Z�9+�W�.����9&"%&��������levels of support for ANR may have been partly driven by client demands as a result of spiraling food prices and increasing concerns about food security.
21. In general, the presence of various themes in ADF operations ���� �� ����� ���� ���� �����3� ����&� �3����+� ��� ��� �������� ��accurately assess the thematic allocation of ADF resources during 2001–2010 for two reasons: (i) the full loan/grant amount is counted ������������� �����������������������������+��������%���,-���������������������������������������������������&23 Before 2009, a project �� �����������.����������������� ���������������+�.���������������������������� ����������������������������������������������&�W�.���:���3������ ����������������������� �������� ��������������portfolio. In broad terms, economic growth has been consistently the dominant theme in ADF operations. It received a further boost ��������������������&�W���� ���������������[�������������� ��������infrastructure-led growth, consistent with core areas of operation stated in Strategy 2020. Likewise, environmental sustainability, private sector development, and regional cooperation have emerged as growing themes due to the strong emphasis on these areas in ADF operations. The gender equity theme, which had declined sharply during ADF IX, was revived during ADF X. Capacity development as a theme was introduced in ADF IX, which could have reduced thematic �������������� ������ ���������&� W��� ������ � ������ ����� �����showed only a modest increase during the three replenishment periods. Details are provided in Appendix 3, Table A3.10.
23 Prior to 2004, projects/programs were classified according to seven themes: economic growth, human development, good governance, environmental protection, gender and development, private sector development, and regional cooperation. The classification system was further adjusted to support monitoring and reporting on sectors, thematic, and target areas. Economic growth was renamed sustainable and pro-poor economic growth; human development became inclusive social development; good governance was changed to governance; environmental protection became environmental sustainability; and a new theme, capacity development, was introduced. Private sector development and regional cooperation remained unchanged. In order to align with Strategy 2020, the thematic classification was further adjusted in 2009. Sustainable and pro-poor economic growth was designated as economic growth; inclusive social development became social development; gender and development was changed to gender equity; and all others remained unchanged. Prior to 2009, projects/programs could be classified into only up to three categories. ADF X operations can be classified into up to four themes.
Broadly, economic
growth has consistently
been the dominant theme
in ADF operations

1111
Financing ADF
Operations
(2001–2010)Theme ADF VIII ADF IX ADF X
Capacity Developmenta 36 63
Economic Growth 53 69 77
Environmental Sustainability 8 12 34
Gender Equity 24 18 22
Governance 26 27 24
Private Sector Development 9 16 24
Regional Cooperation 7 14 31
Social Development 36 39 42
Table 5: Thematic Distribution of ADF Operations
( of number of projects or programs)
ADF = Asian Development Fund. a Capacity development as a theme was introduced in ADF IX.Note: Themes for ADF VIII and ADF IX are restated as per footnote 23.Source: Asian Development Bank Database on Loan, Technical Assistance, Grant and Equity Approvals; Thematic classification of loans and grants from Central Operations Services Office (Appendix 3, Table A3.10).
E. Other ADF Resource Allocation Patterns
1. Allocation for Blend Countries
��&� '�����+�$>�����������������������.�����.��3���������.�����both ordinary capital resources (OCR) and ADF support—accounted for $12.9 billion of ADF approvals in 2001–2010. The share of ADF in total ADB assistance to blend countries has been declining over the three replenishment periods (40% in ADF VIII, 35% in ADF IX, and 30% in ADF X). Seventy-six percent of ADF in these countries was used for �������������������������������}?������������<"����������'''+�=6���������'�+�����6!����������%��� ����Z�9+�W�.����9&$$%&��������������share of these stand-alone ADF projects provided support for ANR, social sectors, and water and sanitation, often in rural areas (Table 6). During ADF X, blended ADF-OCR funding was used exclusively for ��������������������;� ������&�W���������}?�����������.�������projects/programs increased from 2.7 in ADF VIII to 3.8 in ADF X. Thus, �;?���� �������������� �������3�������3����������������������&�
Borrowers eligible for
both OCR and ADF support
accounted for 129 billion
of ADF approvals in
2001–2010
Sector
ADF VIII ADF IX ADF X ADF VIII–X
ADF Only
ADF Blend
Total ADF
ADF Only
ADF Blend
Total ADF
ADF Only
ADF Blend
Total ADF
ADF Only
ADF Blend
Total ADF
Agriculture and Natural Resources 26.2 15.6 23.0 14.2 6.8 12.6 16.8 0.0 13.4 18.1 8.5 15.8Education 24.4 0.0 16.9 12.4 0.0 9.7 4.5 0.0 3.6 13.2 0.0 10.0Energy 0.0 15.2 4.7 0.0 8.2 1.8 8.6 10.6 9.0 2.6 11.4 4.7Finance 4.5 1.8 3.7 4.1 1.6 3.6 2.5 0.0 2.0 3.7 1.3 3.2Health and Social Protection 2.2 3.1 2.5 8.1 0.0 6.3 6.1 0.0 4.9 5.9 1.1 4.8Industry and Trade 4.6 3.9 4.4 2.0 0.0 1.5 3.5 0.0 2.8 3.1 1.4 2.7Multisector 2.6 21.9 8.5 31.2 9.4 26.4 12.5 0.0 10.0 18.2 11.8 16.7Public Sector Management 4.2 23.9 10.2 4.0 29.9 9.7 10.1 52.8 18.6 5.9 33.0 12.4Transport and ICT 16.7 7.1 13.8 7.9 34.4 13.7 20.1 23.7 20.8 13.8 21.8 15.7Water and Other Municipal and
Infrastructure Services14.7 7.5 12.5 16.0 9.6 14.6 15.3 13.0 14.9 15.5 9.6 14.1
Total 100.0 100.0 100.0 100.0 100.0 100.0 100.0 100.0 100.0 100.0 100.0 100.0Total Approved Amount
( million) 2,567.7 1,137.6 3,705.3 4,332.7 1,215.9 5,548.6 2,913.1 720.1 3,633.1 9,813.5 3,073.5 12,887.0
ADB = Asian Development Bank, ADF = Asian Development Fund, ICT = information and communication technology. a Includes loans and grants. Source: Asian Development Bank Database on Loan, Technical Assistance, Grant and Equity Approvals.
Table 6: ADB Financing of Projectsa in Blend Countries, by Sector
(2001–2010; share in terms of amount)
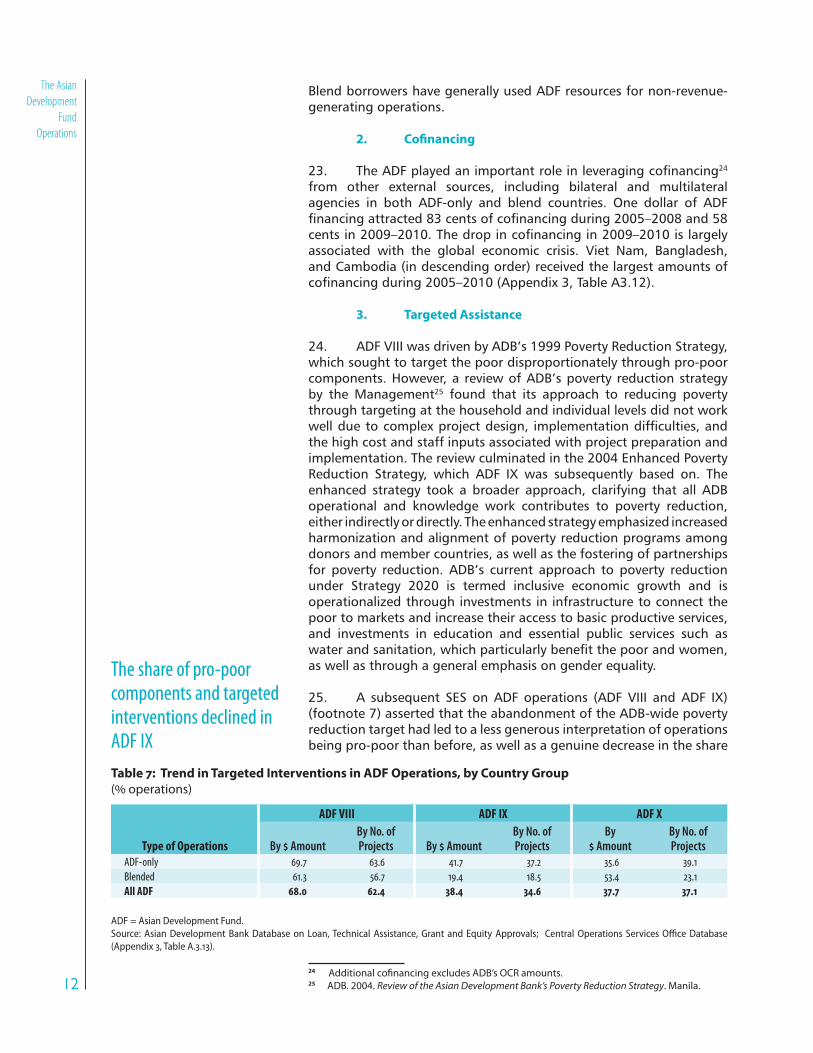
1212
The Asian
Development
Fund
Operations
Blend borrowers have generally used ADF resources for non-revenue-generating operations.
2. Cofinancing
�9&� W������� ����������� ���������������������������������24 from other external sources, including bilateral and multilateral agencies in both ADF-only and blend countries. One dollar of ADF �������������������69��������������������������!!:#�!!6�����:6�����������!!"#�!$!&�W����� ������������������!!"#�!$!������������associated with the global economic crisis. Viet Nam, Bangladesh, and Cambodia (in descending order) received the largest amounts of ������������������!!:#�!$!��� ����Z�9+�W�.����9&$�%&�
3. Targeted Assistance
24. ADF VIII was driven by ADB’s 1999 Poverty Reduction Strategy, which sought to target the poor disproportionately through pro-poor components. However, a review of ADB’s poverty reduction strategy .�� ���� ;���������25 found that its approach to reducing poverty through targeting at the household and individual levels did not work 3������������ ��Z� ������������+� �� ���������������������+�����the high cost and staff inputs associated with project preparation and implementation. The review culminated in the 2004 Enhanced Poverty Reduction Strategy, which ADF IX was subsequently based on. The enhanced strategy took a broader approach, clarifying that all ADB operational and knowledge work contributes to poverty reduction, either indirectly or directly. The enhanced strategy emphasized increased harmonization and alignment of poverty reduction programs among donors and member countries, as well as the fostering of partnerships for poverty reduction. ADB’s current approach to poverty reduction under Strategy 2020 is termed inclusive economic growth and is operationalized through investments in infrastructure to connect the poor to markets and increase their access to basic productive services, and investments in education and essential public services such as 3������������������+�3����� ������������.���������� ������3���+�as well as through a general emphasis on gender equality.
25. A subsequent SES on ADF operations (ADF VIII and ADF IX) (footnote 7) asserted that the abandonment of the ADB-wide poverty reduction target had led to a less generous interpretation of operations being pro-poor than before, as well as a genuine decrease in the share
24 Additional cofinancing excludes ADB’s OCR amounts.25 ADB. 2004. Review of the Asian Development Bank’s Poverty Reduction Strategy. Manila.
The share of pro-poor
components and targeted
interventions declined in
ADF IX
Table 7: Trend in Targeted Interventions in ADF Operations, by Country Group
( operations)
Type of Operations
ADF VIII ADF IX ADF X
By AmountBy No. of Projects By Amount
By No. of Projects
By Amount
By No. of Projects
ADF-only 69.7 63.6 41.7 37.2 35.6 39.1
Blended 61.3 56.7 19.4 18.5 53.4 23.1
All ADF 68.0 62.4 38.4 34.6 37.7 37.1
ADF = Asian Development Fund.Source: Asian Development Bank Database on Loan, Technical Assistance, Grant and Equity Approvals; Central Operations Services Office Database (Appendix 3, Table A.3.13).

1313
Financing ADF
Operations
(2001–2010)
of operations with special pro-poor components in ADF IX. The reduced emphasis on targeted interventions from ADF VIII to ADF IX is evident in Table 7. Appendix 3, Table 3.13 provides detailed statistics.
4. Grant Assistance
26. Grants are a relatively new feature in the ADF, introduced in 2005 (ADF IX) to (i) reduce the debt burden of the poorest countries, (ii) assist poor countries in accelerating their transition from post-��[���������������� ������������.�����+�����%���.����'�@�'������������communicable diseases, and (iv) offer priority TA.26 They have been used ��������������� ����������� �+� ��4��[���+�������.�4������������;?�&���������!!:#�!$!+���,�� �����79&<��.��������$><�������operations, mostly for investment projects (82% in ADF IX and 89% in ADF X by amount). Grants went mostly to ADF-only countries (Table 8). Afghanistan and Nepal have been the largest recipients of grants, accounting for 36% and 17% of total grant approvals, respectively. The next group of recipients included Cambodia, Lao PDR, Kyrgyz Republic, and Tajikistan (collectively 31%). Limited grant funding was used to �� ����3���������������� ������+���������������������������������������� ����� ���� ���� �������� ���� $!� ������� �"� � 3����� 3����stand-alone, with 7 in health) in blend countries. Detailed country-wise grant approvals are given in Appendix 3, Table A3.14.
27. Table 9 shows the sector-wise distribution of ADF grants by project modality. Transport and ICT (largely dominated by roads) received the largest share of total grant approvals during 2005–2010 (37%), followed by energy (16%) and ANR (13%). Support for �������������� �������+� ����������+� ����� ��� ���� '?W+� ���� �;'�%�collectively accounted for 65%, although the two other core areas � �������� ���������� ���� ������%� ��������� ���� =�� ���� ��+���� ��������&� ��*�3���+� ������ �� ��� �� ;�|4�������� ������� ����+���������+������������������ �������� ���¡+������;'�%�������������was 33% during the same period. Grant allocations thus nearly mirrored general sector allocation patterns for ADF-only countries. Details are provided in Appendix 3, Table A3.15.
26 ADB. 2004. ADF IX Donors’ Report: Development Effectiveness for Poverty Reduction. Manila (para. 78).
Table 8: Distribution of ADF Grants, by Country Classification ( share of total grants)
Country Group
Percent Share
ADF IX ADF X 2005–2010
ADF-Only 90.8 100.0 95.5
Program 15.1 10.2 12.5
Project 75.7 89.8 83.0
Blend 7.3 0.0 3.5
Project 7.3 0.0 3.5
Regional 1.9 0.0 1.9
Total 100.0 100.0 100.0
Total Amount ( million) 1,745.3 1,878.5 3,623.8
ADF = Asian Development Fund.Source: Asian Development Bank Database on Loan, Technical Assistance, Grant and Equity Approvals; Thematic classification of loans and grants from Central Operations Services Office (Appendix 3, Table A3.14).
Afghanistan and Nepal
have been the largest
recipients of grants, a
relatively new feature of
the ADF

1414
The Asian
Development
Fund
Operations
5. Program Operations
28. In comparison to the ADF periods prior to ADF VIII, the role of program operations increased substantially (2.6 times) during the review period (2001–2010) (Table 10). This was not only in response to a recognized need for policy reforms, but also due to increasing demand for budget support in countries affected by economic crisis.
29. In all, ADB approved 112 program operations using ADF �����������������7>&>�.��������������!!$#�!$!+��������������;��>!�%+� ����������� ������� �$<�%+� ���� ���� ������� ������ �$:�%�(Appendix 3, Table A3.17). Greater emphasis on governance increased ������������ ����������;� �������.��3���������'''���������'��by 65%. The 3-year moving average ceiling27 for program lending from �����������&:��3����Z���������������������������!!=#�!!"���<�%�due to the unusually high level of program lending to Pakistan in 2008 to address the economic crisis in the country. ADB also approved a waiver of the ADF program lending limit for 2008–2010 to enable it to ��� �������������������������.�����������������������������&28
27 ADB. 1992. Arrangements for Lending from ADF and TASF Operations Funded by ADF Contributions. Manila.
28 ADB. 2010. Proposed Waiver of the Asian Development Fund Program Lending Limit for 2008–2010. Manila.
Table 9: ADF Grant Approvals, by Sector and Replenishment (number of operations and percent amount)
Sector
Project Program
No. of OperationsPercent of
Amount No. of Operations Percent of AmountADF IX ADF X ADF IX ADF X ADF IX ADF X ADF IX ADF X
Agriculture and Natural Resources 12 9 10.9 13.1 1 0 19.0 0.0
Education 8 4 5.6 4.8 1 1 3.0 36.7
Energy 5 7 16.2 15.3 0 0 0.0 0.0
Finance 2 1 0.7 0.6 1 1 21.3 2.6
Health and Social Protection 12 4 8.5 2.4 1 1 3.4 5.2
Industry and Trade 2 0 1.1 0.0 2 1 4.2 7.9
Multisector 4 3 1.5 4.8 1 4 4.8 37.7
Public Sector Management 5 2 1.8 0.5 3 2 44.2 10.0
Transport and ICT 18 15 32.8 41.7 0 0 0.0 0.0
Water and Other Municipal 7 6 5.8 6.6 0 0 0.0 0.0
Infrastructure and Services
Total 75 51 100.0 100.0 10 10 100.0 100.0
Total Amount of Grants ( million) 1,482.5 1,687.6 262.8 190.9
ADF = Asian Development Fund, ICT = information and communication technology.Source: Asian Development Bank Database on Loan, Technical Assistance, Grant and Equity Approvals (Appendix 3, Table A3.15).
Table 10: Financing Modality, by ADF Replenishment Period (percent distribution of total amount)
Financing Modality ADF VI–VII ADF VIII ADF IX ADF X 2001–2010
Project 90.2 76.9 81.4 75.2 78.2
Program 9.8 23.1 18.6 24.8 21.8
Total Amount ( million) 11,993.4 5,632.6 8,036.4 6,301.4 19,970.4
ADF = Asian Development Fund.Sources: Asian Development Bank Database on Loan, Technical Assistance, Grant and Equity Approvals; Loan Financial Information System (Appendix 3, Table A3.16).
ADB approved 112 program
operations using ADF
resources totaling 44
billion during 2001–2010
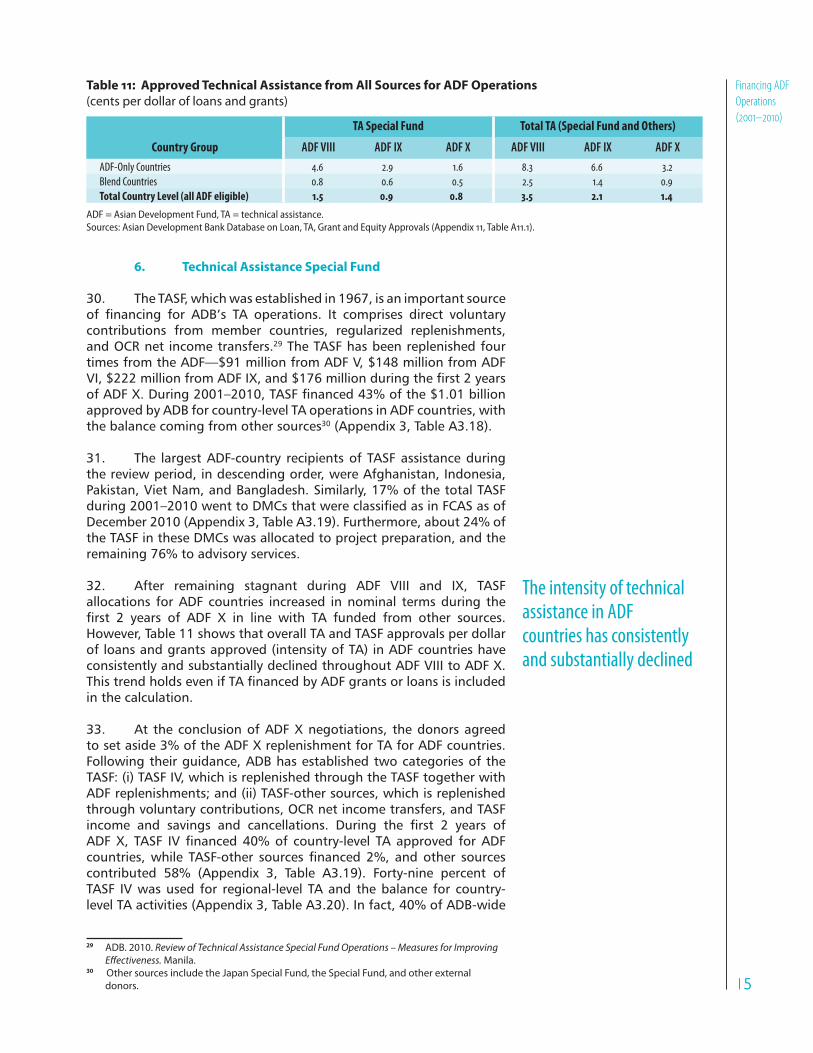
1515
Financing ADF
Operations
(2001–2010)
6. Technical Assistance Special Fund
30. The TASF, which was established in 1967, is an important source � ��������� �� ��,-�� W�� �������&� '�� �� ������ ������� ���������contributions from member countries, regularized replenishments, and OCR net income transfers.29 The TASF has been replenished four times from the ADF—$91 million from ADF V, $148 million from ADF �'+�7������������������'�+�����7$=<��������������������������������������&���������!!$#�!$!+�W������������>9�������7$&!$�.������approved by ADB for country-level TA operations in ADF countries, with the balance coming from other sources30 (Appendix 3, Table A3.18).
31. The largest ADF-country recipients of TASF assistance during the review period, in descending order, were Afghanistan, Indonesia, Pakistan, Viet Nam, and Bangladesh. Similarly, 17% of the total TASF ��������!!$#�!$!�3�������;?�������3���������������������?�������December 2010 (Appendix 3, Table A3.19). Furthermore, about 24% of ����W��������������;?��3�������������� ������ �� ������+���������remaining 76% to advisory services.
32. After remaining stagnant during ADF VIII and IX, TASF allocations for ADF countries increased in nominal terms during the ����� �� ������ � ���� �� ��� ����� 3���� W�� ������ ��� ����� ������&�However, Table 11 shows that overall TA and TASF approvals per dollar of loans and grants approved (intensity of TA) in ADF countries have consistently and substantially declined throughout ADF VIII to ADF X. W����������������������W����������.��������������������������������in the calculation.
33. At the conclusion of ADF X negotiations, the donors agreed to set aside 3% of the ADF X replenishment for TA for ADF countries. Following their guidance, ADB has established two categories of the TASF: (i) TASF IV, which is replenished through the TASF together with ADF replenishments; and (ii) TASF-other sources, which is replenished through voluntary contributions, OCR net income transfers, and TASF ������ ���� �������� ���� ������������&� ������� ���� ����� �� ������ ������+� W���� '����������>!��� ������4������ W��� ����� ��������������+�3����� W���4����� �����������������+���������� �������contributed 58% (Appendix 3, Table A3.19). Forty-nine percent of TASF IV was used for regional-level TA and the balance for country-level TA activities (Appendix 3, Table A3.20). In fact, 40% of ADB-wide
29 ADB. 2010. Review of Technical Assistance Special Fund Operations – Measures for Improving Effectiveness. Manila.
30 Other sources include the Japan Special Fund, the Special Fund, and other external donors.
The intensity of technical
assistance in ADF
countries has consistently
and substantially declined
Table 11: Approved Technical Assistance from All Sources for ADF Operations
(cents per dollar of loans and grants)
Country Group
TA Special Fund Total TA (Special Fund and Others)
ADF VIII ADF IX ADF X ADF VIII ADF IX ADF X
ADF-Only Countries 4.6 2.9 1.6 8.3 6.6 3.2
Blend Countries 0.8 0.6 0.5 2.5 1.4 0.9
Total Country Level (all ADF eligible) 1.5 0.9 0.8 3.5 2.1 1.4
ADF = Asian Development Fund, TA = technical assistance.Sources: Asian Development Bank Database on Loan, TA, Grant and Equity Approvals (Appendix 11, Table A11.1).
1616
The Asian
Development
Fund
Operations
��������W����������!!"#�!$!�3��������������W����'���� ����Z�9+�Table A3.21). The growing emphasis on regional TA is understandable, given the importance of RCI under Strategy 2020. However, although ��������W������.�������������������+���������������������������������������3������ ����������4.�����W�+����������������������������with country-level strategies and programs.
1717
Performance
of ADF
Operations
34. In this chapter, the performance of ADF operations is analyzed ������.������������������������������������.���?��{�+��?�������related IED validations, and an in-depth analysis of project case studies in selected ADF countries. Available project evaluations and country case study project assessments cover 58% of projects approved during ADF VIII and 16% of ADF IX projects. Post-2008 CAPEs alone cover project- and country-level performance issues in ADF countries, which together account for more than half of ADF project approvals during the review period.31�¢ ������ ������ ���������+���������������recent SESs related to capacity development and project sustainability issues, as well as recent ADB initiatives to improve project performance were also reviewed to ensure the relevance of the conclusions and the ensuing recommendations.
A. Overall Success Rates for Country and Sector
Strategies and Programs, and Projects
1. Performance at the Country Level
35. IED assesses the success of ADB operations at the country level through CAPEs. In ADF-only countries, CAPEs essentially assess ADF performance, whereas in blend countries, ADF performance is not easy to differentiate from ADB operations funded from other sources. CAPEs are conducted at varying intervals and therefore do not necessarily capture the performance of ADF operations for approved operations in 2001–2010. Nevertheless, they do cover both completed and ongoing operations in the country at the time of evaluation and broadly capture unfolding developments. Table 12 gives a summary of CAPEs conducted in 12 ADF countries and their overall performance ratings. However, it needs to be kept in view that the CAPEs prepared in different years might have been prepared with different guidelines, norms, and expectations and are accordingly not strictly comparable. Detailed CAPE ratings are provided in Appendix 4, Table A4.1.32
36. CAPEs assessed ADB operations in Bangladesh, Bhutan, ?��.���+� ��� ���+� ;�����+� ¢�.�*�����+� ���� ����� ���� �� .��successful, whereas operations in Indonesia,33 Nepal, Pakistan, Papua New Guinea, and Sri Lanka were assessed as partly successful.�;��������������������������������3� �����3�������������.���;?�������
31 CAPEs were undertaken earlier for another four DMCs, which account for an additional 26% of ADF funds approved during ADF VIII-X. CAPEs for Kyrgyz Republic and Maldives are under preparation.
32 Country-specific CAPE findings are presented in respective reports prepared by IED and are available at http://www.adb.org/Evaluation/resources-list.asp?type=5&p=evalcape
33 Indonesia was eligible for ADF resources until early 2009.
Chapter 3 Performance of ADF Operations
Most ADF resources during
the review period were
received by DMCs that had
successful ratings

1818
The Asian
Development
Fund
Operations
had successful� �������� ������� ����� .�� �;?�� 3���� partly successful ratings ($9.1 billion compared with $6.6 billion). Among the countries with two CAPEs, the only ratings change occurred for ADB’s strategy and programs in Bangladesh, which improved from partly successful in 2003 to successful in 2009, due mainly to better strategic positioning and relevance through greater focus on disaster risk mitigation, governance, private sector development, and to improvements in project preparation, implementation, and results, as well as ADB portfolio management.
37. CAPEs attributed less than successful ratings at the country program-level mainly to: ADB’s lack of sector or geographical focus; lack of rigorous analysis of development problems; unaddressed government capacity issues, particularly in countries that were �� ���������� ������ ���������������� ���� ���� ��������� � �.������������������������������������������������� �������� �����������support and suboptimal use of resident missions; systemic sustainability issues affecting physical and social infrastructure sectors; and governance problems and an absence of sustained reform ���������� ���� �� ���������� �������&� ;��� ��������� 3���� �����than successful ratings were also affected by external shocks, political instability or civil strife (Indonesia, Nepal, Pakistan, Sri Lanka), which not only complicated consultant recruitment and project supervision, but more fundamentally, affected the commitment, focus, and capacity of governments to implement reform and investment programs. ���� �������� ������.��.��������� ������� ������������[����situations in Nepal and Sri Lanka, although political instability has been ����������� ��������.����������;?�+��������.�����*�����&� '{�-��recently completed Final Review Validation of the Country Partnership Strategy (CPS), 2009–2011 for Sri Lanka,34������������������������3-��successful rating, although it also noted continued issues related to the sustainability of project outcomes.
34 IED. 2011. Validation Report: Country Partnership Strategy: Sri Lanka, 2009-2011 Final Review. Manila:ADB.
ADF countries with less
than successful ratings
were also affected by
external shocks, political
instability or civil strife
Table 12: Country Assistance Program Evaluation Report Ratings for ADF Countries
Country
Coverage Period CAPE Ratings
First CAPE Second CAPE First CAPE Second CAPEADF-only Countries
Bhutan 1983–2003 (2005) 2001–2009 (2010) S S
Cambodia 1992–2002 (2004) 1998–2008 (2009) S S
Lao PDR 1986–2004 (2006) 2000–2009 (2010) S S
Mongolia 1991–2001 (2002) 1997–2007 (2008) S S
Nepal 1988–2003 (2004) 2004–2008 (2009) PS PS
Blend Countries
Bangladesh 1986–2001 (2003) 1999–2008 (2009) PS S
Indonesia 1990–2004 (2005) PS
Pakistan 1985–2006 (2007) PS
Papua New Guinea 1986–2002 (2003) PS-US
Sri Lanka 1986–2006 (2007) PS
Uzbekistan 1996–2004 (2006) 2002–2009 (2011) S S
Viet Nam 1999–2008 (2009) S
ADF = Asian Development Fund, CAPE = country assistance program evaluation, Lao PDR = Lao People’s Democratic Republic, PS = partly successful, S = successful, US = unsuccessful.Note: Figures in parentheses indicate year of the report completion.Source: Independent Evaluation Department database.

1919
Performance
of ADF
Operations
2. Project Performance
38. PCR analysis.35 Project success rates have varied over the years and with ADF replenishment period, although there was generally an upward trend prior to ADF VIII. Figure 2 shows success rate by year of approval and ADF replenishment period. The success rate over the ADF cycle was below 50% during ADF I–IV and steadily rose to 71% for approvals in ADF VII. According to the 2009 Annual Evaluation Review,36 the improvements during the 1990s were probably due to ADB carrying out institutional and related reforms called for in the ADF replenishment undertakings, including (i) adoption of new planning processes; (ii) establishment of a task force to improve project quality; and (iii) implementation of a number of policies and practices that have had a direct impact on the relevance, quality, and delivery of projects and programs. However, the success rate for ADF VIII approvals declined to 64%, possibly due to the greater availability of evaluation reports ����*�����+�3����� ����� ���������������������������������&37 The overall success rate for the period under review (ADF VIII–X) is 66% due to slightly improved ratings for projects approved during ADF IX (Appendix 4, Table A4.3). Since only 14 PCRs are available for ADF IX � �����+����������������������.�������'��������������.����������this stage.
35 The analysis of project success is based on available (self-)evaluations for 95 projects of the 466 projects approved from 2001 to 2010: 78 projects under ADF VIII (representing 46% of projects approved during that ADF cycle), 14 projects under ADF IX (7%), and 3 under ADF X (3%). Thirty-two of the associated PCRs have been validated by IED, which resulted in a downgrading of 8 PCR ratings. Success rates include highly successful and successful projects/programs, also described as successful or better, and are based on composite ratings for four criteria—relevance, effectiveness, efficiency, and sustainability.
36 IED. 2009. 2009 Annual Evaluation Review: Role and Direction of Self-Evaluation Practices. Manila:ADB.
37 For example, while for Pakistan 21 of 45 ADF-funded projects approved during the review period have been (self-) evaluated, only 2 of 47 approved Bangladesh projects have PCRs.
The overall success rate for
the period under review
(ADF VIII-X) is 66
Figure 2: Success Rates of ADF Operations (based on year of approval)
ADF = Asian Development Fund, IED = Independent Evaluation Department, PCR = project/program completion report, PPER = project/program performance evaluation report, PVR = project/program completion report validation report. Sources: Compiled from IED database of PCRs, PVRs, and PPERs based on latest performance assessment available (Appendix 4, Table A4.2).

2020
The Asian
Development
Fund
Operations
39. The small number of projects in some countries makes ���������������4��������� ��������������&�����������+���*�����+�with 21 rated projects/programs, stands out with a success rate of only 19% (Table 13). The causes that have precluded better performance in Pakistan are reviewed in detail in IED’s recent Annual Evaluation Review38 and include (i) weak or inappropriate design, (ii) weak political commitment, (iii) shifts in priorities and political impediments, and ���%�������������� �������&�'��������3�������������<$�+�������������rate for Pakistan projects approved during ADF VI–VII was already below the portfolio performance average of 70% for that period. Substantial increases in lending to the country during ADF VIII–IX possibly compounded existing capacity problems in an increasingly challenging macroeconomic and political environment. Excluding Pakistan, ADF performance reveals an overall successful rating of 80% (with projects at 84% and programs at 74%) for the period under review, an improvement over the 73% success rate for non-Pakistan projects approved during ADF VI and VII.
40. Contributing factors to project underperformance were ����������.������������?������������ ������������3�����������partly successful or ������������� Details are provided in Appendix 4, Table A4.4. With regard to project design, the three most frequent issues encountered in these underperforming projects were project designs that did not adequately consider country conditions (affecting 61% of the less than successful projects), project complexity (46%), and
38 IED. 2011. 2011 Annual Evaluation Review. Manila:ADB. (p. 11).
Excluding Pakistan, ADF
performance reveals an
overall successful rating
of 80
Table 13: ADF Project Success Ratings, by Country
Country
PCR ProjectSuccess Rates ()
Case Study ProjectSuccess Rates ()
ADF VI–VII ADF VIII–X 2007 SES 2011 SES
ADF-Only Countries
Afghanistan na 75 (4) na na
Bhutan 86 (7) 100 (2) na na
Cambodia 81 (16) 100 (7) na na
Kyrgyz Republic 71 (14) 83 (6) na na
Lao PDR 76 (25) 80 (5) 100 100
Mongolia 63 (19) 67 (6)
Nepal 71 (21) 0 (2) 40 64
Tajikistan 80 (5) 100 (9) na na
Blend Countries
Armenia na 100 (1) na na
Bangladesh 79 (38) 100 (2) 60 90
Georgia na 100 (2) na na
Indonesia 81 (16) 100 (1) na na
Pakistan 61 (28) 19 (21) 20 20
Papua New Guinea 14 (7) 0 (2) na na
Sri Lanka 76 (29) 60 (5) na na
Uzbekistan 100 (1) na na na
Viet Nam 93 (27) 100 (10) 20 70
ADF = Asian Development Fund, IED = Independent Evaluation Department, Lao PDR = Lao People’s Democratic Republic, na = not applicable, PCR = project/program completion report, PPER = project/program performance evaluation report, PVR = project/program completion report validation report, SES = special evaluation studyNote: Figures in parentheses indicate the number of projects that were rated.Source: Compiled from IED database of PCRs, PVRs, and PPERs based on latest performance assessment available, and IED staff assessments.

2121
Performance
of ADF
Operations
lack of stakeholder support (32%). The main implementation issues related to lack of institutional capacity for achieving project outputs/outcomes (57%); lack of continued political commitment (50%); and lack of adequate ADB implementation support (39%), particularly in terms of continued policy dialogue, the timely recruitment of good quality implementation consultants and contractors, staff expertise and continuity, regular interaction on the ground, and adequate �� ����������� ������������&� ������� ������� ������� 3���� ����������as the main causes of project failure in more than two-thirds of the cases, whereas project implementation issues played a lesser role, with changes in political commitment and cost overruns due to price changes being the main drivers. All of these points to the importance of good project design, which requires adequate stakeholder �����������+� ��� ��4�� ��� ��������� � ������4� ������ ����� �����issues and conditions, project approaches that match local capacity ���� ����������+������������������+����� � ������*�������������and mitigation.
41. Analysis of case study projects. Based on an analysis of their project performance reports, consultations with executing and �� ������������������+����������������.��������������������+39 69% of the case study projects were/are expected to be successful or highly successful, 28% ������ ����������� and 4% ������������ with success rates ranging from 20% in Pakistan to 100% in Lao PDR. In line with the general portfolio performance trend for ADF projects, the likely success rate of case study projects approved during ADF IX was almost identical at 68% compared to the rate of 67% for projects approved during ADF VIII. Without Pakistan, the success rate would have been 81%, implying that the performance of case study projects was at par with ADF projects in general for the review period.
42. There have been considerable improvements in the performance of the 25 projects that were earlier reviewed by the 2007 SES (footnote 7), with the success rate increasing from 48% to 72%, due mainly to stronger leadership by new government counterparts, the introduction of performance-based contracts for nongovernment organizations (NGOs) tasked with helping implement training and outreach programs, resolution of pending land acquisition issues, and improved implementation capacity of implementing agencies and ���������������������������������,4��������W��������W�.���$>%&�
39 The analysis covers 51 ongoing and completed projects (64 loans and grants) accounting for $1,155.3 million in ADF VIII and $1,286.1 million in ADF IX approvals, which represent 20.5% and 16.0%, respectively, of total ADF loan and grant approval volumes, and 15% and 13%, respectively, of total project numbers. As of 31 December 2010, 23 of the 64 loans (36%) had closed, and the rest were open or ongoing. Hence, the performance assessment is only a provisional assessment of the ongoing operations and is subject to change at completion. See paras. 8–9 for selection methodology. The sector coverage is similar to the overall ADF portfolio during the review period, except for a slightly higher share of ANR projects and fewer infrastructure projects. On the other hand, the share of targeted interventions is substantially higher. The resident missions concurred with the list of selected case study projects for the SES, with one exception for which a replacement project was mutually agreed upon by the resident mission and IED. The list of case study projects is in Appendix 4, Table A4.5. Appendix 4, Tables A4.6 and A4.7 summarize the sector coverage of the case study projects by DMC.
Inadequate consideration
of design complexity
and lack of stakeholder
support were critical
design issues for projects
being less than successful
Improvements in
performance of earlier
reviewed projects have
been considerable

2222
The Asian
Development
Fund
Operations
Table 14: Comparison of Assessments of Case Study Projects, by 2007
and 2011 Special Evaluation Studies
Actual or Likely Assessment 2007 SES 2011 SES Change
Highly Successful 3 1 -2
Successful 9 17 +8
Partly Successful 12 6 -6
Unsuccessful 1 1 Nil
Total 25 25
SES = special evaluation study.Sources: IED. 2007. Special Evaluation Study: Asian Development Fund VIII and IX Operations. Manila:ADB; project/program completion reports; project/program completion report validation; project/program performance evaluation reports; independent evaluation mission estimates (Appendix 4, Tables A4.8 and A4.9).
43. When projects were not successful, this was in many cases due to conceptual problems, weak stakeholder buy-in and/or capacity, lack of mechanisms to ensure the sustainability of project outputs and outcomes, or unforeseen risks that were not or could not be adequately mitigated.40� W��� ���������������� �������� �� �������� ����������.�� ����PCR analysis (para. 40).
44. The following lessons related to stakeholder buy-in were drawn based on the implementation experience of the case study projects: (i) whenever projects had strong government ownership and commitment at the highest level, they succeeded; (ii) ownership and commitment on the part of the executing and implementing agencies play an important role in creating the right environment for project implementation; (iii) prolonged and active involvement of NGOs ���� ��������� �����������+� ���� ������ ����� � .������������ ���the implementation of social or rural development projects facilitate appropriate implementation and prolonged maintenance of project assets; and (iv) frequent changes in implementing agencies or ������������������������������������������������������ ��+�and often lead to project failure.
3. Performance by Sector
45. Evidence from CAPEs suggests that ADB support for education, ������+������ ��+������;'��3���successful in most countries, while ANR ������;��� ���3���������partly successful (Table 15). The performance of ANR support worsened in Bangladesh, Nepal, and Uzbekistan because of lack of progress with sector reforms or maintenance issues for irrigation projects, but improved in the Lao PDR because of strengthened government capacity and framework conditions such as better ��������������������.���������������%��������������������������&���;4related support was generally dealing with more challenging development ����������� .�� ���*���� �� ����� ��������� ���� �������� ����������institutions and by restructuring state-owned enterprises and public ������ �������&� ���� ������ ������������ �� ����������� ���*�������
40 Examples of the last cause include security concerns that led to the cancellation of the border crossing and road safety components of Pakistan’s North West Frontier Province Road Development Sector and Subregional Connectivity Project because the sole contractor backed out. In the Rawalpindi Environmental Improvement Project in Pakistan, drainage work did not progress because local residents had encroached on the supposed drainage path. The scope of the Central Region Transport Networks Improvement Sector Project in Viet Nam was reduced by as much as 50% due to unexpected price increases for inputs.
Stakeholder buy-in,
strong government
commitment, and
ownership by executing
and implementing
agencies are important for
successful project
implementation
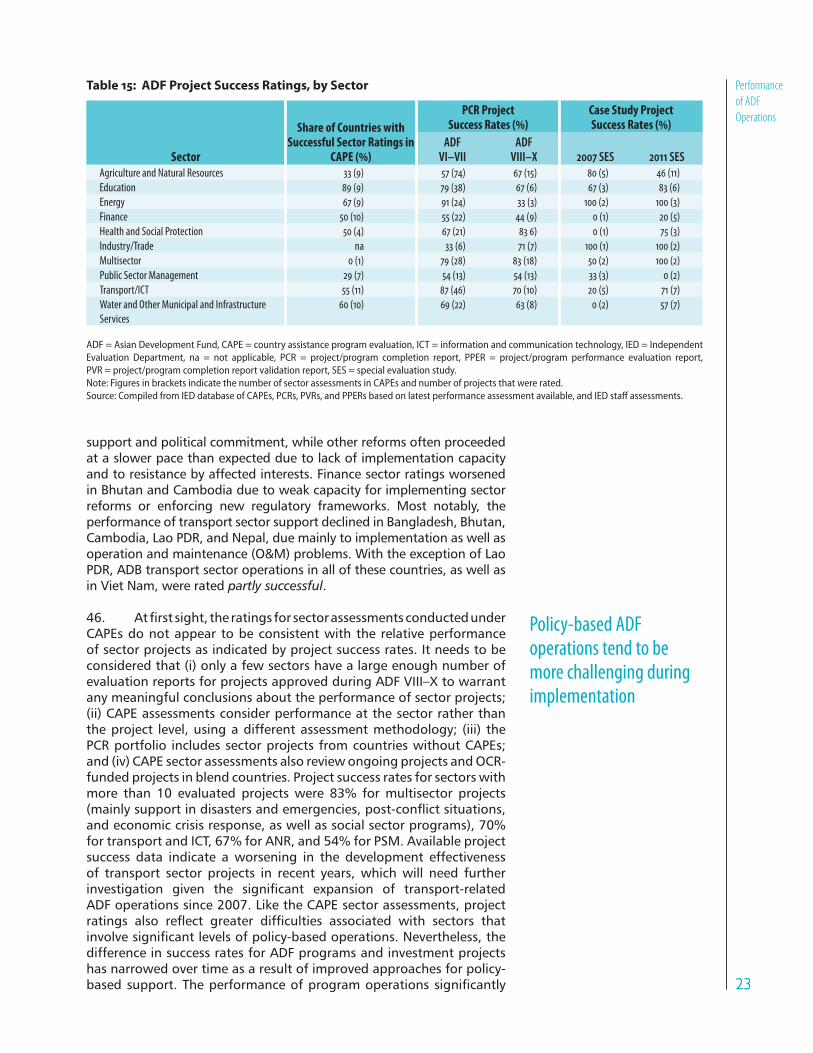
2323
Performance
of ADF
Operations
support and political commitment, while other reforms often proceeded at a slower pace than expected due to lack of implementation capacity and to resistance by affected interests. Finance sector ratings worsened in Bhutan and Cambodia due to weak capacity for implementing sector ������ �� �������� ��3� ���������� ����3�*�&� ;��� ���.��+� ����performance of transport sector support declined in Bangladesh, Bhutan, Cambodia, Lao PDR, and Nepal, due mainly to implementation as well as ������������������������}�;%� �.����&�����������Z�� ��������PDR, ADB transport sector operations in all of these countries, as well as in Viet Nam, were rated partly successful.
><&� �������������+������������������������������������������������CAPEs do not appear to be consistent with the relative performance of sector projects as indicated by project success rates. It needs to be considered that (i) only a few sectors have a large enough number of evaluation reports for projects approved during ADF VIII–X to warrant any meaningful conclusions about the performance of sector projects; (ii) CAPE assessments consider performance at the sector rather than the project level, using a different assessment methodology; (iii) the PCR portfolio includes sector projects from countries without CAPEs; and (iv) CAPE sector assessments also review ongoing projects and OCR-funded projects in blend countries. Project success rates for sectors with more than 10 evaluated projects were 83% for multisector projects ���������� �������������������������������+� ��4��[�������������+�and economic crisis response, as well as social sector programs), 70% ������� �������'?W+�<=�������+�����:>������;&�������.��� ������success data indicate a worsening in the development effectiveness of transport sector projects in recent years, which will need further ������������� ������ ���� ����������� �Z ������ � ����� ��4��������ADF operations since 2007. Like the CAPE sector assessments, project �������� ���� ��[���� �������� ����������� ���������� 3���� ������� ������������������������������� ����4.����� �������&�������������+�����difference in success rates for ADF programs and investment projects has narrowed over time as a result of improved approaches for policy-.������� ��&�W��� ���������� ������ ���������������������
Policy-based ADF
operations tend to be
more challenging during
implementation
Table 15: ADF Project Success Ratings, by Sector
Sector
Share of Countries with Successful Sector Ratings in
CAPE ()
PCR Project Success Rates ()
Case Study Project Success Rates ()
ADF VI–VII
ADF VIII–X 2007 SES 2011 SES
Agriculture and Natural Resources 33 (9) 57 (74) 67 (15) 80 (5) 46 (11)
Education 89 (9) 79 (38) 67 (6) 67 (3) 83 (6)
Energy 67 (9) 91 (24) 33 (3) 100 (2) 100 (3)
Finance 50 (10) 55 (22) 44 (9) 0 (1) 20 (5)
Health and Social Protection 50 (4) 67 (21) 83 6) 0 (1) 75 (3)
Industry/Trade na 33 (6) 71 (7) 100 (1) 100 (2)
Multisector 0 (1) 79 (28) 83 (18) 50 (2) 100 (2)
Public Sector Management 29 (7) 54 (13) 54 (13) 33 (3) 0 (2)
Transport/ICT 55 (11) 87 (46) 70 (10) 20 (5) 71 (7)
Water and Other Municipal and Infrastructure
Services
60 (10) 69 (22) 63 (8) 0 (2) 57 (7)
ADF = Asian Development Fund, CAPE = country assistance program evaluation, ICT = information and communication technology, IED = Independent Evaluation Department, na = not applicable, PCR = project/program completion report, PPER = project/program performance evaluation report, PVR = project/program completion report validation report, SES = special evaluation study.Note: Figures in brackets indicate the number of sector assessments in CAPEs and number of projects that were rated.Source: Compiled from IED database of CAPEs, PCRs, PVRs, and PPERs based on latest performance assessment available, and IED staff assessments.

2424
The Asian
Development
Fund
Operations
improved from 24% during ADF I–V (34 programs) to 57% in ADF VI–VII (37 programs) and to 63% in ADF VIII–X (40 programs). Likewise, the project success rate rose from 50% during ADF I–V (334 projects) to 72% during ADF VI–VII (267 projects), but decreased to 69% in ADF VIII–X (55 projects) (Appendix 4, Table A4.3).
B. Assessment of Strategic Positioning, Relevance,
Efficiency, Effectiveness, Sustainability, and
Development Impact of ADF Support
47. Table 16 summarizes CAPE component ratings based on ���� ������� ������.���?��{� �� ��� �� ����� ������&� ���*�� ��������+���������.�����+�����������������������.������������� �������������has been responsible for the less than successful overall performance ratings of some CAPEs, but has also affected a number of successful-rated country programs.
48. Table 17 summarizes project component ratings based on the latest available assessments for projects approved during the review ����&�W���������������������?��{��������+� ������������ �������������������������������.������������+�3��������������������������������in the following section.
1. Strategic Positioning
49. CAPEs for nine ADF countries (Bangladesh, Bhutan, Cambodia, ��� ���+� ;�����+� �� ��+� ��*�����+� ¢�.�*�����+� ���� ����� ���%�assessed strategic positioning to be at least satisfactory or higher. For two countries (Papua New Guinea and Sri Lanka), it was assessed as
Table 17: Project Component Ratings, by Type of ADF Country
Item
Share of Projects Rated Relevant
or Better ()
Share of Projects Rated Effective
or Better ()
Share of Projects Rated Sustainable
or Better ()
Share of Projects Rated Efficient or Better ()
Share of Projects Rated Successful or
Better ()
ADF-only 96 77 74 73 80
Blend 74 52 51 43 54
Blend (excl. Pakistan) 93 83 79 68 80
All Rated Projects 84 63 61 57 66
ADF = Asian Development Fund. Sources: Independent Evaluation Department database (Appendix 4, Tables A4.10).
Table 16: CAPE Component Ratings, by Type of ADF Country
Item
Satisfactory Strategic
Positioning or Better
Relevantor
Better
Effectiveor
BetterSustainable or
Better
Satisfactory Development
Results or Better
Efficientor
BetterSuccessful or
Better
ADF-only (5) 5 5 5 3 3 3 4
Blend (7) 4 5 1 2 1 2 3
All CAPEs (12) 9a 10 6 5 4a 5 7
ADF = Asian Development Fund, CAPE = country assistance program evaluation, IED = Independent Evaluation Department.a Strategic Positioning was not assessed for Indonesia. Contributions to development results were not assessed for two blend countries (Indonesia and
Papua New Guinea).Source: IED CAPE reports.

2525
Performance
of ADF
Operations
between satisfactory and partly satisfactory.
50. Country strategies generally were closely aligned with government development plans and priorities, and with national poverty reduction strategies. An exception was Sri Lanka, where several key components of the 2004 CPS (sector restructuring, deregulation, and privatization of state-owned enterprises) were initially appropriate, though not in line with the changed economic policy agenda of a new government. Country strategies also generally responded well to country development challenge—except for Papua New Guinea, where structural constraints to inclusive growth such as a dualistic economy, �������������4[���������������+������ ����� �������3�����3��*����levels remained largely unaddressed.
51. Sector interventions were usually well sequenced, although several CAPEs, including the Pakistan CAPE, pointed out the need for policy and institutional reforms to be implemented ideally ahead of, or at least in parallel with, sector investments to enhance their �����������+� ��������+� ���� ��������.�����&� '�� ���� ��������+� ��,�remained engaged in key sectors over the longer term, which increased chances for achieving meaningful development outcomes, as repeat interventions built upon and expanded the scope of earlier projects, and the design of follow-up projects often built on the achievements of and experience gained with previous projects.
52. In terms of sector selectivity, earlier programs in a number � ������ ���� ��������+� ������������ ��� ���+� ;�����+� ����Pakistan, suffered a lack of focus. However, in recent years country strategies sought to achieve greater sector selectivity, particularly after the introduction of Strategy 2020, through greater attention to infrastructure operations. Nevertheless, ADB remained engaged in ��;� �� ������ �� ����������� �������������������.��������+� ���3�������������������� �������������������������;?�&���,��Z�����from the health sector in a number of ADF countries including Bhutan ����?��.���+���������������������������������������������������development despite these being core operational areas under Strategy �!�!&�?��{����?��.���+�;�����+��������������������������*�of geographical focus or subsector selectivity continued to be an issue in these countries and needed to be addressed to ensure critical mass, reduce overhead costs, and achieve sustainable results.
:9&� ;���?��{������������������,�������������������������address private sector development and environmental sustainability, either on a stand-alone basis or through mainstreaming in sector operations. In a number of countries, related ADF performance targets were not being met.
54. ADB’s efforts with regard to harmonizing its strategies and programs with those of other development partners were assessed to be satisfactory. In the case of Bangladesh, the CPS was developed in partnership with the government and its main development partners.41 In Bangladesh, Cambodia, and Nepal, ADB supported sector-wide approaches (SWAps) in education with other aid agencies.
41 For details, see IED. 2009. Bangladesh Country Assistance Program Evaluation. Manila:ADB.(pp. 26–29, paras. 94–110.
ADB could have done
more to address private
sector development
and environmental
sustainability

2626
The Asian
Development
Fund
Operations
2. Relevance
::&� �����������?��{��������+� �����������$!������$�����������remained �������� (��� �������� in the case of Nepal), while those in Pakistan and Sri Lanka were ������ ��������. ADB’s programs were generally responsive to changing needs and priorities as a result of government changes, natural disasters, or economic crises, with the exception of earlier programs in Sri Lanka.
56. PCRs assessed 39% of the ADF projects approved during the review period to be ��� �������� and another 45% as �������� (Appendix 4, Tables A4.10–A4.12), which would imply that (i) ADF projects were generally consistent with the country’s development priorities and ADB’s country and sector strategies, both at appraisal and at evaluation; (ii) the quality of project preparatory work and ������������������������������������������������������ �����results was adequate; and (iii) the resulting selection of project designs �������������������������3���� � �����&�
57. Then again, some CAPEs pointed out that in a number of cases, project design could have been more responsive to local conditions, adopted more holistic approaches, or been based on wider analysis of available technical or policy options. Given ADB’s long-����������������3�����������;?���������������������������������+����� ���� ����� �������+� �������������������������� ��������������would seem to be avoidable. ADB’s reliance on outside consultants for project design and implementation; its high staff turnover; and, in some cases, the lack of wider stakeholder consultation and long-term policy dialogue and continued (sub)sector engagement were found to have contributed to this problem. Involvement of resident mission staff in project processing might be helpful.
58. In Pakistan, the CAPE found that the complexity of project designs associated with the large number of federally administered and provincially delivered multi-province and multisector projects led ����.��/������� ����������� �.����+������������������.��'{�-��recent review of case study projects. PCRs deemed 11 of the 21 assessed projects in Pakistan to be less than relevant, due to ambitious project and ���������������������������������������[������������������������risks, adequately consider political and related institutional governance constraints, and obtain buy-in from relevant stakeholders.
59. Also, 45% of the case study projects were found to have had design problems, and 37% subsequently underwent a change in scope (Appendix 4, Table A4.13). The review of case study projects revealed the following key lessons related to project design: (i) project complexity needs to be matched with a country’s institutional capacity;42 (ii) a thorough diagnostic problem analysis is a precondition for identifying and prescribing proper project and policy solutions and timeframes; (iii) counterpart implementation responsibilities need to .�� �������� ������� ���� ������������� ���%� �Z�������� ����������� ��|}�+������� ������+�����.��������������������+�3����� �������������
42 For example, many executing agencies perceived that small add-on project components to address the social issues emerging from infrastructure projects created implementation challenges if concerned executing or implementing agencies did not possess competency in such areas.
84 of completed
projects were rated
relevant or better
2727
Performance
of ADF
Operations
for the success of rural development and social infrastructure projects, often requires longer project gestation times and involves a learning process for government agencies, which have to be equipped to be able to effectively deal with new development partners.
3. Efficiency
<!&� ?��{��������,� �����������������������+����&+�,���������+�,�����+�?��.���+�;�����+�����¢�.�*��������.����������. Of these ��������+� ,���������+� ,�����+� ���� ;������ ���� �� ����� ������performance from a lower level to �������� assessment overall, although ��������� ������� ����� �������� ������&� ���+� �������� �����������,������3�������������������������������������.��� ��������������������������+�����?��{����������������������������������3��������� ��.�������������������� �� ������ ������������������������������projects, considering their comparatively costly nature and the limited ���.����.������������������ ������� �������������&�
61. CAPEs assessed ADB operations in seven countries to be less �������� or ������ �������� mainly due to concerns about process ��������������[������.����.����������� ������������������������3����.���������&�W�������������������� �����������������������+����������� ������ � �Z�������� ���� �� ���������� ��������� ���� �����������related ADB support, weak implementation arrangements, lack of good governance, frequent changes in project management, high staff turnover on the ADB and counterpart sides, limited counterpart ������+� �������� � /�������� ����� ���������+� ���������� ��� ��,�and government procedures, resettlement issues, slow responses from ADB headquarters, limited familiarity with ADB procurement policy and procedures, and problems with the recruitment of consultants ���� ���������������������������&�W������������'{�������������the case study countries.43
62. The PCR review found that only 57% of evaluated projects were rated �����������.�����&��������������*������������������.����������������������������3����������������+���������������������������� �������and reform programs. It is noteworthy that 20 of the 23 revenue-generating projects (among the 95 completed and rated projects in the portfolio), for which economic internal rate of return (EIRR) calculations were made at the time of project completion, achieved EIRRs in excess of the ADB threshold rate of 12%.44������������������������������������ ��� .���� ���� �������� ����� �� �3� ��������� ������ �������&�������+���������������������� �������� ���������������������������been the main reason. A number of ADB initiatives to improve process ����������� ����� ��������� ��� �� ����������� �� �������� � ���������ratings for ADF projects across the two recent ADF cycles, up from 56% for projects approved during ADF VIII (Appendix 4, Table A4.11).
43 Executing agencies in the case study countries cited several reasons for implementation delays, but the prominent ones were (i) limited familiarity with ADB procurement procedures and guidelines; (ii) delay in recruiting consultants and mobilizing them; (iii) unsatisfactory performance of implementation consultants, which required replacing them; (iv) inadequate capacity of executing and implementing agencies; (v) longer time taken for land acquisition; (vi) unfavorable weather conditions; (vii) slow response time for projects administered from ADB Headquarters; and (viii) varying requirements of multiple donors in a project. In addition, high staff turnover in both ADB and governments and limited harmonization between ADB and government procurement procedures were found to be responsible for delays.
44 Detailed data are provided in Appendix 4, Tables A4.14–A4.19.
Only 57 of evaluated
projects in the PCR review
were rated efficient or
better
2828
The Asian
Development
Fund
Operations
<9&� ��,���������� ����������� ������� ��� ��������� ���� ����� ����between loan approval and signing, as well as between signing and effectiveness, through measures that have increased project readiness prior to approval. For ADF-only countries, the time lag between loan approval and effectiveness declined from 219 days during ADF VIII to 194 days during ADF IX and to only 129 days for ADF X projects.45 Likewise, in blend recipient countries, the time lag was reduced from 251 days during ADF VIII to 179 days during ADF IX, and to 119 days for ADF X. The details are in Appendix 4, Table A4.20. To a certain �Z������������� �����������[����������3���� ��������� ������loans in the portfolio, which by their nature are quick-disbursing. With respect to ADF grant operations, the time lag between approval and effectiveness was also shortened from 150 days during ADF IX to 105 days for ADF X (Appendix 4, Table A4.21). ADB expects the systematic ����� ���������������������������������������������������&�
<>&� ;�����+������!!"�������������3�����������������46 shows that the contract award ratio47� ������������� �� ����� ���2001 to 2009 for both project and program loans. A disaggregated data analysis by ADF cycle reveals that the overall contract award ratio increased from 18% in ADF VIII to 28% in ADF IX and to 37% in ADF X (Appendix 4, Table A4.22). Overall, actual loan disbursements have consistently surpassed the projected levels since 2005, driven largely by program loans, particularly in recent years. Actual disbursements in �������������.��������� �������������������������������������������subsequent ADF cycles (Appendix 4, Table A4.23).
<:&� ��,�������������������������� �������� �����������������&�}�the 444 ADF loans approved during 2001–2010, 165 had closed (37%) by 31 December 2010.48 Of these loans, 72% required an extension.49 Based on data for closed loans with delays, the average delay was halved from 1.6 years in ADF VIII (n=114) to 0.8 years (n=36) in ADF IX (Appendix 4, Tables A4.27–A4.29). Although some of these improvements are associated with the growing share of single-tranche program loans, ����� ���� ��[���� ��������� ��� ��� ����� .�� ��,� �� �� ���� ������implementation performance including the use of project readiness ������+� ��3� ���������� ���� ���������� ������������ �������+� ����delegation of more projects to resident missions for administration, the introduction of regular tripartite portfolio reviews, and an increase in the levels of staff and resources for project administration purposes. Based on discussions with selected resident mission staff, measures such as advance procurement actions and appointment of procurement specialists in the resident missions have partly contributed to cutting project implementation delays. With effective implementation of ongoing and proposed measures to improve project implementation, the delays are expected to be further shortened.
45 Project/program commencement delay is based on data available for closed loans but excluding cancelled loans.
46 IED. 2010. Annual Report on 2009 Portfolio Performance. Manila:ADB. 47 This refers to the ratio of contracts awarded or actual commitments during the year to the
value of resources available for contract or commitment awards at the beginning of the year.
48 As of 31 December 2010, 61% of ADF VIII approved loans, 24% of ADF IX, and 11% of ADF X had closed.
49 Eighty three (50%) required one or two extensions and 30 (18%) required three or four extensions. Another three loans required five extensions, and two loans required six (Appendix 4, Tables A4.24–A4.26).
ADB has made significant
progress in reducing the
time lag due to better
project readiness
ADB has significantly
reduced project
implementation delays

2929
Performance
of ADF
Operations<<&� ��3� ������������ 3���� ���������� .�� ��,� ;���������� ��improve project implementation, including the streamlined business processes, and e-Operations projects (a system that aims to improve ����������������,-�� ������ ������������� �� ����������%&50 In 2010, a project implementation working group was formed, which recommended additional actions in three key areas: (i) achieving total project readiness; (ii) enhancing organization, staff skills, and incentives; and (iii) ensuring effective project implementation.51 Effective implementation and monitoring of these initiatives should �����.���� �3���� ������� �� ������ ��,� ������ ��������� �������+�although the impact on overall project effectiveness and success rates remains to be seen.
4. Effectiveness
67. CAPEs deemed ADB operations effective in six of the 12 reviewed countries with the exception of Bangladesh, Indonesia, Pakistan, Papua New Guinea, Sri Lanka, and Uzbekistan, which had less or partly effective operations. Appendix 5 shows the key outcomes and development results achieved with ADF support in various ADF countries based on available CAPE analysis, and explains reasons for ��������&� ?�����4� ������ ������ ���� ����� ������� � ������and sector support. For example, in Sri Lanka, changing development ��������+� ������ ��[���+� ���� ����������� �������� �� ��� �� ������restructuring reduced the effectiveness of ADB assistance, particularly ���� ����4.����� �������&� W��� ��*������ ?��{� ���������� ��������economy issues as a permeating theme, which reduced development results.
68. An analysis of CAPEs and sector assistance program evaluations shows that physical infrastructure investments (particularly in energy and transport) were more effective in achieving envisaged development outputs and outcomes than support related to capacity development and institutional or policy reforms. However, unless asset management and issues effecting the utilization of assets or demand for services are effectively addressed, infrastructure will not generate and sustain ������ ������� .������&� {��������� �������� �������� ����� ��stronger outcomes, not only are the results of individual projects and their sustainability important but vitally also their connectivity within and across sectors—with each other and with reforms in policies, administration and governance.
69. For rural infrastructure, there is also the need for complementary investments in other sectors. For example, potential socioeconomic
50 The Central Operations Services Office (COSO) has several ongoing initiatives that are expected to have a major impact on implementation and therefore on the success rate of ADB operations. Such initiatives aim at: (i) simplifying ADB procedures to standardize and accelerate processes such as revision of project implementation instructions (PAIs), the Project Processing and Portfolio Management (P3M) system – Manage Procurement, the Consultant Management System (CMS), Individual Consultant Selection (ICS), Loan Consulting Unit (LCU), and Internal Procurement Document Review System (I-PRES); (ii) improving procurement oversight; (iii) increasing procurement training and outreach through procurement accreditation, ”master classes” at headquarters, regional forums, and best practice dialogue; (iv) expanding DMC procurement and supply chain capacity development; and (v) increasing harmonization with multilateral development banks.
51 ADB. 2010. Good Project Implementation Practice. Report of the Project Implementation Working Group. Manila.

3030
The Asian
Development
Fund
Operations
.������� ��� ���� ����������� � ������ ����� 3���� ��� ��3���� �����realized if not coordinated with efforts to enhance rural income opportunities. Financed irrigation systems did not always translate into land improvements or increases in agricultural productivity in the absence of adequate extension services, marketing support, or value chains. Some rural water supply schemes did not result in expected increases in household connections due to affordability issues and lack �� ���������� ��������.������&�
70. Appendix 5, Table A5.1 analyzes the achievement of outputs and outcomes in selected sectors that received some of the largest shares of ADF support during the review period based on CAPE and ����������������� �����������������������&�'����������� ��������+����� ������� �������� ���� ����.��������� ���� � �������� � ��������highways and provincial roads and, to a lesser extent, the construction of new national, state, district and rural roads. Outputs targets were usually not fully but substantially met due to technical design problems, land acquisition issues, lack of contractor or government capabilities, and cost increases. Nevertheless, road projects generally ������������� �������+�������������+����������������������.�� �������vehicles, which in turn facilitated access to markets and services. There is evidence of substantially increased personal and commercial vehicle travel in most cases. However, the funding and management of new and existing transport infrastructure remains a key concern, as related policy dialogue and capacity development efforts were only partly effective.
=$&� ���� �� ��� �� ���������� �������+� ��������� ���� [��management generally resulted in land improvements. However, this did not necessarily translate into higher agricultural productivity, mainly due to lack of progress made on sector policy reforms determining economic incentives for production, lack of maintenance funding, and limited or less effective support for agricultural extension services, marketing, and rural credit.
72. Urban infrastructure (water and non-water) outputs and related outcomes were generally substantially achieved. Project investments resulted in improved service coverage and quality. Exceptions included situations where project components had to be cancelled because of cost escalations or households that could be connected to new services chose not to due to their inability or unwillingness to pay related charges. Very limited progress has been made with strengthening the capacity of local governments and urban utilities for managing urban ��������� ���������� ���� ���������&� �� ��� �� ��������� ���� ������ �nonrevenue water has not always had the desired level of success. There was considerable political resistance to implementing tariff reforms promoted under ADB programs. Progress made with policy dialogue �������� �� �� ������ ���� ��������� ������� ���� ��������.������ �urban service providers has been slow.
73. In the education sector, ADF support for the construction or upgrading of classrooms did not translate into expected increases in school enrollment rates when there were no effective measures to encourage the sustained utilization of project facilities (e.g., adequate salaries to attract and retain teachers, funds to enable poor children to attend schools, or funds to maintain facilities). Also, the quality of teaching and, subsequently, students’ performance did not always
Rural infrastructure
development needs
complementary
investment in other
sectors
3131
Performance
of ADF
Operations
improve substantially as support for teacher training stayed behind �������������������������������������������������������������.�������attendance of teachers; and institutional reforms to improve sector ��������� ��� ������ � /������� ���� ��������� 3���� ���� ������implemented.
74. Based on an analysis of PCRs for projects approved during the period under review, only 63% of evaluated projects reached most of their envisaged outputs and outcomes despite satisfactory project relevance at the outset.52 Differences in effectiveness rates for countries indicate the impact of (changing) country conditions such as governance and capacity issues, political instability, and internal ��[����+�����������.��3�������������������������������+��� ������effectiveness (with only 50% of projects in Afghanistan and 9.5% of projects in Pakistan rated as effective). In terms of sectors, relatively lower effectiveness ratings were determined for assistance for non-�������������� ������� ����� ��� ���+� ��������+� ������+� ���� ��;� ���57%, 50%, 56%, and 46%, respectively (Appendix 4, Tables A4.12).
75. Forty-three percent of reviewed program loans were not effective. A number of program loans were too ambitious and governments struggled with the implementation of required policy reforms, particularly under politically unstable conditions. Lack of institutional capacity to implement reforms has also been a contributing factor. Some programs covered a multitude of policy ������ ���� ��.����������� 3������ ������� ����� ������������ ��their own (e.g., the preparation of policy studies or draft regulations, or the establishment of committees)—to justify large amounts of budget support. Such levels of complexity created implementation and coordination problems. In the majority of cases though, program policy conditions were technically met, but many of them failed to produce adequate levels of meaningful outputs or outcomes, as they failed to address binding constraints to sector development. Lack of wider political support for substantial policy reforms rather than inadequate problem analysis was responsible for the selection of ineffective policy actions under program loans. Other factors leading to shortfalls in achieving intended program outcomes included: (i) the focus during program design and implementation on policy conditions rather than outcomes; (ii) unclear wording of program actions, which did not include a description of underlying principles and intent of the ���������������*����������������������������������������������what constitutes compliance and to monitor achievements (but making it easier to justify tranche releases in the absence of meaningful reform efforts); and (iii) a lack of follow-up on continued compliance.
76. Thirty-one percent of project loans with PCRs were not effective. Of these, almost all had problems achieving most of their envisaged outputs. The reasons for this included lack of stakeholder support, design and construction issues, lack of counterpart funds and implementation capacity, changes in external conditions, and the cancellation of project components due to cost overruns. Lack of output achievements prevented the attainment of project outcomes.
52 The large difference between relevance and effectiveness ratings appears to be indicative not only of project implementation problems, but also of relevance ratings that did not sufficiently consider project relevance at completion or design problems. The analysis of PCRs and case study countries found that most implementation issues were ultimately caused by design problems.
Conditions such as
governance and
capacity issues, political
instability, and internal
conflicts impact project
effectiveness
A number of program
loans were too ambitious
and governments
struggled with the
implementation of
required policy reforms
3232
The Asian
Development
Fund
Operations
77. Project cancellation data are indicative of effectiveness issues not only for completed, but also for ongoing projects. Of the 590 ADF loans and grants approved by ADB during 2001–2010, 136 (23%) had one or more cancellations at one stage or another (Appendix 4, Table A4.30). The total cancelled amount was about 27.4% of the approved amount, but 37 loans had more than half cancelled usually after a number of years of lackluster implementation. The biggest number of cancellations was for Pakistan (n=28) and Bangladesh (n=17) among the ADF countries. Among the sectors, most cancellations were for ���+� ��������+� ����� ��� ���� '?W+� ��;+� ���� �;'�&� W��� ���������with the highest cancellation rates for ADF loans and grants approved during the review period included Pakistan (a cancellation rate of 48%), Bangladesh (36%), and Sri Lanka (31%). Cancellations were due to a variety of reasons, including lack of stakeholder support, lack of effective demand for some credit lines, tranche cancellations under program loans due to altered or reversed reform agendas, and cost overruns or technical design issues leading to the cancellation of project components.
78. Lack of adequate result-orientation by ADB and its clients has contributed to effectiveness issues. ADB has used results-based frameworks for CPSs53 beginning in 2005. A number of CAPEs found that the CPS results frameworks were not used effectively to show or ��������,-�������.�����&��������������������3����[�3��+�3����many lacking baselines and deadlines, and some of them were so vague that no credible evidence on status or contributions could be reported. Also, some frameworks included too many indicators, which was not practical. However, the real problem with results frameworks has been that they have not been systematically used to judge ADB’s progress �����������������������������&����+����'{����������;��������������� ��������������;��%���������� ��������� �������������and monitoring frameworks had been slow due to poorly formulated indicators and output statements, and inadequate data sources.54 ;�������������������������*����� ������������,��� ���������� ������ ���� ������� ������� ����� �� .�� ���������+� ���������� � �����+����� ��[������ ��� ������ ��������� �� ���� ���� ?��� � �����&� W���new ADB guidelines for preparing results frameworks and monitoring results are an improvement as they measure ADB’s contributions to sector investment and institutional outputs, and link sector outputs to sector outcomes in a meaningful manner. Several CAPEs recommended that ADB also help develop results-based government sector investment and institutional development strategies.
5. Sustainability
79. CAPEs assessed ADB assistance to Cambodia, Lao PDR, ;�����+� ���� ���*�+� ���� ����� ���� ��� ������ �� �� �����������. Sustainability ratings improved for ADB support in Cambodia and Lao PDR. In Lao PDR, key concerns of weak sustainability mechanisms and institutional capacity raised in the previous CAPE (2006) had been substantially addressed. The 2010 CAPE concluded that ADB interventions were ������ �� �� ����������� in most of the sectors, noting that there had been substantial improvements in the availability
53 Prior to August 2006, CPS was known as country strategy and program. ADB. 2006. Further Enhancing Country Strategy and Program and Business Processes. Manila.
54 IED. 2011. Special Evaluation Study: Managing for Development Results. Manila:ADB.
New ADB guidelines
for preparing results
frameworks and
monitoring results are a
meaningful improvement

3333
Performance
of ADF
Operations
of budgetary resources; in other sustainability mechanisms such as cost recovery, environmental and social safeguards, and legal systems; and in institutional and human resource capacity. For countries with a less likely CAPE rating for sustainability, this was generally attributed to weak institutional capacity and high staff turnover in executing and implementing agencies, inadequate cost recovery in revenue-generating ������+������/����������������}�;+����*����������������� ������and slow pace of institutional reforms, and limited local ownership of ADB operations. For policy-based operations, sustainability issues were associated mainly with lack of continued commitment to political reform due to government changes, impact on vested interests, or lack of wider acceptability.
80. PCRs for ADF projects approved in the review period rated 61.3% of them most likely or ������ �� �� �����������. Project designs that had stakeholder buy-in and included mechanisms to ensure government commitment to recurrent cost funding, retention of staff trained by the projects, and involvement of relevant local stakeholders from the beginning with measures to empower their capacities in �.�������� ����� ��������� ���� ������ ��������� �� �������� ������outcomes and impacts were associated with higher ratings.
6$&� ������������ �������������+������ �������'?W+�������;�3����deemed ���� ������������ with the likelihood of sustainability at 46%, 44%, and 42%, respectively (Appendix 4, Table A4.12). Sustainability ������������������� �������3����������������������3�������������and institutional constraints. ADB has made efforts to address these issues, including through road funds in some countries (i.e., which are funded by dedicated road user charges and manage the revenues for road repair and maintenance), improvements in construction quality, and institutional reforms and capacity development. However, evidence from project case studies and CAPEs suggests that progress has been slow.
82. The review of PCRs under this evaluation has arrived at similar results as the recent ADB-wide study by IED on post-completion sustainability,55 which was based on 491 PCRs and concluded that 65% of both ADF and OCR operations are most likely or likely to �� �����������. The IED study found that project effectiveness and ��������� �� ��� ���������� ���� ��������.������ � ������ .������&���������.������ ��� ���������� 3���� ������� ������������ � ������������.�����+� �������� ���� ����������� �}�;%� ������������� ������������+� ��� 3���� ��� ��������� ����+� ������������+� ���*��+� ����regulatory environments. A higher proportion of projects that did not ��������������������������3��*�}�;��������������������������+�along with an unclear policy and regulatory environment, were less likely or �������� �� �� �����������. Evidence from that study also showed that PCR sustainability ratings had changed at project performance evaluation report stage for 45% of the reviewed projects. Proportionately more projects were subsequently downgraded. Rating upgrades were associated with exogenous factors, such as renewed growth in the economy, allowing larger maintenance allocations, or greater institutional stability. In other cases, rating upgrades were attributed to improved project management, including maintenance .��.�����������&�
55 IED. 2010. Post-Completion Sustainability of ADB-Assisted Projects. Manila:ADB.
Only 61.3 of ADF
projects were likely to be
sustainable
3434
The Asian
Development
Fund
Operations
83. The IED study concluded that a range of favorable factors contributed to the likelihood of project sustainability. These included an increase in public awareness of the concept of maintenance and ���� .������+� ������� ����� ���� ��������� ������ ����+� ������������for social sector projects. In the road sector, a good balance was needed between investments for network expansion and maintenance requirements for existing roads. Good construction standards and coordination on axle loads could reduce maintenance needs. In the energy sector, tariff reforms were more successful when accompanied by continued support for demand-side management. In water supply and sanitation, sustainability depended upon the capacity of the water companies to effectively manage their networks, and upon support for tariff charges that would eventually cover all costs, including those associated with expansion. Similarly, in education, prerequisites for likely project sustainability included continued government ��������� � }�;� �� ������ .��������� ���� ���������� ����� �� ������was completed. Government ownership and commitment to program �������3�������������������������*�����������.����������������������sector. In general, given the time it takes to achieve sector reform, prolonged government commitment and ADB support are required, ��������3����������/����� �������������� ���*�� ���������.����������monitored.
84. Also, a number of CAPEs recommended that ADB improve the sustainability of its operations through systemic policy dialogue �� ���/����� .������ �������� �� ���4��������� ����������� ��}�;�����������������+����3����������/�����W��������� ������������institutional capacity. The need for systemic approaches was emphasized in the 2010 Annual Evaluation Review,56 which noted that investment sustainability is not assessed at the macro level using a medium-����� ������ ����3�*� �� ���������� }�;� ������ ���� ����.�����&������������������������������������.��������� ����������������������sustainability issues in a more proactive manner through cost sharing, removal or reduction of public subsidies, tariff reforms, and private sector participation in the construction and maintenance of assets, the experience with these approaches—based on an analysis of case-study ����������� .���� ��Z��+� ������������� ���� ����������� ����������with obtaining stakeholder support.57
85. In terms of the crucial question of institutional sustainability, a majority of CAPEs found that ADB support for capacity development could be strengthened. For example, ADB usually did not undertake systematic upfront assessments of institutional capacity and capacity constraints. Assistance was often ad hoc and not part of a larger capacity ����� �������������������������&������������������;?������������������������������������������������ �.������������+������� ���was needed for developing the capacity of local government for
56 IED. 2010. 2010 Annual Evaluation Review. Manila:ADB. para. 25.57 Some of these approaches worked well for the Urban Governance and Infrastructure
Improvement (Sector), Second Urban Primary Health Care, and Secondary Towns Water Supply and Sanitation Sector projects in Bangladesh; the Northern Area Rural Power Distribution Project in Lao PDR; and the Community Groundwater Irrigation Sector Project in Nepal, although in case of the last, the subsequent government decided to reintroduce subsidies for tubewells. Also, unaddressed intergovernment arrears continue to threaten the financial sustainability of water utilities implementing the Central Region Water Resources Project in Viet Nam and the Northern and Central Regions Water Supply and Sanitation Sector Project in the Lao PDR.
Given the time it takes
to achieve sector reform,
prolonged government
commitment and ADB
support are required

3535
Performance
of ADF
Operations
����������� �������+��������������������+���������������������&������������������?��{����������������'{�����������������{����capacity development.58
86. Accordingly, the following seem to be the drivers of successful capacity development: (i) adequate and comprehensive capacity assessments that address all aspects of institutional performance at the central and local government levels in key sectors of ADB operations; (ii) strategic direction of capacity development efforts, including their incorporation in results-based sector strategies; (iii) clear results frameworks to measure and monitor capacity development; (iv) long-term continuity of capacity development approaches; (v) appropriate mix of modalities; (vi) mainstreaming of project management and implementation unit activities; (vii) participatory approaches, with strong agency commitment and ownership; and (viii) cooperation and harmonization with other development partners. In addition, holistic approaches to capacity development that also cover organizational and contextual issues—apart from strengthening technical capacity—������.����������&����+�?��{����������������;���������������support for strengthening country systems has not always been an integral element of sector assistance, and key initiatives relevant to ��������+�������������������������� ����������������������������� ���������+���������.���������������������������&�
6. Development Impact
87. At the end of the day, development impact deserves the greater ��������&� ,����� �� ������.��� ?��{� �������+� ��,-�� �����.������ ��development results in ADF countries ranged from modest/partly satisfactory (Bangladesh, Pakistan, Sri Lanka, and Uzbekistan) to ������������������������ �?��.���+�������+�;�����+�������������%�and somewhere in between (Bhutan, Nepal).
88. Seventeen of the 31 ADF-eligible countries had average annual gross domestic product growth in excess of 5% during the last ������+������������.����Z�� ������������������;?��.�����¤������Republic, Nepal, and Pakistan. This also helped reduce income poverty rates during 2005–2008 (Appendix 6, Table A6.1). Nevertheless, in a number of ADF countries (Lao PDR, Nepal, Papua New Guinea, Timor-Leste), the number of extreme and vulnerable poor has increased due to population growth. Extreme poverty, as measured as percentage of population living on less than $1.25 a day, remains high in Bangladesh, Lao PDR, Nepal, and Uzbekistan. Progress with the achievement of non-������;�|������.��������������+�3�������������������� �����;�|����������������*�������������+�,���������+�?��.���+����PDR, Papua New Guinea, Tajikistan, and Timor-Leste.59�;����������indicators are related to environmental targets and access to potable water and sanitation.
89. ADB likely contributed to development results in ADF countries, although the impact varied from country to country. There is a plausible nexus between ADB project and sector outcomes, and economic
58 IED. 2008. Special Evaluation Study: Effectiveness of ADB’s Capacity Development Assistance— How to Get Institutions Right. Manila:ADB.
59 ADB, UNDP, UNESCAP. 2010. Achieving the Millennium Development Goals in an Era of Global Uncertainty. Bangkok.

3636
The Asian
Development
Fund
Operations
growth and poverty reduction, although looking for a clear statistical ���������� � 3���+� ��� ���� �����+� .�� �������� �� ��� �� ���.��� ������� ������� �� ��������� �� ������ ���� � ���� �.���� �������� ����GDP for most ADF countries.60 ADF support likely contributed to sustained growth and, indirectly, a reduction in income poverty by (i) facilitating movement of goods, increasing labor mobility, lowering transport costs, and improving access to markets and services through investments in transport infrastructure; (ii) increasing the amount, ��������� ���� �����.������ � 3��� �� ����� ���� ������������ �������sources through sector reforms and public–private partnerships (PPPs); (iii) increasing agricultural productivity, mainly through investments in irrigation systems; (iv) improving urban services; (v) assisting a number of ADF countries in their long transition from centrally planned to more private sector-based market economies through support for the development of basic policy, legal, regulatory, and institutional ����3�*�����������������������������������������%� �������public sector management reform. Also, ADF investments had on average economic returns well in excess of 12%.
90. ADB sought to address the widening income gap between rural and urban populations, mainly through support for rural �������������� ���� ���� ����������� � ������ ����� ���� �����������������&�;��� �������3������������������� �����������������impacts, although higher income groups and more developed rural ������ ������� ��������� ��������.������&��������� ������� '{�������������������.�������� ������ ��������������3��������������� ���������substantial increases in rural incomes and living standards, but needed to be coordinated with other efforts to enhance rural income opportunities, social development, agricultural production, and trade.
91. Seventy-four percent of the case study projects were likely to have a positive impact on poverty reduction.61 Interestingly, there was little difference between the share of targeted and general interventions in terms of having likely poverty impact, which raises /�������� ���������� ���� �����.������ � ������ �������������� ���� ����relative effectiveness of targeted approaches in achieving poverty outcomes.
92. Direct ADF contributions to inclusive social development have been at a smaller scale due to lower assistance levels. ADF support for health, education, and water supply and sanitation development helped enhance access to improved essential services, thereby �����.������ �3����� ��4������ ;�|�+� ������������ ��� ���������that had received continuous support for these sectors from ADF and other sources. However, operations have been concentrated in a few ������������&������.�����;?�+�3���������� ����*� ������������������������3�����;�|��������+������������������������������� ���during the review period (Appendix 6, Table A6.2).
60 Official development assistance (ODA) accounted for 5.6% of GDP in ADF countries from 1995–2009, while ADF’s share in total ODA averaged about 10% during that period. Shares differed substantially by country.
61 This assessment is largely based on a review of project documents and interactions with government stakeholders. It does not reflect the views of primary beneficiaries. This would require a separate analysis.
Development impact of
ADF operations varied
from country to
country
ADF support helped
enhance access to
improved essential
services
3737
Performance
of ADF
Operations
93. The results of ADB support for promoting good governance by combating corruption and improving public sector management stayed below expectations in many client countries. Public sector management programs contributed to improvements in public ��������� ����������� ���� ����� ������� ���� �.���� ���������+� .���were less successful in reducing the scope for corruption, improving public procurement or supporting decentralization and devolution ����&� ,����� �� ��� ��������� � �� ������ ���������4����������projects approved during the review period, only 63% were assessed as successful in meeting this objective. Fourteen of the 51 reviewed ����������� ���������������������������������������������� ����Z�4, Table A4.31). However, just 64% of these projects were likely to actually improve governance. Although comparatively good progress has been made with regard to the development of new regulatory ����3�*�� ���� ���*��� �������������+� ��������� �������� ��� ��������� ��������� ������� ���������� ��+� ���������+� ���������+� ����dominated by the state, albeit less so than prior to ADB support. The �� ����������4���������������������������������������+�������and medium-sized enterprises has been limited, unless accompanied by policy reforms that ensured changes in existing funding strategies ���������� ���������������������������������&�


3939
Progress in
Areas Relevant
to ADF
Operations
Chapter 4
Progress in Areas Relevant to ADF Operations
94. The donors’ reports on ADF VIII, IX, and X contain crosscutting ����������@����������� ���������� �� ���� ����������� ��� �;?��(Appendix 1, Table A1.1). These are broadly grouped into two categories, operational and institutional. Since the focus of this report is on ADF operations, this chapter discusses largely those aspects directly pertaining to ADF operations. Concerning institutional areas, ADB presented a comprehensive progress report during the ADF X ;������� �����3� ��� ����.��� �!$!62 that covered various actions/�������������������*������� �������.��;���������&���*�3���+����'{���{�������� �� ���������;�����������,-��������������3�*�������������������������������������������;����������������� �������&�A discussion highlighting progress in key crosscutting areas follows.
A. Poverty Reduction and Millennium
Development Goals
95. In the last three ADF donors’ reports, poverty reduction has continued to be an overarching objective, with some variations in approaches to address this challenge. For example, in ADF VIII, added emphasis was placed on social development, including strengthening social capital, especially for people subject to social exclusion. ADF IX sought focus on capacity development, alignment of country performance ����������� 3���� �������� ������ ��������� ����������� ��� �;?�+� ����inclusive social development based on the assumption that each person should have the right to access basic education, primary health care, and other essential services. ADF X called for sustainable economic growth ������������������������������������������;�|�+���������������������focus on inclusiveness by promoting equitable access to basic education and health services along with opportunities for productive employment. }������+����������������-��� ��������� ������������ ���������������approaches for tackling poverty reduction.
"<&� ���� ��������� �� ������� �;?�� 3���� ������ ����� �� ������� �����������3������� �����������������������;�|�&���3�������������������������������3��� ��������+������������������������������home to the largest number of poor in the world. ADB formally adopted poverty reduction as its overarching goal in 1999, although it had been addressing this concern in various forms for several years. ADB’s approach to poverty reduction was extensively revised and revamped in 2004, when it shifted its emphasis to inclusive economic growth. ������������ �������������������������� �������������������������strategies, ADB began pursuing poverty reduction by attempting to ������ ���� .������� ����������� �� �;?�-� �������� ������� �����through poverty targeting. This brought about greater acceptance of
62 ADB. 2010. Stocktaking of the Reform Agenda, ADF X Midterm Review Meeting. Manila.
4040
The Asian
Development
Fund
Operations
“general interventions” as an approach for reducing poverty in the region, along with selective use of “targeted interventions.” These two approaches have been used as appropriate to each country situation. The related data were provided in the preceding chapter (para. 25), showing that the percentage of targeted interventions in terms of number of projects63 declined from 62.4% during ADF VIII to 34.6% �������'�&��3����+���� ��*���� ������������������������������9=&$��(Appendix 3, Table A3.13).64 The reason for the upturn is associated ��������3����������������� ��������������� �������������;?�&�
"=&� �� ������������3�������!!$#�!$!���� ������������������reduce poverty in the regional economies. While income poverty rates have come down substantially during the last two decades, the number of poor living on less than $2 a day has grown for the group of ADF countries due to population increases (Appendix 6, Table A6.3). Six out of 15 ADF countries for which data are available are off-track 3���� ������� ;�|� �������� �� ��������� �Z������ �����&65 Likewise, �� ��������|������������������������.�����$<����4�����.�����������+�of which only seven have registered improvements in income equality (Appendix 6, Table A6.4).
98. Non-income poverty remains a major challenge. Several indicators—of malnutrition, under-5 mortality, access to water and sanitation, environmental outcomes, and education, especially in relation ��3���������������.����������+�����������;?���������������*���������;�|�&�W�������������� ��� ��� ������������������������+�.��������������������.��������������������������������;�|�&�W���recent Development Effectiveness Review 2010 (footnote 63) observes, “…progress on other measures of human development ��������� �� ���������� ������� ����������� in the region was mixed and slower in the weaker ADF countries, particularly the ADF-only countries.”
99. Education and water are the two key areas where ADB has ������������.�����������������;?���������������������������������������������;�|�&��3����+�������������������������������������substantially, support for the education sector declined sharply in both real and nominal terms. Approvals for education amounted to $836.5 million in ADF VIII but decreased to $690.1 million in ADF IX and $314.3 �������������������������������������&�}���������������+�� ���������;'�����������������������7<$!&9����������������'''���7">"&>���������������'�&����������������������������������������������������stands at $748.1 million. The investments are largely concentrated in the urban areas, and proportionately more people in rural areas remain unserved. Detailed statistics on ADF sector allocations are provided in Appendix 3, Table A3.8.
100. Strategy 2020 states that ADB will also invest in rural infrastructure such as rural energy, rural water supply and sanitation, and rural roads. However, ADB does not collect related statistics so ��� ����������� ����������������������� ������� ���������������������
63 ADB. 2011. Development Effectiveness Review 2010 Report. Manila. 64 In terms of amount, the share of targeted interventions dropped from 68% in ADF VIII to
38.4% in ADF IX, and further to 37.7% in the first 2 years of ADF X.65 The MDG-related data were sourced from Paths to 2015: MDG Priorities in Asia and the
Pacific (ADB, UNESCAP, and UNDP), while the Gini coefficient is from Key Indicators for Asia and the Pacific 2010. Caution is warranted in interpreting the data, as the comparative figures were not updated for several countries to reflect their status in 2010.
The number of poor
living on less than 2 a
day in ADF countries has
grown due to population
increases
Achieving non-income
MDGs continues to be a
challenge

4141
Progress in
Areas Relevant
to ADF
Operations
to rural areas, including for infrastructure. Based on the review of operations approved during the review period in energy, water supply and sanitation, transport and ICT, multisector and ANR, IED estimates66 (presented in Appendix 6, Table A6.5) show a number of trends. First, the share of rural roads in total roads related approvals increased marginally in ADF IX compared to ADF VIII, but declined ���� ��� ��� ���� ����� �� ������ � ���� �� ��� ������ � .��� ���.��� �projects and amounts approved. Second, only two rural water supply and sanitation operations were approved in 2009–2010. Third, the share of approvals for rural energy declined sharply in ADF IX relative to ADF VIII both in terms of the number and amount, but increased in ADF X, largely due to a $151 million approved project in Viet Nam.67 Overall, the picture shows ADF support for rural infrastructure has been low, despite large increases in ADF resources in recent years. The Development Effectiveness Review 2010 (footnote 63), shows that ����������� ��������������+����������������+��������������+�and water and land improvement projects approved from 2005–2010 3���������������������������.��3�������������������������� ������projects completed around 2003–2009.68
101. Strategy 2020 also seeks to address pollution and environmental deterioration. Urban population and congestion as well as natural resource deterioration and loss of biodiversity are growing concerns, although they have not been fully analyzed here.
$!�&� ;��� �� �������+� ���� ��.��� ������� ������� ��� ������������to roll back some of the earlier achievements. It has not only slowed economic growth in the region (especially in smaller economies), but is also generating uncertainty and volatility. In addition, more frequent occurrences of natural disasters in the region, including droughts, �����/��*��+�����[��+����3�������������������������������+������exerted extra pressure on the population at the margin who could easily fall into the poverty trap. These emerging challenges will have to be addressed urgently lest they upset the pace of poverty reduction. The 2007–2008 food price spike serves as a reminder that investment ��������������� ����������� ��������;?�+���� ����������3���������������at the Investment Forum for Food Security69����;���������������!$!&����long as poverty reduction remains a mission for ADB, investment in agriculture will continue to be relevant, as large rural and vulnerable populations depend on that sector. ADB has prepared an operational ��������������.������������������������������������������&70 The plan ������������,-���������������.������������������������������.�������������������������������������;?�-��������.������������+�������+�(i) stagnating food productivity and production; (ii) lack of access to ������������+��������������+���������+����*���+�����������������opportunities; and (iii) threat of climate change and volatility of food
66 While computing the share of respective rural infrastructure, approvals for rural energy and rural water supply and sanitation are divided by total ADF approval for energy and WMIS, respectively. Since rural roads appear in at least three sectors (ANR, multisector, and transport and ICT), approval for rural roads is divided by a weighted denominator representing 30% of ANR, 60% of multisector and 100% of transport and ICT.
67 ADB. 2009. Report and Recommendation of the President to the Board of Directors: Proposed Loan and Technical Assistance Grant to the Socialist Republic of Viet Nam for the Renewable Energy Development and Network Expansion and Rehabilitation for Remote Communes Sector Project. Manila.
68 Actual outputs were based on project completion reports circulated in 2004–2010. 69 ADB. 2010. Investment Forum for Food Security in Asia and the Pacific. Manila (7–9 July).70 ADB. 2009. Operational Plan for Sustainable Food Security in Asia and the Pacific. Manila.
Overall, the level of
ADF support for rural
infrastructure has
been low

4242
The Asian
Development
Fund
Operations
prices. To address these constraints, the operational plan notes that tackling food insecurity requires a multisector and value chain approach that ensures improved productivity, connectivity, and resilience. It is expected that the renewed emphasis on addressing food insecurity in �;?��3�������������������������������������������������������&
B. Good Governance
103. The importance of good governance has been highlighted in all three reports to ADF donors. In ADF VIII, good governance was considered a broad-based concept, and ADB was asked to encompass all factors contributing to a country’s ability to sustain economic and social development and reduce poverty. The ADF IX donors’ report sought a sharper focus on good governance and mainstreaming it into all operations. In ADF X, compliance with ADB’s governance and anticorruption policies in all pipeline operations along with implementation of the Second Governance and Anticorruption Action Plan (GACAP II) requires actions in ������*��������5���%� �.�����������������������+����%���������������������framework, and (iii) capacity development.
$!>&� ��,� 3��� ���� ����� ������������� ����� ����� .��*� �� �� �� ��special policy on governance with focus on accountability, participation, predictability, and transparency,71 followed by a policy on anticorruption ���$""6&�'���!!!+���,������ �������;�����4W���������������������Plan for 2000–2004, and in 2005 it conducted a joint review72 of the implementation of its governance and anticorruption policies to assess and refocus its efforts. The review noted that ADB had completed �>� ������� ���������� ������������ ������� �!!$#�!!>+� ������� �����integrating governance and institutional development with infrastructure investments using sector lending and sector development approaches had become less effective over time.73 The governance agenda was extensive and complex, with too many small projects of short duration, and staff resources were spread too thinly. The review recommended that ADB focus and prioritize governance activities in areas where there �����������������������;?�������� �.���������������������������� �����������������������.�����,� ��������3������ ����������;?�-�systems in its country operations.74 It concluded that country governance assessments made little difference to ADB’s approach to governance and institutional development, and tended to be too general to underpin a governance strategy as part of ADB’s country strategy. The review also found that country strategy papers often did not treat the governance topic in depth.75
71 ADB. 1995. Governance: Sound Development Management (WP1-95). Manila.72 ADB. 2006. Review of the Implementation of ADB’s Governance and Anticorruption Policies:
Findings and Recommendations. Manila.73 The review observed, “Inadequate fiduciary and corruption risk assessments at the country
and sector levels have, however, reduced the effectiveness of ADB’s efforts to deal with corruption.”
74 The reports are available on http://www.adb.org/Governance/Review/default.asp75 IED also found that essential elements of a governance strategy were often missing from
ADB’s policy-based operations at all levels. The analysis of program lending policy actions in 2006 suggested little relationship among loan size, implementation period, and the number of policy actions. Only 35% of program loans were supported by TAs, and only 33% had grants to support institutional development. Few program loans were backed by sound sector assessments and road maps. ADB’s governance-oriented TA operations have been numerous, widely dispersed, small, and of short duration.
Renewed emphasis on
food insecurity will draw
in more resources in
coming years

4343
Progress in
Areas Relevant
to ADF
Operations
105. The review culminated in ADB launching GACAP II in 2006 with ��������� ��������� �� �.���� ��������� ����������+� ���������+�and combating corruption. A risk-based approach to governance assessment was targeted at the country level to priority sectors in which ADB had operations. ADB approved the guidelines for implementing |�?���''����;����!!6&76 GACAP II is expected to play an important role in implementing commitments under the Paris Declaration and Accra ��������������&��������� ������������������ ������������������aspect of governance in many ADF countries. GACAP II has addressed some of the earlier weaknesses and provides a consistent approach to deal with this issue at the programming and project implementation ������&� '�� ���� �������� �3� ��,� ;���������� ���� ������ ��������oversight to the process.
106. By 2007, 13 ADF countries77 had joined the ADB/Organisation for Economic Co-operation and Development (OECD) Anti-Corruption '���������� �� ����� ���� ���� ������� ����� '���������%+� ���� <� ���78 had expressed interest in becoming members. By 2010, member countries had grown to 28. The Anti-Corruption Action Plan for Asia and the ������+������ ��������������3�*������'���������+������������������and standards for sustainable safeguards against corruption in the economic, political, and social spheres of countries in the region. The plan addresses corruption under three pillars: (i) developing effective and transparent systems for public service, (ii) strengthening anti-bribery actions and promoting integrity in business operations, and (iii) supporting active public involvement.79
107. At its 12th meeting in Singapore in 2009, the ADB/OECD Steering Group commissioned a review of the ADB/OECD Initiative to assess its impact on corruption and to make recommendations for its future direction.80 The review subsequently recommended that the Initiative focus on developing the capacity for the central anticorruption functions of prevention, investigation, and prosecution. '�� � ���������� ����������� ����� ��,� ������ ������ ������������ ���3�������� �������������+����������������.������*�3������management and developing the capacity for implementing the United Nations Convention against Corruption (UNCAC). Country ownership should be enhanced in as many ways as possible, including taking over the management of the Initiative from ADB/OECD and conducting peer reviews to identify gaps in legislation, processes, and capacity. The peer reviews should be more results-oriented. A focus on practical operational matters was recommended. Lastly, the review recommended that the private sector be involved and represented in the Initiative. The Steering Group approved the Strategic Principles and Future Activities of the Initiative in September 2010 to implement the recommendation of the review.
108. Following the independent review in 2009 and the adoption of “Strategic Principles and Future Activities” in 2010, the ADB/OECD Anti-Corruption Initiative is committed to addressing and reducing
76 ADB. 2008. Guidelines for Implementing ADB’s Second Governance and Anticorruption Action Plan (GACAP II). Manila.
77 Bangladesh, Bhutan, Cambodia, Kyrgyz Republic, Mongolia, Nepal, Pakistan, Palau, Papua New Guinea, Samoa, Sri Lanka, Vanuatu, and Viet Nam.
78 Afghanistan, Lao PDR, Solomon Islands, Tajikistan, Timor-Leste, and Tonga.79 Available at http://www.oecd.org/dataoecd/43/31/42008862.pdf80 ADB/OECD. 2009. Independent Review of the ADB/OECD Initiative Final Report. Paris/Manila.

4444
The Asian
Development
Fund
Operations
���� ���� ��� ���� ����� ���� ���� ������� ������ ��������� ������� ����effective implementation of UNCAC. The Initiative will mainly focus on capacity building based on peer learning, mutual support, and exchange of expertise.
$!"&� ��� ���� � ���� �������� ��������� �� �;?�+� ��,� ��������������� ��������� ������������ ��� ���� ���4�����.��� �;?�&� �����a review in 2004, the weight of governance in deriving the country performance assessment rating and allocation was increased from 30% to 50%.81 The assessments use perception variables to measure ����/������������������ ������������5� ��%� � ����� ����������� �����4.�������������������%�/��������.���������������������������������� ����%� ��������� � �������� �.���������� ���%� /������� � �.����administration; and (v) transparency, accountability, and corruption in the public sector.
110. The Regional and Sustainable Development Department (RSDD) is currently undertaking a stocktaking and strategic review82 to assess ADB’s evolving governance and development agenda in the past 15 years, review progress in governance mainstreaming 3���� ���� � �������� � ��,-�� ���������� ���+� �����3� ��;� ����the governance-themed project portfolio, and identify lessons for �������������������������������������������;����4¦4��������������!�!&�'�������������������������������������������������������%��������conceptualization of the governance agenda and pursue integrated 3�*������;������������������������ �������+�������������� ������3�*� ��� �.���� ������� ����������+� ���������+� ���� ��.������corruption across ADB operations, targeted sector management and enhancing long-term country capacity in areas where ADB has a comparative advantage; (ii) increase use of the political economy approach to identify unique country conditions, competing interests, and interaction of these factors that may impact the reform process; ����%��Z �����3�.���� �� ���*���;��������������4�������� �������������� �������� ������� ���� ���� � ;���� ���%� ����������� ���� ���*4.�����approach by carrying out a separate review on how to make its approach and implementation more effective so that it has an impact on projects and development outcomes; and (vi) use country systems ������� ������4� ���������������������������������������������&�'�������������������������������������������������������3�3����feed into improving the effectiveness of GACAP II implementation.
$$$&� �� �������;��������� ������ �������,�������� �����governance in ADF operations. Of all the operations approved during 2001–2010, ADB has completed 13 projects/programs83������;��3����PCRs), of which 7 (54%) are rated ����������� 5 (38%) ������ ����������� and 1 ������������ (Appendix 4, Tables A4.32 and A4.33). The success ��������;�����3��� �����3���������������������&�?������������subsequent tranches due to noncompliance with loan conditionality appears to be a major reason associated with partly successful���;�operations. Similarly, there were instances when agreed reforms were rolled back after a change in the political situation in a country. Ensuring good governance remains a challenge and requires long-term
81 ADB. 2004. Review of the Asian Development Bank’s Policy on the Performance Based Allocation of Asian Development Fund Resources. Manila.
82 ADB. 2011. Stocktake and Review of ADB Governance and Public Sector Operations (draft). Manila.
83 Approved from 2001 to 2010.
Peer learning, mutual
support, and exchange of
expertise are the focus of
anti-corruption efforts
4545
Progress in
Areas Relevant
to ADF
Operations
engagement in a country and relevant sectors as well as a commitment ��� �;?�� �� ������� ������ ��� ������ ���� ����������� ����&� '��2011, IED initiated an evaluation of how ADB assistance incorporates good practices on public expenditure management. There is limited evaluation evidence available for ADB’s performance in other areas of GACAP II, i.e., measures to improve procurement and combat corruption. IED plans to assess ADB support in these and other relevant governance areas under an SES in 2013.
C. Gender Mainstreaming in ADB Operations
112. All three donors’ reports called for gender mainstreaming in ADF operations. While the commitment/statement in ADF VIII was that during its tenure gender should be mainstreamed, the ADF IX report stated that gender and development (GAD) concerns must continue �� .�� ������������� ���������� ��� ���� �������&� ���� �� � ����������required that ADB aim for gender mainstreaming in designing projects across all sectors, and that ADF operations be guided by the GAD ������ ���� ������� ������ ���&� ;��� � ���������+� ���� ���� �� ����-��� ��� �� �������� ������� �/������� ������� ������� �����4� ������operations, both directly (such as investments in girls’ education) and indirectly (such as construction of water supply and sanitation infrastructure).
113. In 1998, ADB adopted the Policy on GAD,84�3����������������GAD mandate. Operational guidelines developed in 2003 provided a framework for implementation. ADB introduced a four-tier gender categorization system in 2001 for monitoring the extent of gender ����������� ��� ������������������3�������������� '����� ''������������������� �������������&�� W��� ����� |��� ������ ������ ��!!!#�!!9%�served as a road map for translating policy into concrete actions. It emphasized departmental commitments and actions to increase ADB’s portfolio of loans addressing gender concerns. A review of GAD Policy implementation completed in 200685 concluded that ADB had made progress in all areas of operation, including country strategies, sector 3�*+� ����+�����W�&� '����������������������� ������������������relevant to all ADB operations.86 The review formed the basis for the preparation of the second GAD Action Plan (footnote 86).
$$>&� '�� �!!6+� ��,� ���������� ������� �/����� ��� ��� � ���� ����drivers of change in Strategy 2020. The strategic priorities of ADF X (2009–2012) cover inclusive growth, under which gender equality is recognized as fundamental to ensure inclusiveness. Under ADF X, 50% � ���������������.���������������|�����������'���''�.���!$�&87
115. IED evaluated ADB’s support to GAD in 200988 and found that ADB had exceeded the target in 2003, with 47% of projects ��� ?������� '� �������� �/����� ��������� ������������%� �� ?������� ''�(effective gender mainstreaming), but the performance had slipped to
84 ADB. 1998. Policy on Gender and Development. Manila.85 ADB. 2006. Implementation Review of the Policy on Gender and Development. Manila.86 ADB. 2007. Gender and Development Action Plan (2008–2010). Manila. para. 5.87 Strategy 2020 requires that 40% of all ADB wide operations are classified for gender
mainstreaming.88 IED. 2009. Special Evaluation Study: The Asian Development Bank’s Support to Gender and
Development—Phase I: Relevance, Responsiveness and Results to Date. Manila:ADB.
Support for public
sector management is
an important part of
ADB’s efforts to promote
good governance in ADF
operations

4646
The Asian
Development
Fund
Operations
23% in 2007. The evaluation concluded that ADB had not successfully mainstreamed GAD in its operations due to increased sector selectivity and the shift towards large-scale infrastructure projects, which are not �������� �����.��� �� ������������� ������������ |��� ������+� ��.�����with underreporting of gender-related project components. This shift in sector focus also corresponded with the period when the number of gender specialists within ADB and its regional departments declined, due in part to the reorganization and in part to staff movements. There was a need for greater attention to provide support, guidance, and training to operational staff, in addition to incentives to best-performing project teams and/or departments concerning GAD issues.
116. A follow-up study by IED in 2010 (Phase II)89 focused on �� ����������������|��� �����.����,-������������������+��;?�+�������������*���������������������������������Z���������&90 Based on ��4�� ������*�����������+������������������+����������������������������with executing and implementing agencies, and performance rating from the GAD perspective of 55 projects comprising both completed and ongoing (45 projects in GAD categories I and II; 28 in core areas of operation, and 27 in other areas of operation; and 51 ADF funded, and 4 OCR funded), the study concluded that 51% of the sample projects were rated successful or higher in GAD-related performance. However, 45% of the sample projects were still ongoing and all the gender-related results may not yet be fully captured. In terms of sectors, water supply and sanitation, education, and multisector had higher success rates in gender mainstreaming than the transport and ICT and energy sectors. The SES concluded that core sector projects (with the �Z�� �������������+�����������������������������+�����������+�����������%� ������.������������������������.������+���������������������not readily amenable to gender mainstreaming. However, the study reiterated that, with advance planning and supported by stronger �����4����� �����4� ��������������+� ��� ��� ���.������������ �������in core sectors that maximize the opportunity for effective gender ��������������������6"+� ���&�6$%&�}��������������������������+�3����� ������� ������� ������������ �� ������ ������4� ������ �������issues and government gender priorities, evidence was weak on the ��[������ � ����� ������������ �� ��,-�� ?���&� �������+� ���� �� ������to address gender issues, including in category I and II projects, was ��������������������������������;?��������,�.�������� �������+�particularly for project implementation and related management information systems, which were weak in capturing gender-related performance data.
117. Based on feedback from RSDD, 47% of all ADF projects in 2001–�!$!��������������������������������������������������������/�����theme, and another 25% showed effective gender mainstreaming). ADB’s Development Effectiveness Review 2010 (footnote 63) notes that in 2010, ADF operations were on track with 45% of approvals gender mainstreamed. Data suggest that the prevalence of gender as a theme dipped in ADF IX, but improved considerably afterwards.
89 IED. 2010. Special Evaluation Study: The Asian Development Bank’s Support to Gender and Development—Phase II: Results from Country Case Studies. Manila:ADB.
90 The six countries were Bangladesh, Indonesia, Lao PDR, Nepal, Pakistan, and Papua New Guinea. Owing to the floods that affected Pakistan in August 2010, in-country consultations for that country were not carried out. Consequently, the Phase II report contains only those elements of the Pakistan case study that did not depend on in-country consultations.
Gender mainstreaming is
back on track after some
setbacks

4747
Progress in
Areas Relevant
to ADF
Operations
Overall, in 2010, ADB and ADF projects were on track in achieving the target when their assessment combined gender equity and effective gender mainstreaming.
D. Private Sector Development
118. ADF VIII donors endorsed the main strategic thrusts of ADB’s 2000 Private Sector Development Strategy (PSDS), which sought to utilize the capabilities of both its public and private sector operations to deliver synergistic solutions to problems that impede private sector ��3��� ��� ���� �;?�� ���� ���� �����.����� � ���� ������� ������ ��poverty reduction. Private sector operations were to catalyze private investments. For public sector operations, the strategy had two thrusts: ��%� �� �� ����;?������������ ���������������.�������������� ��.�������+��������%������������.�������� ���������������,4��������public sector projects through support for PPPs and privatization programs. ADF IX commitments focused on the need to promote more private sector investment in physical and social infrastructure, foster the institutions for private sector growth and competition, and increase �� ��� �� ������ ���� ������4������ ����� ����� ��;{%� ����� �����including through supportive private sector operations by ADB. An ADB internal PSDS review found that the strategy deemphasized the role of public sector goods and services in creating enabling conditions for private sector investments.
119. Under a revised strategic framework for private sector development (PSD) prepared in 2006, the second PSDS thrust (i.e., to generate business opportunities) was replaced with a new thrust: to promote public sector goods and services including through PPPs. The revision, among other things, also seeks to improve and expand ADB’s support for policy reforms and institutional development for PSD and emphasizes an integrated approach for actions in the two ������� �����&� W��� ����3�*� �������� ���� ����� �� ���������� ����objectives into country strategies and programs. CPSs are to identify priority PSD operations based on sector and thematic assessments for ������;?+��������������,-���� ������������������ �������������development partners. ADF X commitments focus on improving the investment climate and attracting more private investment through support for infrastructure development, policy and institutional �����+� ��� ������ ������� ���*���+� ���� ���/����� ������� � ��skilled workforce.
120. Strategy 2020 seeks to expand support for PSD and private sector operations to 50% of ADB’s assistance in terms of value and numbers by 2020. Thirty-seven percent of all loans approved by ADB from 2009 to 2010 in terms of number and loan amount had PSD as a theme. At 24% in terms of number and 21% in terms of value, the share of ADF projects with a PSD theme during that period has been substantially lower than that for OCR-funded projects, which include all Private Sector Operations Department transactions. Nevertheless, ADB has made good progress toward meeting its 2012 target of 30% of ADF projects focusing on PSD. The respective shares for ADF VIII and IX were 9% and 16%.
ADB has made good
progress in private sector
development

4848
The Asian
Development
Fund
Operations
$�$&� ;��� ���4������� ���4�������� ������� ������ �!!$�have supported efforts to strengthen the enabling environment, ������� ������� ����������� �� ����������� �����+� ��������� ����������� ����+��;{�+���������.������������� ����&�}������������������ ���������������������������������������������3� ������������with required sector reforms and the establishment of appropriate legal, regulatory, and policy frameworks, as well as the lack of institutional ����������������� �����+�.���3��������,��������������;?�&91 To what extent ADB has been successful in improving the enabling environment for PSD is being assessed under an ongoing SES. Seven of the 10 available (self-) evaluations for ADF loans and grants approved from 2001 to 2010 that sought to improve the enabling environment for PSD, were rated successful.
122. At the country level, only three (Cambodia, Lao PDR, and ;�����%������$��?��{������������������,-�������.������������in ADF countries found these to be satisfactory, as they have helped facilitate the transition of these countries into private sector-led market-based economies. While ADB also sought to promote PSD in Nepal and Sri Lanka, the changing economic reform agendas of new governments reduced the effectiveness or sustainability of earlier PSD support. In some of the other ADF countries, support for PSD-related ������������������������������������������������������ ����������due to lack of institutional implementation capacity and enforcement.
E. Regional Cooperation and Integration
123. Regional cooperation is one of ADB’s core mandates.92 ��������������+�������������������������.��������� �������one of the four strategic thrusts of ADF VIII.93 To promote regional cooperation, the donors recommended that (i) ADB should make cross-border issues (including regional cooperation) integral components of country strategies; (ii) ADB should support regional cooperation by improving organization, funding, and implementation; and (iii) ADB should consider development of a regional operational strategy and allocate an appropriate amount of total ADF VIII lending for regional and subregional cooperation projects representing priority investments in ADF borrowers. The ADF IX donors recognized that regional � ������� ������������������� �������;?�����*��� ������������in global markets and made it one of the three crosscutting issues and thematic priorities and set aside an amount (5% of ADF IX resources) for such initiatives.94 The ADF X donors noted the progress made during ADF VIII and ADF IX and, consistent with ADB’s Strategy 2020, recognized regional cooperation as one of the three strategic
91 The 2009 SES on ADB Assistance for Public-Private Partnerships in Infrastructure Development found that, despite improvements, the policy environment for PPPs was not yet conducive in many countries. More systemic approaches were needed that focus on increasing the efficiency of infrastructure sectors and PSM overall, as many PPP modalities require prior sector restructuring and tariff reforms to be effective. The use of PPPs on a larger scale requires substantial government capacity for project identification and development, and the regulation and monitoring of PPP contracts and their fiscal impact.
92 Article 2 of the Agreement Establishing ADB states “…giving priority to those regional, sub-regional as well as national projects and programmes which will contribute most effectively to the harmonious economic growth of the region as a whole...”
93 The other three strategic thrusts were governance, financial intermediation, and PPPs.94 Other thematic priorities in ADF IX were private sector development and mainstreaming
environment and gender.
Slow reforms hampered
ADF funding of public-
private partnerships
in infrastructure

4949
Progress in
Areas Relevant
to ADF
Operations
agenda.95 They also recognized RCI as a core area of operations in �����������������������+�����������+��������������������� ����+�and education. The donors acknowledged the need for this initiative and agreed to increase the allocation from 5% in ADF IX to 10% in ADF X to enable ADF operations earmarked for regional and subregional projects, including public goods.
124. To respond to ADF VIII priorities, ADB formulated an RCI Strategy.96 Implementation received a boost after Strategy 2020. RCI was a theme in only 7% of approved ADF VIII projects/programs, but ���������� ��$>�� ������� '�� ����9$�� ��� ��������� �� ������������&�W�����4���� ��������9���"�%������ �������3���������?'������������been in the transport and ICT sector (Appendix 7). The Development Effectiveness Review 2010 (footnote 63) indicates that the share of trade of ADF countries with the region rose from 59% in 2005 to 60% in 2009, and ADF countries realized a more substantive increase. ADB �����������������������?'����������������|�������;�*�����.�������|;�%� {������ ? ������� ������+� ���� ?������� ����� ��������Economic Cooperation Program, South Asia Subregional Economic ? ������+�������,-���������� �������!$!#�!$>%&97
$�:&� '���!!=+����������������3�� ����|;�����������������3�*�(2002–2012)98��������������|;�� ���������������������+������������concrete results and contributing to the shared vision of a prosperous, ����������+� ���� ��������� |;�&� W��� �����3� ��������� ����� �������������� ��������� � ���� |;�� ������� ������ ���� 3���� ������ ��� ���.��������������3������������������������������|;����������-��implementation period. Likewise, ADB’s study on Central Asia: ;� �������������� ��������!$:99 suggests that increased regional cooperation, along with key economic reforms, could help double per capita income in the Central Asia Regional Economic Cooperation region within a decade. This could contribute to a reduction in the poverty level to 25% in 2015.
126. In 2008, IED’s evaluation rated regional cooperation assistance ��� ���� |;�100 as successful and recommended ADB could further �� �������� ���������.�5���%��� �����������������.��������������the design and implementation of subregional projects; (ii) engaging in greater policy dialogue to raise awareness, provide policy advice, and support actions to reduce the negative impacts of RCI; (iii) supporting policy and procedural reforms to ease ”software” constraints to �����������������������.������������������������������3���+������ (iv) paying more attention to results, monitoring progress, and the cost effectiveness of investments.
95 Other strategic agenda are inclusive growth and environmentally sustainable growth.96 ADB. 2006. Regional Cooperation Strategy. Manila. The Strategy has four pillars: (i) regional
and subregional economic cooperation on cross-border infrastructure and related software, (ii) trade and investment cooperation and integration, (iii) monetary and financial cooperation, and (iv) cooperation in regional public goods.
97 ADB has adopted other initiatives and strategies but these do not apply to ADF countries.98 ADB. 2007. Midterm Review of the Greater Mekong Subregion Strategic Framework. Manila.99 M. Dowling and G. Wignaraja. 2006. Central Asia: Mapping Future Prospects to 2015.
Economics and Research Department Working Paper Series. No. 80. Manila.100 IED. 2008. Regional Cooperation Assistance Program Evaluation: Greater Mekong Subregion—
Maturing and Moving Forward. Manila:ADB
Regional cooperation
and integration require
emphasis on additionality
in regional benefit,
engagement in policy
dialogue, and supporting
policy and procedural
reform
5050
The Asian
Development
Fund
Operations
$�=&� '{�-�� |;�� ����� ��� ������ ���������� ����� ������ ��,�commitment to regional cooperation.101�W���� ��� ��������������|;�����������������������������������������������������+���[�������the core competency of ADB. Overall, the assistance to the sector was rated successful based on (i) ADB’s facilitation of multilateral dialogue �����|;����������+����%����� � ��������Z������������������������assistance to support and sustain the dialogue, (iii) suitable selection and implementation of projects meeting both national and subregional needs, and (iv) the focus on cross-border issues and the due diligence in preparing cross-border trade agreements. For better results, the �������������������,�����%������� ���������� ���������������������trade facilitation, (ii) facilitate institutional development, (iii) develop strategic partnerships and harness synergies with other regional � ������������������+��������%��.������������������������&�W���recommendations are being implemented.
128. To provide input to the next programming cycle, IED validated the South Asia Regional Cooperation Partnership Strategy (2006–2008) Completion Report in 2010. The validation concurred with ������ �������������������partly satisfactory rating. The validation broadly concurred with the recommendations provided in the report, ���� �� �������� ����� ���� ������� �� 3����� ��������� �� ��������cooperation should be increased needs careful analysis, given low levels of utilization for investment assistance during 2006–2008. It also highlighted that concessional resources should be used to mobilize ������������������&�����������+����������������������������*���strategic issues for the future: (i) set realistic goals, objectives, and focus; (ii) ensure political commitment (ownership and leadership); (iii) achieve closer alignment of regional and country-level programs of assistance; and (iv) monitor implementation and track results.
F. Environmental Sustainability
129. Environmental sustainability was a recurring theme in all three reports to the ADF donors. For ADF VIII, the donors had recommended ��� � ������ ������� �� ��,+� ���� ��� ���� ��������� � ���� '��negotiations they noted ADB had adopted an Environment Policy addressing recommendations for ADF VIII. For ADF IX, the donors recommended that (i) ADB widely disseminate results of environmental assessments both internally and externally; (ii) ADB undertake country consultation meetings with government agencies, NGOs, academia, private sector, civil society, and other development agencies to provide feedback to improve all elements of its environment work during ADF IX; and (iii) environmental sustainability should be one of the four thematic issues to be strengthened and taken into account in all dimensions of ADB operations. Various initiatives made progress on all of these. ADF X has environmentally sustainable growth as one of three strategic agendas aligned with ADB’s Strategy 2020. It emphasizes: (i) mitigation of the environmental costs of rapid economic growth; and (ii) helping governments integrate environmental considerations in their development planning and programs, and supporting subregional environmental programs. Donors noted the progress on ADB’s review of the safeguard framework and agreed that the process
101 IED. 2008. Sector Assistance Program Evaluation: Transport and Trade Facilitation Sector in the Greater Mekong Subregion—Time to Shift Gears. Manila:ADB.
Regional cooperation has
a growing profile in ADF
operations

5151
Progress in
Areas Relevant
to ADF
Operations
for reviewing ADB’s safeguard framework should result in a Safeguard ���������������&������������ ������������/����������������������3����also incorporate measures to support climate change mitigation and adaptation. The emphasis on the latter has been substantial in the past few years since Strategy 2020.
130. Environmental and social safeguards are a cornerstone of ADB’s support for environmental sustainable and inclusive economic growth. After extensive public consultations (including with government and civil society), ADB approved its Safeguard Policy Statement102 in July 2009, which came into effect in January 2010. The Safeguard Policy Statement strengthens the environmental and social protection already in place and brings the previous three policies on the environment, involuntary resettlement and indigenous peoples into a consolidated policy framework to enhance relevance and effectiveness. To ensure sound implementation, ADB has made institutional efforts for the Safeguard Policy Statement roll-out, including activities for strengthening its internal safeguard review system, enhancing staff resources and capacity, enhancing awareness of external stakeholders, as well as developing tools and instruments such as sourcebook materials. From the time of Safeguard Policy Statement approval, ADB has also approved several important TAs totaling $12 million to assist �;?������� ����������������������3�*��������� �����������������capacity to address environmental and social safeguard issues. Thirteen ���� ��������� ����� ������ ����� ��� �����&� ;���� ���� '{�� ������������������3���� ���� ����������������3� ����� �����������+����3�������in the design of sensitive projects such as the Nam Theun hydropower project103 in the Lao PDR.
131. In recent years, ADB has undertaken several important initiatives to promote environmentally sustainable growth as one of the three strategic agenda of Strategy 2020, which places strong emphasis on climate change, sustainable infrastructure, and regional cooperation on biodiversity conservation and natural capital. These initiatives have ������������� ��������� ��,-�� ������������� ��������� �����������new strategies, policies, and programs; and developed knowledge products for enhancing environmental sustainability and development. The number of TA projects with environmental sustainability as a ������������������ ��������������������������������� ����;?�����developing institutional, policy, and legal capacities for environmental management. The importance of environmental sustainability as a ������������3������������������������������� ����������� ���������both ADB and ADF operations (8% in ADF VIII, 12% in ADF IX, and 34% in ADF X)104 (Appendix 3, Table A3.10). The Development Effectiveness Review 2010 (footnote 63) indicates that the 3-year average percentage of projects supporting this theme has surpassed the ADF target of 25% (37% of ADF operations).
132. Important programs and initiatives include the Clean Energy Program, which in 2010 helped to target $1.76 billion to help the region to meet its energy security and universal access needs while supporting transitions to a low-carbon economy. The program includes a range of
102 ADB. 2009. Safeguard Policy Statement. Manila.103 ADB. 2005. Report and Recommendation of the President to the Board of Directors: Greater
Mekong Subregion Nam Theun 2 Hydroelectric Project. Manila.104 These figures are based on the number of projects. A project may be classified into more
than one theme.
ADB has undertaken
several initiatives
to promote
environmentally
sustainable growth

5252
The Asian
Development
Fund
Operations
innovative initiatives such as the Asian Solar Initiative, the Quantum ��� ����������3��+�����{������{��������'���������+��������������?�������Change and Clean Energy Venture Capital Initiative among others. In the urban areas, ADB is supporting shifts to clean and climate resilient development through the Cities Development Initiative for Asia,105 and the Clean Air Initiative for Asian Cities, as well as support through a number of projects to assess, plan, and implement climate resilience measures. In the transport sector, the Sustainable Transport Initiative is helping the region to develop accessible, safe, environmentally friendly and affordable transport systems.106 At a cross-cutting level, ADB is also implementing the Poverty and Environment Program, which aims to accelerate learning about poverty-environment linkages and effective approaches for poverty reduction through a regional TA ��������������.�����������������{��������������&107
133. In addition to these initiatives, ADB is supporting regional � ���������������������������.���������������������.�������ecosystems and initiatives that address common environmental concerns. This includes support to a number of ADF and non-ADF countries through initiatives such as the Coral Triangle Initiative on ?��������+��������������������������+���������|;��?���{����������Program and Biodiversity Corridors Initiative. ADB has also introduced in 2011 the Learning and Sustainable Development Initiative. This is as an intensive effort to build awareness and commitment among all middle management in ADB to promote innovative solutions for sustainable development and climate change issues during the design ������ ��������������,� ������������;?�&�� ����Z�6� �������a brief introduction to the major initiatives undertaken by ADB.
$9>&� ;���� ������,� ������������������� ���������� ����������������yet to be evaluated. ADB has conducted self-evaluation of some. For example, the Poverty and Environment Program TA completion report rated the operation highly successful and deemed it a useful mechanism for accelerating learning about poverty–environment linkages and effective approaches to poverty reduction. The experiences and lessons from subproject implementation on how local actions can lead to reduction in poverty and to environmental improvements fed into ADB’s operations by providing learning opportunities for project �����������.�� ��[�������� ��������� ������ ������� ����������&108 Preliminary assessment of environmental capacity development in �;?��.����������������������������������%����������3��*�������������������������������������������������������;?������������and project executing agencies, (ii) the need for greater involvement of governments and executing agencies in designing TA, and (iii) the importance of capacity development at the provincial government level for greater success at the national level.109
105 Other funding members are Australia, People’s Republic of China, Germany, Spain, and Sweden. Two other noncore members are Singapore and Nordic Development Fund.
106 An additional environmental initiative is the People’s Republic of China – Global Environment Facility Partnership on Land Degradation for Dryland Ecosystems.
107 A multidonor trust fund supported by Governments of Norway and Sweden, and administered by ADB.
108 ADB. 2010. Technical Assistance Completion Report: Poverty and Environment Program. Manila.
109 IED. 2011. Synthesis of Studies on Effectiveness of Technical Assistance in Support of Environmental Capacity Development. Manila:ADB (draft).
Most of ADB’s
environmental
sustainability initiatives
are at the early stages
and are yet to be
evaluated

5353
Progress in
Areas Relevant
to ADF
Operations
135. To provide input to the Strategy 2020 initiatives on climate change and sustainable development, IED prepared two knowledge studies in 2009 and 2010.110 The former, a study on the greenhouse gas (GHG) implications of ADB’s energy operations,111 recommended that ADB assess the GHG implications of future energy sector investments 3���������������|�|��� ����+���������� �� � ��������������.���renewable energy technologies, aggressively pursuing methane capture projects, and scaling up investments in industrial energy ��������� �� �������� ������&�W����!$!� '{�������112 introduced a method to quantify the gross carbon emissions from the construction and operations of ADB-funded land transport projects. The study recommended that ADB adopt carbon emissions as a consideration for project design; encourage a modal shift in ADB investments in the transport sector; consider using systematic indicators to monitor the intensity of carbon emissions from transport investments; and, in ��������� �3�����;?�����������+���������,-����������.�������� ���initiatives with nationally appropriate mitigation actions. According �� ������,-��;���������������������� ������+�;��������������adopted these recommendations and has developed action plans.
G. Sector Selectivity and Concentration
136. Consistent with ADB’s Strategy 2020, ADF X donors stated that sector selectivity will be pursued through an operational focus on sectors in which ADB has a proven track record, especially infrastructure and education. At the same time, the donors highlighted that ADB ������ �� ��������� ���� [�Z�.������ ���� �� ������ �� ����� ������������deliver quality assistance in a few other sectors to respond to varying country needs and priorities. The donors set indicative targets for sector allocation of ADF resources under ADF IX and ADF X (Appendix 3, Table A3.9).
110 In 2011, IED is also preparing an SES on environmental capacity development in DMCs covering all five regions of ADB operations.
111 IED. 2009. Evaluation Knowledge Brief: Greenhouse Gas Implications of ADB’s Energy Sector Operations. Manila:ADB.
112 IED. 2010. Evaluation Knowledge Brief: Reducing Carbon Emissions from Transport Projects. Manila:ADB.
Table 18: Indicative and Actual Allocation of ADF Resources
Broad Sector
ADF VIII ADF IX ADF X
Actual Share ()Indicative+
Share () Actual Share ()Indicative+
Share () Actual Share ()
Infrastructure 32 47 38 59 52
Education 15 8 9 10 5
Health 3 4 5 5 4
Agriculture and Natural Resources 21 12 13 5 12
Finance 4 6 5 6 3
Other Sectors 14 7 11 9 14
Multisector 12 17 19 5 10
Total 100 100 100 100 100
ADB = Asian Development Bank, ADF = Asian Development Fund. Notes: As per the donors’ reports, infrastructure includes energy, road transport, rural infrastructure, urban infrastructure, railways and other transport, and communication. Other sectors include public sector management and industry and trade. (+) refers to indicative share of different sectors outlined in the donors’ reports for ADF IX and ADF X.Source: ADB. 2008. ADF X Donors’ Report: Towards an Asia and Pacific Region Free of Poverty. Manila; and ADB Database on Loan, Technical Assistance, Grant and Equity Approvals (Appendix 3, Table A3.9).
ADB needs flexibility and
capacity to deliver quality
assistance that responds
to varying country needs
5454
The Asian
Development
Fund
Operations
$9=&� W�.��� $6� �������� ����������� ���� ������� ������� �� .����sector groups, showing that the indicative shares for ADF IX by sector �������������������������������������������������'''&�;������.��+����� ����� ������ �������� �� ������ �� �������������+� ������+� ����multisector operations in both ADF VIII and ADF IX. Education, ANR, and other sectors received less weight. Actual approvals were generally consistent with indicative targets for the majority of sectors, with the exception of infrastructure receiving a proportionately lower share and other sectors receiving a larger share than what was envisaged in the donors’ report. The variation was largely associated with increased �� ��� �� �������� ���������� ��� ��[������ ��� ���������� ����������� �������+� ���� ������� ���������� �� ��;&� '�� ���� �� ��!!"#�!$!%+�������� �� ��� �� �������������+� ��������� ���� ������� ����� .����lower than the indicative shares, while approvals for ANR, multisector and other sectors have been higher. Nevertheless, the prominence of infrastructure has increased substantially in successive ADF periods. This is consistent with the emphasis placed in Strategy 2020. However, �������������������� ����������������������������������� ������be inconsistent with the emphasis given in Strategy 2020. Detailed data are in Appendix 3, Table A3.9.
138. ADF portfolio data suggest that ADB remains engaged in all 10 sectors, but sector distribution varies widely across countries, and engagement is more concentrated in some sectors than in others. Sector focus has increased in a number of ADF countries. For example, in dollar terms, ADF operations in Cambodia and Pakistan declined from 10 sectors in 2006 to 7 in 2010. Other countries also experienced reduction in the number of sectors over the same period, except for ����������+�����.�����+�,���������+�?*�'������+�¤���.���+�;�������+�Samoa, Sri Lanka, Tuvalu, and Viet Nam, where the number of sectors either remained unchanged or increased during the same period (Appendix 9, Table A9.1).
$9"&� W�������������4����������'���Z113 was used to measure sector concentration (Appendix 9, Tables A9.2–A9.7). It shows that the ADB portfolio was modestly selective on the basis of both the number and dollar-value of ongoing loans in 2002. The portfolio became somewhat less concentrated and hence less selective in 2006 and 2010. Selectivity based on the number of loans improved between 2006 and 2010, but it improved only marginally in dollar value. The main reason for this change was the large decrease in the size of the ADF portfolio in some ������������ ������+�����������������+�������+����+��������������and trade. Although selectivity and concentration improved between 2006 and 2010, the movement was not always toward core sectors of �������&�����Z�� ��+������������������������� ��������3���the largest relative decrease.
140. Nevertheless, ADB ranks highly among its peers for specialization. In 2010, ADB was ranked114 1st among donors on the basis of average number of sectors per recipient country, and portfolio concentration by sector; 5th in number of recipient countries, and geographic concentration; and 12th in average project size. Although
113 The Hirschmann-Herfindahl Index is based on the number of active sectors and the number of operations per sector. The closer the index number is to 1.0, the more focused the portfolio is.
114 S. Knack, F.H. Rogers and N. Eubank. 2010. Aid Quality and Donor Rankings. Policy Research Working Paper. No. 5290. Washington, DC: World Bank.
ADF portfolio was
modestly selective and
sector selectivity
improved in some DMCs

5555
Progress in
Areas Relevant
to ADF
Operations
the ADB portfolio is not highly concentrated in absolute terms, it is more concentrated than the portfolios of most other bilateral and �������������������������&�|������������������������������;?�+���,��������/�����[�Z�.�������������������������&�W����������������� ������3���� ������� �� ���� ��������� ��� ���� �;?�&� �������� �;?�� ����constrained in sector investments partly due to the limited size of ADF resources available to them.
H. Partnerships, Aid Coordination, and
Harmonization
141. The donors’ reports for ADF VIII, IX, and X emphasized increased aid coordination and harmonization to ensure that contributions to the ADF are more effective for development. The report for ADF VIII urged ADB to use the ADF to promote development partnerships using the principles of the World Bank’s Comprehensive Development Framework, and much closer aid coordination. The ADF IX report emphasized harmonization, urging ADB to harmonize its policies, planning, procedures, and operations with those of other funding agencies. Harmonizing the allocation of the ADF with that of the International Development Association (IDA) was one important �������+� ����������.����� ���� ��������������� �������������� ����SWAp; the adoption of government-led poverty reduction strategies as the basis for country programs; and harmonization of procurement �������+�����������������+���������������������������������+�����evaluation systems.
$>�&� '��;������!!:+���,�����$"�� �������.�������������������the Paris Declaration on Aid Effectiveness. In 2008, OECD convened the Third High Level Forum on Aid Effectiveness in Accra (Ghana). It is now preparing for the Fourth High Level Forum to be held in Busan, Republic of Korea. ADB has adopted a three-pronged strategy to minimize transaction costs for individual development partners and to maximize responsiveness to country-level needs and concerns. The strategy comprises (i) mainstreaming the Paris Declaration and Accra ������� �� �����+� ���%� �� ������ ���� �� �������� � �;?�+� ���� ����%���[�������� ���� ��.��� ���� ������������ ������� ��� ���� �������������level.
143. In 2008, IED completed an SES on the implementation of the Paris Declaration.115 In 2010, it initiated phase II of the study.116 The ongoing study also reviews ADB’s progress in implementing phase I recommendations. This ongoing study notes that ADB has responded ����������� �����'���������������������������.����%���*�������������� �����.���� ������� ������ ����+� ���� �����������+� ���� .�������notes on the Paris/Accra commitments; (ii) setting up focal points for ;��� ���� ���� ������������ ��� ���� ��������� ���� ������ �� ��������(SPD); (iii) stepping up training on these issues; and (iv) recognizing the resource implications for aid effectiveness by increasing staff complements for operations and resident missions. The SES found that phase I recommendations had largely been implemented. It concluded
115 IED. 2008. Special Evaluation Study: Implementing the Paris Declaration at the Asian Development Bank—A Development Partner’s Study for an OECD-DAC Evaluation. Manila:ADB.
116 IED. 2011. Special Evaluation Study: The Implementation of the Paris Declaration at the Asian Development Bank—A Headquarters-Level Study Update (draft). Manila:ADB.
ADF donors emphasize
aid coordination and
harmonization to
ensure more effective
development
ADB has met and
exceeded 2010 Paris
Declaration targets, and
has made a good progress
on the commitment to the
Accra Agenda for Action

5656
The Asian
Development
Fund
Operations
����� ������������������������������� ����3���������� ��������&���,�����met and exceeded 2010 Paris Declaration targets for alignment, TA, ����� �.�������������������������������+���������� �������� ������implementation units, and coordinating missions. In addition, ADB is demonstrating leadership on managing for development results �;��%�3���������� �����������������3�*�������������������������� �������������������;����� ����������;?�+��������� ������������������������������������;�������&�
144. ADB has also made good progress on the commitments to the Accra Agenda for Action. The results indicate that the aid relationship between recipients and donors has been transformed. For example, donors increasingly avoid dictating where and how aid can be used within a country, and they do not determine project planning and implementation cycles and timetables independently. With a few �Z�� ����+� �Z�������� ���� � ���� ��������� �� �.���� �����������������+� ���������+�����������������������������;�{%����no longer practiced. It should be recognized that these shortcomings are likely to reduce the evaluability of the initiatives. Nevertheless, ���� ������������� ��� �������� ���� [�Z�.��+� ��� ������� 3������ &�It is accepted that both donors and recipient countries are mutually accountable for achieving agreed-upon development results from aid.
$>:&� ������� �!!:#�!!=+� ��������� �� ��,� ;���������+� ��,�carried out 369 coordinated missions117 with other development partners in 17 ADF-recipient countries. The missions dealt with a wide spectrum of activities, such as project preparation, supervision, implementation or joint programming, and portfolio reviews. In addition, ADB undertook 12 joint country portfolio review (CPR) missions, 7 joint CPS missions, and 13 activities using program-based approaches118 in 2008. In 2009, there were 13 CPRs, 11 CPSs, and 34 activities using program-based approaches. In addition, resident missions participated in several CPR and CPS meetings with ����� ����� ����� �������&� '�� �� ������� ;������������ }�����������������������������������3�*� �;}���%� ���+���,� ��������� ��high rating for harmonization procedures, largely due to its joint missions and coordination of TA for capacity development.119 Likewise, a recent assessment of the ADF by the United Kingdom’s Department for International Development (DFID) suggests that ADB performance in the context of the ADF is satisfactory. ADB is seen as very strong in fostering partnerships with governments and commitment to the Paris Declaration targets. However, DFID’s assessment of ADB’s performance in partnerships is mixed relative to other aid agencies
117 Data obtained from SPD.118 The program-based approach is defined by the OECD and the Learning Network on
Program-Based Approaches as a way of engaging in development cooperation based on the principle of coordinated support for locally owned program of development, such as a national poverty reduction strategy, a sector program, a thematic program, or a program of a specific organization. Program-based approaches share the following features: (i) leadership by the host country or organization; (ii) a single comprehensive program and budget framework; (iii) a formalized process for aid coordination and harmonization of funding agency procedures for reporting, budgeting, financial management, and procurement; and (iv) efforts to increase the use of local systems for program design and implementation, financial management, and M&E. A SWAp is a program-based approach operating at the level of an entire sector.
119 MOPAN. 2010. MOPAN Common Approach – Asian Development Bank (ADB) 2010. Available at http://www.mopanonline.org/upload/documents/ADB_Final-Vol-I_January_17_Issued1.pdf, downloaded on 5 April 2011.

5757
Progress in
Areas Relevant
to ADF
Operations
due to limited collaboration, and decisions too often being made in ;�����&120
146. ADB has also carried out a number of public expenditure �����3�+� ��������� ���*� �����������+� ���� ����� ������� ���������������������� 3���� ���� ����� ,��*� ��� ����� �;?�+� ���������� ����countries such as Cambodia, Indonesia, Lao PDR, Sri Lanka, Tajikistan, and Uzbekistan. ADB also signed memorandums of understanding with several agencies, including the Food and Agriculture Organization, International Fund for Agricultural Development, International Labour Organisation, United Nations Children’s Fund, and World Customs Organization, in addition to other preexisting agreements.
147. In another IED study,121� ���� �������� �������� �Z��������practical coordination and partnering between ADB and other funding ��������+����������3����������������������������,-���������������������� �������&� ;��� 3���� �������� �� ���� ������������policy (e.g., harmonization action plans), joint analytical work for country strategies, program reviews, common arrangements,122 and program-based approaches.123 The IED study reported that ADB staff particularly appreciated the joint analytical work, which was ������� �� ����� .�������� ������� ���@�� ��,� ������ ����� ���������� �&�;���?��{���� ����������,���������� ������ �������������aid coordination mechanisms, especially where there is a resident mission. ADB’s involvement in national poverty reduction strategies and harmonization action plans has helped it clarify its comparative advantages. In April 2006, ADB harmonized its consulting services and procurement guidelines with those of the World Bank. However, the fact that ADB’s TA supervision and, to a lesser extent, loan supervision, �������������������.������������/���������������������������������������to expanding coordination with other development partners.
148. Some of the challenges confronting aid coordination and harmonization are: (i) variations in development partners’ interests ���� ������������������� ��������;?������%� ������������������ ����������;?�+������ ��������������������������������������������������countries; (iii) measuring attribution because of progress in the Paris/Accra commitments; (iv) resource gaps in tackling emerging issues ����� ��� �������� ������� ���� ��� ���� �� ������� ����� .�� �;?��� ���� ��%���[���������3������������������� ����� ����������������.���development agenda. Active experience and knowledge sharing are relevant to all development partners, including ADB.
149. Discussions with development partners and key stakeholders in Bangladesh, Lao PDR, Nepal, Pakistan, and Viet Nam yielded a consistent perception that aid coordination and harmonization have
120 DFID. 2011. Multilateral Aid Review: Assessment of Asian Development Fund. London. Available at http://www.dfid.gov.uk/Documents/publications1/mar/AsDF.pdf, downloaded on 5 April 2011.
121 IED. 2007. Special Evaluation Study: Asian Development Bank’s Approaches to Partnering and Harmonization in the Context of the Paris Declaration on Aid Effectiveness. Manila:ADB.
122 These include (i) common operational procedures for project preparation, procurement, and project reporting; (ii) common project implementation units; and (iii) joint support for specific programs with other funding agencies.
123 The activities involved the World Bank (85%), Japanese aid (39%), DFID (34%), and bilateral agencies other than the latter two (54%). By March 2007, ADB had signed 34 memorandums of understanding and letters of intent with various aid agencies. ADB-wide, 17 activities using program-based approaches were approved in 2001–2007.
Challenges remain in
aid coordination and
harmonization

5858
The Asian
Development
Fund
Operations
�� ����� ��� ���� ���� ����� ������ �;?�� ���� ����&� W��� ������ ������views on aid coordination and harmonization from resident mission staff as well as from some key development partners in Nepal. However, the perception varied at both the project and the country levels. For example, in Nepal, DFID, being a major partner in the Rural Reconstruction and Rehabilitation Sector Development Program, seems to have mixed views on the implementation of the project, due partly to weak governance at all levels. In addition, the program suffers from a very low level of TA. This was noted by the Nepal ���������;�����+������������������.����� �������������������������capacity. DFID and other partners believe that the education and health sectors performed better than others (as demonstrated by the SWAp in education and health). This is not surprising, because very little investment had gone into infrastructure development, particularly �������������[���� ����&�W�������� ����� �������+��3����+�������������� ����� 3���� �� 3��*� ���������� ���������+� ��������� ���*� ��������3������ ��������������� ������ ��+��� ������������.������Japan International Cooperation Agency (JICA), citing its decision not to take part in SWAps in Nepal. JICA is aware that Nepal faces major ����������� ���� �� 3��*� ���������� ���� ���*� � ����� ������+� [����political conditions, and weak implementation capacity. In the context of Nepal, development partners recognize that there is a need to set aside dedicated resources for infrastructure development.
$:!&� '�����������;?�+� ������3��������������� ��� �������.���resident mission staff and development partners that it is easier to work with ADB. However, unlike the World Bank, ADB does not have the advantage of expanded presence in the countries. Also, unlike bilateral development partners, ADB programs and projects tend to be �� ���������.����������������+�������,�����������������.������of working directly with the affected communities. Nevertheless, development partners recognize that ADB has adequate capacity to assist a country like Nepal in strengthening infrastructure. Both the government and development partners saw the successfully concluded National Portfolio Performance Review in 2010 as an important �Z������&������������������ ������������;�����+���,��������������3��������[���4����������� ���������������������� �����?��&�
I. Performance-Based Allocation of ADF
Resources
$:$&� ��� ��������� ����+� ���������'''�����-� �� �����*�����,� ��introduce a PBA system to allocate ADF resources according to each country’s policy performance. In ADF IX, donors (i) emphasized strengthening of the PBA policy, (ii) agreed to set aside up to 21% �������������������������3��*��� ������������ ��4��[����countries, and (iii) raised the weight on the governance parameter in the PBA formula from 30% to 50%. In addition, they also agreed to ��������� �� �� ������ �� � ��������� �� ������� �;?�&� W��� ���� ������-� �� ��� ������� ���������� � ��������� ���� ���������� �� ���cap on ADF funding for blend countries, thereby freeing up additional resources for poorer and small countries. The donors also earmarked >&:��������������������������;?�+���.��������.�������������,�&�They also agreed to increase the share of regional and subregional project assistance from 5% to 10% of total ADF resources.
Resident missions helped
raise the bar to harmonize
and align aid, though
challenges remain
A soft cap on ADF funding
for blend countries freed
up resources for poorer
and small countries

5959
Progress in
Areas Relevant
to ADF
Operations
152. ADB adopted a PBA system for ADF resource allocation in 2001 and introduced a formula based on country need and performance (footnote 3). The formula was substantially revised in 2004 and implemented at the start of ADF IX as part of ADB’s reform agenda.124 The intention was to harmonize it with the World Bank/IDA in the sense of having, not the same allocation formula, but a formula that would lead to similar allocation outcomes. ADB produced a policy paper on PBA in 2008,125 and the allocation system was further ���������� �����������������%���������������������������������encountered in earlier PBAs, and to incorporate agreements made in the course of ADF X negotiations. The aim was to make more resources ������.��������������4�����.����;?�������������������������������the better performing poorer countries. In addition, a new conversion scale was adopted to reduce the volatility of portfolio performance �������&� �������� ��� ���*�3������������������ ����� ������� ����������Z ���������� �.����&�W����������������������������������.��������judgment in assessing portfolio performance used in PBA calculations. The resource allocation to blend borrowers is outlined in the policy paper. At the end of ADF X, ADB intends to provide comprehensive and consolidated updates to donors in conjunction with discussions for ADF XI.126
153. ADB uses IDA’s questionnaire for its annual country performance assessment exercise. The underlying principle of the country performance assessment is to fully recognize assessors’ ���������[�Z�.��&��������+���,�����������������������������������country performance assessment exercise as an additional opportunity �� �������������3�����;?�&�
154. The 2007 SES on ADF Operations (footnote 7) covered an ��4�� ��� ��������� � ���� �,�� ������+� ���� ���� �������� ������� �����&�Hence, no additional analysis has been undertaken in this report. This SES recognizes the importance of assigning a high weight to the governance parameter in the PBA formula and its congruence with ����-��� �����&�,���� �����+������Z�������������������������;?��that are the subject of the case studies as well as the participants at the consultation workshop for this study felt that the weight assigned to the governance parameter in the PBA formula was too high and ������.�� �3����+� �������� ��[���� ������������� �������� �������in inclusiveness, responsiveness to environmental fragility, and �������.��������������������������������������������&�� ���������������3��� ���3�� �� 3��*+� �������� �;?�+� 3����� ���*� ��������� �� ������ ��strengthen these areas.
$::&� W����;?����*������������������������������3�*�� ���this study also stated that allocations based on the PBA formula are unreasonably volatile, and that sometimes fall even when performance improves (because improvements in other countries’ performance are greater and the allocation is driven by relative, not absolute, performance). Changes in portfolio performance indicators are often a cause for volatility, especially for countries where a small number of
124 ADB. 2004. Review of the Asian Development Bank’s Policy on the Performance-Based Allocation of Asian Development Fund Resources. Manila.
125 ADB. 2008. Refining the Performance-Based Allocation of Asian Development Fund Resources. Manila.
126 ADB. 2010. ADF’s Performance-Based Allocation System: Review of the Current System and the Post-Conflict Assistance Phaseout. Manila.
The performance-
based allocations of
ADF resources are
unreasonably volatile, and
sometimes fall even when
performance improves
6060
The Asian
Development
Fund
Operations
ADF projects are being implemented. A single project could change the average performance score substantially and abruptly. In such cases, the underlying capability and performance of the country in designing and implementing development projects might not have changed, although its portfolio performance score may be changing �� ����&���,���������������������������������������������� ����� � ���(footnote 125). However, it is too early to conclude if the measure has ������������������� ���&
J. Fragile and Conflict-Affected Situations
$:<&� � ��������������3�����?�������;?����������������>�������old in ADB. During this short period, ADB has made good progress in ������������ ����������������������������+�3�������/�����[�Z�.������and a greater degree of coordination with other agencies. For example, ����� ��+���,��� ��������[���4����������� ��������������������*�+���������������[�������*������� ������&������� ������?�������.����12.8% of total loan and grant approvals during ADF VIII to X, and more than three-fourths has gone to Afghanistan. That country has been a �����.���������������������+���*����� ����������=!��������?���allocation. TA grants to FCAS have focused primarily on infrastructure ����� �����������;&127
157. IED evaluated ADB’s approach to FCAS in 2010.128 Overall, the projects in FCAS status were rated ���������� ���������. There were some successes from using SWAps, for example in the education sector in Nepal, infrastructure development in Solomon Islands and in the roads and health sectors in Papua New Guinea. Pooled funding arrangements and common reporting requirements reduced government’s work load promoting sustained results on the ground. Similarly, good results were evident in some private sector partnerships that supported the prevention of HIV/AIDS in Papua New Guinea, and helped deliver rural ������� ��� �� ��� �����.�� ����������� ������� ������ ��������� ��� ������areas. However, in the Lao PDR, achievements under the Water Supply and Sanitation Rehabilitation Project were limited due to inadequate understanding of local practices, the absence of effective awareness ��� �����+� ���� ����������� ��������� ��������� �� ���������&� W���program loans approved during the reporting period in Papua New Guinea and Nepal achieved short-term outputs and outcomes, but structural transformation and sustaining policy actions to achieve the intended longer-term outcomes and impacts remained elusive, often due to the complexities of the programs and the absence of ownership for a prolonged period. Detailed knowledge of local conditions prior to project design and implementation was important, however, this was easily rendered obsolete by constant shifts in political alliances in the countries, resulting in changes in key leadership and project counterparts, derailing previous efforts.
158. The IED study concluded that the FCAS approach was much needed, as it enabled ADB to provide timely assistance to FCAS countries. It focused on key areas needing attention, working with other partners, and providing increased presence on the ground.
127 ADB. 2010. ADB Engagement in Fragile and Conflict-Affected Situations, 2007–2009. Manila.128 IED. 2010. Special Evaluation Study: Asian Development Bank’s Support to Fragile and Conflict-
Affected Situations. Manila:ADB.
Fragile and conflict-
affected countries
require flexibility and
a greater degree of
coordination with
other agencies
6161
Progress in
Areas Relevant
to ADF
Operations
ADB’s involvement in large infrastructure was assessed as timely and relevant given the economic and historical context. The rationale for ADB’s large infrastructure projects in FCAS countries related to ��4��[���� ������������+� ����.��������� � *��� �������������+�and the need to align with government development agendas. ADB also introduced some innovative approaches, such as political risk guarantee mechanisms and private sector lending. ADB worked with other partners to develop joint strategies. Selectivity and focus may not have been the driving considerations in preparing the CPS for many FCAS countries but, in practice, country programs were much more selective than other country strategies. In accordance with the FCAS approach paper, ADB’s work in FCAS countries has been useful in enhancing partnerships, harmonization, and aid effectiveness.
159. The study noted that ADB needs to devise a differentiated � ����� �� ������� ��� �?��+��� �������� �� ������������ ��[���+���������+� ���� �������� ��������� � �;?�&� ����� ��������� ���� ����characterized by low capacity, weak reform commitment and governance, ����� ������������������������+����������[���+���������������������&�
$<!&� W��������������������� ��4��[�������������+� ������������struggled to strike a balance between the need to respond to urgent ��/�����������������3��������������������������������������������and thorough work on project design. In some cases, the preparation of detailed design was fast-tracked to facilitate construction or implementation of a project. Often the result of such haste was poor implementation arrangements. In some cases, complex environmental �� ���������� �����������+� ���������� ������� ���� ���������analyses, were not strictly followed.
$<$&� '��������������;?�+��3����+���������Z������������&�����������is largely due to geography and to weak capacities and institutions. Consequently, a longer timeframe is needed to cultivate ownership and consensus building during project design. The capacity of regional ����������������������������������������������������&�W���������3����in improved portfolio performance. The delegated portfolio now amounts to more than 60% of the total. ADB’s long-term involvement is helping to raise living standards, build economic resilience, promote ���� ������������+������� ���� �.������������������&
K. Technical Assistance Performance
162. TA projects can play an important role in project design and implementation, not only through preparatory and implementation support for individual ADF projects, but also by strengthening the institutional capacity of ADF countries. However, the performance of advisory TA worsened over the review period. While the success rate of advisory TA approved during ADF VIII was 74%, this rate declined to 65% for advisory TA approved during ADF IX. The performance � W�� ������� ��� ���� ������+� ������+� ���� ��;� ������� �������������deteriorated, as did TA performance in Pakistan.
In Pacific DMCs, fragility is
largely due to geography
and weak institutions
6262
The Asian
Development
Fund
Operations
163. ADB has recognized the need for improving TA effectiveness based on an IED study,129 which formed the basis for introducing a policy paper on TA reform in 2008.130 The reform paper recommended extensive reforms in (i) strategic planning and programming to improve strategic focus, (ii) procedural reforms in the design and processing to improve quality and ownership, (iii) continuous dialogue ���� �� �������� �� �� ���� W�� �� ����������+� ���� ���%� ���������������������� ������������������������������������������������of TA resource management. Different TA reform initiatives by ADB �������+� ����� �����+� ��������������� � W�� ���� ��� ����������(project preparatory, capacity development, policy advisory, and research and development); establishment of the TA Strategic Forum; revision of TA completion reports; and the increasing role of resident missions in TA implementation and gradual delegation of TA projects, including those supported by TASF IV.131 However, it will require some time before results from the introduction of TA reform measures and associated initiatives are available for evaluation.
$<>&� ��� W�� ������� ����� ���*� �� �������� ���� �� ������ � �;?�institutions, evaluation evidence shows that these need to be part of broader, long-term efforts, which also include policy dialogue on any required changes in institutional powers, structures, and incentives, as well as continued implementation support to be fully effective. One-off TA that focuses on skills training or advisory services for the development of particular organizational systems tends to be less effective in building institutional capacity.
165. ADB has been classifying an increasing number of ADF projects as supporting capacity development. Their success in this regard will have to be assessed further. A number of recent CAPEs and sector assistance program evaluations have pointed to the need for capacity development strategies at the country level to provide a framework for related ADB investment, policy, and TA support.
L. Progress in Implementing Recommendations of
the 2007 SES on ADF VIII–IX Operations
166. ADB has made good progress, and donors and ADB management have taken steps with respect to several of the 10 recommendations set ����������������{�&�W���������������� ��������������������������recommendation and sanctioned increases in ADF resources, although mainly through repayments of earlier ADF lending by countries. The second recommendation that ADF needs to consider expanding the ADF to certain non-eligible countries with large poor populations, has not been followed up. The third recommendation, that goal congestion in operations and ADB should be avoided, has been followed up in the sense that Strategy 2020 requires greater sector selectivity and poverty concerns are addressed at the CPS stage through the selection of appropriate interventions rather than through inclusion of special poverty components in individual projects.
129 IED. 2007. Special Evaluation Study: Performance of Technical Assistance. Manila:ADB.130 ADB. 2008. Increasing the Impact of the Asian Development Bank’s Technical Assistance
Program. Manila.131 ADB. 2010. Review of Technical Assistance Special Fund Operations – Measures for Improving
Effectiveness. Manila.
One-off TA tends to
be less effective
in building institutional
capacity

6363
Progress in
Areas Relevant
to ADF
Operations
167. With respect to the fourth recommendation, that ADB needs to be more selective in its support for sectors in many countries—this has .������3���� �.������������!�!-���� ������������� ��������������������������������6!�����,�����������������&�W��������������� .���� ��������+� � � ��� <=�� � ���� ��������� ��� �!!6&� ��,����� ����� �� ���� ���� ���� ������������� ����� ������ ���������is an appropriate goal for ADF operations and that it requires more than direct targeting of the poor in each country. This may have led to fewer targeted interventions during ADF IX. ADB has adopted the sixth recommendation, pertaining to the need for ADB staff expansion, also in resident missions, and more specialized skills. As a result of the �������������� ��������������������� ������� �����.������,��������3-year transformation plan (2010–2012), ADB has been able to recruit much more staff in headquarters and resident missions. The seventh recommendation called for continued efforts in aid coordination and �����������&���,������������� �������������������+������[������in IED’s evaluation of ADB commitments to the Paris Declaration. ADB �������������������.������3����������������� ���������������������+�and the spirit of the recommendation has been addressed.
168. In response to the eighth recommendation that major governance issues should be primarily addressed through program lending, levels of governance-related program lending increased during ADF IX and ADF X. The ninth recommendation stated that ADB should undertake a rigorous analysis to test the validity of the various country performance assessment indicators. ADB made some ���������������!!6+����������� ���������������3�����!$�&�W������� ����of the recommendation remains to be addressed. Responding to the tenth recommendation that ADB should pursue a varied approach to debt distress of ADF countries and not rely mainly on the ADF grant ���������+���,� ���3�*�����������3���� ���� '������������;�������Fund and the World Bank on debt sustainability. ADB has also added two new staff positions in the SPD linked to debt sustainability analysis. The SES considers that the spirit of the recommendation has been �������&���������������;������������� ��������'{��������������in Appendix 10.
ADB has made good
progress in implementing
several recommendations
of the 2007 evaluation
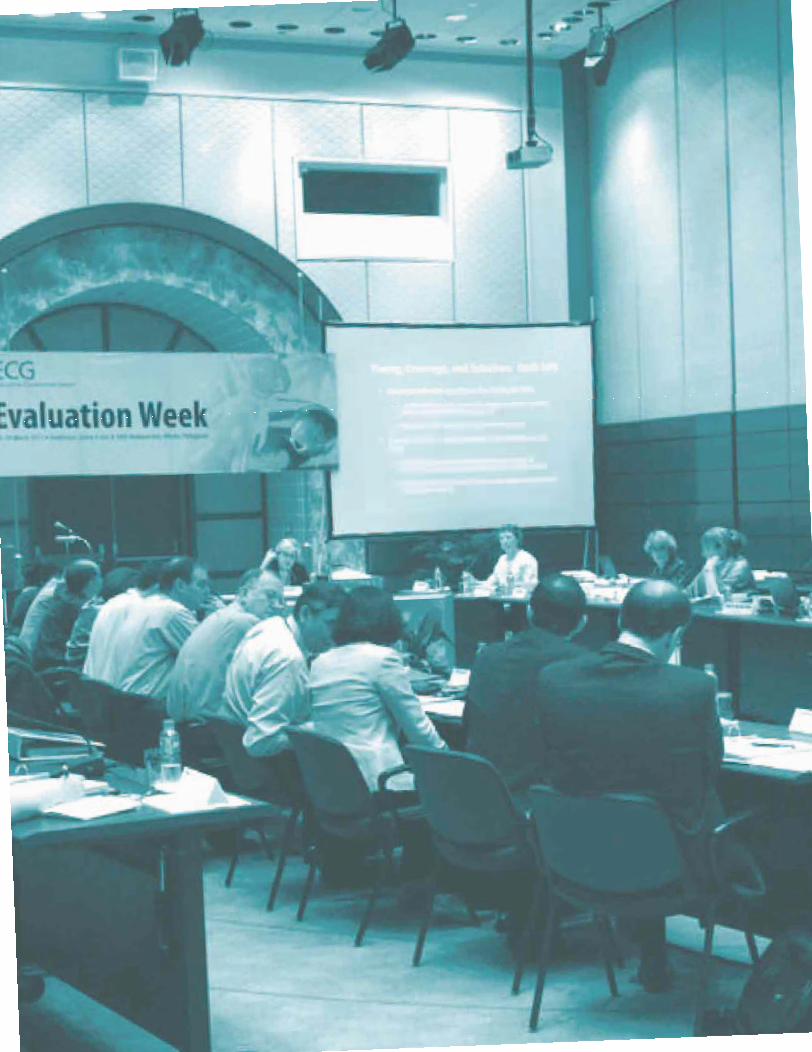
6565
DMC
Stakeholder
Consultation
Workshop
Chapter 5
DMC Stakeholder Consultation Workshop
169. In January 2011, a consultation workshop held in Bangkok sought the views of major ADF-recipient countries on their experiences 3���� ���� ������� ���� ���������� ���� ��������� �������� � ���� �{�&�W��� 3�*�� � 3��� ��������� .�� $:� ������ ���������� ������� ���$!� ���� ��������+� ���������� ���� ���� �������� ���� �����&132 Individual country presentations are available in Supplementary Appendix A. The following are the key messages from the workshop based on discussion with the workshop participants.
A. Usefulness
170. In all 10 countries, ���� ������ ����� �������� ����� ���� ����was useful in addressing country needs and priorities, particularly ��� ����������� ������ ��������� ������� ��������� ������������ ���infrastructure and, to some extent, in the social sector. The type of projects under ADF support varied from one country to another. The participants felt that TA often resulted in capacity substitution rather than capacity development, and that capacity development needed to be more outcome oriented with enhanced accountability for both ADB and ADF countries. It was recommended that ADB and the ADF donors consider improving the PBA system for ADF resource allocation, as the current approach puts undue heavy emphasis on good governance, 3�������������������������������������&�������������+����������������representatives felt that the ADF will continue to have a major role in ��������������������������������� ��������������������������������������� ��� ���� ����� ���� ������� �����+� ���������� �������� �������and environmental vulnerability, economic crises, and food security. In addition, institutional capacity in all 10 ADF countries is still weak and requires substantial additional efforts and cooperation between ADB and ADF countries to ensure aid effectiveness.
B. Relevance
171. The participants acknowledged that ADF has been an important ����������������������� ����� ����������� ����������� ���������� ��3��� ���� ������ ��������� ��� �;?�&� W���� ���������that ADF-funded projects and programs have been well aligned with their own national development and poverty reduction strategies. For the ADF to continue to remain highly pertinent in the medium
132 Bangladesh, Bhutan, Lao PDR, Mongolia, Nepal, Pakistan, Solomon Islands, Sri Lanka, Timor-Leste, and Viet Nam. Three countries (Afghanistan, Cambodia, and Kyrgyz Republic) were not able to send representatives to the workshop.
ADF is useful in addressing
country needs and
priorities

6666
The Asian
Development
Fund
Operations
term, workshop participants agreed that its scope should also include support to deal with emergencies, climate change, and economic crisis; to ensure food security; and to develop remote and less developed areas and communities, which will require ADF resources beyond the current level. The ADF donors should therefore consider increasing the size of the ADF in the next replenishment.
C. Overall Effectiveness of ADF Operations
172. The overall impact of ADF operations was found to be moderate, because there are still large pockets of the poor and �������.��� ������������;?�&�W�������������������� ��������with regard to poor populations and less-developed areas was deemed �� .�� ����������&� �� ����� ������ ���� �� ���� �������� ������be emphasized, with more resources going to less developed areas. ;��� �� ��� �����.���Z������� ������ ����������������� ����������������������4������ ��������������+���� �����;?������������������;�|����� ��������� �3�������������� ����� �������&�
173. The ADF was found to have been useful in promoting RCI and .��������� ���������������+�.���.������������&��3����+�����������������3���������������������� ��������+�.����������������3��������������their populations in border areas, and there is a need to expand, for example to other types of infrastructure and the social sectors.
174. The SWAp approach was seen as having worked well against the backdrop of good institutional capacity, but was limited to health and �����������������������3��;?�&�W���������������������� �����merits piloting in other core areas of ADB operations, particularly in �������������������������������������������3�����������������������capacity.
$=:&� W��� �;?� �� ������������� ������� ���� ���� �����������concurred with IED’s observations that increasing project success rates will require further improvements in (i) project design, including more effective participation, consultation, and better design to promote country ownership, and funding of design/detailed project feasibility; (ii) the role of ADB resident missions by delegating more authority and strengthening technical capacity; and (iii) management of project �������+� ���������������������������.���;?����������������ADB, and postcompletion reporting on the achievement of outcomes.
176. The representatives also noted that there was still room for further improving the current PBA system by making ADF allocations �����/����.��+��������+����������+�������� ��������������4� ������development challenges. Governance is an important component of the �����+�.�������������������3����������&�'��3�������������������������a satisfactory measure of the governance variable was introduced, the weight assigned in the allocation formula should be reduced.
$==&� W��� ������� �;?�� ���������� ����� �� ��3� � ����� �� �� ����������� ����� 3��� ������+� ���� ������ .�� ������ �������� 3���� ����country’s human development strategy. Among the various options, on-the-job training and strong linkages with universities and training centers and/or industry are required in the national interest to enhance knowledge and skills. In addition, accountability mechanisms of the
The current focus of
ADF operations in less-
developed areas has been
deemed insufficient
The overall impact
of ADF operations
was moderate

6767
DMC
Stakeholder
Consultation
Workshop
partner country need to be strengthened for effective monitoring and reporting of TA outcomes.
D. Other Suggested Areas for Improvement
178. The workshop participants suggested the following areas where ADB and the donors need to engage and work toward achieving effective ADF operations:
(i) RCI has tremendous potential for reducing poverty in border areas and promoting international trade. Allocation for RCI should be increased from the current 10% to 15%–20% in the next replenishment to support more RCI interventions.
(ii) A separate allocation for FCAS and other vulnerable countries is very important; hence, the current level of support should be maintained.
(iii) There is a need to increase funding for ADF-only ���������������������������������������� ������&���mechanism needs to be worked out for that increase to materialize.
(iv) ��,������������������������� ������������������.��simplifying operational procedures, harmonizing with country systems, and reducing assistance delivery time.
(v) W��� ���� �������� � ������� �������� �/����+� ���� ����private sector operations, good governance and capacity development, partnerships, and knowledge solutions) are important in ADB operations. As these are more process-oriented, ADB needs to give more thought to new approaches for achieving them.
(vi) For several ADF countries, agricultural development is critical for reducing poverty and ensuring food security. ADB needs to link support to infrastructure development with agriculture by emphasizing the development of a value chain, and by improving ���*���������� �����������������&�
(vii) ADB needs to put sector development at the forefront ������ ����������������������������������������;?�&�For this to happen, ADB and ADF operations need to move away from stand-alone projects with project implementation units or project management units to SWAps, or get sector agencies to lead. Problems in sectors need to be duly diagnosed, and support for capacity development, training, and mentoring must be provided.
(viii) ADB needs to pay more attention to the sustainability of �������� ����������������������3�����;?�����������related to (a) capacity development in agencies to ���������������.������+������.%������������������������������������;�|�&�
(ix) Both project and program operations are important to �;?�&��3����+��� ������������������ �����+���,�needs to maintain a correct balance between the project and program lending modalities, as projects tend to deliver visible results within a reasonable period, while programs tend to be medium to long term.


6969
Key Findings,
Issues, and
Recommen-
dations
Chapter 6
Key Findings, Issues, and Recommendations
A. Key Findings
1. Financing ADF Operations
179. The size of the ADF has increased faster than donor contributions. The size of the ADF has increased more than 15-fold in nominal dollars and more than seven times in constant dollars between ADF I and ADF X. Donor contributions were the primary source until ADF V. Compared with ADF VI, donor contributions to ADF VII at constant prices fell by 39%. Thereafter, donors’ new contributions to the Fund ��� �������� ������ ����� ���������� ����������&� ��[3�� ���������during ADF VI and steadily increased to become the most important source under ADF X, accounting for 58.8% of ADF X resources. The introduction of grants in ADF operations in 2005 is likely to dampen ������3������[3��������!$9&�
180.� �������������� ��������������������������� � �����to the requirements of poorer and smaller crisis-affected countries. ���� ��������[3��� �������������.�������������� ������� ���������������� �Z�� �� ��� ���� ������&� ������� ���� ������� ��.��� �������������+������.���������������������������;?������������������������ ��������[3�� �����,&��3����+���������;?�����������������been receiving higher levels of ADF resources per capita than other ������������+�������������� ����� ����+����������;?�&����4����countries with larger populations such as Afghanistan and Nepal have received less ADF funding per capita despite their lower human development levels.
181. Blend countries have relied more on OCR. Blend countries’ �����������}?������������������ ����� �����������.��������������&�These countries have used 76% of their ADF allocations for stand-alone projects (the majority of these dominated by nonrevenue-generating projects); the remaining ADF resources have been blended with OCR.
182. ADF sector allocations have largely met ADF commitments. ADB has channeled increasingly large shares of ADF resources to infrastructure, especially transport. Nevertheless, actual infrastructure allocations have stayed below indicative ADF targets. Support for water and sanitation has stagnated. Support for education actually decreased during ADF IX and ADF X.
183. Support for economic crisis has been uneven. ;�����;?��severely affected by the global economic crisis of 2008–2009 were ADF-only countries. ADB approved an additional $400 million ADF ���������� ��������� �� ��� � ���� ���� �������� ���������� ���4����

7070
The Asian
Development
Fund
Operations
countries to face the global economic crisis of 2008–2009. Further, to support ADF-eligible borrowers’ stimulus and social protection packages, ADB allowed front-loading of up to 100% of their biennial (2009–2010) ADF allocation. But countries affected most by the crisis got relatively �������������������������+� ������������������ ��[�Z�.������ ����,�������ADF and the absence of a crisis support facility for ADF countries.
2. Performance of ADF Operations (2001–2010)
184. The performance of ADF operations at the country-level ����� ����������� �����CAPEs rated ADF support in Bangladesh, ,�����+�?��.���+�������+�;�����+�¢�.�*�����+�����������������successful, while operations in Indonesia,133 Nepal, Pakistan, Papua New Guinea, and Sri Lanka were rated partly successful. Although political instability and civil strife affected ADF operations in most of the countries with less satisfactory performance ratings, CAPEs also point to other factors, particularly lack of (sub)sector and geographical focus of ADB support, inadequate analysis of binding development constraints, lack of local institutional capacity and ADB implementation support, and sustainability issues.
185. The success rate for ADF projects improved, but the average was hampered by the poor performance of projects in Pakistan. The corporate success rate of ADF operations134 improved gradually during the last decade (2001–2010) compared with earlier decades. About 80% of all projects in ADF-only countries were successful. If Pakistan (19% success rate) is excluded, the success rate of blend countries would also be 80%. However, the overall success rate of ADF-�������� �������3�������<<����������������� �� ����������projects in Pakistan. If Pakistan is excluded, the overall success rate of ADF assistance during the review period would be 80% compared with 73% (for non-Pakistan assistance) during the ADF VI–VII period.
186. Success rates varied substantially among sectors. Only a �3� ������� ���� �� ��������� ���.��� � ������ ����������� �� ���3�meaningful conclusions on sector performance. Among these, the success rate was the highest for multisector projects—mostly emergency response loans—possibly due to the greater visibility and stakeholder support associated with these types of operations. Although still above the ADF average, the performance of transport projects approved during ADF VIII–X appears to be declining compared with earlier projects for reasons that have to be further investigated in �����������������������Z ������������ ��������� ��������������2007. The success rate for ANR projects improved to 67%, while there 3�������������������:>�������������������;� ������&�
187.� ���������� � ���� ��������� �� � ������ ����� While the �����������������������������3�����������������������������4������ �����������+� ����� ������� ������� ��� ������ ���������issues. Only about 57% of completed projects were �������� or better. ADB introduced a number of measures during the review period to �� ���� ������ �������������+� 3����� ������������� �������� ������
133 Indonesia was eligible for ADF resources until early 2009.134 The corporate success rate represents the average share of ADF projects with an overall
highly successful or successful rating. Project ratings are based on assessments of project relevance, efficiency, effectiveness, and sustainability, with weightings of 20%, 20%, 30%, and 30%, respectively.

7171
Key Findings,
Issues, and
Recommen-
dations
implementation delays for ongoing projects. The introduction and � ��������� �������������������������� ���������������������������time lag between loan approval and effectiveness. The disbursement ratio and the contract award ratio also improved.
188. Achievement of envisaged project and sector development outcomes was weak, in part due to the low effectiveness of the Pakistan portfolio. Only 63% of the ADF projects were effective in achieving their projected project outputs and outcomes—79% of all projects in ADF countries other than Pakistan. Physical infrastructure investments (particularly in energy and transport, but also in education, irrigation, and water) were more effective in achieving envisaged project outputs than support related to capacity development and institutional or policy reforms. However, unless asset management and issues effecting the utilization of assets or demand for services are effectively addressed, infrastructure will not generate and sustain �������������.������&� ��� ������ �������������+� ������ ������� ����need for complementary investments and support in other sectors to maximize development outcomes.
189. The success rate for program loans improved, but policy-based operations need to be more effective. Although the success rate of policy-based (program) loans improved to 63%, their effectiveness �������������������������������������������.������ �����������3&�Lack of wider political support for substantial policy reforms rather than inadequate problem analysis was responsible for the selection of policy actions under program loans that did not address binding policy constraints to sector development. Particular emphasis of ADB support needs to be on development of a range of project design/policy options and advocacy work to facilitate consensus and sustained broad-based commitment among a wide range of stakeholders. Also, the feasibility ������������ ����������������������������������������������.��political turmoil needs to be carefully assessed.
190. ADF contributed towards development impact. ADB’s contributions to development results were modest/partly satisfactory in Bangladesh, Pakistan, Sri Lanka, and Uzbekistan. Contributions were .���������,�����+�?��.���+�������+�;�����+��� ��+�������������+�with relative success being a function of better effectiveness in achieving ����������������������&��������������.���������������+���������last decade, ADF support likely contributed to broad-based economic growth in recipient countries mainly by (i) improving connectivity to enhance access to markets and services; (ii) enhancing the reliability and levels of energy supplies through power sector reforms, PPPs, and ������������������������ �������� ����%� ������������������������ ��������levels through investments in rural infrastructure; (iv) promoting the development of policy, regulatory, and institutional frameworks �� ������� ���� ��������� ���� ��%� �� ������ ������ ���� �������management. ADF resources also helped enhance access to health, education, and water supply and sanitation, albeit at a smaller scale ��[�����������������������������������������&�W��������������,-��contributions to improved governance through support for public sector management reforms were below expectations.
191.� �� �����!�� ������������������ �����������������!�� � success. Important project/program design and implementation factors responsible for poor performance are (i) inadequate problem
Key Findings,
Issues, and
Recommen-
dations

7272
The Asian
Development
Fund
Operations
��������+� ���%� ����������� ����������� 3���� ���*�������� 3�����formulating the project, (iii) complex design and implementation arrangements not congruent with country capacity, (iv) lack of ownership and political commitment, and (v) inadequate country capacity for implementation and commensurate ADB support. '�����������������������.�������������������.������ �������������and proactive project implementation support, both of which require adequate staff and consultant resources.
192. Sustainability of ADF operations continues to be a challenge. About 61% of ADF projects were rated most likely or ������ ����������� during the review period. Challenges included lack of resources for ���/�����}�;����������/�������������������� �����&����� ��������were rated ���� ������ ����������� particularly in countries that have weak institutions, inadequate human resources and high staff turnover in executing/implementing agencies, inadequate budget provision ��3���������������������������}�;����������������������+�����limited ownership of supported projects and reform programs.
193. Weak institutional capacity is an important threat to project effectiveness and sustainability. Country-level evaluations have found that ADB often did not systematically assess institutional �� �������������������� ����������������&�'�������������;�����+�evaluations found that support for strengthening country systems was not always an integral element of sector assistance and relevant key ���������������������� ����������������������������� ���������&�Capacity constraints were particularly severe at subnational levels, and countries that have been in the process of decentralizing their ������ �������� �� ��������� �������� ������� �� �3��� ������� �government have faced particular challenges. IED evaluation of the effectiveness of ADB’s capacity development assistance found that the following features enhance the success of capacity development: (i) basing capacity development strategies on comprehensive and adequate capacity assessments, (ii) using results-based approaches to implementing capacity development, (iii) having long-term engagement, (iv) encouraging participatory approaches to enhance government ownership, and (v) cooperating with other development partners for preparing capacity development programs. Apart from strengthening technical capabilities, capacity development should also cover organizational and contextual issues. Positive experience with SWAps, particularly in education, indicates that they can be a useful mechanism for fostering greater country capacity in the long run, although their use requires a minimum level of national capacity to be effective.
3. Progress in Other Areas
194. Governance continues to be a major challenge. ADB was ��������������������������� �����.��*� ���� ����� ������ �������governance with focus on accountability, participation, predictability, and transparency. The 2006 internal review found that sector modalities became less effective in promoting governance and that country governance assessments tended to lack depth and made little difference in ADB’s approach to governance and institutional development, as they tended to be too general to deal with governance issues. To address this, ADB launched the GACAP II in 2006, which envisaged a risk-based approach to governance assessment, particularly in the
7373
Key Findings,
Issues, and
Recommen-
dations
priority sectors in which ADB has operations. GACAP II guidelines, which 3����� ��������;����!!6+������� �.�����������������������+� ���������+� ���� ��.������ ���� ���&� ;��.����� � ��� ���� ��,@}{?������4?��� ����'���������������������������������������������14 ADF countries in 2007 to 28 in 2010. An ongoing strategic review of governance and development agenda in the past 15 years suggests the ���������%���������������� ���������;������������������������operations, (ii) greater focus on political economy issues, (iii) sharpened ������;��+����%�������������,������� ����������������������+���%�a risk-based approach to project implementation, and (vi) greater use � ������� �������&�{����������������� ��3����������<9������� ������� 3���� �� ���������� ��������� ������������� 3���� ���������&�?� ����� 3���� ����� ������+� ��,-�� �������� ����� ��� ��;� 3��� �3&�Thus, promoting good governance remains a continued challenge that requires longer-term engagement and stronger partnerships with �;?�&
195. ADB’s focus on private sector development (PSD) has been increasing. ADB’s commitments for PSD under ADF X envisage efforts to improve the investment climate, attract private investment through support for infrastructure development, promote policy and ������������������+���� �������������*���+����� ���������/�����skilled workforces. ADB’s Strategy 2020 seeks to expand support for PSD and private sector operations to 50% of ADB’s assistance in terms of value and numbers by 2020. The share of projects with ������������������������>��������������������������������+�3�����is close to the 30% target set for the theme in ADF operations by 2012. The respective shares for ADF VIII and ADF IX were 9% and 16%. The focus of PSD under ADF operations has been largely on �� ����������������������������+��������������������� ����+������;{������ ����+� ������������ ������������������������&�W����� ����of operations on creating an enabling environment for the private sector is being evaluated under an ongoing IED SES.
196. Gender mainstreaming has been back on track in recent years after some setbacks. ADB was on track for meeting its target for gender mainstreaming in ADF operations in 2010. During 2001–�!$!+�>=����������� ��������������������������������������������������������������/����������+�������������:��3�����������������effective gender mainstreaming). The prevalence of gender as a theme dipped in ADF IX approvals, but has been improving considerably afterwards. According to ADB’s Development Effectiveness Review 2010, 53% of ADF operations were gender mainstreamed in 2010. Nevertheless, continued efforts are needed to better target gender equity in CPSs along with adequate support for gender mainstreaming during the implementation of ADF operations.
197. Environmental sustainability as a theme has grown in ADF operations. Environmental sustainability is one of the three strategic agenda of ADB’s Strategy 2020. Consequently, there has .�������������������������������������������������������4����������,�operations and programs, knowledge products, and TA for improving management of the environment. ADB has begun several environmental initiatives: (i) preparation of the Asian Environment Outlook, (ii) Cities Development Initiative for Asia, (iii) Clean Air Initiative for Asian Cities, ���%�{������{��������'���������+���%�?�������?������������+����%��������and Environment Program, and (vii) Sustainable Transport Initiative.

7474
The Asian
Development
Fund
Operations
Environmental sustainability is a thematic focus in about 34% of ADF X projects as compared with 8% in ADF VIII and 12% in ADF IX. According to the Development Effectiveness Review 2010, the 3-year average percentage of projects supporting the environment theme has ��� �����������������������:�&�;������������������������������������stage of implementation and are yet to be evaluated. Nevertheless, their effectiveness will be vital to the development prospects of the �����&����+������������.�����������3�����������������������������directly support environmental sustainability activities under a given project, as the full loan or grant amount is counted under any selected ��������� ������������� ����� �� ���� ��� �������� ������ �� �����addresses the thematic objective.
198. A 2009 IED study on GHG implications of ADB’s energy operations recommended to (i) assess GHG implications of future �������������������������3���������������|�|��� ����+����%� �����|�|4�������� ������������ .�� ����.�������� �� ���������� �� .���down the incremental cost of clean coal technologies, (iii) scale up appropriate and affordable renewable energy technologies, and (iv) aggressively pursue methane capture projects and scale up ������������ ��� ����������� ������� ��������� �� �������� ������&� '��2010, another IED study proposed a method to quantify the gross carbon emissions from the construction and operations of ADB-funded land transport projects. It recommended ADB to adopt carbon emissions as a consideration for project design; encourage a modal �������������4�������������������������������������.������������������� �������������������+���� ��������� �3�����;?�+��� �������������� � ����������������������&�;�����������������������these recommendations and has developed action plans.
199. Regional cooperation is becoming more prominent in ADF operations. ADB formulated an RCI Strategy in 2006, the implementation of which received a boost after Strategy 2020. ��,� ���� ���������� ��� ����� �?'� ���������������� |;�� {������Cooperation Program, Central Asia Regional Economic Cooperation ������+�������������.��������{������? ������+������������Approach (2010–2014). The importance of RCI in ADF projects has ��3�� ������������� ��� =�� ��� ���� �'''� �� $>�� ��� ���� '�� ���� ��9$�� ��� ���� ����� �� ������ � ���� �&� ��������� �� ���� ����� �����Effectiveness Review 2010, the share of intraregional trade of ADF countries increased from 58.5% in 2005 to 60% in 2009, and ADF-only countries realized a greater increase from 59% to 66% during the same ����&� W����!!=��������� �����3�� ����|;������������ �����3�*�(2002–2012) found that the program had delivered concrete results �������������.�������������������������|;�&���*�3���+���,-����������?�����������5�;� �������������� ������������������������������regional cooperation coupled with key economic reforms could help double per capita income in the Central Asia Regional Economic ? �������������3��������������������������������������� �����&�'{�-�� ���������� ��� �!!6� ������ ���� |;�� ����������� successful and recommended that ADB could further improve its performance by ��%� �� ��������� ������������� ��� �������� .������� ������� ���� �������and implementation of subregional projects; (ii) engaging in greater policy dialogue to raise awareness, provide policy advice, and support actions to reduce the negative impacts of RCI; (iii) supporting policy and procedural reforms to ease ”software” constraints to derive �������� �������� .������� ��� ������������ ��� �����3������ ����

7575
Key Findings,
Issues, and
Recommen-
dations
(iv) paying more attention to results, monitoring of progress, and cost effectiveness of investments.
200. Harmonization and alignment have improved. Aid coordination and harmonization improved during the review period, in part due to the effective roles played by resident missions. A recent IED evaluation of ADB’s commitment to the Paris Declaration found that coordination and partnerships with other funding agencies at ����������������3���������Z����������������������������������,-��management information system, particularly in areas like policy coordination, joint analytical work for country strategies, and other coordinating arrangements at the country level. Furthermore, ADB remained modestly selective by engaging in sectors of core strengths ��&�&+��������������%�3�������3�������/�����[�Z�.�������������������������� ��� ����������� �;?�-� �������� ��������&� W��� ��3���� �������the principal challenges to harmonization and alignment: (i) different ���������� ���� ��������� � ���� ���������� ���%� 3��*� �;?� �� ������ ������ ����������� ���� ����%� �������� ���� ����������� �������� �� � ��addressing emerging issues such as the multidimensional impact of ������������������;?�&
201. Progress has been made in implementing recommendations of the 2007 evaluation of ADF operations. Progress in implementing the 10 recommendations of the previous SES on ADF operations has been good. Donors provided a generous replenishment but did not provide ADF access to People’s Republic of China and India, which have the largest numbers of poor. They partly adopted the recommendation to have simpler and fewer objectives for the ADF. ADB has been more selective in its sector priorities at the country level but found it challenging to achieve sector selectivity at the corporate level. It has pursued its poverty reduction mission both through targeted projects and programs as well as through incentives to support economic growth in general. ADB has also retooled staff skills both at headquarters and in resident missions. But there are still gaps in staff capacity. There was good progress in implementing ADB’s commitments to the Paris Declaration on Aid Effectiveness. Efforts have been made to strengthen governance through program lending during ADF IX and X. ADB did ��*�� ���� ����������� �� ���� ���� ��������� ������ ��� �!!6� ����is planning to review the same in 2012, while the core part of the recommendation remains to be addressed. Finally, ADB has been 3�*�����������3��������'������������;�������������������������Bank on debt sustainability issues in ADF countries.
B. Issues
202. Limited progress in non-income MDGs. Slow progress in ������������4������;�|�����������������&�'�� ���������+�;�|����malnutrition; under-5 mortality; access to water and sanitation; and education, especially in relation to women, have yet to be achieved in ����� �;?�&� W��� ����� ����� {����������� �����3� �!$!� .������+�“…progress on other measures of human development ��������� �� ���������� ������� ����������� in the region was mixed and slower in the weaker ADF countries, particularly the ADF-only countries” (page 7; bracketed expression added). ADB did provide support in two key ;�|� ������ � ��������� ���� 3����&� ,��+� ��� ���� ��� ��������� ��� ����size of the ADF, investment in the education sector declined sharply

7676
The Asian
Development
Fund
Operations
���.������������������������&�����������������������;'������������modestly, assistance to this sector is largely concentrated in the urban areas, even as more people in rural areas remain underserved. Overall support for rural infrastructure, particularly rural roads, and rural water supply and sanitation remained low in recent years.
203. Growing inequalities. Rural areas in general continue �� .�� ��������� ��� �������������� ���� ���������� �� ���������employment. Quality education and health services elude the rural poor, and access to these opportunities is not uniformly available. Notwithstanding the GAD progress, women still do not enjoy the equality they deserve, whether at home, in schools, or at work. ?�������-������3���-�������������������������������+���������������from the slow progress in reducing infant and maternal mortality rates. Income inequality fell in 7 of 16 ADF countries for which data on |������������������������.��&�W����� �������3�������/���������3������and across countries are challenging the sustainability of the growth process.
204. Emerging development challenges. In addition to the ����������� ���� .�� ��3� ������� ��� ��4������ ;�|�� ����������above, future ADF operations will increasingly need to address the following additional challenges: (i) climate change and increased vulnerability to natural disasters (drought, earthquakes, and [��%�� ���%� ���.��� ��������� �����[��������� �� ��������� ���������� (iii) managing economic and environmental fragility in the region; (iv) rapid urbanization and its impact on water, sanitation, and waste ������������ ��%� �� ���������� ���� ���%����������3�� ������� �������3�������������������������������������������&�
205. Impact of crises on ADF countries. The experiences of several ���4�����;?����3��������.��������������������������������������negative impacts on them through one or more channels such as trade, remittances, and prices of exports. A recent IED evaluation showed that the principles used for allocating ADF resources are inadequate to deal with the special requirements of crisis-affected countries.
206. Impact of grants on future ADF support. Recent trends in ADF support show that the growth in the magnitude of ADF resources 3�����������[3����� ��������������������������.�����������remained more or less stagnant in constant dollars since ADF VII. The introduction of grants will have a depressing impact on the magnitude ���[3������!$9&�W����������������������� ��������������������of ADF resources in the absence of an increase in donor contributions in real terms.
207. Decline in project preparatory TA. ADF countries tend to ����� 3��*��� ������������� ���� ���������� �� ������ ����� ����� �;?��for designing and preparing projects. A declining trend in the ratio of project preparatory TA funds to loan and grant approval volumes (Appendix 11, Table A11.1) could impair project success. The success rate of ADF projects approved during the review period that were �� ������������ ������ �� �������W��3����������������������������that for projects which did not have any project preparatory TA (75% vs. 57%). The respective success rates for ADF-only countries were 91% for projects with project preparatory TA, and 68% without (Appendix 11, Tables A11.2–A11.3). The volume of project preparatory TA funds

7777
Key Findings,
Issues, and
Recommen-
dations
per project has remained nearly unchanged in nominal terms over the review period for ADF-only countries, but substantially declined for blend countries during ADF IX.135
208. Lack of a comprehensive approach to enhance capacity in DMCs. Capacity development efforts have been less effective than anticipated. ADF borrowers need continued support for capacity development, which should be based on holistic capacity development strategies that are based on needs assessments and also address any issues related to institutional powers, structures, and incentives.
209. Sustainability issues for ADF projects. W��� ������������� ������������� ��������.������ � ��,� ����������� ���%4�������������������� ��� �;?�� �������� ��� ������ �� .�� ���������&� ��,� �����improve the sustainability of investments through systemic policy �������������/�����.������ �������+� ���4���������������������� }�;� � �������������+� ��� 3���� ��� ���/����� W�� �� ����� ������������ ������������� �� �����&� �������� ��������� ��������.������ �������have been addressed at the project/sector level in a more proactive manner in recent years, an analysis of case study projects showed that ������� �����������������Z����������+�����������������������������in obtaining stakeholder support. Sustainability assessments, at the strategic level, at the time of preparation of the CPS using a medium-���������������3�*������������������.������� �����������+�3����enhance the sustainability of investments. The assessments will have to encompass the enabling environment (policies, strategies, and ����������%+� �����������.���������������������%+����� �������������capacity.
210. Low development effectiveness of ADF operations in Pakistan. ��*������ 3��� ��� � ���� ���� �������� ���� �������� ����������approval for 15% of ADF loans and grants during the period under review. A preliminary review of causes that have precluded better performance in Pakistan is made in IED’s Annual Evaluation Review and includes (i) weak or inappropriate design, (ii) weak political commitment, ����%������� ��� ������������� �������� �� ��������+��������%� �����������supervision. While the success rates for Pakistan projects approved during ADF VI–VII were already below the portfolio performance average of 70% for that period, substantial increases in lending to the country during ADF VIII–IX possibly compounded existing capacity problems in an increasingly challenging macroeconomic and political environment. While management is undertaking steps to improve the country’s portfolio performance, investigating the fundamental causes of project failure would enable lessons to be drawn for forthcoming operations. IED plans to do a CAPE for Pakistan in 2013 to feed into its next CPS.
135 For ADF-only countries, the average amounts of project preparatory TA per project approved by ADF period were $569,012 during ADF VIII, $589,943 during ADF IX, and $581,214 during ADF X. For blend countries, the amounts were $812,101 (ADF VIII), $650,851 (ADF IX), and $725,986 (ADF X).

7878
The Asian
Development
Fund
Operations
C. Recommendations: Looking Forward
211. The performance of ADF operations improved and progress was made with key operational ADF commitments. ADF countries are expected to face continuing challenges, which will require both the availability of additional resources and their more effective utilization for general development effectiveness. To ensure sustained development effectiveness in the region, ADB, together with development partners, 3���� ����� �� ��� ��� ���������� �� �������� ������ ����������&� W���response should entail continued relevance and a continued strong ���������������������&�W�����{����������������������������,�;���������� �� �� �������;?�� ��� ���������� ����������development and better quality of life for their populations.
212. Seek additional funding for ADF operations, particularly for ADF-only countries, to further reduce both income and non-income poverty and enable them to better cope with vulnerabilities. The ADF has played an important role in sustaining a broad-based pattern ���3���������������&��3����+�������������������������� �����������;?������Z ���������� ��������� ����� ���������������������� �������&�;���3����+������������� �����4��������������������������remains a major challenge for ADB and other development partners. In addition, several new challenges have emerged in recent years such as the global economic crisis, climate change and environmental fragility, high energy costs, stagnating food productivity and production coupled with increasing food price volatility, and more frequent occurrences of natural disasters. These challenges increase the funding ������������;?�+� ������������������;�|���������������������?���countries, some of which are also prone to increased risks from climate change. Additional ADF resources would help ADF countries reduce their comparatively higher poverty levels and lack of resources to cope with natural disasters and external shocks by alleviating their limited ����� �� �Z������� ��������� � ����� ����� ������&� �� � ���������������������3������� ���,������ �������[�Z�.���������.�����������to the needs of poorer and smaller countries during economic crises.
213. Increase education, rural infrastructure, water and sanitation, and environment operations to help achieve related MDG targets. ADF sector allocations have continued to be generally aligned with Strategy 2020, with greater focus on investments in infrastructure. Further attention will be needed on other sectors ����� ������ �� ��4������ ;�|�+� ������������ ��������� ���� 3�����and sanitation. Additional emphasis needs to be given to support that enhances productivity in rural areas including, among others, rural infrastructure. Balancing infrastructure development with complementary investments in education, HSP, environment, and ANR will be crucial to making growth inclusive and arresting widening inequities between rural and urban areas. Such complementary ������������ ���� .�� �������� ������� ��� ���� ���� �� .�� �����development partners. Findings of an ongoing IED study on project complexity, as well as analysis undertaken in conjunction with the development effectiveness report suggest that coordination of sector-based support efforts is preferable to complex multisector projects with a large number of non-core sector components.

7979
Key Findings,
Issues, and
Recommen-
dations
214. Strengthen capacity development efforts on the basis of capacity development strategies at country and sector levels. ADF �������������������� ���������������;?�+����������������������lower capacity. Past support for capacity development has not achieved envisaged levels of institutional capability or change. The majority of capacity development efforts were focused on the provision of one-off TA rather than holistic approaches that address conditions which determine the effectiveness of institutions including the sector policy ����������+������������������� 3���+������������������+���������incentives. ADB needs to base capacity development efforts on results-oriented, long-term strategies for partner institutions in key sectors. Cross-sector issues that have a bearing on the performance of sector institutions (e.g., decentralization, devolution of services, civil service conditions, state enterprise restructuring, budget allocation processes) �������.����������������������������������������� �������������on public sector management reforms.
215. Strengthen ADF operations through adequate allocation of TA resources to improve project design and country institutional capacity. Operational experience during 2001–2010 shows that design �������������3��*���������������������������[�������������������ADF operations. TA allocations for country-level project preparation ������������������������������������������������������������������������assistance volumes, which is likely going to exacerbate project design and implementation issues related to inadequate problem analysis ���� ���*������� ����������+� ���� �� �;?� ������������� �� �����&�Adequate levels of project preparatory TA resources would likely help by fostering better project design. TA resources are also needed to �� ������������ ���������������;?������������+�3�������������3���������.�������� ������������ �����������������+���������+�and sustainability. At the same time, more efforts need to be made to increase the effectiveness of advisory TA for capacity development.
216. Improve the development effectiveness further by adopting a proactive, holistic approach to addressing sustainability concerns in country strategies and programs. The review of PCRs under this evaluation arrived at similar results as did IED’s recent ADB-wide study on postcompletion sustainability, concluding that 65% of both ADF and OCR operations are most likely or likely �� �� �����������. The recent IED study found that project effectiveness and ������������������������������������.������� ����������.������&�'��suggested that to improve sustainability a holistic approach is needed: (i) identifying and mitigating risks to project sustainability during country and sector assistance programming; (ii) paying more attention to risks to sustainability of outputs and outcomes and their mitigation during project preparation and implementation; and (iii) undertaking postcompletion monitoring of selected projects and programs with emphasis on outcomes, sustainability, impact, and monitoring arrangements.

80
Appendixes Appendixes
8181
Key Features
of Asian
Development
Fund VIII–X
Operations
A. Asian Development Fund VIII
$&� W��� ����� ���� �� ���� �������� ��� }��.��� $"""� ��September 2000 for the seventh Asian Development Fund (ADF) replenishment, or ADF VIII, which covered the period 1 January 2001–31 December 2004. As a result of the negotiations, the donors agreed to a replenishment size of $5.645 billion, consisting of $2.905 billion in new donor contributions and $2.740 billion in commitment authority from existing resources. Portugal and Singapore became donors to the ADF.
2. At the time of ADF VIII, the donors’ interest focused largely on implementing the Asian Development Bank (ADB) Poverty Reduction Strategy1 of 1999, supported by the Private Sector Development Strategy. This was to be made operational through high-quality and prioritized technical assistance (TA)2 and lending operations that focused on, among others, (i) improving the quality of governance, ���������� ����� ������ ������� ��� ���� ������� � �.���� ��������������and public services; (ii) environmental problems, global as well as regional, that required concerted efforts from within the region if they were to be properly and adequately alleviated; (iii) gender equity and protection of minorities and indigenous peoples by removing legal and culturally determined constraints; (iv) investments in physical and social infrastructure and social development that were to bring ��.��������� ������� ���� ��������� .������� � ��3��� �� �� ��� ��and poor regions, both urban and rural; (v) cooperation among ����� �������.������������ ��;?�%����������� �.�������+� �&�&+�economic opportunities and social and environmental problems with 3���4������+� �Z������ ����4.����� �Z������������� ���%� ����� �����and institutional development for creating a private sector where the ��������������������������������������3������ +�������+�����employment; and (vii) rewarding performance.
3. During this period, performance-based allocation (PBA) of resources was introduced. It was seen as a tool not only to reduce wastage of resources in countries with weak performance, but also to �������������������������������;?������ �������������&
B. Asian Development Fund IX
>&� }��������64����� �����}��.����!!9#;����!!>+����������met on four occasions to plan further replenishment of the Fund (i.e., ADF IX). Replenishment for ADF IX was for the period 1 January 2005–31 December 2008. The donors endorsed an ADF IX program of 7=&!�.�����+� �����������������������������������������������of grants. The ADF IX program was derived from ADB’s strategic
1 ADB. 1999. Fighting Poverty in Asia: The Poverty Reduction Strategy. Manila.2 In ADF VII, TA had been financed from ADB’s internal resources.
Appendix 1
Key Features of Asian Development
Fund VIII–X Operations

8282
Appendix 1 operational planning process. It took into account the increased need for concessional assistance in the region for (i) accelerating ��������3��������;��������������� �����|���� ������� �����countries; (ii) meeting the special needs and circumstances of smaller, less developed countries; (iii) assisting countries in their transition �����[��������%��������������������3�����������������.��������������(v) strengthening regional cooperation; and (vi) supporting priority TA across the region. Donors recommended continuation of eligibility as applied to ADF VIII for allocating resources in the planned ADF IX period (2005–2008). The ADF IX program was expected to enable robust implementation of ADB’s strengthened poverty reduction strategy.
5. ADB committed to maximize the mobilization of internal ���������3���������������������������������������&�}�����������7=&!�billion, at least $3.7 billion would come from internal resources, with the remainder provided by new contributions pledged by donors on a burden-shared basis of $3.2 billion, plus some additional and voluntary contributions. New contributions pledged by donors were made mainly on accepted burden-sharing principles. Donors agreed to work toward achieving a 50/50 share of regional and ���������������.�����&�?����.������������'�����������������4time contribution from the People’s Republic of China, and renewed �� ����������������;�������&�����-������.�������� ��������������������������������������������� �������������������������������������������&
C. Asian Development Fund X
6. The ADF X donors’ meeting noted that the development ����������� �����������������������������3������������.��+����������������������������������������&�;��������6!�������������program (2009–2012) was expected to be distributed through the PBA formula to direct the limited funds to where they would be used most effectively.
=&� W3������������3������.����������������������,��������&�First, the PBA for blend countries (those that also have access to ��,-������������ ����� ��������� }?�¡%�3����.������������������more assistance to poorer countries. A threshold of 14% of resources distributed under PBA per country would be set to determine which .����� ��������� 3���� .�� ��.����� �� ���� ������� �,�&� W��� $>��threshold would serve as a soft cap, because blend countries with PBA greater than the threshold would retain half of the amount above the threshold. Second, the measure of portfolio performance would be revised to reduce the volatility of the ratings, and to remove a disincentive to report potential problem projects. As in ADF IX, 4.5% of the resources distributed under PBA would be earmarked for the ���������������&�
6&� W��� �3� ����[���� �������������������� ���� W���4Leste—would begin the 6-year phaseout period from exceptional ����[�����������������������&�¢ ���$!����������� ������3����be earmarked for subregional projects. Every dollar drawn from the subregional pool would be matched by each participating country with 50 cents from its PBA. However, the required contributions

8383
Key Features
of Asian
Development
Fund VIII–X
Operations
from biennial PBA would be subject to a 20% ceiling. Beyond that amount, contributions from country PBA would not be mandatory. The fourth regularized replenishment of the technical assistance special fund (TASF) would be completed in parallel with the ADF X �� ����������&� ;���������� 3���� ����� � �Z ������ ����������� ����criteria for allocating TASF resources to come into effect in January 2009. A comprehensive review of the TASF would also be undertaken at the midterm review of ADF X.
9. The replenishment covered the 4-year period 1 January 2009–31 December 2012. Donors agreed to a total replenishment size of special drawing rights (SDR)7.1 billion ($11.3 billion), which consisted of SDR6.9 billion for ADF X and SDR0.2 billion (equivalent to 3% of the total replenishment) for the fourth replenishment of the TASF. W��� �� ����������� 3���� .�� �������� ��� ���� ��3���� ������5�(i) SDR2.6 billion from new donor contributions; (ii) SDR4.3 billion ��������������������������������9&��.��������[34.��������������and SDR1.1 billion from liquidity drawdown; and (iii) SDR0.2 billion net income transfers from OCR, subject to annual approvals by ADB’s Board of Governors. New donor contributions would comprise about 37% of the total replenishment, representing a 13% increase in SDR terms from the level of ADF IX.
$!&� W��� ���� ��[3�� ��� ���� ����������.�� ������ ������ ����Heavily Indebted Poor Countries Initiative would be accommodated 3������ ���� �� ��������� ���� 3���� ��� ��/����� � ������ ������*����of funds for this purpose. This issue would be reviewed in future �� �����������&� ����� ����������� ����� ��������� ���� ����� � ����Heavily Indebted Poor Countries should maximize the use of internal ��������� � ��,� 3����� ��������� ���� ��������� ���������� � ��,� ����without compromising the capacity of the ADF. The foregone interest payments from the ADF grant framework would also not have a ������������� �����������+����+���*�������������.�������+��������/������ ������������*���&�������������������������������������������'����������������� ����� ����� ����������������������on a pay-as-you-go basis in future replenishments.
11. To ensure successful implementation of ADF X, it would be necessary to assess ADB’s capacity and skill-mix to deliver on ADF X targets. The resource implications of delivering the ADF X program would be discussed with the Board of Directors as part of �����������.��������� �����&�;�����+� ���3��� �� ���������������a sound results framework to measure the performance of ADF X and monitor its implementation. To this end, the results framework being developed to monitor the implementation of ADB’s long-term strategic framework forms the basis for the ADF X results framework. ADB would assess and report on progress in implementing the ADF program through its annual Development Effectiveness Review. Progress on the implementation of ADF X would be reviewed by ����� ��������� �� ���� ���������� � ��,-�� ������� ;������&� '��addition, a comprehensive midterm review of ADF X would be held in the fourth quarter of 2010.
12. Based on the donors’ reports, key crosscutting areas highlighted for ADF VIII, IX, and X operations are summarized in Table A1.

8484
Appendix 1 Crosscutting Areas Highlighted in Donors’ Reports for ADF Operations
Table A1.1: Asian Development Fund VIII, ADF IX, and ADF X Crosscutting Commitments/Statements in
Donors’ Reports
ADF VIII Commitments ADF IX Commitments/Statements ADF X Commitments/Statements
A. Poverty Reduction and Achieving MDG Targets
Carry out ADF operations under the general ADB-wide
framework of the Poverty Reduction Strategy. ADF
VIII resources will focus on social development. Each
country needs to have a comprehensive national
poverty reduction strategy. Beyond developing human
capital, the aim must be to strengthen social capital,
especially for people subject to social exclusion.
Reducing poverty remains the overarching goal of the
ADF. Goals, strategies, and policies of ADF IX should
support the priorities of the global development
agenda applied to the needs and conditions of the
region. Harmonization with other aid programs
should be pursued. There should be a new focus on
capacity development. Key recommendations of the
Review of the Poverty Reduction Strategy should be
implemented. Country ownership is a basic principle:
CSPs should be aligned with NPRSs.
ADF IX operations and assistance will require, among
other things, a continued and sharpened focus on
inclusive social development. ADF IX will be managed
with the assumption that each person should have the
right to access basic education, primary health care,
and other essential services. A proactive approach
will help reverse social and economic discrimination
and promote initiatives (e.g., health, education,
natural resource management) that meet the needs of
previously excluded groups.
ADF X operations will focus on achieving
sustainable economic growth and poverty
reduction to eliminate shortfalls in achieving
Millennium Development Goals. ADB should focus
on its operations on areas where priority needs of
client countries for poverty reduction (achieving
and maintaining fast growth, promoting social
development and mitigating the environmental
costs of rapid growth) intersect with ADB’s
institutional strength and operational success.
ADF X resources will focus on inclusiveness by
promoting equitable access to basic education
and health services, along with opportunities for
productive employment.
B. Good GovernanceADF VIII resources will focus on improving good
governance. Governance was viewed as a broad- based
concept intended to encompass all factors that impact
on a country’s ability to assure sustained economic and
social development and reduce poverty, and donors
noted that these factors should be addressed in a
manner compatible with ADB’s Charter.
ADF IX operations and assistance will require, among
other things, a continued and sharper focus on
good governance. ADB seeks to mainstream good
governance into all operations.
The ADF X pipeline will comply with ADB’s
governance and anticorruption policies. ADB’s
engagement in this field will be selective in line
with its Governance and Anticorruption Action
Plan II (2006), with priority on public financial
management, legal and regulatory framework,
and capacity development.
C. Sector Selectivity
The strategic priority will be pursued through
operations in sectors where ADB has a proven
track record, especially infrastructure and
education. At the same time, ADB needs to
maintain some flexibility and capacity to very
selectively deliver quality assistance in a few
other sectors to respond to varying country
needs and priorities.
D. Private Sector Development
ADF VIII is an instrument for pursuing private
sector development outcomes. The main strategic
thrusts of the Private Sector Development Strategy
were endorsed. Donors also agreed with the aim
to strengthen the rule of law and associated legal
frameworks and the application for corporate
governance.
In the context of CSPs, ADB’s private sector
development programs seek to create the
enabling environment for high levels of private
sector investment in DMCs, through supportive
private sector operations. ADB will increase its
support of small and medium-sized enterprises,
including, where appropriate, through
microfinance and microenterprise initiatives.
ADF X will focus on improving the investment
climate and attracting more private
investment. ADB should continue its important
work in improving enabling environment
for private sector investment and business
creation.
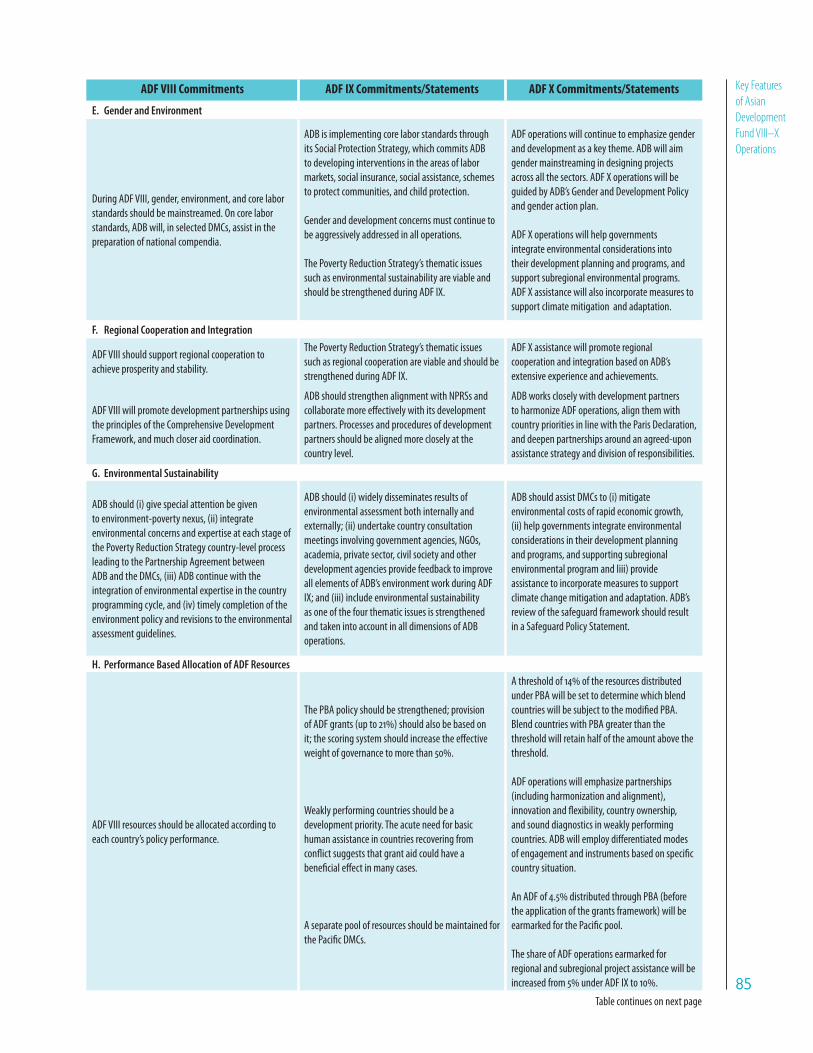
8585
Key Features
of Asian
Development
Fund VIII–X
Operations
ADF VIII Commitments ADF IX Commitments/Statements ADF X Commitments/Statements
E. Gender and Environment
During ADF VIII, gender, environment, and core labor
standards should be mainstreamed. On core labor
standards, ADB will, in selected DMCs, assist in the
preparation of national compendia.
ADB is implementing core labor standards through
its Social Protection Strategy, which commits ADB
to developing interventions in the areas of labor
markets, social insurance, social assistance, schemes
to protect communities, and child protection.
Gender and development concerns must continue to
be aggressively addressed in all operations.
The Poverty Reduction Strategy’s thematic issues
such as environmental sustainability are viable and
should be strengthened during ADF IX.
ADF operations will continue to emphasize gender
and development as a key theme. ADB will aim
gender mainstreaming in designing projects
across all the sectors. ADF X operations will be
guided by ADB’s Gender and Development Policy
and gender action plan.
ADF X operations will help governments
integrate environmental considerations into
their development planning and programs, and
support subregional environmental programs.
ADF X assistance will also incorporate measures to
support climate mitigation and adaptation.
F. Regional Cooperation and Integration
ADF VIII should support regional cooperation to
achieve prosperity and stability.
The Poverty Reduction Strategy’s thematic issues
such as regional cooperation are viable and should be
strengthened during ADF IX.
ADF X assistance will promote regional
cooperation and integration based on ADB’s
extensive experience and achievements.
ADF VIII will promote development partnerships using
the principles of the Comprehensive Development
Framework, and much closer aid coordination.
ADB should strengthen alignment with NPRSs and
collaborate more effectively with its development
partners. Processes and procedures of development
partners should be aligned more closely at the
country level.
ADB works closely with development partners
to harmonize ADF operations, align them with
country priorities in line with the Paris Declaration,
and deepen partnerships around an agreed-upon
assistance strategy and division of responsibilities.
G. Environmental Sustainability
ADB should (i) give special attention be given
to environment-poverty nexus, (ii) integrate
environmental concerns and expertise at each stage of
the Poverty Reduction Strategy country-level process
leading to the Partnership Agreement between
ADB and the DMCs, (iii) ADB continue with the
integration of environmental expertise in the country
programming cycle, and (iv) timely completion of the
environment policy and revisions to the environmental
assessment guidelines.
ADB should (i) widely disseminates results of
environmental assessment both internally and
externally; (ii) undertake country consultation
meetings involving government agencies, NGOs,
academia, private sector, civil society and other
development agencies provide feedback to improve
all elements of ADB’s environment work during ADF
IX; and (iii) include environmental sustainability
as one of the four thematic issues is strengthened
and taken into account in all dimensions of ADB
operations.
ADB should assist DMCs to (i) mitigate
environmental costs of rapid economic growth,
(ii) help governments integrate environmental
considerations in their development planning
and programs, and supporting subregional
environmental program and Iiii) provide
assistance to incorporate measures to support
climate change mitigation and adaptation. ADB’s
review of the safeguard framework should result
in a Safeguard Policy Statement.
H. Performance Based Allocation of ADF Resources
ADF VIII resources should be allocated according to
each country’s policy performance.
The PBA policy should be strengthened; provision
of ADF grants (up to 21) should also be based on
it; the scoring system should increase the effective
weight of governance to more than 50.
Weakly performing countries should be a
development priority. The acute need for basic
human assistance in countries recovering from
conflict suggests that grant aid could have a
beneficial effect in many cases.
A separate pool of resources should be maintained for
the Pacific DMCs.
A threshold of 14 of the resources distributed
under PBA will be set to determine which blend
countries will be subject to the modified PBA.
Blend countries with PBA greater than the
threshold will retain half of the amount above the
threshold.
ADF operations will emphasize partnerships
(including harmonization and alignment),
innovation and flexibility, country ownership,
and sound diagnostics in weakly performing
countries. ADB will employ differentiated modes
of engagement and instruments based on specific
country situation.
An ADF of 4.5 distributed through PBA (before
the application of the grants framework) will be
earmarked for the Pacific pool.
The share of ADF operations earmarked for
regional and subregional project assistance will be
increased from 5 under ADF IX to 10.
Table continues on next page

8686
Appendix 1 ADF VIII Commitments ADF IX Commitments/Statements ADF X Commitments/Statements
I. Reform Agenda
ADF VIII should reinforce good governance principles
(transparency, accountability, participation, and
predictability) in ADB’s corporate management.
ADB should nurture a strong ”results culture” across
the organization. ADB will reorient staff incentives to
reward achievement of outcomes rather than lending
targets. Better internal governance and management
systems are needed. ADB needs to address human
resource issues, a new accountability mechanism,
and empowering resident missions.
ADB will continue to implement its 2005 public
communication policy, to sustain strict compliance
with its new disclosure requirements.
ADB will conduct another global perception survey
in 2009.
Building on the results of the human resources
strategy review, ADB will develop a revised action
plan covering future human resources initiatives
by the first quarter of 2009 and it will conduct staff
engagement surveys every 2–3 years.
Better evaluation systems should be developed,
linked to the planning of ADF operations (in particular
methodologies, databases, and indicators).
ADB will continue to establish a more results-
oriented monitoring and evaluation system.
ADB will adopt the results framework.
ADB will measure the overall impact of
institutional reform on its effectiveness through
its results framework and will report progress
through its annual Development Effectiveness
Review. The Review will include a responsibility
and accountability matrix on the implementation
of the results framework.
ADB will develop more coherent procedures
for Managing for Development Results across
operations departments, focusing initially on
CPSs, country portfolio reviews, use of country
development effectiveness briefs, and sector
results profiles to plan and assess ADB country
operations.
ADB’s progress on Paris commitments will be
reported upon and analyzed in more detail in th
Development Effectiveness Reviews.
ADB should redesign and strengthen operational
processes to support ADF VIII—notably to improve
quality at entry for key products such as country
operational strategies, country assistance plans, TA,
and loans. The core of the redesign is to significantly
change the processes for country planning,
programming, and TA and loan processing.
ADB will develop results-based country strategies
that are aligned with nationally owned poverty
reduction strategies.
Donors supported ADB’s reform agenda.
Two key issues of results management and internal
efficiency lie at the core of the ADF IX replenishment.
ADB will prepare short- and medium-term options
to improve resident mission operations, including
the resource implication. In the meantime, ADB
will prioritize.
ADB will continue to improve its business
processes – an area which clients and staff view
as weakness.
ADB will accelerate its transformation into a
more effective learning and knowledge-sharing
organizations.
Review of ADB’s safeguards framework should
result in a Safeguard Policy Statement (SPS),
Operations Manual and SPS Implementation Plan.
Outcome of the Operations Evaluation
Department’s (OED) review and its follow-up
actions would reflect international best practices.
ADB = Asian Development Bank, ADF = Asian Development Fund, CPS = country partnership strategy, CSP = country strategy and program, DMC = developing member country, HIV/AIDS = human immunodeficiency virus/acquired immunodeficiency syndrome, NPRS = national poverty reduction strategy, PBA = performance-based allocation, SARS = severe acute respiratory syndrome, TA = technical assistance.Source: ADF donor reports, as prepared by ADB.
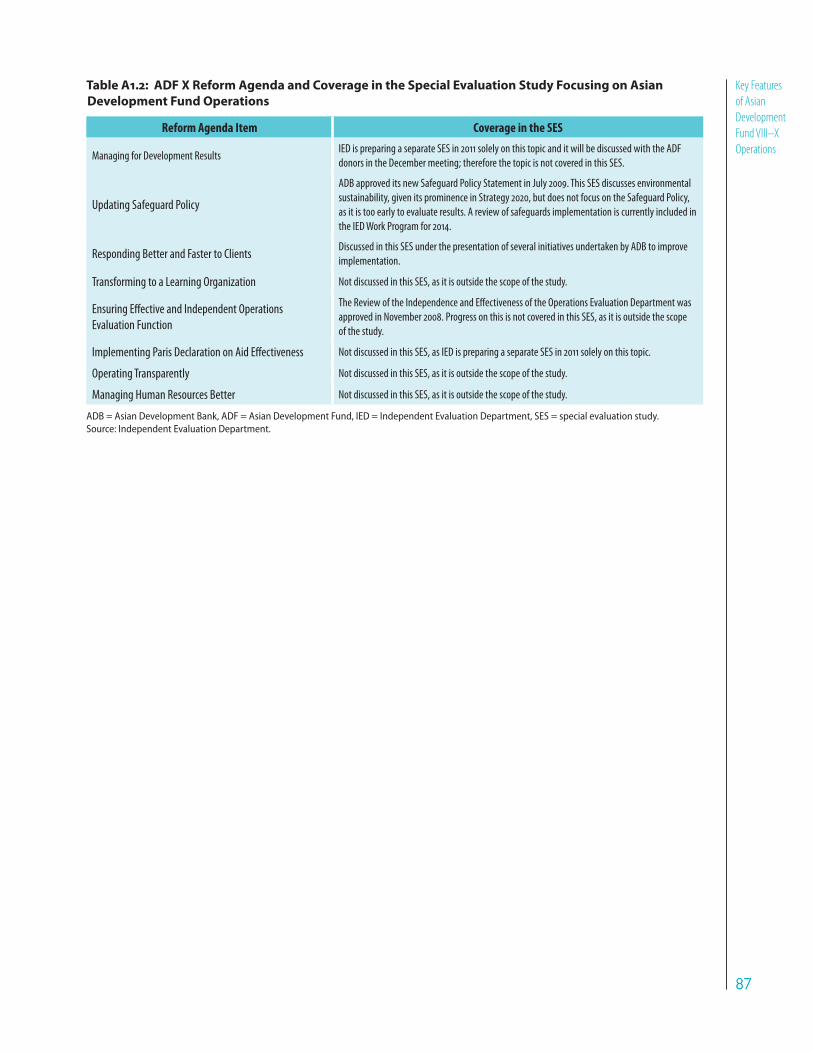
8787
Key Features
of Asian
Development
Fund VIII–X
Operations
Table A1.2: ADF X Reform Agenda and Coverage in the Special Evaluation Study Focusing on Asian
Development Fund Operations
Reform Agenda Item Coverage in the SES
Managing for Development ResultsIED is preparing a separate SES in 2011 solely on this topic and it will be discussed with the ADF
donors in the December meeting; therefore the topic is not covered in this SES.
Updating Safeguard Policy
ADB approved its new Safeguard Policy Statement in July 2009. This SES discusses environmental
sustainability, given its prominence in Strategy 2020, but does not focus on the Safeguard Policy,
as it is too early to evaluate results. A review of safeguards implementation is currently included in
the IED Work Program for 2014.
Responding Better and Faster to ClientsDiscussed in this SES under the presentation of several initiatives undertaken by ADB to improve
implementation.
Transforming to a Learning Organization Not discussed in this SES, as it is outside the scope of the study.
Ensuring Effective and Independent Operations
Evaluation Function
The Review of the Independence and Effectiveness of the Operations Evaluation Department was
approved in November 2008. Progress on this is not covered in this SES, as it is outside the scope
of the study.
Implementing Paris Declaration on Aid Effectiveness Not discussed in this SES, as IED is preparing a separate SES in 2011 solely on this topic.
Operating Transparently Not discussed in this SES, as it is outside the scope of the study.
Managing Human Resources Better Not discussed in this SES, as it is outside the scope of the study.
ADB = Asian Development Bank, ADF = Asian Development Fund, IED = Independent Evaluation Department, SES = special evaluation study.Source: Independent Evaluation Department.
8888
Appendix 2
$&� W���� � ������ ���������� ������ ��{�%� �� ���� �� ���4������approach comprising (i) portfolio and performance analysis of Asian Development Fund (ADF) operations, (ii) meta evaluation and �����������*����������������������������������� ���������������the development effectiveness of ADF operations, (iii) review of Asian Development Bank (ADB) documents on reform measures and new initiatives, (iv) case studies of selected ADF projects, and (v) a �����������3�*�� �3������������������������� �������.��������������;?�%&�
A. Portfolio Analysis
�&� W��� ����� ������������������.����������������������+�country, sector, theme, project modality and areas of operation for approvals during ADF VIII, IX, and X.
B. Performance Analysis
3. The SES analyzed evaluation reports with regard to the performance of ADF support at the country, sector, and project levels. Country-level performance assessments and success rates were derived from the country assistance program evaluations (CAPEs), and project-level performance assessments and success rates were based on project completion reports (PCRs), PCR validation reports, and project/program performance evaluation reports (PPERs) (as applicable) for projects approved and completed during 2001–2010. CAPEs, PCR validation reports, and PPERs are prepared by the Independent Evaluation Department (IED), while PCRs are prepared as self-evaluation by the regional departments. The study also reviewed other performance measures for completed and ongoing ADF projects, i.e., (i) the time that elapsed between loan approval and loan signing, between loan signing and loan effectiveness, and between loan approval and loan effectiveness; (ii) contract awards; (iii) loan disbursements; (iv) loan cancellations; (v) loan delegation; and (vi) project implementation delays.
C. Document Review and Synthesis
4. The following documents were reviewed and their data synthesized: (i) documents related to ADF operations such as the donors’ reports, midterm reports, performance-based allocation policy and other relevant policy papers, country performance assessment annual reports, and the ADB Long-Term Strategic Framework (Strategy 2020); (ii) project documents; (iii) other related evaluation studies
Appendix 2
Methodology

8989
Methodologyprepared by IED; (iv) development effectiveness reports; and (iv) other relevant documents and reports prepared by other development partners.
D. Case Studies
:&� ����4��� �������������������������������+��&�&+�,���������+�Lao People’s Democratic Republic (Lao PDR), Nepal, Pakistan, and Viet Nam were selected for in-depth review to facilitate a qualitative assessment of project performance. The case studies comprised 25 projects and programs approved in the early years of ADF VIII and covered by the 2007 SES, and an additional 26 projects approved in ���������������������'�&�W��� �������3�����������������������������random sampling based on sector representation. For each country, a list of projects in a given sector was drawn from the ADB database. The projects had been approved in the corresponding years, and at least 4 years would have elapsed from loan approval. A national consultant in each country visited and held discussions with the executing and implementing agencies and prepared a project case study summary. W���������������[���� ����������������� ���������3������������������������������&�W�������������������������������������������+������a second round of discussions to cross-check data collected by the ������������������+�������������������������������������;?�perspective of ADF operations. A visit to Pakistan was not feasible 3��������������������������������.��������������������[������2010. Table A2 lists the case study projects. A review of ADB documents �������������������� ����������������3�*&
Table A2: Projects/Programs Reviewed for the Case Studies
Country/Project No. Project/Program
Bangladesh
1881-BAN Post-Literacy and Continuing Education Project
1884/1885-BAN West Zone Power System Development Project
1920-BAN Road Network Improvement and Maintenance Project
1941-BAN Jamuna-Meghna River Erosion Mitigation Project
1947-BAN Urban Governance and Infrastructure Development Project
2156-BAN Emergency Flood Damage Rehabilitation Project
2172-BAN Second Primary Health Care Project
2190-BAN Agribusiness Development Project
2265-BAN Secondary Towns Water Supply and Sanitation Sector Project
2266/2267-BAN Secondary Education Sector Development Program
Lao PDR
0016-LAO Northern and Central Regions Water Supply and Sanitation Sector Project
0026-LAO GMS Regional Communicable Diseases Control Project
1834-LAO Vientiane Urban Infrastructure and Services Project
1933-LAO Nam Ngum River Basin Development Sector Project
1970-LAO GMS Mekong Tourism Development Project (Regional)
1989-LAO GMS Northern Economic Corridor Project
2005-LAO Northern Area Rural Power Distribution Project
2252/2253-LAO Rural Finance Sector Development Program
Table continues on next page
9090
Appendix 2 Country/Project No. Project/Program
2259-LAO Northern Region Sustainable Livelihood through Livestock Development Project
2306/0069-LAO Basic Education Sector Development Program
Nepal
0051-NEP Road Connectivity Sector Development Project
0063-NEP Commercial Agricultural Development Project
0093/0094-NEP Rural Reconstruction and Rehabilitation Sector Development Program
1609-NEP Community Groundwater Irrigation Sector Project
1755-NEP Small Towns Water Supply and Sanitation Sector Project
1841-NEP Teacher Education Project
1861-NEP Governance Reform Program
1876-NEP Road Network Development Project
1966-NEP Urban and Environmental Improvement Project
2268/0059-NEP Rural Finance Sector Development Cluster Program (Subprogram I)
2277/0065-NEPEducation Sector Program I/Education Sector Program I (Capacity Development)
Project
Pakistan
1854-PAK NWFP Urban Development Sector Project
1877/1878/1879-PAK Agriculture Sector Program II
1897/1898/1899-PAK Access to Justice Program
1900-PAK Reproductive Health Project
2103/2104-PAK NWFP Road Development Sector and Subregional Connectivity Project
2171-PAK Agribusiness Development Project
2212-PAK Rawalpindi Environmental Improvement Project
2213-PAK Earthquake Emergency Assistance Project
2287-PAK Renewable Energy Development Sector Investment Program
2292-PAK Improving Access to Financial Services (Phase I) Program
Viet Nam
0027-VIE GMS Regional Communicable Diseases Control Project
1855-VIE Second Red River Basin Sector Project
1883-VIE Central Region Livelihood Improvement Project
1888-VIE Provincial Roads Improvement Sector Project
1979-VIE Upper Secondary Education Development Project
1990-VIE Housing Finance Project
2195/0022-VIE Central Region Transport Networks Improvement Sector Project
2223-VIE Central Region Water Resources Project
2272-VIE Central Region Small and Medium Towns Development Project
2284-VIE SME Development Program - Subprogram II
BAN = Bangladesh, GMS = Greater Mekong Subregion, LAO = Lao People’s Democratic Republic, NEP = Nepal, NWFP = North-West Frontier Province, PAK = Pakistan, SME = small and medium enterprise, VIE = Viet Nam.Source: Independent Evaluation Mission.

9191
MethodologyE. Consultation Workshop
<&� �� ����������� 3�*�� � 3���� $:� �;?� ������ ������� 3�������� ��� ���� W�������� ��������� ;������ �W�;%� ��� ,���**� �� �=#�6����������!$$&��������3�*�� +��������������������������{��3����presented for discussion. The participants from Bangladesh, Bhutan, ������+�;�����+��� ��+���*�����+������'������+��������*�+�W���4Leste, and Viet Nam presented their respective country perspectives on ADF operations. The presentations covered (i) the extent to which the ADF has helped in addressing the country’s development constraints; (ii) performance and effectiveness of ADF operations in the country; (iii) actions needed to improve the performance of ADF operations for .������ �������� ���� ������� �������� ������� ���%� ����������� �� ��������ADF approaches (including eligibility, sector selectivity, choice of lending modality, poverty targeting, etc.); and (v) future directions for ADF operations in light of emerging challenges such as environmental management, response to climate change, emergency assistance, regional cooperation and integration, and economic crises.
7. The former Director General of IED delivered the opening �����*����������W�;�?��������������3����������� ������ ����&�����participants actively participated in the discussion, with the former Director, IED1, serving as moderator. At the end of the workshop, the participants agreed on a summary of the workshop conclusions. Representatives from Afghanistan, Cambodia, and Kyrgyz Republic were invited but were unable to attend the workshop.

9292
Appendix 3
Table A3.1: ADF Resources since Inception, ADF I to X
(nominal dollars)
Period Inclusive Years
Nominal (amount in million)
Change from Previous Period
Donor Contribu-tions Reflows Other Resources Total
ADF I 1973−1975 710 0 61 771
ADF II 1976−1978 761 0 61 822 6.6
ADF III 1979−1982 2,141 0 141 2,282 177.6
ADF IV 1983−1986 3,260 0 153 3,413 49.6
ADF V 1987−1991 3,569 0 462 4,031 18.1
ADF VI 1992−1996 4,073 603 498 5,174 28.4
ADF VII 1997−2000 2,688 2,231 230 5,149 (0.5)
ADF VIII 2001−2004 2,926 3,005 1,040 6,971 35.4
ADF IX 2005−2008 3,188 3,688 1,293 8,169 17.2
ADF X 2009−2012 3,890 7,175 1,130 12,195 49.3
Total 27,206 16,702 5,069 48,977
ADB = Asian Development Bank, ADF = Asian Development Fund. Sources: Nominal data for ADF I-VII from the Special Evaluation Study on ADF VIII and IX Operations (2007); Nominal data for ADF VIII to X from ADB’s Treasury Department.
Table A3.2: ADF Resources since Inception, ADF I to X
(constant [inflation adjusted] dollars)
Period Inclusive Years
Adjusted for Inflation ( million)
Change from Previous Period
Donor Contribu-tions Reflows Other Resources Total
ADF I 1973−1975 1495 0 126 1,621
ADF II 1976−1978 1475 0 118 1,593 (1.7)
ADF III 1979−1982 3,901 0 257 4,157 160.9
ADF IV 1983−1986 5,468 0 257 5,724 37.7
ADF V 1987−1991 5,398 0 699 6,096 6.5
ADF VI 1992−1996 5,555 822 679 7,056 15.7
ADF VII 1997−2000 3,375 2,801 289 6,465 (8.4)
ADF VIII 2001−2004 3,382 3,473 1,202 8,057 24.6
ADF IX 2005−2008 3,392 3,924 1,376 8,692 7.9
ADF X 2009−2012 3,890 7,175 1,130 12,195 40.3
Total 37,330 18,196 6,132 61,657
ADF = Asian Development Fund. Note: For consistency with the previous Special Evaluation Study of the ADF (2007), an average discount rate of 2.09% was used to convert nominal values to constant dollars with 2009 (December) as the base year.Source:Nominal data for ADF I-VII from the Special Evaluation Study on ADF VIII and IX Operations (2007); Nominal data for ADF VIII to X from ADB’s Treasury Department.
Appendix 3
Asian Development Fund: Sources and Utilization
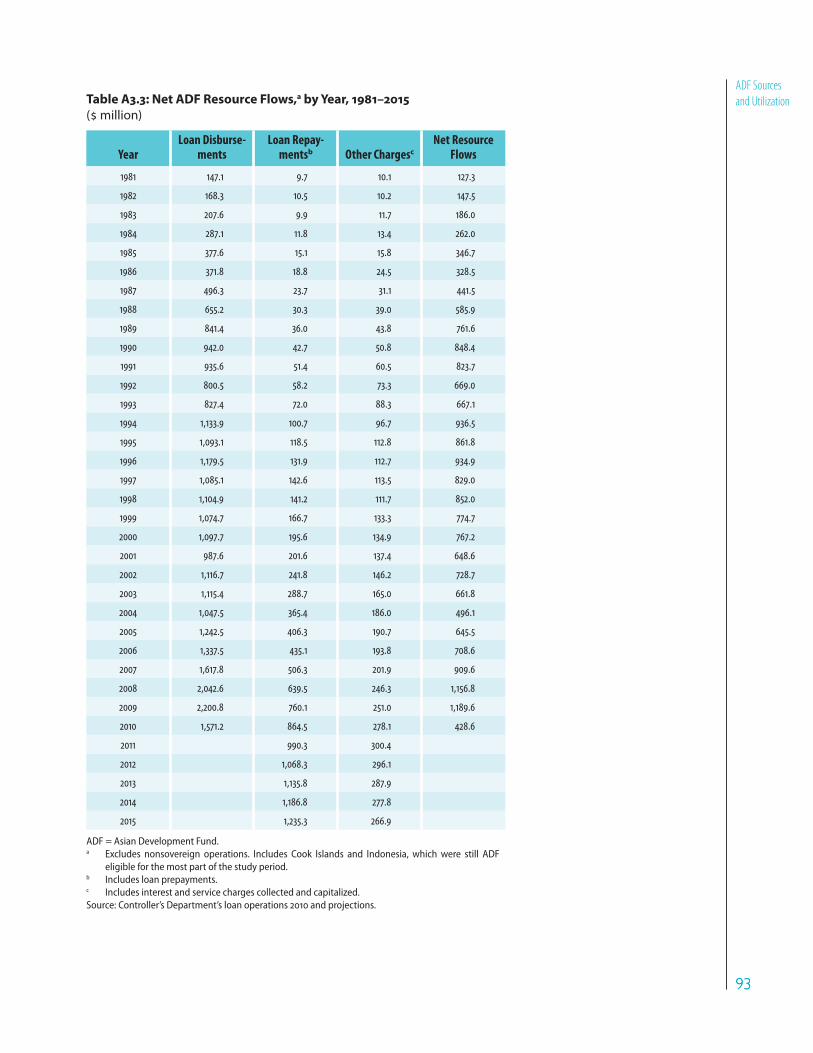
9393
ADF Sources
and UtilizationTable A3.3: Net ADF Resource Flows,a by Year, 1981–2015
( million)
YearLoan Disburse-
mentsLoan Repay-
mentsb Other Chargesc
Net Resource Flows
1981 147.1 9.7 10.1 127.3
1982 168.3 10.5 10.2 147.5
1983 207.6 9.9 11.7 186.0
1984 287.1 11.8 13.4 262.0
1985 377.6 15.1 15.8 346.7
1986 371.8 18.8 24.5 328.5
1987 496.3 23.7 31.1 441.5
1988 655.2 30.3 39.0 585.9
1989 841.4 36.0 43.8 761.6
1990 942.0 42.7 50.8 848.4
1991 935.6 51.4 60.5 823.7
1992 800.5 58.2 73.3 669.0
1993 827.4 72.0 88.3 667.1
1994 1,133.9 100.7 96.7 936.5
1995 1,093.1 118.5 112.8 861.8
1996 1,179.5 131.9 112.7 934.9
1997 1,085.1 142.6 113.5 829.0
1998 1,104.9 141.2 111.7 852.0
1999 1,074.7 166.7 133.3 774.7
2000 1,097.7 195.6 134.9 767.2
2001 987.6 201.6 137.4 648.6
2002 1,116.7 241.8 146.2 728.7
2003 1,115.4 288.7 165.0 661.8
2004 1,047.5 365.4 186.0 496.1
2005 1,242.5 406.3 190.7 645.5
2006 1,337.5 435.1 193.8 708.6
2007 1,617.8 506.3 201.9 909.6
2008 2,042.6 639.5 246.3 1,156.8
2009 2,200.8 760.1 251.0 1,189.6
2010 1,571.2 864.5 278.1 428.6
2011 990.3 300.4
2012 1,068.3 296.1
2013 1,135.8 287.9
2014 1,186.8 277.8
2015 1,235.3 266.9
ADF = Asian Development Fund. a Excludes nonsovereign operations. Includes Cook Islands and Indonesia, which were still ADF
eligible for the most part of the study period.b Includes loan prepayments. c Includes interest and service charges collected and capitalized.Source: Controller’s Department’s loan operations 2010 and projections.
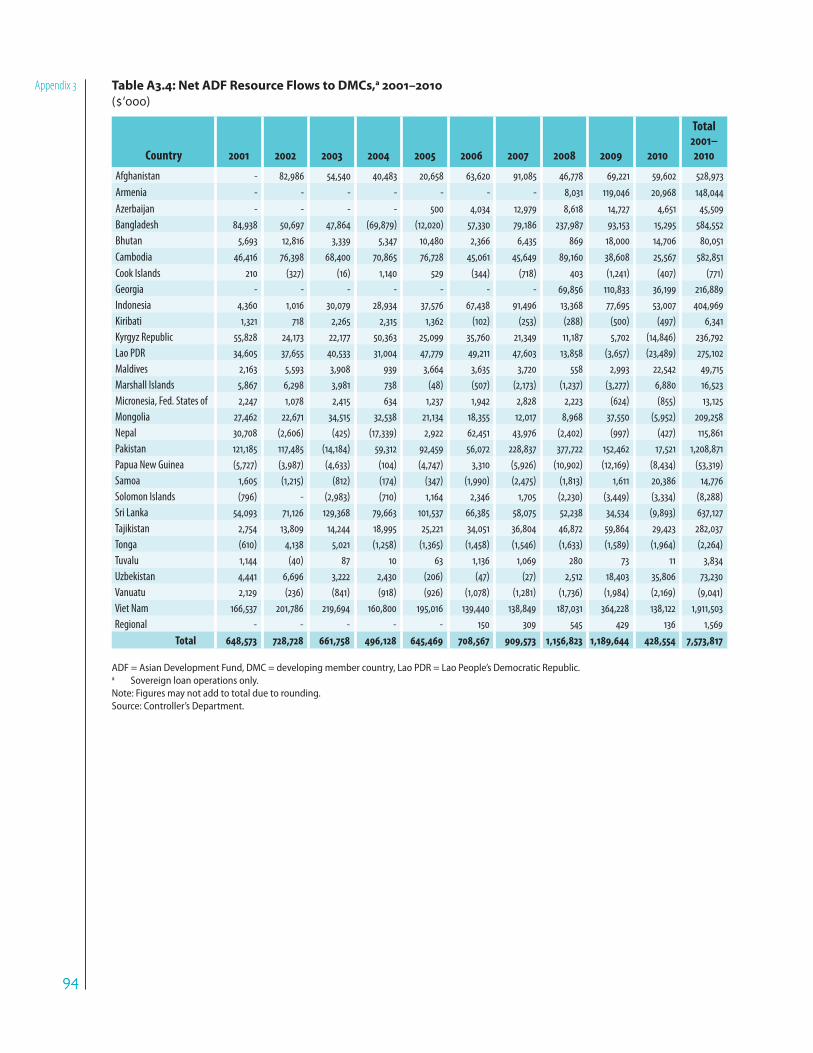
9494
Appendix 3 Table A3.4: Net ADF Resource Flows to DMCs,a 2001–2010
(‘000)
Country 2001 2002 2003 2004 2005 2006 2007 2008 2009 2010
Total2001–2010
Afghanistan - 82,986 54,540 40,483 20,658 63,620 91,085 46,778 69,221 59,602 528,973
Armenia - - - - - - - 8,031 119,046 20,968 148,044
Azerbaijan - - - - 500 4,034 12,979 8,618 14,727 4,651 45,509
Bangladesh 84,938 50,697 47,864 (69,879) (12,020) 57,330 79,186 237,987 93,153 15,295 584,552
Bhutan 5,693 12,816 3,339 5,347 10,480 2,366 6,435 869 18,000 14,706 80,051
Cambodia 46,416 76,398 68,400 70,865 76,728 45,061 45,649 89,160 38,608 25,567 582,851
Cook Islands 210 (327) (16) 1,140 529 (344) (718) 403 (1,241) (407) (771)
Georgia - - - - - - - 69,856 110,833 36,199 216,889
Indonesia 4,360 1,016 30,079 28,934 37,576 67,438 91,496 13,368 77,695 53,007 404,969
Kiribati 1,321 718 2,265 2,315 1,362 (102) (253) (288) (500) (497) 6,341
Kyrgyz Republic 55,828 24,173 22,177 50,363 25,099 35,760 21,349 11,187 5,702 (14,846) 236,792
Lao PDR 34,605 37,655 40,533 31,004 47,779 49,211 47,603 13,858 (3,657) (23,489) 275,102
Maldives 2,163 5,593 3,908 939 3,664 3,635 3,720 558 2,993 22,542 49,715
Marshall Islands 5,867 6,298 3,981 738 (48) (507) (2,173) (1,237) (3,277) 6,880 16,523
Micronesia, Fed. States of 2,247 1,078 2,415 634 1,237 1,942 2,828 2,223 (624) (855) 13,125
Mongolia 27,462 22,671 34,515 32,538 21,134 18,355 12,017 8,968 37,550 (5,952) 209,258
Nepal 30,708 (2,606) (425) (17,339) 2,922 62,451 43,976 (2,402) (997) (427) 115,861
Pakistan 121,185 117,485 (14,184) 59,312 92,459 56,072 228,837 377,722 152,462 17,521 1,208,871
Papua New Guinea (5,727) (3,987) (4,633) (104) (4,747) 3,310 (5,926) (10,902) (12,169) (8,434) (53,319)
Samoa 1,605 (1,215) (812) (174) (347) (1,990) (2,475) (1,813) 1,611 20,386 14,776
Solomon Islands (796) - (2,983) (710) 1,164 2,346 1,705 (2,230) (3,449) (3,334) (8,288)
Sri Lanka 54,093 71,126 129,368 79,663 101,537 66,385 58,075 52,238 34,534 (9,893) 637,127
Tajikistan 2,754 13,809 14,244 18,995 25,221 34,051 36,804 46,872 59,864 29,423 282,037
Tonga (610) 4,138 5,021 (1,258) (1,365) (1,458) (1,546) (1,633) (1,589) (1,964) (2,264)
Tuvalu 1,144 (40) 87 10 63 1,136 1,069 280 73 11 3,834
Uzbekistan 4,441 6,696 3,222 2,430 (206) (47) (27) 2,512 18,403 35,806 73,230
Vanuatu 2,129 (236) (841) (918) (926) (1,078) (1,281) (1,736) (1,984) (2,169) (9,041)
Viet Nam 166,537 201,786 219,694 160,800 195,016 139,440 138,849 187,031 364,228 138,122 1,911,503
Regional - - - - - 150 309 545 429 136 1,569
Total 648,573 728,728 661,758 496,128 645,469 708,567 909,573 1,156,823 1,189,644 428,554 7,573,817
ADF = Asian Development Fund, DMC = developing member country, Lao PDR = Lao People’s Democratic Republic.a Sovereign loan operations only. Note: Figures may not add to total due to rounding. Source: Controller’s Department.

9595
ADF Sources
and Utilization
Table A3.5: Amount of ADF Loan and Grant Approvals, by Region and Country
( million)
Region and Country
ADF VIII2001–2004
ADF IX2005–2008
ADF X2009–2010
Total
Central and West Asia Subtotal 1,865.9 3,061.1 2,408.7 7,335.7 36.7
Afghanistan 487.2 865.0 685.1 2,037.3 10.2
Armenia 83.9 140.0 223.9 1.1
Azerbaijan 42.0 13.0 55.0 0.3
Georgia 110.0 313.8 423.8 2.1
Kyrgyz Republic 145.8 162.0 247.8 555.6 2.8
Pakistan 1,045.6 1,458.8 515.0 3,019.4 15.1
Tajikistan 145.3 210.8 182.0 538.1 2.7
Uzbekistan 157.6 325.0 482.6 2.4
East Asia Subtotal 136.4 144.5 182.0 463.0 2.3
Mongolia 136.4 144.5 182.0 463.0 2.3
Pacific Subtotal 102.8 293.5 253.3 649.6 3.2
Cook Islandsa 2.2 9.7 11.9 0.1
Kiribati 12.0 12.0 0.1
Marshall Islands 15.0 9.5 24.5 0.1
Micronesia, Fed.
States of 27.2 27.2 0.1
Palau 3.4 3.4 0.0
Papua New Guinea 30.6 173.0 124.4 328.0 1.6
Samoa 14.0 61.0 16.0 91.0 0.5
Solomon Islands 19.3 32.0 51.3 0.3
Timor-Leste 16.0 46.0 62.0 0.3
Tonga 10.0 11.3 10.0 31.3 0.2
Tuvalu 3.8 3.2 7.1 0.0
South Asiab Subtotal 1,784.5 2,444.8 1,794.6 6,023.9 30.2
Bangladesh 873.7 1,490.6 876.9 3,241.1 16.2
Bhutan 16.4 138.9 60.4 215.6 1.1
Maldives 28.5 20.6 36.5 85.6 0.4
Nepal 359.3 418.2 598.7 1,376.2 6.9
Sri Lanka 506.6 376.5 222.2 1,105.3 5.5
Southeast Asiac Subtotal 1,743.0 2,058.0 1,662.8 5,463.7 27.4
Cambodia 355.0 270.0 305.3 930.2 4.7
Indonesiaa 330.4 430.4 760.8 3.8
Lao PDR 225.6 112.6 254.5 592.7 3.0
Viet Nam 832.0 1,245.0 1,103.0 3,180.0 15.9
Regional 34.5 34.5 0.2
Total 5,632.6 8,036.4 6,301.4 19,970.4 100.0
ADB = Asian Development Bank, ADF = Asian Development Fund, Lao PDR = Lao People’s Democratic Republic, TA = technical assistance.a ADF eligible at the time of loan approval.b Excludes India, which currently has no access to ADF.c Excludes Myanmar, which currently has no access to ADF.Source: ADB database on Loan, TA, Grant and Equity Approvals.

9696
Appendix 3 Table A3.6: Country Eligibility for ADF since 1973
Economy
Eligibility Classificationa
ADF I ADF II ADF III ADF IV ADF V ADF VI ADF VII ADF VIII ADF IX ADF X
Afghanistan A A A A A A A A A A
Armenia B1 B
Azerbaijanb B1 B1 B
Bangladesh A A A A A A B1 B1 B1 B
Bhutan A A A A A A A
Cambodia A A A A A A A A A A
China, People’s Republic of A A B2 B2 B2 C
Cook Islands A A A A A B1 B1 B1 C
Fiji C C C C C C C C C C
Georgia B1 B
Hong Kong, China C C C C C C Grad. Grad. Grad. Grad.
India A A A B2 B2 B2 B
Indonesia B B B B B B B2 B2 B2 C
Kazakhstan B C C C C
Kiribati A A A A A A A A A
Kyrgyz Republic A A A A A
Republic of Korea B C C C C C Grad. Grad. Grad. Grad.
Lao People’s
Democratic RepublicA A A A A A A A A A
Malaysia C C C C C C C C C C
Maldives A A A A A A A A
Marshall Islands,
Republic ofA B1 B1 B1 B
Micronesia, Fed. States of A B1 B1 B1 B
Mongolia A A A A A
Myanmar A A A A A A A A A A
Nauru B B2 B2 B2 A
Nepal A A A A A A A A A A
Pakistan A A A A A A B1 B1 B1 B
Palau B2 B
Papua New Guineac B B B B B B C B2 B2 B
Philippines B B B B B B C C C C
Samoa A A A A A A A A A A
Singapore C C C C C C Grad. Grad. Grad. Grad.
Solomon Islands A A A A A A A A A A
Sri Lanka A A A A A A B1 B1 B1 B
Taipei,China C C C C C C Grad. Grad. Grad. Grad.
Tajikistan A A A A A
Timor-Leste A A
Thailand B B B B B B C C C C
Tonga A A A A A A B1 B1 B1 A
Turkmenistan C C
Tuvalu A A A A A
Uzbekistan B C C B2 B
Vanuatu A A A A A A A
Viet Nam A A A A A A B1 B1 B1 B
ADB = Asian Development Bank, ADF = Asian Development Fund, Grad. = graduated. a The joint application of two criteria (i.e., per capita gross national product and debt repayment capacity) yields the following system of DMC eligibility
for ADF and OCR: Group A = ADF only; Group B = ADF and OCR; Group B1 = ADF with limited amounts of OCR; Group B2 = OCR with limited amounts of ADF; and Group C = OCR only.
b Officially recognized as an ADB DMC in December 1999. c Papua New Guinea was reclassified from C to B2 on 17 November 2000. Sources: IED. 2003. Special Evaluation Study: Asian Development Fund VI–VII Operations. Manila: ADB; IED. 2007. Special Evaluation Study: Asian Development Fund VIII and IX Operations. Manila: ADB; ADB. 2010. Operations Manual, Classification and Graduation of Developing Member Countries. Manila.

9797
ADF Sources
and Utilization
Table A3.7: ADF Loan and Grant Approvals, by Country
( million)
Country Classification/Country
ADF VIII2001–2004
ADF IX2005–2008
ADF X2009–2010
Total Ap-provals
A. ADF-Only Countries 1,927.3 2,453.4 2,668.3 7,049.0 35.3
Ordinary Situationa Subtotal 706.1 808.3 857.9 2,372.3 11.9
Bhutan 16.4 138.9 60.4 215.6 1.1
Cambodia 355.0 270.0 305.3 930.2 4.7
Kyrgyz Republic 145.8 162.0 247.8 555.6 2.8
Maldives 28.5 20.6 36.5 85.6 0.4
Mongolia 136.4 144.5 182.0 463.0 2.3
Samoa 14.0 61.0 16.0 91.0 0.5
Tonga 10.0 11.3 10.0 31.3 0.2
Exited FCAS Subtotal 730.2 741.5 1,035.2 2,507.0 12.6
Lao PDR 225.6 112.6 254.5 592.7 3.0
Nepal 359.3 418.2 598.7 1,376.2 6.9
Tajikistan 145.3 210.8 182.0 538.1 2.7
Current FCAS Subtotal 491.0 903.5 775.1 2,169.6 10.9
Afghanistan 487.2 865.0 685.1 2,037.3 10.2
Kiribati 12.0 12.0 0.1
Solomon Islands 19.3 32.0 51.3 0.3
Timor-Leste 16.0 46.0 62.0 0.3
Tuvalu 3.8 3.2 7.1 0.0
B. Blend Countriesb 3,705.3 5,548.6 3,633.1 12,887.0 64.5
Ordinary Situation Subtotal 3,590.5 5,205.0 3,170.8 11,966.3 59.9
Armenia 83.9 140.0 223.9 1.1
Bangladesh 873.7 1,490.6 876.9 3,241.1 16.2
Cook Islandsc 2.2 9.7 11.9 0.1
Georgia 110.0 313.8 423.8 2.1
Indonesiac 330.4 430.4 760.8 3.8
Pakistan 1,045.6 1,458.8 515.0 3,019.4 15.1
Sri Lanka 506.6 376.5 222.2 1,105.3 5.5
Viet Nam 832.0 1,245.0 1,103.0 3,180.0 15.9
Exited FCAS Subtotal 42.0 170.6 325.0 537.6 2.7
Azerbaijan 42.0 13.0 55.0 0.3
Uzbekistan 157.6 325.0 482.6 2.4
Current FCAS Subtotal 72.8 173.0 137.3 383.1 1.9
Marshall Islands 15.0 9.5 24.5 0.1
Micronesia, Fed. States of 27.2 27.2 0.1
Palau 3.4 3.4 0.0
Papua New Guinea 30.6 173.0 124.4 328.0 1.6
C. Regional 34.5 34.5 0.2
Total 5,632.6 8,036.4 6,301.4 19,970.4 100.0
ADB = Asian Development Bank, ADF = Asian Development Fund, FCAS = fragile and conflict-affected situation, Lao PDR = Lao People’s Democratic Republic, TA = technical assistance.a Excludes Myanmar, which currently has no access to ADF.b Only the ADF-financed component of loans is counted for blend countries; excludes India, which
currently has no access to ADF.c At the time of loan approval, these countries were still ADF eligible.Source: ADB database on Loan, TA, Grant and Equity Approvals.

9898
Appendix 3 Table A3.8: Amount of ADF Loan and Grant Approvals, by Sector
Country Classification/ Sectora
Amount ( million) Percentage Share ()
ADF VIII ADF IX ADF X Total ADF VIII ADF IX ADF X Total
A. ADF-Only Countriesb 1,927.3 2,453.4 2,668.3 7,049.0 34.2 30.5 42.3 35.3
Agriculture and Natural Resources 330.9 375.6 278.7 985.2 5.9 4.7 4.4 4.9
Education 210.6 151.1 184.3 546.0 3.7 1.9 2.9 2.7
Energy 117.7 441.6 369.4 928.6 2.1 5.5 5.9 4.7
Finance 75.7 203.5 97.5 376.7 1.3 2.5 1.5 1.9
Health and Social Protection 64.0 54.0 99.1 217.1 1.1 0.7 1.6 1.1
Industry and Trade 89.7 42.5 15.0 147.2 1.6 0.5 0.2 0.7
Multisector 342.2 22.2 239.0 603.3 6.1 0.3 3.8 3.0
Public Sector Management 140.5 215.2 85.5 441.2 2.5 2.7 1.4 2.2
Transport and ICT 408.1 808.7 1,092.0 2,308.8 7.2 10.1 17.3 11.6
Water and Other Municipal Infrastructure
and Services
148.0 139.1 207.7 494.8 2.6 1.7 3.3 2.5
B. Blend Countriesc 3,705.3 5,548.6 3,633.1 12,887.0 65.8 69.0 57.7 64.5
Agriculture and Natural Resources 850.7 699.3 488.0 2,037.9 15.1 8.7 7.7 10.2
Education 625.9 539.0 130.0 1,294.9 11.1 6.7 2.1 6.5
Energy 172.6 100.0 327.4 600.0 3.1 1.2 5.2 3.0
Finance 136.0 198.0 73.0 407.0 2.4 2.5 1.2 2.0
Health and Social Protection 91.2 350.0 177.0 618.2 1.6 4.4 2.8 3.1
Industry and Trade 162.5 85.0 101.0 348.5 2.9 1.1 1.6 1.7
Multisector 316.2 1,466.6 364.8 2,147.6 5.6 18.2 5.8 10.8
Public Sector Management 378.4 538.8 674.4 1,591.6 6.7 6.7 10.7 8.0
Transport and ICT 509.5 761.5 757.2 2,028.2 9.0 9.5 12.0 10.2
Water and Other Municipal Infrastructure
and Services
462.3 810.3 540.4 1,813.0 8.2 10.1 8.6 9.1
C. Regional - 34.5 - 34.5 0.0 0.4 0.0 0.2
Health and Social Protection 33.0 33.0 0.0 0.4 0.0 0.2
Transport and ICT 1.5 1.5 0.0 0.0 0.0 0.0
Total 5,632.6 8,036.4 6,301.4 19,970.4 100.0 100.0 100.0 100.0
D. All ADF-Eligible Countries and Regional
Agriculture and Natural Resources 1,181.5 1,074.9 766.7 3,023.1 21.0 13.4 12.2 15.1
Education 836.5 690.1 314.3 1,840.9 14.9 8.6 5.0 9.2
Energy 290.3 541.6 696.8 1,528.6 5.2 6.7 11.1 7.7
Finance 211.7 401.5 170.5 783.7 3.8 5.0 2.7 3.9
Health and Social Protection 155.2 437.0 276.1 868.3 2.8 5.4 4.4 4.3
Industry and Trade 252.2 127.5 116.0 495.7 4.5 1.6 1.8 2.5
Multisector 658.4 1,488.8 603.8 2,750.9 11.7 18.5 9.6 13.8
Public Sector Management 518.9 754.0 759.9 2,032.7 9.2 9.4 12.1 10.2
Transport and ICT 917.6 1,571.7 1,849.2 4,338.5 16.3 19.6 29.3 21.7
Water and Other Municipal Infrastructure
and Services
610.3 949.4 748.1 2,307.8 10.8 11.8 11.9 11.6
Total 5,632.6 8,036.4 6,301.4 19,970.4 100.0 100.0 100.0 100.0
ADB = Asian Development Bank, ADF = Asian Development Fund, ICT = information and communication technology, TA = technical assistance.a Based on the January 2009 Revised Project Classification System.b Excludes India and Myanmar which currently have no access to ADF.c Only the ADF-financed component of loans is counted for the blend countries. At the time of loan approval, Cook Islands and Indonesia were still ADF
eligible (blend).Source: ADB database on Loan, TA, Grant and Equity Approvals.
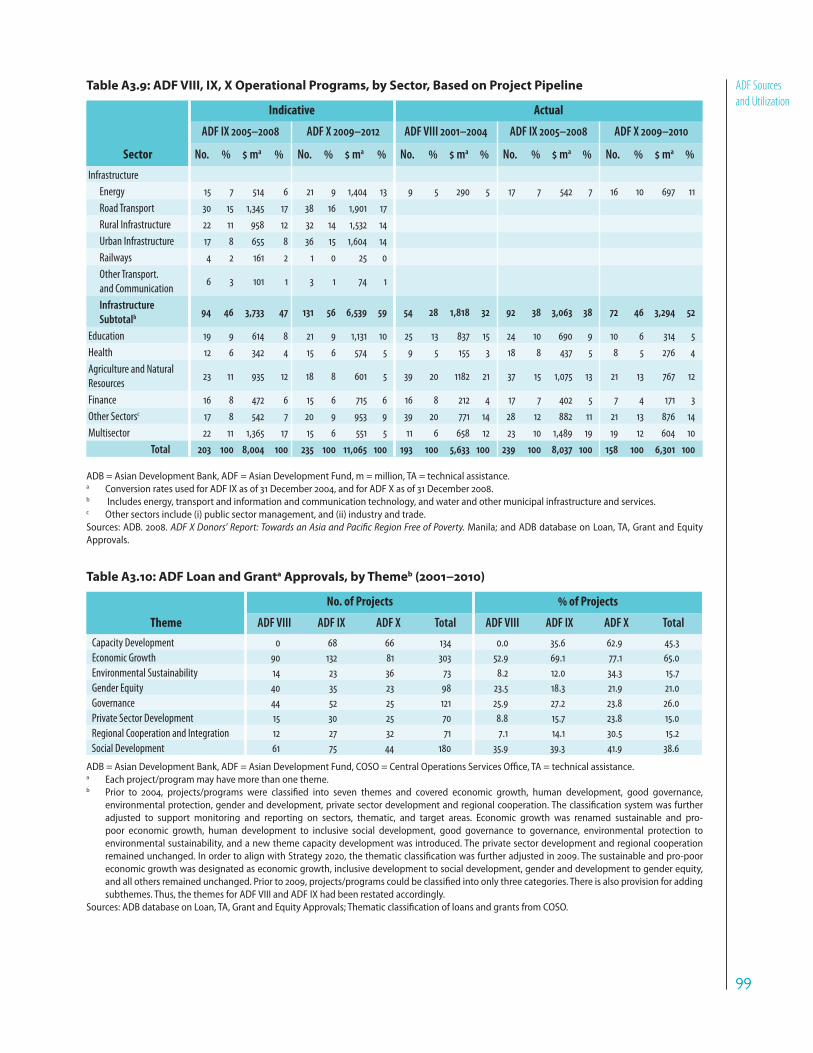
9999
ADF Sources
and Utilization
Table A3.9: ADF VIII, IX, X Operational Programs, by Sector, Based on Project Pipeline
Sector
Indicative Actual
ADF IX 2005–2008 ADF X 2009–2012 ADF VIII 2001–2004 ADF IX 2005–2008 ADF X 2009–2010
No. ma No. ma No. ma No. ma No. ma
Infrastructure
Energy 15 7 514 6 21 9 1,404 13 9 5 290 5 17 7 542 7 16 10 697 11
Road Transport 30 15 1,345 17 38 16 1,901 17
Rural Infrastructure 22 11 958 12 32 14 1,532 14
Urban Infrastructure 17 8 655 8 36 15 1,604 14
Railways 4 2 161 2 1 0 25 0
Other Transport.
and Communication6 3 101 1 3 1 74 1
Infrastructure Subtotalb 94 46 3,733 47 131 56 6,539 59 54 28 1,818 32 92 38 3,063 38 72 46 3,294 52
Education 19 9 614 8 21 9 1,131 10 25 13 837 15 24 10 690 9 10 6 314 5
Health 12 6 342 4 15 6 574 5 9 5 155 3 18 8 437 5 8 5 276 4
Agriculture and Natural
Resources23 11 935 12 18 8 601 5 39 20 1182 21 37 15 1,075 13 21 13 767 12
Finance 16 8 472 6 15 6 715 6 16 8 212 4 17 7 402 5 7 4 171 3
Other Sectorsc 17 8 542 7 20 9 953 9 39 20 771 14 28 12 882 11 21 13 876 14
Multisector 22 11 1,365 17 15 6 551 5 11 6 658 12 23 10 1,489 19 19 12 604 10
Total 203 100 8,004 100 235 100 11,065 100 193 100 5,633 100 239 100 8,037 100 158 100 6,301 100
ADB = Asian Development Bank, ADF = Asian Development Fund, m = million, TA = technical assistance.a Conversion rates used for ADF IX as of 31 December 2004, and for ADF X as of 31 December 2008. b Includes energy, transport and information and communication technology, and water and other municipal infrastructure and services.c Other sectors include (i) public sector management, and (ii) industry and trade. Sources: ADB. 2008. ADF X Donors’ Report: Towards an Asia and Pacific Region Free of Poverty. Manila; and ADB database on Loan, TA, Grant and Equity Approvals.
Table A3.10: ADF Loan and Granta Approvals, by Themeb (2001−2010)
Theme
No. of Projects of Projects
ADF VIII ADF IX ADF X Total ADF VIII ADF IX ADF X Total
Capacity Development 0 68 66 134 0.0 35.6 62.9 45.3
Economic Growth 90 132 81 303 52.9 69.1 77.1 65.0
Environmental Sustainability 14 23 36 73 8.2 12.0 34.3 15.7
Gender Equity 40 35 23 98 23.5 18.3 21.9 21.0
Governance 44 52 25 121 25.9 27.2 23.8 26.0
Private Sector Development 15 30 25 70 8.8 15.7 23.8 15.0
Regional Cooperation and Integration 12 27 32 71 7.1 14.1 30.5 15.2
Social Development 61 75 44 180 35.9 39.3 41.9 38.6
ADB = Asian Development Bank, ADF = Asian Development Fund, COSO = Central Operations Services Office, TA = technical assistance.a Each project/program may have more than one theme.b Prior to 2004, projects/programs were classified into seven themes and covered economic growth, human development, good governance,
environmental protection, gender and development, private sector development and regional cooperation. The classification system was further adjusted to support monitoring and reporting on sectors, thematic, and target areas. Economic growth was renamed sustainable and pro-poor economic growth, human development to inclusive social development, good governance to governance, environmental protection to environmental sustainability, and a new theme capacity development was introduced. The private sector development and regional cooperation remained unchanged. In order to align with Strategy 2020, the thematic classification was further adjusted in 2009. The sustainable and pro-poor economic growth was designated as economic growth, inclusive development to social development, gender and development to gender equity, and all others remained unchanged. Prior to 2009, projects/programs could be classified into only three categories. There is also provision for adding subthemes. Thus, the themes for ADF VIII and ADF IX had been restated accordingly.
Sources: ADB database on Loan, TA, Grant and Equity Approvals; Thematic classification of loans and grants from COSO.

100100
Appendix 3 Table A3.11: ADB Financing of Projects/Programs in Blend Countries
(2001–2010; in million)
Country
ADF VIII ADF IX
ADF only Blend Funding OCR only
ADF only Blend Funding OCR only TotalLoans Grants ADF OCR Subtotal Total Loans Grants ADFa OCR Subtotal
Armenia - - - - - - - 83.9 - - - - - 83.9
Azerbaijan 22.0 - 20.0 10.0 30.0 - 52.0 - - 13.0 239.0 252.0 215.4 467.4
Bangladesh 771.1 - 102.6 168.9 271.5 316.6 1,359.2 1,297.6 10.0 183.0 807.0 990.0 - 2,297.6
Cook Islands 2.2 - - - - - 2.2 2.8 - 6.9 8.6 15.5 - 18.3
Georgia - - - - - - - 110.0 - - - - - 110.0
Indonesia 231.2 - 99.2 387.4 486.6 1,036.0 1,753.8 313.3 - 117.1 754.1 871.2 2,281.0 3,465.5
Marshall Islands 7.0 - 8.0 4.0 12.0 - 19.0 - - - - - - -
Micronesia, FS 13.0 - 14.2 4.8 19.0 - 32.0 - - - - - - -
Pakistan 356.8 - 688.8 2,182.1 2,870.9 450.0 3,677.7 1,010.0 - 448.8 2,005.8 2,454.6 1,400.0 4,864.6
Palau - - - - - - - - - - - - - -
Papua New Guinea 30.6 - - - - 70.0 100.6 - 15.0 158.0 95.0 253.0 - 268.0
Sri Lanka 301.8 - 204.8 346.2 551.0 - 852.8 277.8 52.2 46.5 13.5 60.0 540.0 930.0
Uzbekistan - - - - - 472.7 472.7 115.0 - 42.6 117.6 160.2 96.0 371.2
Viet Nam 832.0 - - - - 120.0 952.0 999.4 45.6 200.0 896.0 1,096.0 994.1 3,135.1
Total 2,567.7 - 1,137.6 3,103.4 4,241.0 2,465.3 9,274.0 4,209.8 122.9 1,215.9 4,936.6 6,152.5 5,526.5 16,011.6Ratio of OCR to ADF
2.7 1.5 4.1 1.9
Annualized Data 641.9 - 284.4 775.9 1,060.3 616.3 2,318.5 1,052.5 30.7 304.0 1,234.2 1,538.1 1,381.6 4,002.9
Country
ADF X ADF VIII–X
ADF only Blend Funding OCR only Total
ADF only Blend Funding OCR only TotalLoans Grants ADF OCR Subtotal Loans Grants ADFa OCR Subtotal
Armenia 140.0 - - - - 170.0 310.0 223.9 - - - - 170.0 393.9
Azerbaijan - - - - - 75.0 75.0 22.0 - 33.0 249.0 282.0 290.4 594.4
Bangladesh 651.0 - 225.9 1,400.0 1,625.9 - 2,276.9 2,719.7 10.0 511.5 2,375.9 2,887.4 316.6 5,933.6
Cook Islands - - - - - 10.0 10.0 5.0 - 6.9 8.6 15.5 10.0 30.5
Georgia 313.8 - - - - 250.0 563.8 423.8 - - - - 250.0 673.8
Indonesia - - - - - 2,669.2 2,669.2 544.5 - 216.3 1,141.5 1,357.8 5,986.2 7,888.6
Marshall Islands 9.5 - - - - - 9.5 16.5 - 8.0 4.0 12.0 - 28.5
Micronesia, FS - - - - - - - 13.0 - 14.2 4.8 19.0 - 32.0
Pakistan 270.0 - 245.0 465.0 710.0 472.0 1,452.0 1,636.8 - 1,382.6 4,652.9 6,035.5 2,322.0 9,994.3
Palau - - 3.4 12.6 16.0 - 16.0 - - 3.4 12.6 16.0 - 16.0
Papua New Guinea 38.0 - 86.4 65.9 152.3 - 190.3 68.6 15.0 244.4 160.9 405.3 70.0 558.9
Sri Lanka 82.8 - 139.4 365.0 504.4 200.0 787.2 662.3 52.2 390.7 724.7 1,115.4 740.0 2,570.0
Uzbekistan 315.0 - 10.0 340.0 350.0 50.0 715.0 430.0 - 52.6 457.6 510.2 618.7 1,558.9
Viet Nam 1,093.0 - 10.0 120.0 130.0 1,792.9 3,015.9 2,924.4 45.6 210.0 1,016.0 1,226.0 2,906.9 7,102.9
Total 2,913.1 - 720.1 2,768.5 3,488.6 5,689.1 12,090.7 9,690.6 122.9 3,073.5 10,808.5 13,882.1 13,680.9 37,376.4Ratio of OCR to ADF
3.8 2.3 3.5 1.9
Annualized Data 1,456.5 - 360.0 1,384.3 1,744.3 2,844.5 6,045.4 969.1 12.3 307.4 1,080.9 1,388.2 1,368.1 3,737.6
ADB = Asian Development Bank, ADF = Asian Development Fund, FS = Federated States of, OCR = ordinary capital resources, TA = technical assistance. a Includes a grant to Pakistan amounting to $5 million.Source: ADB database on Loan, TA, Grant and Equity Approvals.

101101
ADF Sources
and Utilization
Table A3.12: Financing and Cofinancing for ADF IX and ADF X,a by Country
( million)
Country Classification/Country
ADF IX (2005−2008) ADF X (2009−2010) ADF IX−X (2005–2010)
ADF Financing
Co-financ-ing
Co-financing
ADF Financ-ing
Co-financ-ing
Co-financing
ADF Financ-ing
Co-financ-ing
Co-financing
A. ADF-Only Countries 622.8 433.0 41.0 642.3 392.5 37.9 1,265.0 825.5 39.5Ordinary Situationsb Subtotal 227.5 214.9 48.6 232.4 173.7 42.8 459.9 388.6 45.8
Bhutan 54.3 56.5 51.0 21.6 0.3 1.2 75.9 56.7 42.8
Cambodia 90.0 92.6 50.7 136.8 103.0 43.0 226.8 195.6 46.3
Kyrgyz Republic 0.0 0.0 0.0 0.0 0.0 0.0
Maldives 0.0 0.0 0.0 0.0 0.0 0.0
Mongolia 33.2 2.6 7.3 74.0 70.5 48.8 107.2 73.1 40.5
Samoa 50.1 63.2 55.8 0.0 0.0 50.1 63.2 55.8
Tonga 0.0 0.0 0.0 0.0 0.0 0.0
Exited FCAS Subtotal 317.1 176.2 35.7 284.3 120.3 29.7 601.4 296.4 33.0
Lao PDR 47.0 65.1 58.1 83.0 70.7 46.0 130.0 135.8 51.1
Nepal 211.5 102.5 32.6 190.6 48.0 20.1 402.1 150.5 27.2
Tajikistan 58.6 8.6 12.7 10.7 1.6 13.0 69.3 10.2 12.8
Current FCAS Subtotal 78.2 42.0 34.9 125.6 98.5 44.0 203.8 140.5 40.8
Afghanistan 47.3 8.4 15.0 86.6 3.3 3.7 133.9 11.7 8.0
Kiribati 0.0 0.0 12.0 20.6 63.2 12.0 20.6 63.2
Nauru 0.0 0.0 0.0 0.0 0.0 0.0
Solomon Islands 30.9 33.6 52.1 27.0 74.6 73.4 57.9 108.2 65.2
Timor-Leste 0.0 0.0 0.0 0.0 0.0 0.0
Tuvalu 0.0 0.0 0.0 0.0 0.0 0.0
Vanuatu 0.0 0.0 0.0 0.0 0.0 0.0
B. Blendc Countries 1,673.1 1,506.9 47.4 669.8 366.7 35.4 2,342.9 1,873.6 44.4Ordinary Situations Subtotal 1,557.5 1,467.3 48.5 646.8 360.7 35.8 2,204.3 1,827.9 45.3
Armenia 0.0 0.0 0.0 0.0 0.0 0.0
Bangladesh 694.4 409.1 37.1 206.0 39.4 16.1 900.4 448.5 33.2
Georgia 0.0 0.0 118.8 170.0 58.9 118.8 170.0 58.9
Indonesiad 70.6 52.1 42.4 30.0 3.8 11.2 100.6 55.9 35.7
Pakistan 232.5 37.5 13.9 20.0 25.0 55.6 252.5 62.5 19.8
Sri Lanka 130.0 23.9 15.5 70.0 48.8 41.1 200.0 72.7 26.7
Viet Nam 430.0 944.7 68.7 202.0 73.7 26.7 632.0 1,018.4 61.7
Exited FCAS Subtotal 60.6 25.9 29.9 10.0 0.0 0.0 70.6 25.9 26.8
Azerbaijan 3.0 21.4 87.7 0.0 0.0 3.0 21.4 87.7
Uzbekistan 57.6 4.5 7.2 10.0 0.0 0.0 67.6 4.5 6.2
Current FCAS Subtotal 55.0 13.8 20.0 13.0 6.0 31.6 68.0 19.8 22.5
Marshall Islands 0.0 0.0 0.0 0.0 0.0 0.0
Micronesia, Fed. States of 0.0 0.0 0.0 0.0 0.0 0.0
Palau 0.0 0.0 0.0 0.0 0.0 0.0
Papua New Guinea 55.0 13.8 20.0 13.0 6.0 31.6 68.0 19.8 22.5
Regional 86.5 35.9 29.3 0.0 0.0 86.5 35.9 29.3Total 2,382.4 1,975.8 45.3 1,312.1 759.1 36.7 3,694.4 2,734.9 42.5
ADF = Asian Development Fund, FCAS = fragile and conflict-affected situations, Lao PDR = Lao People’s Democratic Republic.a Excludes financing from ordinary capital resources. Includes cofinancing only for ADF-supported projects.b Excludes Myanmar, which currently has no access to ADF.c Only the ADF-financed component of loans is counted for blend countries.d This country was still ADF-eligible at the time of loan approval.Source: Cofinancing database.
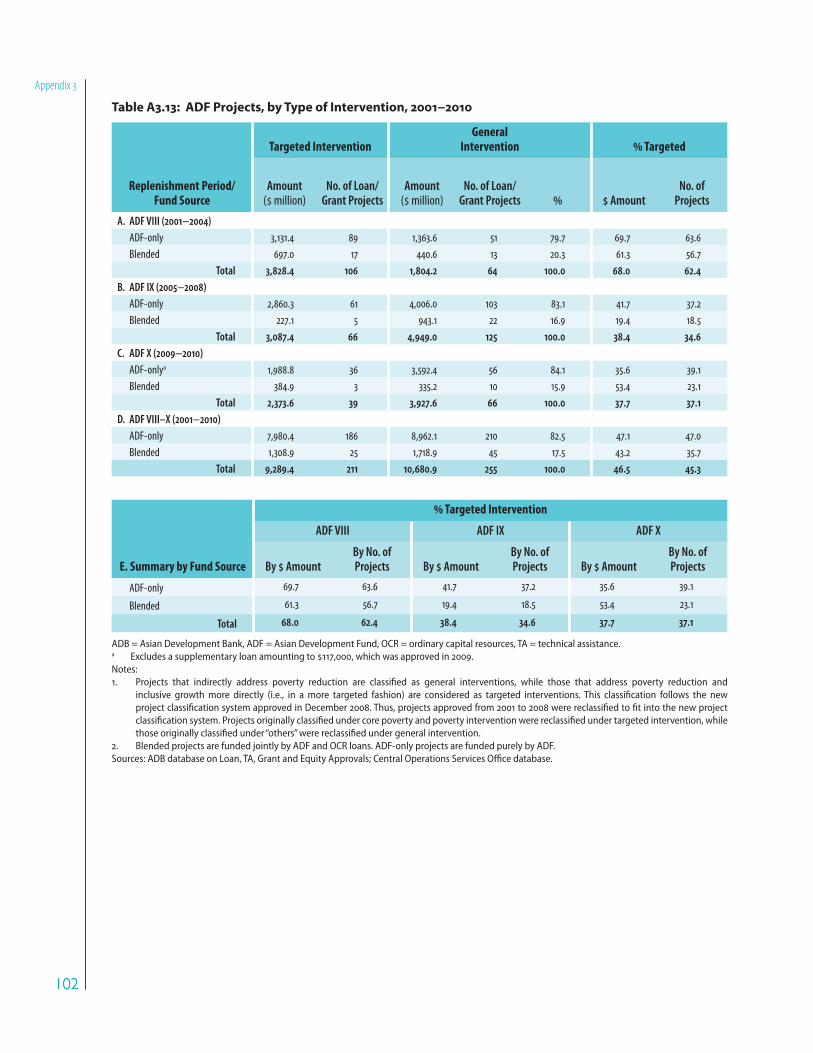
102102
Appendix 3
Table A3.13: ADF Projects, by Type of Intervention, 2001−2010
Replenishment Period/Fund Source
Targeted InterventionGeneral
Intervention Targeted
Amount ( million)
No. of Loan/Grant Projects
Amount ( million)
No. of Loan/Grant Projects Amount
No. of Projects
A. ADF VIII (2001−2004) ADF-only 3,131.4 89 1,363.6 51 79.7 69.7 63.6
Blended 697.0 17 440.6 13 20.3 61.3 56.7
Total 3,828.4 106 1,804.2 64 100.0 68.0 62.4B. ADF IX (2005−2008) ADF-only 2,860.3 61 4,006.0 103 83.1 41.7 37.2
Blended 227.1 5 943.1 22 16.9 19.4 18.5
Total 3,087.4 66 4,949.0 125 100.0 38.4 34.6C. ADF X (2009−2010) ADF-onlya 1,988.8 36 3,592.4 56 84.1 35.6 39.1
Blended 384.9 3 335.2 10 15.9 53.4 23.1
Total 2,373.6 39 3,927.6 66 100.0 37.7 37.1D. ADF VIII–X (2001−2010) ADF-only 7,980.4 186 8,962.1 210 82.5 47.1 47.0
Blended 1,308.9 25 1,718.9 45 17.5 43.2 35.7
Total 9,289.4 211 10,680.9 255 100.0 46.5 45.3
E. Summary by Fund Source
Targeted Intervention
ADF VIII ADF IX ADF X
By AmountBy No. of Projects By Amount
By No. of Projects By Amount
By No. of Projects
ADF-only 69.7 63.6 41.7 37.2 35.6 39.1
Blended 61.3 56.7 19.4 18.5 53.4 23.1
Total 68.0 62.4 38.4 34.6 37.7 37.1
ADB = Asian Development Bank, ADF = Asian Development Fund, OCR = ordinary capital resources, TA = technical assistance.a Excludes a supplementary loan amounting to $117,000, which was approved in 2009.Notes:1. Projects that indirectly address poverty reduction are classified as general interventions, while those that address poverty reduction and
inclusive growth more directly (i.e., in a more targeted fashion) are considered as targeted interventions. This classification follows the new project classification system approved in December 2008. Thus, projects approved from 2001 to 2008 were reclassified to fit into the new project classification system. Projects originally classified under core poverty and poverty intervention were reclassified under targeted intervention, while those originally classified under “others” were reclassified under general intervention.
2. Blended projects are funded jointly by ADF and OCR loans. ADF-only projects are funded purely by ADF. Sources: ADB database on Loan, TA, Grant and Equity Approvals; Central Operations Services Office database.
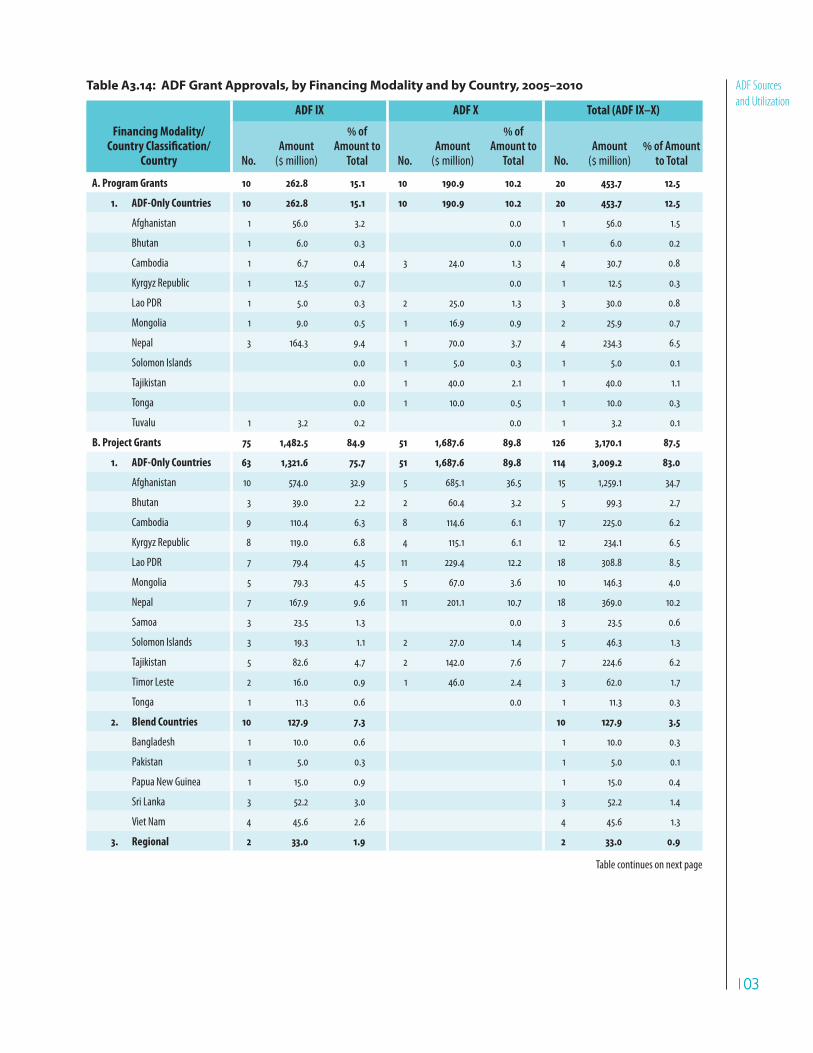
103103
ADF Sources
and Utilization
Table A3.14: ADF Grant Approvals, by Financing Modality and by Country, 2005–2010
Financing Modality/Country Classification/
Country
ADF IX ADF X Total (ADF IX–X)
No.Amount
( million)
of Amount to
Total No.Amount
( million)
of Amount to
Total No.Amount
( million) of Amount
to Total
A. Program Grants 10 262.8 15.1 10 190.9 10.2 20 453.7 12.5
1. ADF-Only Countries 10 262.8 15.1 10 190.9 10.2 20 453.7 12.5
Afghanistan 1 56.0 3.2 0.0 1 56.0 1.5
Bhutan 1 6.0 0.3 0.0 1 6.0 0.2
Cambodia 1 6.7 0.4 3 24.0 1.3 4 30.7 0.8
Kyrgyz Republic 1 12.5 0.7 0.0 1 12.5 0.3
Lao PDR 1 5.0 0.3 2 25.0 1.3 3 30.0 0.8
Mongolia 1 9.0 0.5 1 16.9 0.9 2 25.9 0.7
Nepal 3 164.3 9.4 1 70.0 3.7 4 234.3 6.5
Solomon Islands 0.0 1 5.0 0.3 1 5.0 0.1
Tajikistan 0.0 1 40.0 2.1 1 40.0 1.1
Tonga 0.0 1 10.0 0.5 1 10.0 0.3
Tuvalu 1 3.2 0.2 0.0 1 3.2 0.1
B. Project Grants 75 1,482.5 84.9 51 1,687.6 89.8 126 3,170.1 87.5
1. ADF-Only Countries 63 1,321.6 75.7 51 1,687.6 89.8 114 3,009.2 83.0
Afghanistan 10 574.0 32.9 5 685.1 36.5 15 1,259.1 34.7
Bhutan 3 39.0 2.2 2 60.4 3.2 5 99.3 2.7
Cambodia 9 110.4 6.3 8 114.6 6.1 17 225.0 6.2
Kyrgyz Republic 8 119.0 6.8 4 115.1 6.1 12 234.1 6.5
Lao PDR 7 79.4 4.5 11 229.4 12.2 18 308.8 8.5
Mongolia 5 79.3 4.5 5 67.0 3.6 10 146.3 4.0
Nepal 7 167.9 9.6 11 201.1 10.7 18 369.0 10.2
Samoa 3 23.5 1.3 0.0 3 23.5 0.6
Solomon Islands 3 19.3 1.1 2 27.0 1.4 5 46.3 1.3
Tajikistan 5 82.6 4.7 2 142.0 7.6 7 224.6 6.2
Timor Leste 2 16.0 0.9 1 46.0 2.4 3 62.0 1.7
Tonga 1 11.3 0.6 0.0 1 11.3 0.3
2. Blend Countries 10 127.9 7.3 10 127.9 3.5
Bangladesh 1 10.0 0.6 1 10.0 0.3
Pakistan 1 5.0 0.3 1 5.0 0.1
Papua New Guinea 1 15.0 0.9 1 15.0 0.4
Sri Lanka 3 52.2 3.0 3 52.2 1.4
Viet Nam 4 45.6 2.6 4 45.6 1.3
3. Regional 2 33.0 1.9 2 33.0 0.9
Table continues on next page
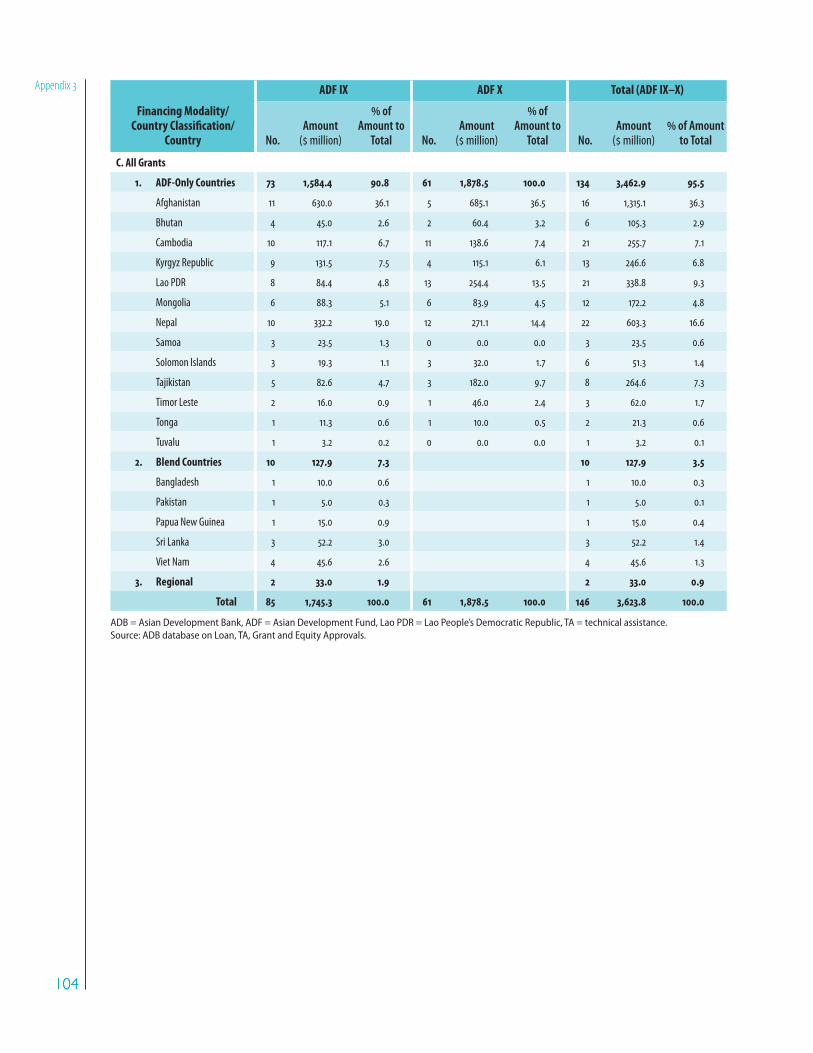
104104
Appendix 3
Financing Modality/Country Classification/
Country
ADF IX ADF X Total (ADF IX–X)
No.Amount
( million)
of Amount to
Total No.Amount
( million)
of Amount to
Total No.Amount
( million) of Amount
to Total
C. All Grants
1. ADF-Only Countries 73 1,584.4 90.8 61 1,878.5 100.0 134 3,462.9 95.5
Afghanistan 11 630.0 36.1 5 685.1 36.5 16 1,315.1 36.3
Bhutan 4 45.0 2.6 2 60.4 3.2 6 105.3 2.9
Cambodia 10 117.1 6.7 11 138.6 7.4 21 255.7 7.1
Kyrgyz Republic 9 131.5 7.5 4 115.1 6.1 13 246.6 6.8
Lao PDR 8 84.4 4.8 13 254.4 13.5 21 338.8 9.3
Mongolia 6 88.3 5.1 6 83.9 4.5 12 172.2 4.8
Nepal 10 332.2 19.0 12 271.1 14.4 22 603.3 16.6
Samoa 3 23.5 1.3 0 0.0 0.0 3 23.5 0.6
Solomon Islands 3 19.3 1.1 3 32.0 1.7 6 51.3 1.4
Tajikistan 5 82.6 4.7 3 182.0 9.7 8 264.6 7.3
Timor Leste 2 16.0 0.9 1 46.0 2.4 3 62.0 1.7
Tonga 1 11.3 0.6 1 10.0 0.5 2 21.3 0.6
Tuvalu 1 3.2 0.2 0 0.0 0.0 1 3.2 0.1
2. Blend Countries 10 127.9 7.3 10 127.9 3.5
Bangladesh 1 10.0 0.6 1 10.0 0.3
Pakistan 1 5.0 0.3 1 5.0 0.1
Papua New Guinea 1 15.0 0.9 1 15.0 0.4
Sri Lanka 3 52.2 3.0 3 52.2 1.4
Viet Nam 4 45.6 2.6 4 45.6 1.3
3. Regional 2 33.0 1.9 2 33.0 0.9
Total 85 1,745.3 100.0 61 1,878.5 100.0 146 3,623.8 100.0
ADB = Asian Development Bank, ADF = Asian Development Fund, Lao PDR = Lao People’s Democratic Republic, TA = technical assistance. Source: ADB database on Loan, TA, Grant and Equity Approvals.

105105
ADF Sources
and Utilization
Table A3.15: ADF Grant Approvals, by Financing Modality and by Sector, 2005–2010
Financing Modality/Sectora
ADF IX ADF X Total (ADF IX–X)
No.Amount
( million) of Amount
to Total No.Amount
( million) of Amount
to Total No.Amount
( million) of Amount
to Total
A. Program Grants 10 262.8 15.1 10 190.9 10.2 20 453.7 12.5
Agriculture and Natural
Resources 1 50.0 2.9 0.0 1 50.0 1.4
Education 1 8.0 0.5 1 70.0 3.7 2 78.0 2.2
Finance 1 56.0 3.2 1 5.0 0.3 2 61.0 1.7
Health and Social Protection 1 9.0 0.5 1 10.0 0.5 2 19.0 0.5
Industry and Trade 2 11.0 0.6 1 15.0 0.8 3 26.0 0.7
Multisector 1 12.5 0.7 4 71.9 3.8 5 84.4 2.3
Public Sector Management 3 116.3 6.7 2 19.0 1.0 5 135.3 3.7
B. Project Grants 75 1,482.5 84.9 51 1,687.6 89.8 126 3,170.1 87.5
Agriculture and Natural
Resources 12 190.1 10.9 9 245.2 13.1 21 435.3 12.0
Education 8 98.2 5.6 4 89.3 4.8 12 187.5 5.2
Energy 5 282.9 16.2 7 287.7 15.3 12 570.6 15.7
Finance 2 12.7 0.7 1 12.1 0.6 3 24.8 0.7
Health and Social Protection 12 148.1 8.5 4 46.0 2.4 16 194.1 5.4
Industry and Trade 2 19.0 1.1 0.0 2 19.0 0.5
Multisector 4 26.9 1.5 3 89.9 4.8 7 116.7 3.2
Public Sector Management 5 30.9 1.8 2 10.0 0.5 7 40.9 1.1
Transport and ICT 18 573.0 32.8 15 783.3 41.7 33 1,356.2 37.4
Water and Other Municipal
Infrastructure and Services 7 100.7 5.8 6 124.2 6.6 13 224.9 6.2
C. All Grants
Agriculture and Natural
Resources 13 240.1 13.8 9 245.2 13.1 22 485.3 13.4
Education 9 106.2 6.1 5 159.3 8.5 14 265.5 7.3
Energy 5 282.9 16.2 7 287.7 15.3 12 570.6 15.7
Finance 3 68.7 3.9 2 17.1 0.9 5 85.8 2.4
Health and Social Protection 13 157.1 9.0 5 56.0 3.0 18 213.1 5.9
Industry and Trade 4 30.0 1.7 1 15.0 0.8 5 45.0 1.2
Multisector 5 39.4 2.3 7 161.8 8.6 12 201.1 5.5
Public Sector Management 8 147.2 8.4 4 29.0 1.5 12 176.2 4.9
Transport and ICT 18 573.0 32.8 15 783.3 41.7 33 1,356.2 37.4
Water and Other Municipal
Infrastructure and Services 7 100.7 5.8 6 124.2 6.6 13 224.9 6.2
Total 85 1,745.3 100.0 61 1,878.5 100.0 146 3,623.8 100.0
ADB = Asian Development Bank, ADF = Asian Development Fund, ICT = information and communication technology, TA = technical assistance.a Based on the January 2009 Revised Project Classification System.Source: ADB database on Loan, TA, Grant and Equity Approvals.

106106
Appendix 3 Table A3.16: Distribution of ADF VI–X Approvals, by Financing Modality,a 1992–2010
Financing Modality
ADF VI–VII ADF VIII ADF IX ADF X ADF VIII–X
million Share () million Share () million Share () million Share () million Share ()
Project 10,820.8 90.2 4,330.7 76.9 6,541.3 81.4 4,738.2 75.2 15,610.3 78.2
Loan 10,820.8 90.2 4,330.7 76.9 5,058.8 62.9 3,050.6 48.4 12,440.2 62.3
Grant 1,482.5 18.4 1,687.6 26.8 3,170.1 15.9
Program 1,172.6 9.8 1,301.9 23.1 1,495.1 18.6 1,563.2 24.8 4,360.2 21.8
Loan 1,172.6 9.8 1,301.9 23.1 1,232.4 15.3 1,372.3 21.8 3,906.5 19.6
Grant 262.8 3.3 190.9 3.0 453.7 2.3
Total 11,993.4 100.0 5,632.6 100.0 8,036.4 100.0 6,301.4 100.0 19,970.4 100.0
ADB = Asian Development Bank, ADF = Asian Development Fund, TA = technical assistance. a The program and project loan/grant components of a sector development program are counted separately. Sources: ADB database on Loan, TA, Grant and Equity Approvals; Loan Financial Information System.
Table A3.17: ADF Program Loan and Grant Approvals,a by Sector, 2001–2010
Sectorb
ADF VIII ADF IX ADF X Total (ADF VIII–X)
No.Amount
( million)
of Amount to Total No.
Amount ( million)
of Amount to Total No.
Amount ( million)
of Amount to Total No.
Amount ( million)
of Amount to Total
Agriculture and
Natural Resources4 263.0 20.2 1 50.0 3.3 1 20.0 1.3 6 333.0 7.6
Education 2 40.0 3.1 4 76.9 5.1 3 115.0 7.4 9 231.9 5.3
Energy 1 60.0 4.0 1 60.0 1.4
Finance 6 124.0 9.5 12 381.5 25.5 5 145.4 9.3 23 650.9 14.9
Health and Social
Protection1 8.0 0.6 2 109.0 7.3 3 203.1 13.0 6 320.1 7.3
Industry and Trade 6 140.0 10.8 3 31.0 2.1 1 15.0 1.0 10 186.0 4.3
Multisector 4 362.2 27.8 4 57.5 3.8 10 277.9 17.8 18 697.6 16.0
Public Sector
Management12 359.7 27.6 10 679.3 45.4 13 713.4 45.6 35 1,752.3 40.2
Transport and ICT - 0 - -
Water and
Other Municipal
Infrastructure and
Services
1 5.0 0.4 1 50.0 3.3 2 73.4 4.7 4 128.4 2.9
Total 36 1,301.9 100.0 38 1,495.1 100.0 38 1,563.2 100.0 112 4,360.2 100.0
ADB = Asian Development Bank, ADF = Asian Development Fund, ICT = information and communication technology, TA = technical assistance. a Includes only the program loan/grant component of a sector development program. b Based on the January 2009 Revised Project Classification System.Source: ADB database on Loan, TA, Grant and Equity Approvals.

107107
ADF Sources
and Utilization
Table A3.18: Technical Assistancea to ADF Countries, by Source of Funds, 2001–2010
Amount ( million) Share
Fund Source ADF VIII ADF IX ADF X Total ADF VIII ADF IX ADF X Total
TASF-IVb 92.3 92.3 0.0 0.0 39.8 9.1
TASF-other sourcesc 170.2 163.3 4.2 337.6 43.9 41.8 1.8 33.4
Other Sourcesd 217.6 227.7 135.6 580.9 56.1 58.2 58.4 57.5
Total 387.8 391.0 232.0 1,010.8 100.0 100.0 100.0 100.0
ADB = Asian Development Bank, ADF = Asian Development Fund, CCF = Climate Change Fund, DMC = developing member country, JSF = Japan Special Fund, RCIF = Regional Cooperation and Integration Fund, TA = technical assistance, TASF = Technical Assistance Special Fund.a Excludes regional technical assistance.b This is a part of TASF, which is replenished through TASF regularized replenishments together with ADF replenishments and limits the utilization of
the resources to countries of ADB eligible for ADF, and for regional technical assistance, and research and development technical assistance for the benefit of such DMCs. (Source: Guidelines for the Use of Technical Assistance Resources, December 2008).
c “TASF-other sources” refers to resources transferred to TASF through voluntary contributions, ordinary capital resources net income transfer, and TASF income. These resources can be used for TA for all ADB DMCs. (Source: ADB. 2011. Technical Assistance. Operations Manual. OM D12/BP. Manila.)
d Includes funding from JSF, Special Funds (RCIF and CCF) and other donors.Source: ADB database on Loan, TA, Grant and Equity Approvals.

108108
Appendix 3 Table A3.19: Amount of Technical Assistance to ADF Countries, by Instrument, 2001–2010 ( million)
Country Classification/Country
ADF VIII ADF IX ADF X ADF VIII–X
TASF Othersa TASF OthersaTASF-
Others TASF-IVb Othersa
TASF/TASF-
Others TASF-IV Others
A. ADF-Only Countries 89.5 70.7 71.7 89.0 0.6 42.4 42.4 161.8 42.4 202.1
Ordinary Situationsc Subtotal 32.3 31.2 21.9 36.1 0.2 24.5 16.9 54.4 24.5 84.2
Bhutan 3.9 3.3 4.5 4.2 0.0 2.9 1.6 8.4 2.9 9.1
Cambodia 10.0 14.2 7.9 13.9 0.0 7.4 6.1 17.9 7.4 34.2
Kyrgyz Republic 4.4 5.6 3.4 2.2 0.0 1.6 0.7 7.7 1.6 8.5
Maldives 2.3 1.5 1.5 0.8 0.0 3.7 0.0 3.8 3.7 2.3
Mongolia 5.9 5.4 3.2 9.0 0.2 6.9 7.5 9.3 6.9 21.8
Samoa 3.1 1.1 0.9 4.2 0.0 1.1 0.5 4.0 1.1 5.8
Tonga 2.7 0.3 0.5 1.8 0.0 1.0 0.5 3.2 1.0 2.6
Exited FCAS Subtotal 15.1 28.8 22.5 27.4 0.4 12.2 20.0 38.0 12.2 76.2
Lao PDR 6.6 11.1 8.2 8.7 0.4 4.5 10.0 15.2 4.5 29.8
Nepal 6.7 8.6 10.1 10.2 0.0 6.9 9.2 16.8 6.9 28.0
Tajikistan 1.8 9.2 4.2 8.4 0.0 0.7 0.8 6.0 0.7 18.3
Current FCAS Subtotal 42.1 10.7 27.3 25.5 0.0 5.7 5.5 69.5 5.7 41.7
Afghanistan 33.9 5.3 19.2 4.7 0.0 2.4 1.5 53.1 2.4 11.5
Kiribati 1.9 0.5 0.0 1.4 0.0 0.4 0.7 1.9 0.4 2.6
Nauru 0.0 0.0 0.2 0.5 0.0 0.0 0.0 0.2 0.0 0.5
Solomon Islands 1.2 0.7 2.7 2.8 0.0 0.4 1.3 3.9 0.4 4.7
Timor-Leste 2.2 3.0 3.6 14.9 0.0 1.5 0.8 5.8 1.5 18.7
Tuvalu 0.9 0.6 0.8 0.6 0.0 0.0 0.0 1.7 0.0 1.2
Vanuatu 2.2 0.7 0.8 0.6 0.0 1.1 1.3 3.0 1.1 2.6
B. Blend Countriesd 80.7 146.9 91.5 138.7 3.6 49.9 93.2 175.8 49.9 378.8
Ordinary Situations Subtotal 62.2 129.6 83.7 118.8 1.8 41.9 89.1 147.7 41.9 337.6
Armenia 0.0 0.0 2.2 0.0 0.0 1.2 0.5 2.2 1.2 0.5
Bangladesh 8.9 12.3 12.3 13.1 0.0 11.4 8.2 21.2 11.4 33.5
Cook Islandse 0.4 0.5 1.0 0.7 0.0 0.0 0.9 1.3 0.0 2.1
Georgia 0.0 0.0 0.7 0.0 0.0 3.1 1.7 0.7 3.1 1.7
Indonesiae 16.9 48.2 27.4 19.1 1.0 1.6 62.6 45.3 1.6 129.8
Pakistan 19.5 33.1 21.3 28.6 0.4 4.0 0.4 41.1 4.0 62.1
Sri Lanka 6.4 11.8 3.6 4.3 0.0 5.4 9.0 10.0 5.4 25.0
Viet Nam 10.2 23.8 15.2 53.1 0.4 15.3 6.0 25.8 15.3 82.9
Exited FCAS Subtotal 9.8 9.8 5.3 6.6 1.8 4.4 0.9 16.9 4.4 17.3
Azerbaijan 3.3 4.3 2.6 1.9 0.0 1.0 0.0 5.9 1.0 6.2
Uzbekistan 6.5 5.5 2.7 4.7 1.8 3.4 0.9 11.0 3.4 11.0
Current FCAS Subtotal 8.7 7.5 2.5 13.3 0.0 3.6 3.2 11.2 3.6 24.0
Marshall Islands 2.9 0.7 0.3 0.5 0.0 0.8 0.0 3.1 0.8 1.1
Micronesia, Fed. States of 2.7 1.6 0.6 1.2 0.0 0.0 0.0 3.3 0.0 2.8
Palau 0.0 0.0 0.0 2.1 0.0 0.5 0.7 0.0 0.5 2.8
Papua New Guinea 3.1 5.2 1.7 9.6 0.0 2.2 2.5 4.8 2.2 17.3
Total 170.2 217.6 163.3 227.7 4.2 92.3 135.6 337.6 92.3 580.9
ADB = Asian Development Bank, ADF = Asian Development Fund, CCF = Climate Change Fund, FCAS = fragile and conflict-affected situation, JSF = Japan Special Fund, Lao PDR = Lao People’s Democratic Republic, RCIF = Regional Cooperation and Integration Fund, TA = technical assistance, TASF = Technical Assistance Special Fund.a Includes funding from JSF, Special Funds (RCIF and CCF) and other external donors. b This is a part of TASF, which is replenished through TASF regularized replenishments together with ADF replenishments and limits the utilization of
the resources to countries of ADB eligible for ADF, and for regional technical assistance, and research and development technical assistance for the benefit of such DMCs. (Source: Guidelines for the Use of Technical Assistance Resources, December 2008).
c Excludes Myanmar, which currently has no access to ADF.d Excludes India, which currently has no access to ADF.e These countries were ADF eligible during a part of the review period. Sources: ADB database on Loan, TA, Grant and Equity Approvals; Strategy and Policy Department.
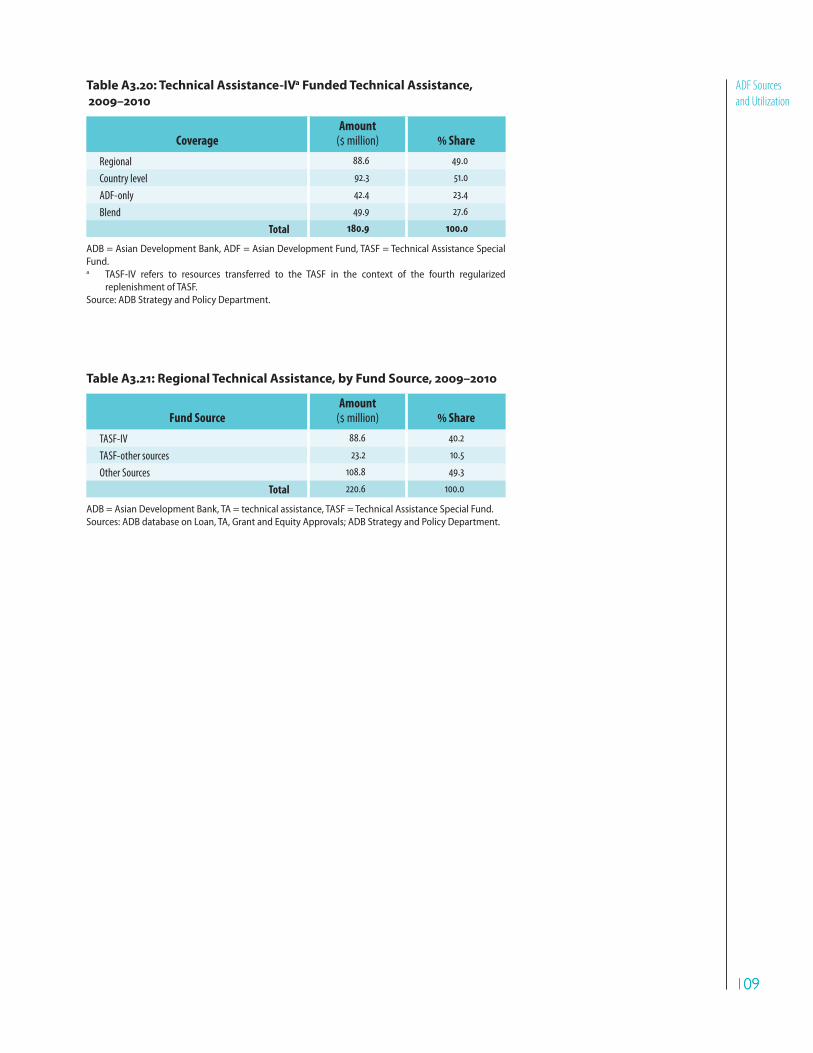
109109
ADF Sources
and Utilization
Table A3.20: Technical Assistance-IVa Funded Technical Assistance,
2009–2010
CoverageAmount
( million) Share
Regional 88.6 49.0
Country level 92.3 51.0
ADF-only 42.4 23.4
Blend 49.9 27.6
Total 180.9 100.0
ADB = Asian Development Bank, ADF = Asian Development Fund, TASF = Technical Assistance Special Fund.a TASF-IV refers to resources transferred to the TASF in the context of the fourth regularized
replenishment of TASF.Source: ADB Strategy and Policy Department.
Table A3.21: Regional Technical Assistance, by Fund Source, 2009–2010
Fund Source
Amount ( million) Share
TASF-IV 88.6 40.2
TASF-other sources 23.2 10.5
Other Sources 108.8 49.3
Total 220.6 100.0
ADB = Asian Development Bank, TA = technical assistance, TASF = Technical Assistance Special Fund.Sources: ADB database on Loan, TA, Grant and Equity Approvals; ADB Strategy and Policy Department.

110110
Appendix 4
Appendix 4
Performance Analysis of Asian Development
Fund Operations
– = no discussion; ADB = Asian Development Bank; ADF = Asian Development Fund; BAN = Bangladesh; BHU = Bhutan; CAM = Cambodia; CAPE = country assistance program evaluation; HS = highly successful; ICT = information and communication technology; INO = Indonesia; LAO = Lao People’s Democratic Republic; MON = Mongolia; na = not assessed, since the ratings are not comparable; NEP = Nepal; PAK = Pakistan; PNG = Papua New Guinea; PS = partly successful; S = successful; SRI = Sri Lanka; US = unsuccessful; UZB = Uzbekistan, VIE = Viet Nam.Note: Ratings in brackets were derived based on discussion in CAPE reports; such derived ratings were provided only when there were no specific ratings given.
Table A4.1: Performance of Country Assistance Programs and ADB
CriterionBAN 2003
BAN 2009
Change BAN
BHU 2005
BHU 2010
Change BHU
CAM 2004
CAM 2009
Change CAM
LAO 2006
LAO 2010a
Change LAO
Positioning – High na – S na – Substantial – Satisfactory na
Relevance S Relevant na S Relevant na S Relevant na S Relevant na
Effectiveness [PS][Less
Effective]na PS-S Effective na S Effective na S Effective na
Efficiency [PS] Efficient Improved PS Efficient Improved S Efficient na PS-S Less Efficient na
Sustainability PS-US Less Likely na PS Less Likely na PS Likely Improved S-PS Likely Improved
Development
Impacts[PS] Substantial Improved PS-S
Modest to
Substantialna S Substantial na – Satisfactory na
ADB Performance [PS] Substantial Improved S S Same S Substantial na S Satisfactory na
End Ratings [PS] S Improved [S] S Same S S Same S S Same
ADF Projects
Approved 39 1 Improved 5 2 Same 10 6 Improved 21 Same
in 1990s/2000sb
Rated Successful(74) (100) (100) (100) (90) (100) (71)
Themes
Targeting the Poor [PS] [S] Improved [S] [S] Same [S] [S] Same – – –
Governance [PS] [PS] Same S [S] Same PS-S [S] Improved PS [S] Improved
Gender Equality PS-S [HS] Improved [S] [PS] Worsened [S] [S] Same S [S] Same
Regional Cooperation
and Integration– [PS] – [S] [S] Same S [S] Same S [S] Same
Capacity
Development– [HS] – [S] [PS] Worsened PS [S] Improved PS [PS] Same
Private Sector [PS] [PS] Same [PS] PS Same S S (low side) Worsened – [S] –
Environment [PS] [S] Improved [PS] [PS] Same – [S] – PS [S] Improved
Sectors
Agriculture and
Natural Resources[HS] PS Worsened [S] – – S S (low side) Worsened PS S Improved
Education [S] S Same [S] – – HS S (low side) Worsened S S Same
Energy [S] S Same [S] S Same [S] PS (high side) Worsened S S Same
Finance [PS] PS Same [S] PS Worsened [S] S (low side) Worsened PS S Improved
Health and Social
Protection[PS] – – [S] – – [S] – – S S Same
Multisector – PS – – – – – – – – – –
Public Sector
Management– PS – – – – – – – – S –
Transport and ICT [S] PS Worsened [S] PS Worsened [S] PS (high side) Worsened HS S Worsened
Water and
Other Municipal
Infrastructure and
Services
[PS-S] PS Same [S] S Same [S] – – PS-S – –
Others – – – – Sc – – – – – Sd –
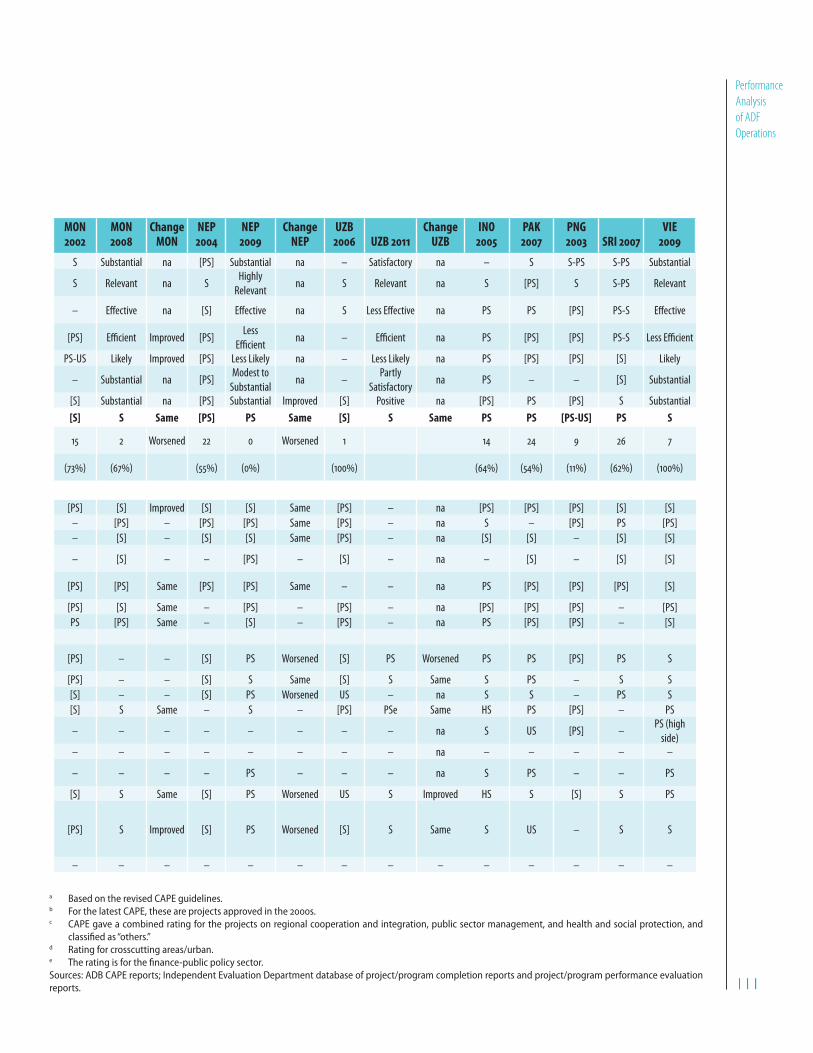
111111
Performance
Analysis
of ADF
Operations
a Based on the revised CAPE guidelines. b For the latest CAPE, these are projects approved in the 2000s. c CAPE gave a combined rating for the projects on regional cooperation and integration, public sector management, and health and social protection, and
classified as “others.” d Rating for crosscutting areas/urban.e The rating is for the finance-public policy sector.Sources: ADB CAPE reports; Independent Evaluation Department database of project/program completion reports and project/program performance evaluation reports.
MON 2002
MON 2008
Change MON
NEP 2004
NEP 2009
Change NEP
UZB 2006 UZB 2011
Change UZB
INO 2005
PAK 2007
PNG 2003 SRI 2007
VIE 2009
S Substantial na [PS] Substantial na – Satisfactory na – S S-PS S-PS Substantial
S Relevant na SHighly
Relevantna S Relevant na S [PS] S S-PS Relevant
– Effective na [S] Effective na S Less Effective na PS PS [PS] PS-S Effective
[PS] Efficient Improved [PS]Less
Efficientna – Efficient na PS [PS] [PS] PS-S Less Efficient
PS-US Likely Improved [PS] Less Likely na – Less Likely na PS [PS] [PS] [S] Likely
– Substantial na [PS]Modest to
Substantialna –
Partly
Satisfactoryna PS – – [S] Substantial
[S] Substantial na [PS] Substantial Improved [S] Positive na [PS] PS [PS] S Substantial
[S] S Same [PS] PS Same [S] S Same PS PS [PS-US] PS S
15 2 Worsened 22 0 Worsened 1 14 24 9 26 7
(73) (67) (55) (0) (100) (64) (54) (11) (62) (100)
[PS] [S] Improved [S] [S] Same [PS] – na [PS] [PS] [PS] [S] [S]
– [PS] – [PS] [PS] Same [PS] – na S – [PS] PS [PS]
– [S] – [S] [S] Same [PS] – na [S] [S] – [S] [S]
– [S] – – [PS] – [S] – na – [S] – [S] [S]
[PS] [PS] Same [PS] [PS] Same – – na PS [PS] [PS] [PS] [S]
[PS] [S] Same – [PS] – [PS] – na [PS] [PS] [PS] – [PS]
PS [PS] Same – [S] – [PS] – na PS [PS] [PS] – [S]
[PS] – – [S] PS Worsened [S] PS Worsened PS PS [PS] PS S
[PS] – – [S] S Same [S] S Same S PS – S S
[S] – – [S] PS Worsened US – na S S – PS S
[S] S Same – S – [PS] PSe Same HS PS [PS] – PS
– – – – – – – – na S US [PS] –PS (high
side)
– – – – – – – – na – – – – –
– – – – PS – – – na S PS – – PS
[S] S Same [S] PS Worsened US S Improved HS S [S] S PS
[PS] S Improved [S] PS Worsened [S] S Same S US – S S
– – – – – – – – – – – – – –
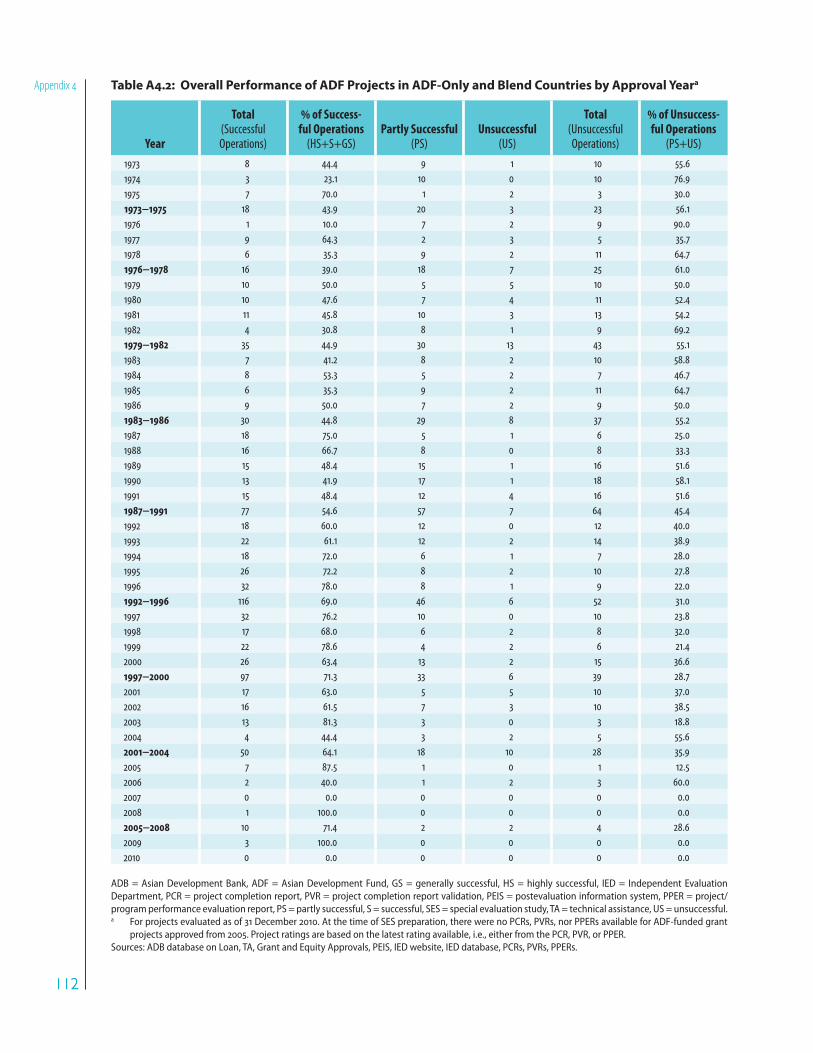
112112
Appendix 4 Table A4.2: Overall Performance of ADF Projects in ADF-Only and Blend Countries by Approval Yeara
Year
Total (Successful Operations)
of Success-ful Operations
(HS+S+GS)Partly Successful
(PS)Unsuccessful
(US)
Total (Unsuccessful Operations)
of Unsuccess-ful Operations
(PS+US)
1973 8 44.4 9 1 10 55.6
1974 3 23.1 10 0 10 76.9
1975 7 70.0 1 2 3 30.0
1973−1975 18 43.9 20 3 23 56.1
1976 1 10.0 7 2 9 90.0
1977 9 64.3 2 3 5 35.7
1978 6 35.3 9 2 11 64.7
1976−1978 16 39.0 18 7 25 61.0
1979 10 50.0 5 5 10 50.0
1980 10 47.6 7 4 11 52.4
1981 11 45.8 10 3 13 54.2
1982 4 30.8 8 1 9 69.2
1979−1982 35 44.9 30 13 43 55.1
1983 7 41.2 8 2 10 58.8
1984 8 53.3 5 2 7 46.7
1985 6 35.3 9 2 11 64.7
1986 9 50.0 7 2 9 50.0
1983−1986 30 44.8 29 8 37 55.2
1987 18 75.0 5 1 6 25.0
1988 16 66.7 8 0 8 33.3
1989 15 48.4 15 1 16 51.6
1990 13 41.9 17 1 18 58.1
1991 15 48.4 12 4 16 51.6
1987−1991 77 54.6 57 7 64 45.4
1992 18 60.0 12 0 12 40.0
1993 22 61.1 12 2 14 38.9
1994 18 72.0 6 1 7 28.0
1995 26 72.2 8 2 10 27.8
1996 32 78.0 8 1 9 22.0
1992−1996 116 69.0 46 6 52 31.0
1997 32 76.2 10 0 10 23.8
1998 17 68.0 6 2 8 32.0
1999 22 78.6 4 2 6 21.4
2000 26 63.4 13 2 15 36.6
1997−2000 97 71.3 33 6 39 28.7
2001 17 63.0 5 5 10 37.0
2002 16 61.5 7 3 10 38.5
2003 13 81.3 3 0 3 18.8
2004 4 44.4 3 2 5 55.6
2001−2004 50 64.1 18 10 28 35.9
2005 7 87.5 1 0 1 12.5
2006 2 40.0 1 2 3 60.0
2007 0 0.0 0 0 0 0.0
2008 1 100.0 0 0 0 0.0
2005−2008 10 71.4 2 2 4 28.6
2009 3 100.0 0 0 0 0.0
2010 0 0.0 0 0 0 0.0
ADB = Asian Development Bank, ADF = Asian Development Fund, GS = generally successful, HS = highly successful, IED = Independent Evaluation Department, PCR = project completion report, PVR = project completion report validation, PEIS = postevaluation information system, PPER = project/program performance evaluation report, PS = partly successful, S = successful, SES = special evaluation study, TA = technical assistance, US = unsuccessful.a For projects evaluated as of 31 December 2010. At the time of SES preparation, there were no PCRs, PVRs, nor PPERs available for ADF-funded grant
projects approved from 2005. Project ratings are based on the latest rating available, i.e., either from the PCR, PVR, or PPER.Sources: ADB database on Loan, TA, Grant and Equity Approvals, PEIS, IED website, IED database, PCRs, PVRs, PPERs.
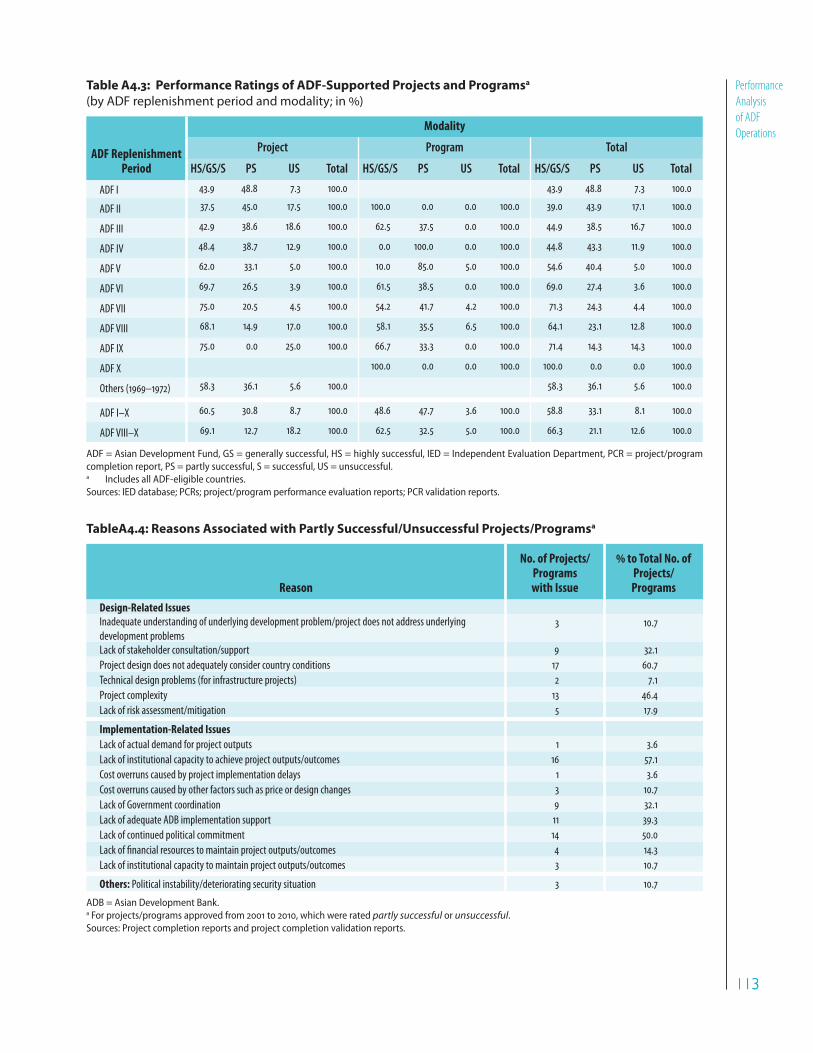
113113
Performance
Analysis
of ADF
Operations
Table A4.3: Performance Ratings of ADF-Supported Projects and Programsa
(by ADF replenishment period and modality; in )
ADF Replenishment Period
Modality
Project Program Total
HS/GS/S PS US Total HS/GS/S PS US Total HS/GS/S PS US Total
ADF I 43.9 48.8 7.3 100.0 43.9 48.8 7.3 100.0
ADF II 37.5 45.0 17.5 100.0 100.0 0.0 0.0 100.0 39.0 43.9 17.1 100.0
ADF III 42.9 38.6 18.6 100.0 62.5 37.5 0.0 100.0 44.9 38.5 16.7 100.0
ADF IV 48.4 38.7 12.9 100.0 0.0 100.0 0.0 100.0 44.8 43.3 11.9 100.0
ADF V 62.0 33.1 5.0 100.0 10.0 85.0 5.0 100.0 54.6 40.4 5.0 100.0
ADF VI 69.7 26.5 3.9 100.0 61.5 38.5 0.0 100.0 69.0 27.4 3.6 100.0
ADF VII 75.0 20.5 4.5 100.0 54.2 41.7 4.2 100.0 71.3 24.3 4.4 100.0
ADF VIII 68.1 14.9 17.0 100.0 58.1 35.5 6.5 100.0 64.1 23.1 12.8 100.0
ADF IX 75.0 0.0 25.0 100.0 66.7 33.3 0.0 100.0 71.4 14.3 14.3 100.0
ADF X 100.0 0.0 0.0 100.0 100.0 0.0 0.0 100.0
Others (1969–1972) 58.3 36.1 5.6 100.0 58.3 36.1 5.6 100.0
ADF I–X 60.5 30.8 8.7 100.0 48.6 47.7 3.6 100.0 58.8 33.1 8.1 100.0
ADF VIII–X 69.1 12.7 18.2 100.0 62.5 32.5 5.0 100.0 66.3 21.1 12.6 100.0
ADF = Asian Development Fund, GS = generally successful, HS = highly successful, IED = Independent Evaluation Department, PCR = project/program completion report, PS = partly successful, S = successful, US = unsuccessful. a Includes all ADF-eligible countries. Sources: IED database; PCRs; project/program performance evaluation reports; PCR validation reports.
TableA4.4: Reasons Associated with Partly Successful/Unsuccessful Projects/Programsa
Reason
No. of Projects/ Programs with Issue
to Total No. of Projects/ Programs
Design-Related Issues
Inadequate understanding of underlying development problem/project does not address underlying
development problems
3 10.7
Lack of stakeholder consultation/support 9 32.1
Project design does not adequately consider country conditions 17 60.7
Technical design problems (for infrastructure projects) 2 7.1
Project complexity 13 46.4
Lack of risk assessment/mitigation 5 17.9
Implementation-Related Issues
Lack of actual demand for project outputs 1 3.6
Lack of institutional capacity to achieve project outputs/outcomes 16 57.1
Cost overruns caused by project implementation delays 1 3.6
Cost overruns caused by other factors such as price or design changes 3 10.7
Lack of Government coordination 9 32.1
Lack of adequate ADB implementation support 11 39.3
Lack of continued political commitment 14 50.0
Lack of financial resources to maintain project outputs/outcomes 4 14.3
Lack of institutional capacity to maintain project outputs/outcomes 3 10.7
Others: Political instability/deteriorating security situation 3 10.7
ADB = Asian Development Bank.a For projects/programs approved from 2001 to 2010, which were rated partly successful or unsuccessful.Sources: Project completion reports and project completion validation reports.

114114
Appendix 4 Table A4.5: Assessment of 51 ADF-Supported Operations in Five Countries
Project Typea Statusb Countryc
Loan No. Project
Approval Date
Original Financial
Closing Date
L O BAN 1881 Post-Literacy and Continuing Education Project 13-Dec-01 31-Dec-08
L C BAN 1884 West Zone Power System Development Project 17-Dec-01 30-Sep-06
L O BAN 1885 West Zone Power System Development Project 17-Dec-01 30-Sep-06
L O BAN 1920 Road Network Improvement and Maintenance Project 10-Oct-02 31-Dec-07
L O BAN 1941 Jamuna-Meghna River Erosion Mitigation Project 25-Nov-02 30-Jun-09
L O BAN 1947 Urban Governance and Infrastructure Improvement (Sector) 28-Nov-02 31-Dec-09
L C BAN 2156 Emergency Flood Damage Rehabilitation 20-Jan-05 31-Jul-07
L O BAN 2172 Second Urban Primary Health Care 31-May-05 30-Jun-12
L O BAN 2190 Agribusiness Development 27-Oct-05 30-Jun-11
L O BAN 2265 Secondary Towns Water Supply and Sanitation Sector 16-Oct-06 30-Jun-11
L O BAN 2266 Secondary Education Sector Development Project 26-Oct-06 30-Jun-13
L C BAN 2267 Secondary Education Sector Development Program 26-Oct-06 30-Sep-09
L C LAO 1834 Vientiane Urban Infrastructure and Services Project 23-Aug-01 28-Feb-07
L O LAO 1933 Nam Ngum River Basin Development Sector 11-Nov-02 31-Mar-09
L C LAO 1970 GMS: Mekong Tourism Development (Regional) 12-Dec-02 30-Jun-08
L C LAO 1989 GMS: Northern Economic Corridor 20-Dec-02 30-Jun-07
L O LAO 2005 Northern Area Rural Power Distribution 18-Sep-03 30-Sep-08
L O LAO 2252 Rural Finance Sector Development Program 17-Aug-06 30-Sep-10
L O LAO 2253 Rural Finance Sector Development Program (Project Loan) 17-Aug-06 31-Mar-11
L O LAO 2259 Northern Region Sustainable Livelihoods through Livestock Development 29-Sep-06 31-Dec-12
L O LAO 2306 Basic Education Sector Development Program 20-Dec-06 30-Apr-10
G O LAO 0069 Basic Education Sector Development Program-Project Grant 20-Dec-06 30-Sep-12
G O LAO 0016 Northern and Central Regions Water Supply and Sanitation Sector 25-Aug-05 30-Sep-10
G O LAO 0026 GMS Regional Communicable Diseases Control (Regional) 21-Nov-05 30-Jun-10
L C NEP 1609 Community Groundwater Irrigation Sectorf 26-Feb-98 31-Jul-05
L C NEP 1755 Small Towns Water Supply and Sanitationf 12-Sep-00 31-Dec-06
L C NEP 1840 Teacher Education 24-Sep-01 30-Jun-08
L C NEP 1861 Governance Reform Program 27-Nov-01 31-Dec-05
L C NEP 1876 Road Network Development 13-Dec-01 31-Dec-07
L O NEP 1966 Urban and Environmental Improvement 10-Dec-02 31-Mar-10
L C NEP 2268 Rural Finance Sector Development Cluster Program (Subprogram I) 26-Oct-06 30-Jun-09
G O NEP 0059 Rural Finance Sector Development Cluster Program 26-Oct-06 30-Jun-09
L O NEP 2277 Education Sector Program I 1-Dec-06 31-Jan-10
G O NEP 0065 Education Sector Program I-Capacity Development Project 1-Dec-06 30-Jun-10
G O NEP 0051 Road Connectivity Sector I 10-Aug-06 30-Jun-13
G O NEP 0063 Commercial Agriculture Development 16-Nov-06 30-Jun-13
G O NEP 0093 Rural Reconstruction and Rehabilitation Sector Development Program (Project Grant) 12-Dec-07 30-Jun-12
G O NEP 0094 Rural Reconstruction and Rehabilitation Sector Development Program (Program Grant) 12-Dec-07 31-Dec-11
L C PAK 1854 North-West Frontier Province Urban Development Sector 8-Nov-01 30-Jun-08
L C PAK 1877 Agriculture Sector Program II 13-Dec-01 30-Jun-07
L C PAK 1878 Agriculture Sector Program II 13-Dec-01 30-Jun-07
L C PAK 1879 Agriculture Sector Program II (TA Loan) 13-Dec-01 31-Aug-05
L C PAK 1897 Access to Justice Program 20-Dec-01 30-Jun-05
L C PAK 1898 Access to Justice Program 20-Dec-01 30-Jun-05
L C PAK 1899 Access to Justice Program (TA Loan) 20-Dec-01 30-Jun-06
L C PAK 1900 Reproductive Health 20-Dec-01 30-Jun-08
L O PAK 2103 North-West Frontier Province Road Development Sector and Subregional Connectivity 18-Nov-04 31-Dec-10
L O PAK 2104 North-West Frontier Province Road Development Sector and Subregional Connectivity 18-Nov-04 31-Dec-10
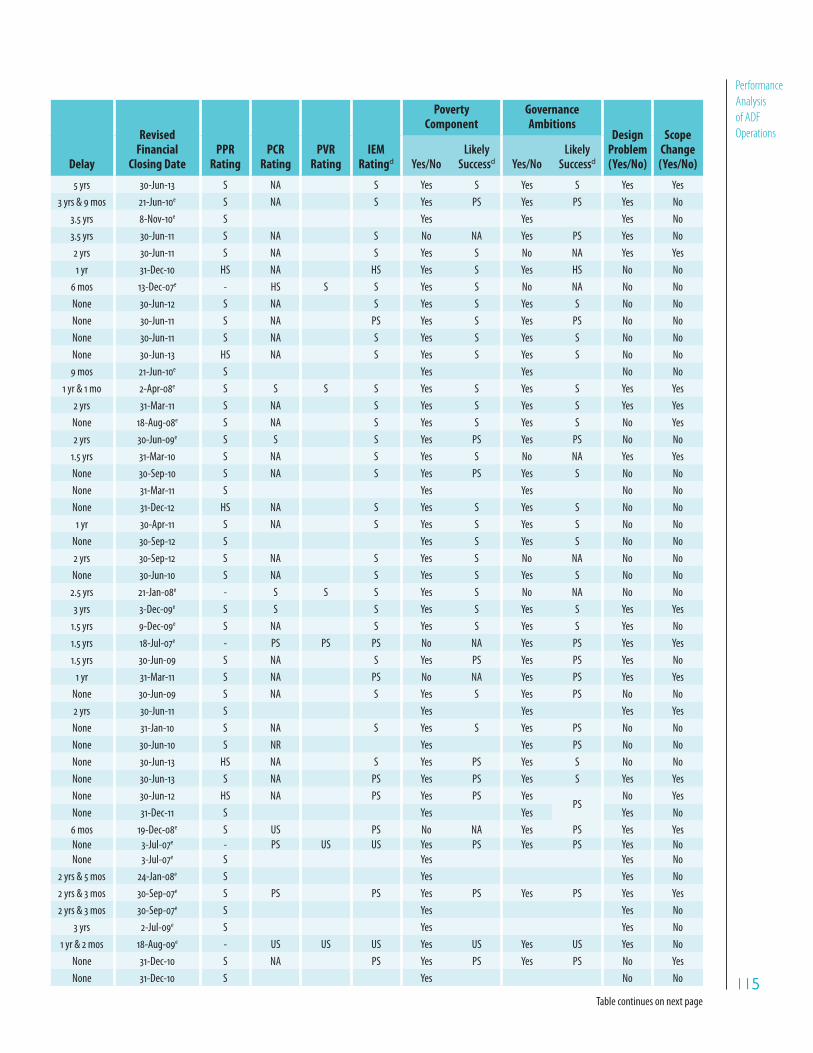
115115
Performance
Analysis
of ADF
Operations
Delay
Revised Financial
Closing DatePPR
RatingPCR
RatingPVR
RatingIEM
Ratingd
Poverty Component
Governance Ambitions
Design Problem (Yes/No)
Scope Change (Yes/No)Yes/No
Likely Successd Yes/No
Likely Successd
5 yrs 30-Jun-13 S NA S Yes S Yes S Yes Yes
3 yrs & 9 mos 21-Jun-10e S NA S Yes PS Yes PS Yes No
3.5 yrs 8-Nov-10e S Yes Yes Yes No
3.5 yrs 30-Jun-11 S NA S No NA Yes PS Yes No
2 yrs 30-Jun-11 S NA S Yes S No NA Yes Yes
1 yr 31-Dec-10 HS NA HS Yes S Yes HS No No
6 mos 13-Dec-07e - HS S S Yes S No NA No No
None 30-Jun-12 S NA S Yes S Yes S No No
None 30-Jun-11 S NA PS Yes S Yes PS No No
None 30-Jun-11 S NA S Yes S Yes S No No
None 30-Jun-13 HS NA S Yes S Yes S No No
9 mos 21-Jun-10e S Yes Yes No No
1 yr & 1 mo 2-Apr-08e S S S S Yes S Yes S Yes Yes
2 yrs 31-Mar-11 S NA S Yes S Yes S Yes Yes
None 18-Aug-08e S NA S Yes S Yes S No Yes
2 yrs 30-Jun-09e S S S Yes PS Yes PS No No
1.5 yrs 31-Mar-10 S NA S Yes S No NA Yes Yes
None 30-Sep-10 S NA S Yes PS Yes S No No
None 31-Mar-11 S Yes Yes No No
None 31-Dec-12 HS NA S Yes S Yes S No No
1 yr 30-Apr-11 S NA S Yes S Yes S No No
None 30-Sep-12 S Yes S Yes S No No
2 yrs 30-Sep-12 S NA S Yes S No NA No No
None 30-Jun-10 S NA S Yes S Yes S No No
2.5 yrs 21-Jan-08e - S S S Yes S No NA No No
3 yrs 3-Dec-09e S S S Yes S Yes S Yes Yes
1.5 yrs 9-Dec-09e S NA S Yes S Yes S Yes No
1.5 yrs 18-Jul-07e - PS PS PS No NA Yes PS Yes Yes
1.5 yrs 30-Jun-09 S NA S Yes PS Yes PS Yes No
1 yr 31-Mar-11 S NA PS No NA Yes PS Yes Yes
None 30-Jun-09 S NA S Yes S Yes PS No No
2 yrs 30-Jun-11 S Yes Yes Yes Yes
None 31-Jan-10 S NA S Yes S Yes PS No No
None 30-Jun-10 S NR Yes Yes PS No No
None 30-Jun-13 HS NA S Yes PS Yes S No No
None 30-Jun-13 S NA PS Yes PS Yes S Yes Yes
None 30-Jun-12 HS NA PS Yes PS YesPS
No Yes
None 31-Dec-11 S Yes Yes Yes No
6 mos 19-Dec-08e S US PS No NA Yes PS Yes Yes
None 3-Jul-07e - PS US US Yes PS Yes PS Yes No
None 3-Jul-07e S Yes Yes No
2 yrs & 5 mos 24-Jan-08e S Yes Yes No
2 yrs & 3 mos 30-Sep-07e S PS PS Yes PS Yes PS Yes Yes
2 yrs & 3 mos 30-Sep-07e S Yes Yes No
3 yrs 2-Jul-09e S Yes Yes No
1 yr & 2 mos 18-Aug-09e - US US US Yes US Yes US Yes No
None 31-Dec-10 S NA PS Yes PS Yes PS No Yes
None 31-Dec-10 S Yes No No
Table continues on next page

116116
Appendix 4
Project Typea Statusb Countryc
Loan No. Project
Approval Date
Original Financial
Closing Date
L O PAK 2171 Agribusiness Development 19-May-05 31-Mar-11
L C PAK 2212 Rawalpindi Environmental Improvement 13-Dec-05 31-Aug-09
L O PAK 2213 Earthquake Emergency Assistance 13-Dec-05 30-Jun-09
L O PAK 2287 Renewable Energy Development Sector Investment Program 13-Dec-06 30-Jun-12
L C PAK 2292 Improving Access to Financial Services (Phase I) Program 14-Dec-06 31-Mar-07
L O VIE 1855 Second Red River Basin Sector 13-Nov-01 30-Jun-08
L O VIE 1883 Central Region Livelihood Improvement 17-Dec-01 30-Sep-07
L O VIE 1888 Provincial Roads Improvement Sector 18-Dec-01 31-Dec-06
L O VIE 1979 Upper Secondary Education Development 17-Dec-02 31-Dec-09
L O VIE 1990 Housing Finance 20-Dec-02 30-Jun-08
L O VIE 2195 Central Region Transport Networks Improvement Sector 11-Nov-05 31-Dec-10
G O VIE 0022 Central Region Transport Networks Improvement Sector 11-Nov-05 31-Dec-10
L O VIE 2223 Central Water Resources Project 19-Dec-05 30-Jun-12
L O VIE 2272 Central Region Small and Medium Towns Development 17-Nov-06 30-Jun-12
L C VIE 2284 Small and Medium Enterprise Development Program - Subprogram II 12-Dec-06 1-Jul-08
G O VIE 0027 GMS Regional Communicable Diseases Control (Regional) 21-Nov-05 30-Jun-10
ADF = Asian Development Fund, GMS = Greater Mekong Subregion, HS = highly successful, IEM = Independent Evaluation Mission, NA = not applicable, PCR = project completion report, PVR = PCR validation report, PPR = project performance report, PS = partly successful, RRP = report and recommendation of the President, S = successful, TA = technical assistance, US = unsuccessful. a G = grant, L = loan. b C = completed, O = ongoing.c BAN = Bangladesh, LAO = Lao People’s Democratic Republic, NEP = Nepal, PAK = Pakistan, VIE = Viet Nam. d Performance assessment was based on PCRs or PVRs for completed projects, PPRs for ongoing ones, or IEM estimates. e Actual closing date. f These projects were approved before 2001. Sources: PCRs, RRPs and back-to-office reports of ongoing projects, and Project Information Documents. http://adbportal.asiandevbank.org/ and www.adb.org

117117
Performance
Analysis
of ADF
OperationsDelay
Revised Financial
Closing DatePPR
RatingPCR
RatingPVR
RatingIEM
Ratingd
Poverty Component
Governance Ambitions
Design Problem (Yes/No)
Scope Change (Yes/No)Yes/No
Likely Successd Yes/No
Likely Successd
None 31-Mar-11 S NA PS Yes PS Yes PS No No
4 mos 31-Dec-09e US NA US Yes US Yes US Yes Yes
2 yrs 30-Jun-11 S NA S Yes S Yes S Yes Yes
None 30-Jun-12 S NA S Yes S Yes S No No
None 12-Jan-07e - S PS PS Yes S Yes S No No
1.5 yrs 31-Dec-09 S NA S Yes S Yes PS Yes Yes
2 yrs & 7 mos 28-Apr-10e S S S Yes S Yes S Yes No
2.5 yrs 30-Jun-09 S NA S Yes PS Yes S Yes No
1.5 yrs 30-Jun-11 S NA S Yes S No NA No No
2 yrs & 2 mos 31-Aug-11 PS NA PS Yes PS Yes PS Yes Yes
1.5 yrs 30-Jun-12 S NA S Yes S Yes S No Yes
None 31-Dec-10 S Yes Yes No Yes
None 30-Jun-12 PS NA PS Yes S Yes S No No
None 30-Jun-12 PS NA PS Yes PS Yes PS No No
9 mos 31-Mar-09e - S S Yes S Yes S No No
None 30-Jun-10 S NR S Yes S Yes S No No

118118
Appendix 4 Table A4.6: Amount of ADF Support for Case Study Projects in Five Selected Countries
Item
No. of Coun-triesa
Total Amountb ( million) Share
BAN LAO NEP PAK VIE Total BAN LAO NEP PAK VIE Total
Sector
Agriculture and Natural Resources 5 84.67 30.80 148.00 381.00 187.39 831.86 9.7 16.7 31.5 27.6 34.7 24.1
Education 4 180.00 21.56 51.30 55.00 307.86 20.6 11.7 10.9 - 10.2 8.9
Energy 3 219.00 30.00 10.00 259.00 25.1 16.2 - 0.7 - 7.5
Finance 4 - 10.00 64.70 40.80 30.00 145.50 - 5.4 13.8 3.0 5.6 4.2
Health and Social Protection 4 62.00 6.00 - 36.00 15.00 119.00 7.1 3.2 - 2.6 2.8 3.5
Industry and Trade 2 - 10.90 - - 20.00 30.90 - 5.9 - - 3.7 0.9
Multisector 2 152.30 - - 220.00 - 372.30 17.4 - - 16.0 - 10.8
Public Sector Management 2 - - 30.00 350.00 - 380.00 - - 6.4 25.4 - 11.0
Transport and ICT 5 65.00 30.00 111.20 301.20 178.92 686.32 7.4 16.2 23.6 21.8 33.2 19.9
Water and Other Municipal
Infrastructure and Services
5 110.00 45.70 65.00 40.00 53.22 313.92 12.6 24.7 13.8 2.9 9.9 9.1
Targeting
Targeted Interventionc 5 309.80 25.00 277.90 728.20 172.01 1,512.91 35.5 13.5 59.1 52.8 31.9 43.9
General Intervention 4 451.17 85.90 160.30 370.80 225.00 1,293.17 51.7 46.4 34.1 26.9 41.7 37.5
Others 2 112.00 74.06 32.00 280.00 142.52 640.58 12.8 40.0 6.8 20.3 26.4 18.6
Safeguards
Environment Impactd
Significant adverse impact (A) 4 42.17 30.00 46.00 341.20 459.37 4.8 16.2 9.8 24.7 - 13.3
Some adverse impact (B) 5 608.30 117.40 278.20 600.80 419.53 2,024.23 69.7 63.5 59.2 43.6 77.8 58.7
No significant impact (C) 5 180.00 37.56 146.00 406.00 120.00 889.56 20.6 20.3 31.1 29.4 22.2 25.8
Involving credit line through a
financial intermediary (FI)
2 42.50 - - 31.00 73.50 4.9 - - 2.2 - 2.1
Involuntary Resettlement
Effectse
539.53
Significant (A) 5 344.00 65.90 211.20 341.20 376.44 1,338.74 39.4 35.6 44.9 24.7 69.8 38.8
Not significant (B) 4 306.47 50.70 30.00 230.00 617.17 35.1 27.4 6.4 16.7 - 17.9
None (C) 5 222.50 68.36 229.00 807.80 78.09 1,405.75 25.5 37.0 48.7 58.6 14.5 40.8
To be determined (A/B)f 1 - - - - 85.00 85.00 - - - - 15.8 2.5
Indigenous Peopleg
Yes 4 115.00 73.36 176.00 - 296.31 660.67 13.2 39.7 37.4 - 54.9 19.2
Limited 5 - 20.70 97.20 230.00 53.22 401.12 - 11.2 20.7 16.7 9.9 11.6
No 4 757.97 90.90 197.00 1,149.00 190.00 2,384.87 86.8 49.1 41.9 83.3 35.2 69.2
Total 5 872.97 184.96 470.20 1,379.00 539.53 3,446.66 100.0 100.0 100.0 100.0 100.0 100.0
ADF = Asian Development Fund, BAN = Bangladesh, ICT = information and communication technology, LAO = Lao People’s Democratic Republic, NEP = Nepal, PAK = Pakistan, PCR = project completion report, RRP = report and recommendation of the President, VIE = Viet Nam.a Covers five countries: Bangladesh, Lao PDR, Nepal, Pakistan, and Viet Nam.b Total amount includes ordinary capital resources funding component of ADF projects amounting to $903.10 million (26% of total) and cofinancing for
7 projects amounting to $102.22 million (3% of total).c Targeted intervention includes projects classified as core poverty intervention and poverty intervention. d Environment classification is as follows: Category A = operations have significant adverse environmental impacts; Category B= operations have some
adverse environmental impacts; Category C = project has no significant environmental impact; FI = project involves a credit line through a financial intermediary (FI); FI must apply an environmental management system, unless all subprojects will result in insignificant impacts.
e Involuntary resettlement classification is as follows: A = significant, requires a full resettlement plan; B = not significant, requires a short resettlement plan; A/B = to be determined; and C = no involuntary resettlement effects are foreseen.
f Viet Nam has two projects with resettlement classification to be determined.g Significance of impacts on indigenous peoples is classified as follows: Category A = has significant impacts that require indigenous people’s plan and/
or indigenous people’s planning framework; Category B = has limited impacts; and Category C = no expected impacts.Sources: PCRs, RRPs, and back-to-office reports of ongoing projects; and project information documents, available at http://adbportal.asiandevbank.org/ and www.adb.org.
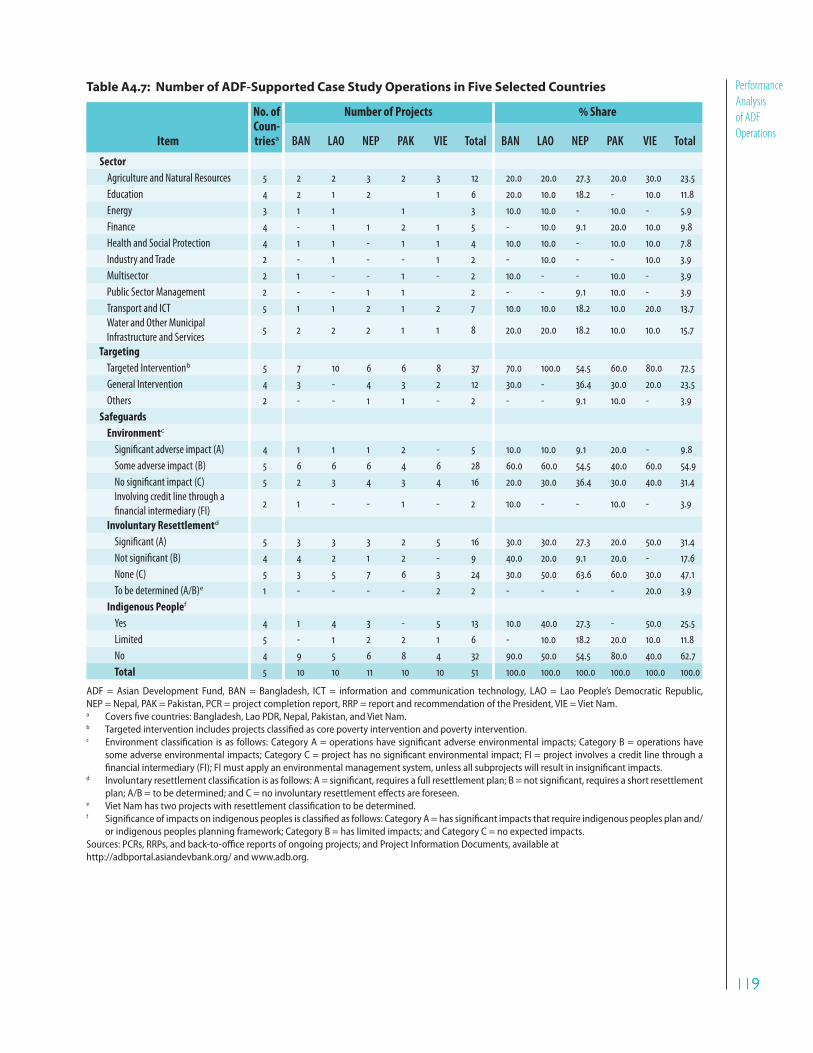
119119
Performance
Analysis
of ADF
Operations
Table A4.7: Number of ADF-Supported Case Study Operations in Five Selected Countries
Item
No. of Coun-triesa
Number of Projects Share
BAN LAO NEP PAK VIE Total BAN LAO NEP PAK VIE Total
Sector
Agriculture and Natural Resources 5 2 2 3 2 3 12 20.0 20.0 27.3 20.0 30.0 23.5
Education 4 2 1 2 1 6 20.0 10.0 18.2 - 10.0 11.8
Energy 3 1 1 1 3 10.0 10.0 - 10.0 - 5.9
Finance 4 - 1 1 2 1 5 - 10.0 9.1 20.0 10.0 9.8
Health and Social Protection 4 1 1 - 1 1 4 10.0 10.0 - 10.0 10.0 7.8
Industry and Trade 2 - 1 - - 1 2 - 10.0 - - 10.0 3.9
Multisector 2 1 - - 1 - 2 10.0 - - 10.0 - 3.9
Public Sector Management 2 - - 1 1 2 - - 9.1 10.0 - 3.9
Transport and ICT 5 1 1 2 1 2 7 10.0 10.0 18.2 10.0 20.0 13.7
Water and Other Municipal
Infrastructure and Services5 2 2 2 1 1 8 20.0 20.0 18.2 10.0 10.0 15.7
Targeting
Targeted Interventionb 5 7 10 6 6 8 37 70.0 100.0 54.5 60.0 80.0 72.5
General Intervention 4 3 - 4 3 2 12 30.0 - 36.4 30.0 20.0 23.5
Others 2 - - 1 1 - 2 - - 9.1 10.0 - 3.9
Safeguards
Environmentc
Significant adverse impact (A) 4 1 1 1 2 - 5 10.0 10.0 9.1 20.0 - 9.8
Some adverse impact (B) 5 6 6 6 4 6 28 60.0 60.0 54.5 40.0 60.0 54.9
No significant impact (C) 5 2 3 4 3 4 16 20.0 30.0 36.4 30.0 40.0 31.4
Involving credit line through a
financial intermediary (FI)2 1 - - 1 - 2 10.0 - - 10.0 - 3.9
Involuntary Resettlementd
Significant (A) 5 3 3 3 2 5 16 30.0 30.0 27.3 20.0 50.0 31.4
Not significant (B) 4 4 2 1 2 - 9 40.0 20.0 9.1 20.0 - 17.6
None (C) 5 3 5 7 6 3 24 30.0 50.0 63.6 60.0 30.0 47.1
To be determined (A/B)e 1 - - - - 2 2 - - - - 20.0 3.9
Indigenous Peoplef
Yes 4 1 4 3 - 5 13 10.0 40.0 27.3 - 50.0 25.5
Limited 5 - 1 2 2 1 6 - 10.0 18.2 20.0 10.0 11.8
No 4 9 5 6 8 4 32 90.0 50.0 54.5 80.0 40.0 62.7
Total 5 10 10 11 10 10 51 100.0 100.0 100.0 100.0 100.0 100.0
ADF = Asian Development Fund, BAN = Bangladesh, ICT = information and communication technology, LAO = Lao People’s Democratic Republic, NEP = Nepal, PAK = Pakistan, PCR = project completion report, RRP = report and recommendation of the President, VIE = Viet Nam.a Covers five countries: Bangladesh, Lao PDR, Nepal, Pakistan, and Viet Nam.b Targeted intervention includes projects classified as core poverty intervention and poverty intervention. c Environment classification is as follows: Category A = operations have significant adverse environmental impacts; Category B = operations have
some adverse environmental impacts; Category C = project has no significant environmental impact; FI = project involves a credit line through a financial intermediary (FI); FI must apply an environmental management system, unless all subprojects will result in insignificant impacts.
d Involuntary resettlement classification is as follows: A = significant, requires a full resettlement plan; B = not significant, requires a short resettlement plan; A/B = to be determined; and C = no involuntary resettlement effects are foreseen.
e Viet Nam has two projects with resettlement classification to be determined.f Significance of impacts on indigenous peoples is classified as follows: Category A = has significant impacts that require indigenous peoples plan and/
or indigenous peoples planning framework; Category B = has limited impacts; and Category C = no expected impacts.Sources: PCRs, RRPs, and back-to-office reports of ongoing projects; and Project Information Documents, available at http://adbportal.asiandevbank.org/ and www.adb.org.
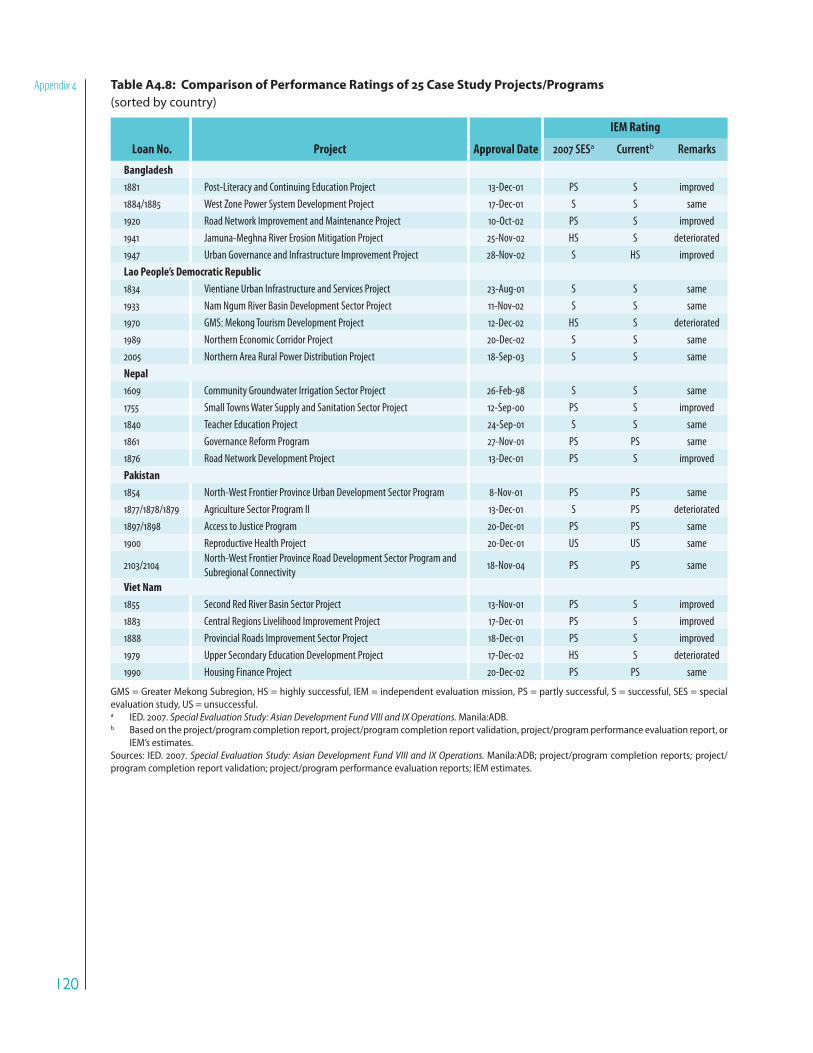
120120
Appendix 4 Table A4.8: Comparison of Performance Ratings of 25 Case Study Projects/Programs
(sorted by country)
Loan No. Project Approval Date
IEM Rating
2007 SESa Currentb Remarks
Bangladesh
1881 Post-Literacy and Continuing Education Project 13-Dec-01 PS S improved
1884/1885 West Zone Power System Development Project 17-Dec-01 S S same
1920 Road Network Improvement and Maintenance Project 10-Oct-02 PS S improved
1941 Jamuna-Meghna River Erosion Mitigation Project 25-Nov-02 HS S deteriorated
1947 Urban Governance and Infrastructure Improvement Project 28-Nov-02 S HS improved
Lao People’s Democratic Republic
1834 Vientiane Urban Infrastructure and Services Project 23-Aug-01 S S same
1933 Nam Ngum River Basin Development Sector Project 11-Nov-02 S S same
1970 GMS: Mekong Tourism Development Project 12-Dec-02 HS S deteriorated
1989 Northern Economic Corridor Project 20-Dec-02 S S same
2005 Northern Area Rural Power Distribution Project 18-Sep-03 S S same
Nepal
1609 Community Groundwater Irrigation Sector Project 26-Feb-98 S S same
1755 Small Towns Water Supply and Sanitation Sector Project 12-Sep-00 PS S improved
1840 Teacher Education Project 24-Sep-01 S S same
1861 Governance Reform Program 27-Nov-01 PS PS same
1876 Road Network Development Project 13-Dec-01 PS S improved
Pakistan
1854 North-West Frontier Province Urban Development Sector Program 8-Nov-01 PS PS same
1877/1878/1879 Agriculture Sector Program II 13-Dec-01 S PS deteriorated
1897/1898 Access to Justice Program 20-Dec-01 PS PS same
1900 Reproductive Health Project 20-Dec-01 US US same
2103/2104North-West Frontier Province Road Development Sector Program and
Subregional Connectivity18-Nov-04 PS PS same
Viet Nam
1855 Second Red River Basin Sector Project 13-Nov-01 PS S improved
1883 Central Regions Livelihood Improvement Project 17-Dec-01 PS S improved
1888 Provincial Roads Improvement Sector Project 18-Dec-01 PS S improved
1979 Upper Secondary Education Development Project 17-Dec-02 HS S deteriorated
1990 Housing Finance Project 20-Dec-02 PS PS same
GMS = Greater Mekong Subregion, HS = highly successful, IEM = independent evaluation mission, PS = partly successful, S = successful, SES = special evaluation study, US = unsuccessful.a IED. 2007. Special Evaluation Study: Asian Development Fund VIII and IX Operations. Manila:ADB.b Based on the project/program completion report, project/program completion report validation, project/program performance evaluation report, or
IEM’s estimates.Sources: IED. 2007. Special Evaluation Study: Asian Development Fund VIII and IX Operations. Manila:ADB; project/program completion reports; project/program completion report validation; project/program performance evaluation reports; IEM estimates.

121121
Performance
Analysis
of ADF
Operations
Table A4.9: Comparison of Performance Ratings of 25 Case Study Projects/Programs
(sorted based on change in performance rating)
Loan No. Country Project Approval Date
IEM Rating
2007 SESa Currentb Remark
1941 BAN Jamuna-Meghna River Erosion Mitigation Project 25-Nov-02 HS S deteriorated
1970 LAO GMS: Mekong Tourism Development Project 12-Dec-02 HS S deteriorated
1877/1878/1879 PAK Agriculture Sector Program II 13-Dec-01 S PS deteriorated
1979 VIE Upper Secondary Education Development Project 17-Dec-02 HS S deteriorated
1881 BAN Post-Literacy and Continuing Education Project 13-Dec-01 PS S improved
1920 BAN Road Network Improvement and Maintenance Project 10-Oct-02 PS S improved
1947 BAN Urban Governance and Infrastructure Improvement Project 28-Nov-02 S HS improved
1755 NEP Small Towns Water Supply and Sanitation Sector Project 12-Sep-00 PS S improved
1876 NEP Road Network Development Project 13-Dec-01 PS S improved
1855 VIE Second Red River Basin Sector Project 13-Nov-01 PS S improved
1883 VIE Central Regions Livelihood Improvement Project 17-Dec-01 PS S improved
1888 VIE Provincial Roads Improvement Sector Project 18-Dec-01 PS S improved
1884/1885 BAN West Zone Power System Development Project 17-Dec-01 S S same
1834 LAO Vientiane Urban Infrastructure and Services Project 23-Aug-01 S S same
1933 LAO Nam Ngum River Basin Development Sector Project 11-Nov-02 S S same
1989 LAO Northern Economic Corridor Project 20-Dec-02 S S same
2005 LAO Northern Area Rural Power Distribution Project 18-Sep-03 S S same
1609 NEP Community Groundwater Irrigation Sector Project 26-Feb-98 S S same
1840 NEP Teacher Education Project 24-Sep-01 S S same
1861 NEP Governance Reform Program 27-Nov-01 PS PS same
1854 PAKNorth-West Frontier Province Urban Development Sector
Program8-Nov-01 PS PS same
1897/1898 PAK Access to Justice Program 20-Dec-01 PS PS same
1900 PAK Reproductive Health Project 20-Dec-01 US US same
2103/2104 PAKNorth-West Frontier Province Road Development Sector
Program and Subregional Connectivity18-Nov-04 PS PS same
1990 VIE Housing Finance Project 20-Dec-02 PS PS same
BAN = Bangladesh, GMS = Greater Mekong Subregion, HS = highly successful, IEM = independent evaluation mission, LAO = Lao People’s Democratic Republic, NEP = Nepal, PAK = Pakistan, PS = partly successful, S = successful, SES = Special Evaluation Study, US = unsuccessful, VIE = Viet Nam.a IED. 2007. Special Evaluation Study: Asian Development Fund VIII and IX Operations. Manila:ADB.b Based on the project/program completion report, project/program completion report validation, project/program performance evaluation report or
IEM’s estimates.Sources: IED. 2007. Special Evaluation Study: Asian Development Fund VIII and IX Operations. Manila:ADB; project/program completion reports; project/program completion report validation; project/program performance evaluation reports; IEM estimates.
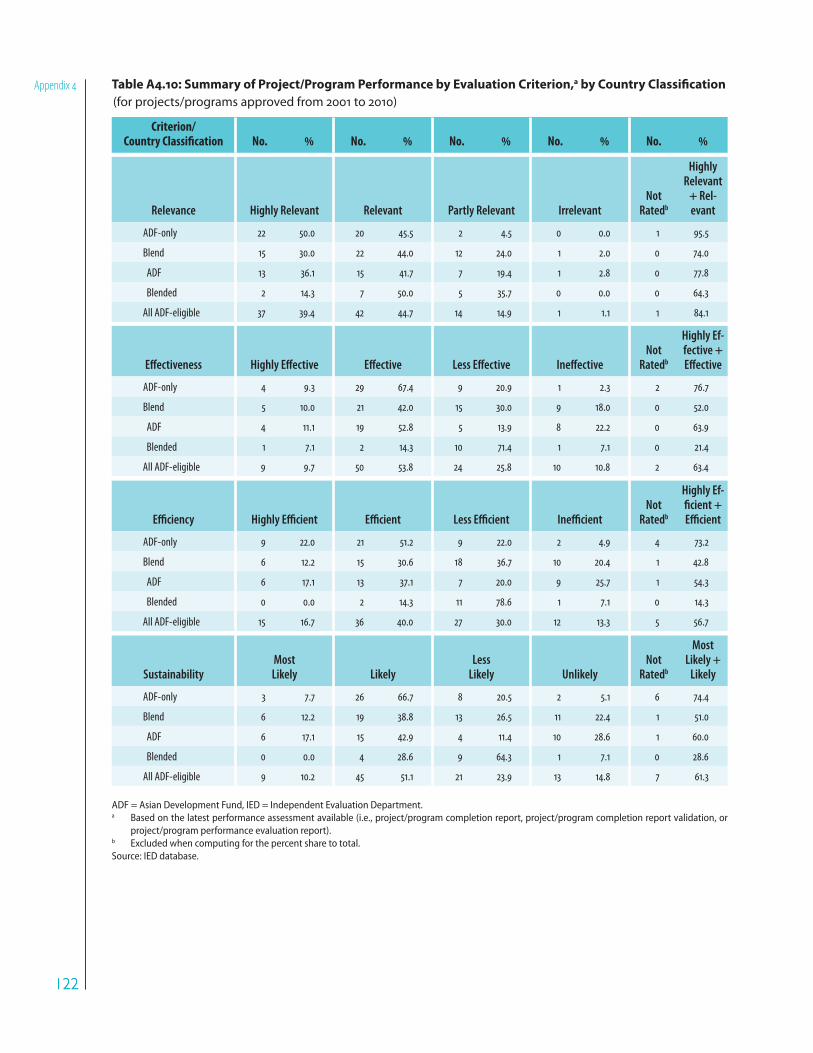
122122
Appendix 4 Table A4.10: Summary of Project/Program Performance by Evaluation Criterion,a by Country Classification (for projects/programs approved from 2001 to 2010)
Criterion/Country Classification No. No. No. No. No.
Relevance Highly Relevant Relevant Partly Relevant IrrelevantNot
Ratedb
Highly Relevant
+ Rel-evant
ADF-only 22 50.0 20 45.5 2 4.5 0 0.0 1 95.5
Blend 15 30.0 22 44.0 12 24.0 1 2.0 0 74.0
ADF 13 36.1 15 41.7 7 19.4 1 2.8 0 77.8
Blended 2 14.3 7 50.0 5 35.7 0 0.0 0 64.3
All ADF-eligible 37 39.4 42 44.7 14 14.9 1 1.1 1 84.1
Effectiveness Highly Effective Effective Less Effective IneffectiveNot
Ratedb
Highly Ef-fective + Effective
ADF-only 4 9.3 29 67.4 9 20.9 1 2.3 2 76.7
Blend 5 10.0 21 42.0 15 30.0 9 18.0 0 52.0
ADF 4 11.1 19 52.8 5 13.9 8 22.2 0 63.9
Blended 1 7.1 2 14.3 10 71.4 1 7.1 0 21.4
All ADF-eligible 9 9.7 50 53.8 24 25.8 10 10.8 2 63.4
Efficiency Highly Efficient Efficient Less Efficient InefficientNot
Ratedb
Highly Ef-ficient + Efficient
ADF-only 9 22.0 21 51.2 9 22.0 2 4.9 4 73.2
Blend 6 12.2 15 30.6 18 36.7 10 20.4 1 42.8
ADF 6 17.1 13 37.1 7 20.0 9 25.7 1 54.3
Blended 0 0.0 2 14.3 11 78.6 1 7.1 0 14.3
All ADF-eligible 15 16.7 36 40.0 27 30.0 12 13.3 5 56.7
SustainabilityMost Likely Likely
Less Likely Unlikely
Not Ratedb
Most Likely +
Likely
ADF-only 3 7.7 26 66.7 8 20.5 2 5.1 6 74.4
Blend 6 12.2 19 38.8 13 26.5 11 22.4 1 51.0
ADF 6 17.1 15 42.9 4 11.4 10 28.6 1 60.0
Blended 0 0.0 4 28.6 9 64.3 1 7.1 0 28.6
All ADF-eligible 9 10.2 45 51.1 21 23.9 13 14.8 7 61.3
ADF = Asian Development Fund, IED = Independent Evaluation Department. a Based on the latest performance assessment available (i.e., project/program completion report, project/program completion report validation, or
project/program performance evaluation report).b Excluded when computing for the percent share to total. Source: IED database.
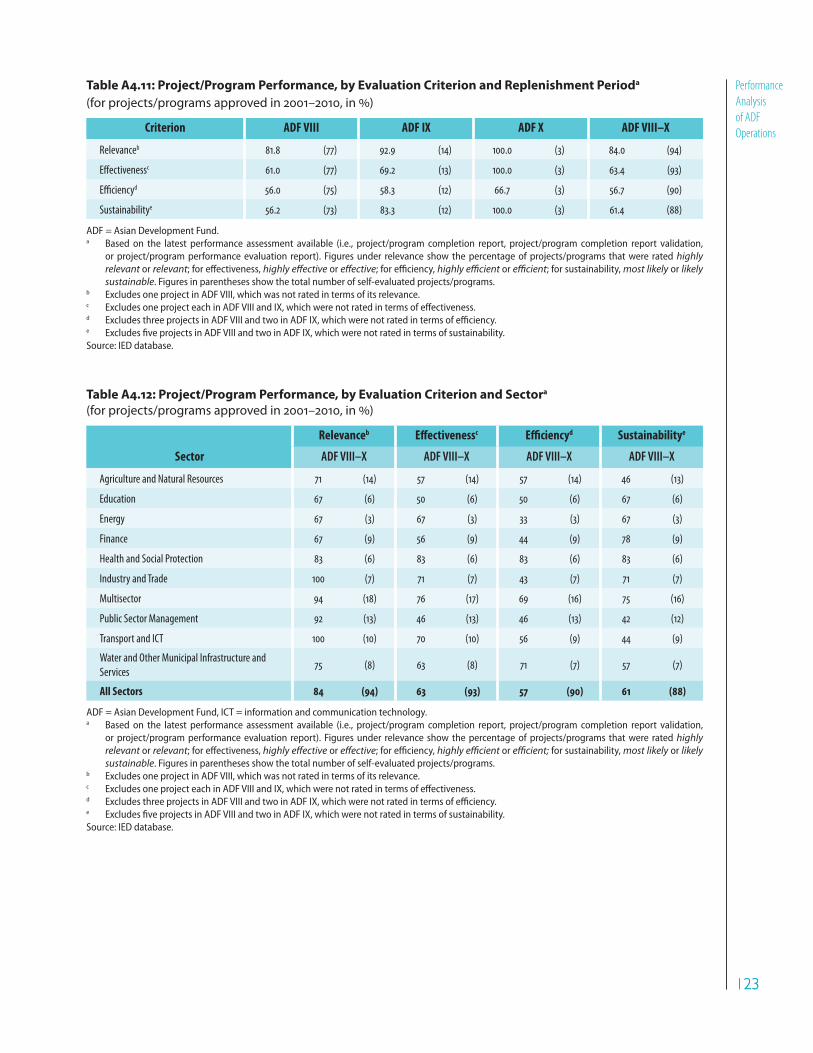
123123
Performance
Analysis
of ADF
Operations
Table A4.11: Project/Program Performance, by Evaluation Criterion and Replenishment Perioda
(for projects/programs approved in 2001–2010, in )
Criterion ADF VIII ADF IX ADF X ADF VIII–X
Relevanceb 81.8 (77) 92.9 (14) 100.0 (3) 84.0 (94)
Effectivenessc 61.0 (77) 69.2 (13) 100.0 (3) 63.4 (93)
Efficiencyd 56.0 (75) 58.3 (12) 66.7 (3) 56.7 (90)
Sustainabilitye 56.2 (73) 83.3 (12) 100.0 (3) 61.4 (88)
ADF = Asian Development Fund.a Based on the latest performance assessment available (i.e., project/program completion report, project/program completion report validation,
or project/program performance evaluation report). Figures under relevance show the percentage of projects/programs that were rated highly relevant or relevant; for effectiveness, highly effective or effective; for efficiency, highly efficient or efficient; for sustainability, most likely or likely sustainable. Figures in parentheses show the total number of self-evaluated projects/programs.
b Excludes one project in ADF VIII, which was not rated in terms of its relevance.c Excludes one project each in ADF VIII and IX, which were not rated in terms of effectiveness.d Excludes three projects in ADF VIII and two in ADF IX, which were not rated in terms of efficiency.e Excludes five projects in ADF VIII and two in ADF IX, which were not rated in terms of sustainability.Source: IED database.
Table A4.12: Project/Program Performance, by Evaluation Criterion and Sectora
(for projects/programs approved in 2001–2010, in )
Sector
Relevanceb Effectivenessc Efficiencyd Sustainabilitye
ADF VIII–X ADF VIII–X ADF VIII–X ADF VIII–X
Agriculture and Natural Resources 71 (14) 57 (14) 57 (14) 46 (13)
Education 67 (6) 50 (6) 50 (6) 67 (6)
Energy 67 (3) 67 (3) 33 (3) 67 (3)
Finance 67 (9) 56 (9) 44 (9) 78 (9)
Health and Social Protection 83 (6) 83 (6) 83 (6) 83 (6)
Industry and Trade 100 (7) 71 (7) 43 (7) 71 (7)
Multisector 94 (18) 76 (17) 69 (16) 75 (16)
Public Sector Management 92 (13) 46 (13) 46 (13) 42 (12)
Transport and ICT 100 (10) 70 (10) 56 (9) 44 (9)
Water and Other Municipal Infrastructure and
Services75 (8) 63 (8) 71 (7) 57 (7)
All Sectors 84 (94) 63 (93) 57 (90) 61 (88)
ADF = Asian Development Fund, ICT = information and communication technology.a Based on the latest performance assessment available (i.e., project/program completion report, project/program completion report validation,
or project/program performance evaluation report). Figures under relevance show the percentage of projects/programs that were rated highly relevant or relevant; for effectiveness, highly effective or effective; for efficiency, highly efficient or efficient; for sustainability, most likely or likely sustainable. Figures in parentheses show the total number of self-evaluated projects/programs.
b Excludes one project in ADF VIII, which was not rated in terms of its relevance.c Excludes one project each in ADF VIII and IX, which were not rated in terms of effectiveness.d Excludes three projects in ADF VIII and two in ADF IX, which were not rated in terms of efficiency.e Excludes five projects in ADF VIII and two in ADF IX, which were not rated in terms of sustainability.Source: IED database.

124124
Appendix 4 Table A4.13: Selected Problems Encountered by ADF Case Study Projects
Item
Number Total
BAN LAO NEP PAK VIE Number
Delay in Loan Closing
None 4 4 5 5 3 21 41.2
Less than a yeara 1 0 0 2 1 4 7.8
One year to less than 2 yearsb 1 3 4 1 3 12 23.5
Two years to less than 3 years 1 3 1 2 3 10 19.6
Three years and overc 3 0 1 0 0 4 7.8
Total 10 10 11 10 10 51 100.0
Design Problem
None 6 7 5 4 6 28 54.9
With design problem 4 3 6 6 4 23 45.1
Total 10 10 11 10 10 51 100.0
Change in Scope
None 8 6 6 5 7 32 62.7
With change in scope 2 4 5 5 3 19 37.3
Total 10 10 11 10 10 51 100.0
ADF = Asian Development Fund, BAN = Bangladesh, LAO = Lao People’s Democratic Republic, NEP = Nepal, PAK = Pakistan, PCR = program/project completion report, PPR = program/project performance report, VIE = Viet Nam.a 4–9 months. b 1 year–year and 6 months.c 3 years–4 years and 6 months.Sources: PPRs and PCRs, available at http://adbportal.asiandevbank.org/ and www.adb.org.
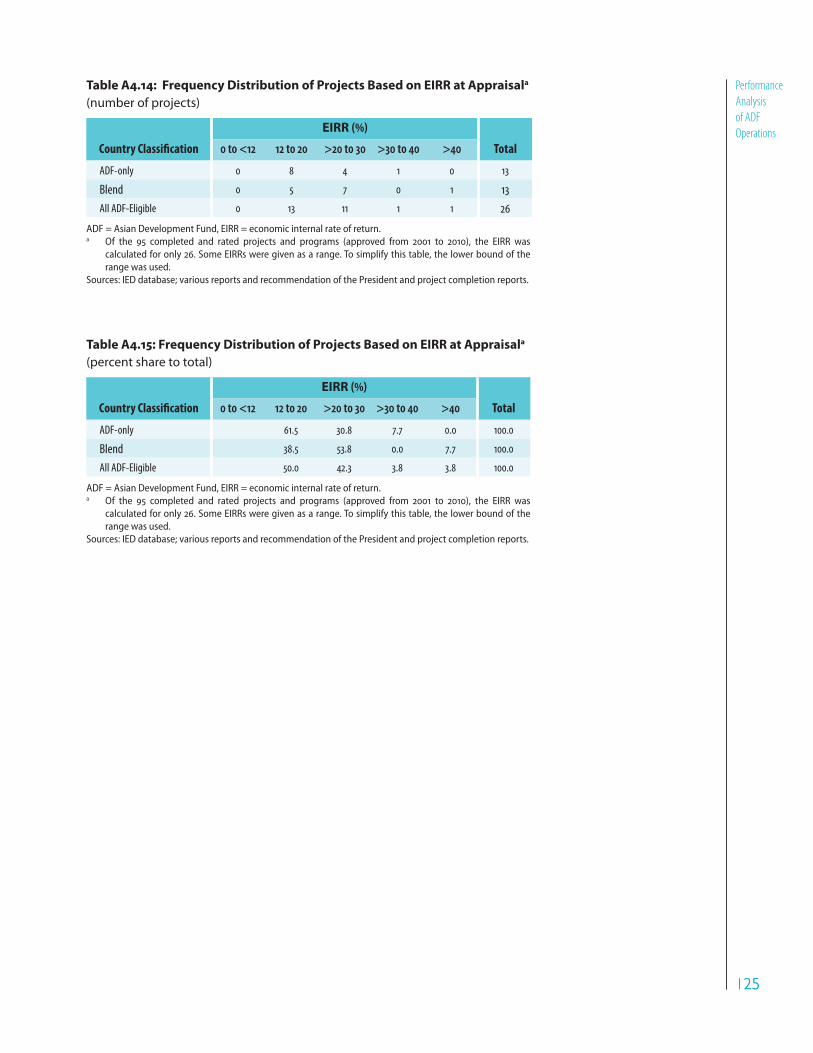
125125
Performance
Analysis
of ADF
Operations
Table A4.14: Frequency Distribution of Projects Based on EIRR at Appraisala
(number of projects)
Country Classification
EIRR ()
Total0 to <12 12 to 20 >20 to 30 >30 to 40 >40
ADF-only 0 8 4 1 0 13
Blend 0 5 7 0 1 13
All ADF-Eligible 0 13 11 1 1 26
ADF = Asian Development Fund, EIRR = economic internal rate of return. a Of the 95 completed and rated projects and programs (approved from 2001 to 2010), the EIRR was
calculated for only 26. Some EIRRs were given as a range. To simplify this table, the lower bound of the range was used.
Sources: IED database; various reports and recommendation of the President and project completion reports.
Table A4.15: Frequency Distribution of Projects Based on EIRR at Appraisala
(percent share to total)
Country Classification
EIRR ()
Total0 to <12 12 to 20 >20 to 30 >30 to 40 >40
ADF-only 61.5 30.8 7.7 0.0 100.0
Blend 38.5 53.8 0.0 7.7 100.0
All ADF-Eligible 50.0 42.3 3.8 3.8 100.0
ADF = Asian Development Fund, EIRR = economic internal rate of return. a Of the 95 completed and rated projects and programs (approved from 2001 to 2010), the EIRR was
calculated for only 26. Some EIRRs were given as a range. To simplify this table, the lower bound of the range was used.
Sources: IED database; various reports and recommendation of the President and project completion reports.

126126
Appendix 4 Table A4.16: Frequency Distribution of Projects Based on EIRR at Completiona
(number of projects)
Country Classification
EIRR ()
Total0 to <12 12 to 20 >20 to 30 >30 to 40 >40
ADF-only 1 4 4 2 0 11
Blend 2 4 3 2 1 12
All ADF-Eligible 3 8 7 4 1 23
ADF = Asian Development Fund, EIRR = economic internal rate of return. a Of the 95 completed and rated projects and programs (approved from 2001 to 2010), the EIRR was
calculated for only 23. Some EIRRs were given as a range. To simplify this table, the lower bound of the range was used.
Sources: IED database; various reports and recommendation of the President and project completion reports.
Table A4.17: Frequency Distribution of Projects Based on EIRR at Completiona
(percent share to total)
Country Classification
EIRR ()
Total0 to <12 12 to 20 >20 to 30 >30 to 40 >40
ADF-only 9.1 36.4 36.4 18.2 0.0 100.0
Blend 16.7 33.3 25.0 16.7 8.3 100.0
All ADF-Eligible 13.0 34.8 30.4 17.4 4.3 100.0
ADF = Asian Development Fund, EIRR = economic internal rate of return. a Of the 95 completed and rated projects and programs (approved from 2001 to 2010), the EIRR was
calculated for only 23. Some EIRRs were given as a range. To simplify this table, the lower bound of the range was used.
Sources of basic data: IED database; various reports and recommendation of the President and project completion reports.
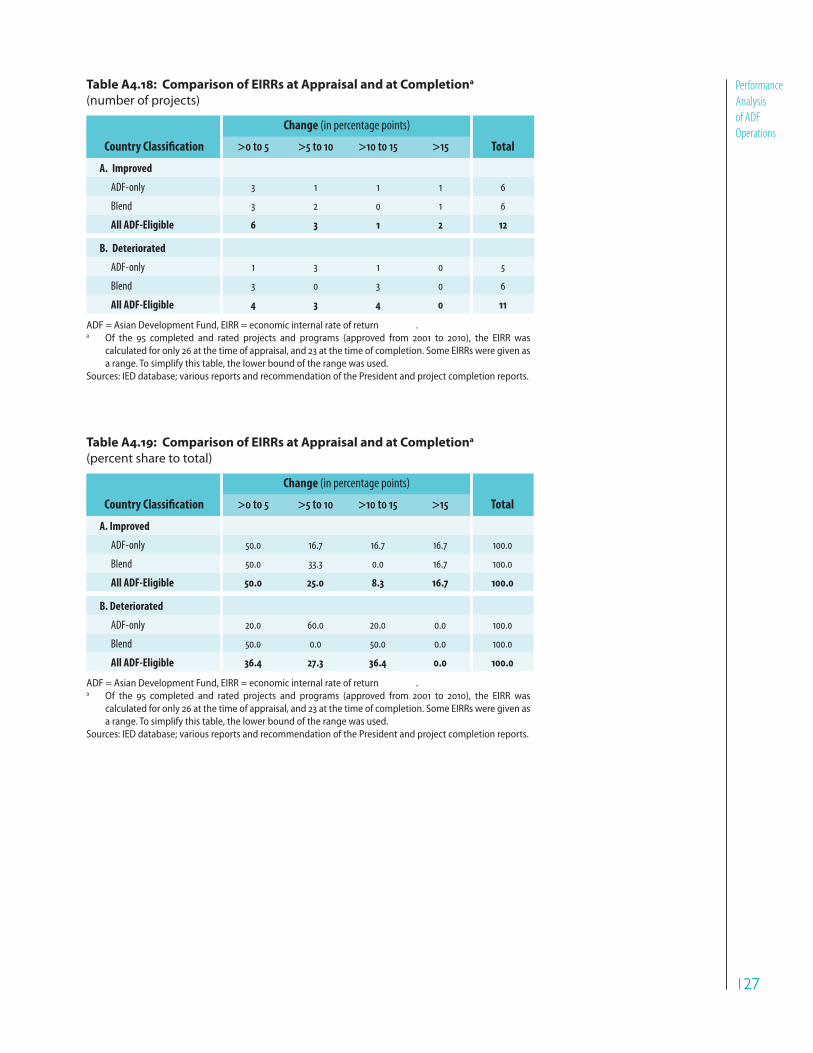
127127
Performance
Analysis
of ADF
Operations
Table A4.18: Comparison of EIRRs at Appraisal and at Completiona
(number of projects)
Country Classification
Change (in percentage points)
Total>0 to 5 >5 to 10 >10 to 15 >15
A. Improved
ADF-only 3 1 1 1 6
Blend 3 2 0 1 6
All ADF-Eligible 6 3 1 2 12
B. Deteriorated
ADF-only 1 3 1 0 5
Blend 3 0 3 0 6
All ADF-Eligible 4 3 4 0 11
ADF = Asian Development Fund, EIRR = economic internal rate of return .a Of the 95 completed and rated projects and programs (approved from 2001 to 2010), the EIRR was
calculated for only 26 at the time of appraisal, and 23 at the time of completion. Some EIRRs were given as a range. To simplify this table, the lower bound of the range was used.
Sources: IED database; various reports and recommendation of the President and project completion reports.
Table A4.19: Comparison of EIRRs at Appraisal and at Completiona
(percent share to total)
Country Classification
Change (in percentage points)
Total>0 to 5 >5 to 10 >10 to 15 >15
A. Improved
ADF-only 50.0 16.7 16.7 16.7 100.0
Blend 50.0 33.3 0.0 16.7 100.0
All ADF-Eligible 50.0 25.0 8.3 16.7 100.0
B. Deteriorated
ADF-only 20.0 60.0 20.0 0.0 100.0
Blend 50.0 0.0 50.0 0.0 100.0
All ADF-Eligible 36.4 27.3 36.4 0.0 100.0
ADF = Asian Development Fund, EIRR = economic internal rate of return .a Of the 95 completed and rated projects and programs (approved from 2001 to 2010), the EIRR was
calculated for only 26 at the time of appraisal, and 23 at the time of completion. Some EIRRs were given as a range. To simplify this table, the lower bound of the range was used.
Sources: IED database; various reports and recommendation of the President and project completion reports.

128128
Appendix 4 Table A4.20: Start-Upa Times for ADF Loans, by Country Classification
Country Classificationb/Country
ADF VIII (2001–2004) ADF IX (2005–2008)
No.c million AppSgn Sgn Eff App Eff No.c million
A. ADF-Onlyd 90 47.1 1,902.3 33.9 103.5 115.1 218.5 45 29.4 869.0
Afghanistan 6 3.1 487.2 8.7 58.2 65.8 124.0 5 3.3 235.0
Bhutan 2 1.0 16.4 0.3 68.0 97.5 165.5 5 3.3 93.9
Cambodia 18 9.4 355.0 6.3 124.3 84.3 208.6 10 6.5 152.9
Kyrgyz Republic 7 3.7 145.8 2.6 84.4 121.7 206.1 2 1.3 30.5
Lao PDR 13 6.8 225.6 4.0 76.3 138.5 214.8 4 2.6 28.2
Maldives 3 1.6 23.5 0.4 138.7 90.3 229.0 4 2.6 20.6
Mongolia 10 5.2 136.4 2.4 77.4 100.8 178.2 4 2.6 56.2
Nepal 15 7.9 359.3 6.4 159.9 181.3 341.2 2 1.3 86.0
Samoa 2 1.0 14.0 0.2 160.0 136.0 296.0 3 2.0 37.5
Tajikistan 11 5.8 125.3 2.2 96.4 96.5 192.8 6 3.9 128.2
Tonga 1 0.5 10.0 0.2 1.0 13.0 14.0 0 - -
Tuvalu 2 1.0 3.8 0.1 19.0 125.5 144.5 0 - -
B. Blende 101 52.9 3,705.3 66.1 88.8 162.5 251.3 107 69.9 5,365.7
Armenia 0 - - - - - - 3 2.0 83.9
Azerbaijan 2 1.0 42.0 0.7 286.5 235.5 522.0 2 1.3 13.0
Bangladesh 16 8.4 873.7 15.6 63.3 169.5 232.8 23 15.0 1,480.6
Cook Islandsf 1 0.5 2.2 0.0 69.0 31.0 100.0 2 1.3 9.7
Georgia 0 - - - - - - 2 1.3 110.0
Indonesiaf 8 4.2 330.4 5.9 197.4 125.4 322.8 10 6.5 430.4
Marshall Islands 2 1.0 15.0 0.3 46.5 61.0 107.5 0 - -
Micronesia, Federated States of 3 1.6 27.2 0.5 107.0 392.7 499.7 0 - -
Pakistan 29 15.2 1,045.6 18.6 75.9 183.7 259.6 23 15.0 1,398.8
Papua New Guinea 3 1.6 30.6 0.5 46.3 201.0 247.3 4 2.6 158.0
Sri Lanka 19 9.9 506.6 9.0 63.7 126.5 190.2 8 5.2 324.3
Uzbekistan 0 - - - - - - 6 3.9 157.6
Viet Nam 18 9.4 832.0 14.8 98.3 142.3 240.6 24 15.7 1,199.4
C. Regional 0 - - - - - - 1 0.7 1.5
D. All ADF-Eligible Countries 191 100.0 5,607.6 100.0 95.7 140.2 235.9 153 100.0 6,236.2
ADB = Asian Development Bank, ADF = Asian Development Fund, App = approval, Eff = effectiveness, FS = Federated States of, Lao PDR = Lao People’s Democratic Republic, Sgn = signing of loan agreement, TA = technical assistance. a Expressed in terms of number of days.b Based on the country classification as of 11 March 2010.c Excludes loans that were terminated, cancelled, or not yet signed and effective, or not yet effective.d Excludes Myanmar, which currently does not have ADF access. e Excludes India, which currently does not have ADF access. f These countries were still ADF-eligible at the time of loan approval.Sources: Loan Financial Information System; ADB database on Loan, TA, Grant and Equity Approvals.

129129
Performance
Analysis
of ADF
Operations
ADF IX (2005–2008) ADF X (2009–2010)
App Sgn Sgn Eff App Eff No.c million App Sgn Sgn Eff App Eff
13.9 80.9 113.4 194.2 17 29.3 460.1 15.5 64.6 64.3 128.9
3.8 78.6 110.8 189.4 0 - - - - - -
1.5 68.2 78.4 146.6 0 - - - - - -
2.5 45.2 164.5 209.7 4 6.9 71.7 2.4 37.8 68.3 106.0
0.5 138.0 101.0 239.0 2 3.4 44.5 1.5 29.0 85.5 114.5
0.5 102.3 147.5 249.8 1 1.7 0.1 0.0 - - -
0.3 125.0 96.0 221.0 2 3.4 36.5 1.2 99.0 82.0 181.0
0.9 170.0 108.5 278.5 2 3.4 58.1 2.0 5.7 27.3 33.0
1.4 16.5 30.0 46.5 5 8.6 233.2 7.9 146.2 80.8 227.0
0.6 73.0 119.7 192.7 1 1.7 16.0 0.5 8.0 64.0 72.0
2.1 56.2 80.2 136.3 0 - - - - - -
- - - - 0 - - - - - -
- - - - 0 - - - - - -
86.0 87.4 91.3 178.7 41 70.7 2,501.3 84.5 35.9 82.9 118.7
1.3 35.7 108.0 143.7 3 5.2 140.0 4.7 8.0 101.7 109.7
0.2 139.0 98.0 237.0 0 - - - - - -
23.7 69.7 78.5 148.2 8 13.8 427.9 14.4 14.4 117.4 131.8
0.2 83.0 71.0 154.0 0 - - - - - -
1.8 33.5 25.0 58.5 5 8.6 313.8 10.6 12.2 35.4 47.6
6.9 85.5 64.0 149.5 0 - - - - - -
- - - - 1 1.7 9.5 0.3 22.0 20.0 42.0
- - - - 0 - - - - - -
22.4 100.7 61.8 162.6 5 8.6 515.0 17.4 44.0 30.4 74.4
2.5 92.8 93.3 186.0 3 5.2 95.0 3.2 59.3 54.3 113.7
5.2 50.6 110.0 160.6 5 8.6 152.2 5.1 68.2 102.8 171.0
2.5 245.3 102.2 347.5 4 6.9 325.0 11.0 21.3 85.3 106.5
19.2 71.8 136.7 208.5 7 12.1 523.0 17.7 60.6 112.4 173.0
0.0 35.0 242.0 277.0 0 - - - - - -
100.0 85.1 98.7 183.9 58 100.0 2,961.4 100.0 44.6 77.2 121.8

130130
Appendix 4 Table A4.21: Start-Upa Times for ADF Grants, by Country Classification
Country Classificationb/Country
ADF IX (2005–2008) ADF X (2009–2010)
No.c million App-Sgn
Sgn-Eff
App-Eff No.c million
App-Sgn
Sgn-Eff
App-Eff
A. ADF-Only 73 85.9 1,584.4 90.8 65.2 84.8 150.1 35 100.0 1,131.0 100.0 43.5 61.1 104.6
Afghanistan 11 12.9 630.0 36.1 67.8 101.8 169.6 3 8.6 333.1 29.5 28.3 41.3 69.7
Bhutan 4 4.7 45.0 2.6 162.8 110.0 272.8 1 2.9 38.8 3.4 34.0 36.0 70.0
Cambodia 10 11.8 117.1 6.7 44.5 81.5 126.0 3 8.6 72.8 6.4 21.7 75.3 97.0
Kyrgyz Republic 9 10.6 131.5 7.5 55.6 79.2 134.8 2 5.7 35.5 3.1 29.0 85.5 114.5
Lao PDRd 8 9.4 84.4 4.8 65.1 121.1 186.3 9 25.7 152.4 13.5 22.8 79.8 102.6
Mongolia 6 7.1 88.3 5.1 22.5 69.8 92.3 4 11.4 64.9 5.7 21.8 49.0 70.8
Nepal 10 11.8 332.2 19.0 88.7 64.5 153.2 6 17.1 175.6 15.5 133.7 64.8 198.5
Samoa 3 3.5 23.5 1.3 24.3 119.3 143.7 0 0.0 - 0.0 0.0 0.0 0.0
Solomon Islands 3 3.5 19.3 1.1 77.7 43.7 121.3 2 5.7 20.0 1.8 10.5 56.0 66.5
Tajikistan 5 5.9 82.6 4.7 56.6 70.4 127.0 3 8.6 182.0 16.1 16.3 20.7 37.0
Timor-Leste 2 2.4 16.0 0.9 96.5 46.5 143.0 1 2.9 46.0 4.1 98.0 38.0 136.0
Tonga 1 1.2 11.3 0.6 45.0 38.0 83.0 1 2.9 10.0 0.9 18.0 67.0 85.0
Tuvalu 1 1.2 3.2 0.2 49.0 100.0 149.0 0 0.0 - 0.0 0.0 0.0 0.0
B. Blend 10 11.8 127.9 7.3 75.7 95.8 171.5 0 0.0 - 0.0 0.0 0.0 0.0
Bangladesh 1 1.2 10.0 0.6 7.0 24.0 31.0 0 0.0 - 0.0 0.0 0.0 0.0
Pakistan 1 1.2 5.0 0.3 259.0 84.0 343.0 0 0.0 - 0.0 0.0 0.0 0.0
Papua New Guinea 1 1.2 15.0 0.9 41.0 87.0 128.0 0 0.0 - 0.0 0.0 0.0 0.0
Sri Lanka 3 3.5 52.2 3.0 83.0 102.7 185.7 0 0.0 - 0.0 0.0 0.0 0.0
Viet Nam 4 4.7 45.6 2.6 50.3 113.8 164.0 0 0.0 - 0.0 0.0 0.0 0.0
C. Regional 2 2.4 33.0 1.9 5.0 44.5 49.5 0 0.0 - 0.0 0.0 0.0 0.0
D. All ADF-Eligible
Countries85 100.0 1,745.3 100.0 65.0 85.2 150.2 35 100.0 1,131.0 100.0 43.5 61.1 104.6
ADB = Asian Development Bank, ADF = Asian Development Fund, App = grant approval, Eff = grant effectivity, Lao PDR = Lao People’s Democratic Republic, Sgn = signing of grant agreement, TA = technical assistance. a Expressed in terms of number of days. b Based on the country classification as of 11 March 2010.c Excludes grants that were terminated, cancelled, not yet signed and effective, or not yet effective.d Excludes the supplementary financing under Grant 0082-LAO: Northern Greater Mekong Subregion Transport Network Improvement Project for $27
million, approved on 26 April 2010.Sources: Grant Financial Information System; ADB database on Loan, TA, Grant and Equity Approvals .
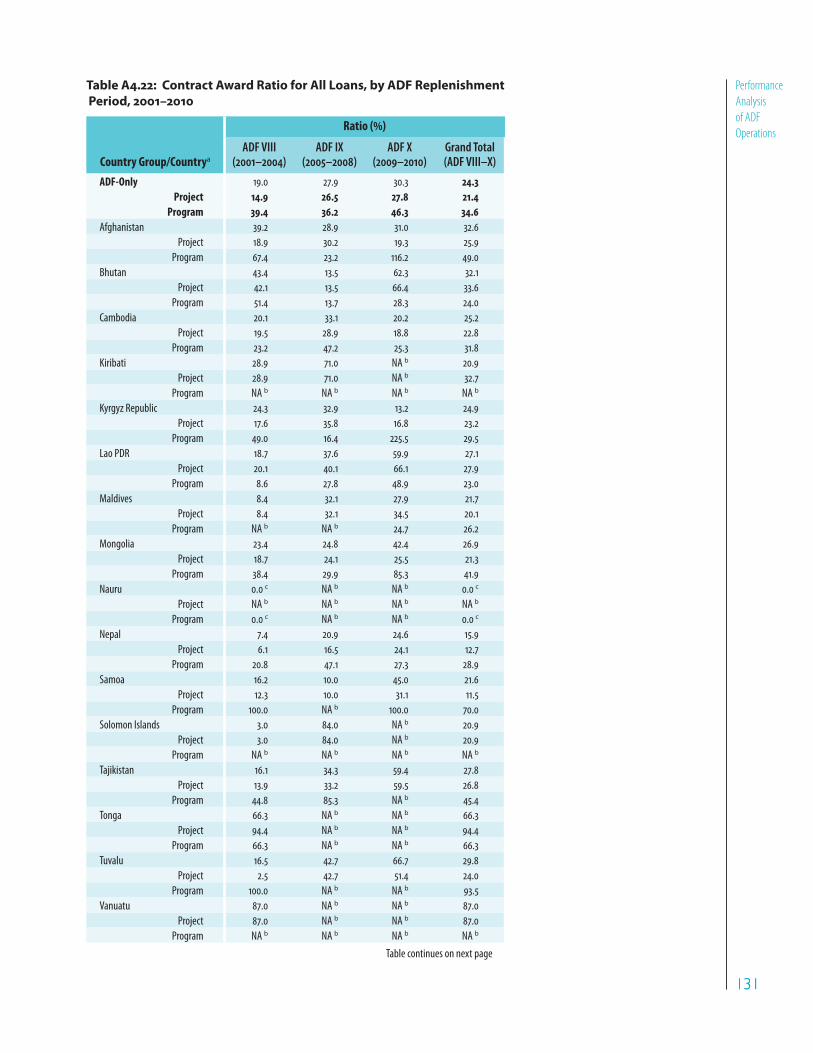
131131
Performance
Analysis
of ADF
Operations
Table A4.22: Contract Award Ratio for All Loans, by ADF Replenishment
Period, 2001–2010
Country Group/Countrya
Ratio ()
ADF VIII (2001–2004)
ADF IX (2005–2008)
ADF X (2009–2010)
Grand Total (ADF VIII–X)
ADF-Only 19.0 27.9 30.3 24.3
Project 14.9 26.5 27.8 21.4
Program 39.4 36.2 46.3 34.6
Afghanistan 39.2 28.9 31.0 32.6
Project 18.9 30.2 19.3 25.9
Program 67.4 23.2 116.2 49.0
Bhutan 43.4 13.5 62.3 32.1
Project 42.1 13.5 66.4 33.6
Program 51.4 13.7 28.3 24.0
Cambodia 20.1 33.1 20.2 25.2
Project 19.5 28.9 18.8 22.8
Program 23.2 47.2 25.3 31.8
Kiribati 28.9 71.0 NA b 20.9
Project 28.9 71.0 NA b 32.7
Program NA b NA b NA b NA b
Kyrgyz Republic 24.3 32.9 13.2 24.9
Project 17.6 35.8 16.8 23.2
Program 49.0 16.4 225.5 29.5
Lao PDR 18.7 37.6 59.9 27.1
Project 20.1 40.1 66.1 27.9
Program 8.6 27.8 48.9 23.0
Maldives 8.4 32.1 27.9 21.7
Project 8.4 32.1 34.5 20.1
Program NA b NA b 24.7 26.2
Mongolia 23.4 24.8 42.4 26.9
Project 18.7 24.1 25.5 21.3
Program 38.4 29.9 85.3 41.9
Nauru 0.0 c NA b NA b 0.0 c
Project NA b NA b NA b NA b
Program 0.0 c NA b NA b 0.0 c
Nepal 7.4 20.9 24.6 15.9
Project 6.1 16.5 24.1 12.7
Program 20.8 47.1 27.3 28.9
Samoa 16.2 10.0 45.0 21.6
Project 12.3 10.0 31.1 11.5
Program 100.0 NA b 100.0 70.0
Solomon Islands 3.0 84.0 NA b 20.9
Project 3.0 84.0 NA b 20.9
Program NA b NA b NA b NA b
Tajikistan 16.1 34.3 59.4 27.8
Project 13.9 33.2 59.5 26.8
Program 44.8 85.3 NA b 45.4
Tonga 66.3 NA b NA b 66.3
Project 94.4 NA b NA b 94.4
Program 66.3 NA b NA b 66.3
Tuvalu 16.5 42.7 66.7 29.8
Project 2.5 42.7 51.4 24.0
Program 100.0 NA b NA b 93.5
Vanuatu 87.0 NA b NA b 87.0
Project 87.0 NA b NA b 87.0
Program NA b NA b NA b NA b
Table continues on next page

132132
Appendix 4
Country Group/Countrya
Ratio ()
ADF VIII (2001–2004)
ADF IX (2005–2008)
ADF X (2009–2010)
Grand Total (ADF VIII–X)
Blend 17.8 27.6 37.6 25.3
Project 13.8 17.4 24.4 17.5
Program 27.2 55.5 59.6 45.2
Armenia NA b 17.4 64.0 44.4
Project NA b 17.4 19.4 25.1
Program NA b NA b 100.0 100.0
Azerbaijan 0.0 c 11.1 35.4 18.6
Project 0.0 c 11.1 46.6 18.6
Program NA b NA b NA b NA b
Bangladesh 13.5 22.5 45.3 23.5
Project 13.1 20.1 21.4 19.1
Program 23.0 52.9 69.1 59.9
Cook Islandsd 33.0 14.0 7.2 13.4
Project 33.0 14.0 70.5 17.2
Program NA b NA b 50.0 0.0 c
Georgia NA b 65.0 45.1 51.1
Project NA b 65.0 23.7 36.9
Program NA b NA b 100.0 100.0
Indonesiad 23.5 50.8 26.8 34.5
Project 18.5 18.9 26.1 19.1
Program 34.0 93.9 41.4 60.5
Marshall Islands 31.1 12.0 NA b 28.3
Project 20.0 12.0 NA b 18.3
Program 54.8 NA b 100.0 54.8
Micronesia, Federated States of 5.8 12.2 4.6 8.8
Project 4.0 11.9 9.6 8.1
Program 12.6 16.8 NA b 13.6
Pakistan 16.0 28.6 37.8 24.7
Project 7.5 16.2 22.8 13.6
Program 24.3 42.5 62.1 36.5
Papua New Guinea 13.9 16.5 7.6 13.7
Project 11.9 16.5 8.2 13.0
Program 19.2 NA b NA b 19.2
Sri Lanka 22.0 28.2 22.3 25.0
Project 20.2 29.4 23.0 25.0
Program 30.7 18.2 50.0 24.9
Uzbekistan 14.5 17.2 30.2 17.6
Project 14.5 15.4 30.2 17.0
Program 14.3 50.4 NA b 24.1
Viet Nam 13.3 13.1 40.8 20.2
Project 11.6 10.8 27.0 15.5
Program 24.1 41.6 -249.1 56.7
Total (ADF-Only + Blend) 18.0 27.7 36.6 25.2
Project 14.0 18.6 24.8 18.0
Program 28.3 54.3 58.8 44.1
ADF = Asian Development Fund, Lao PDR = Lao People’s Democratic Republic.a The following countries are excluded from the list, as they did not have any loans from 2001 to 2009:
ADF-Only countries: Myanmar and Timor-Leste; and Blend country: Palau.b There were no loans during the particular period, thus “NA.” c The actual contract award was 0; thus the achievement rate is 0%.d Cook Islands and Indonesia are classified under Blend as these countries were ADF-eligible during a
large part of the study period. Sources: Central Operations Services Office and Project Performance Report.

133133
Performance
Analysis
of ADF
Operations
Table A4.23: Actual Disbursements versus Projections, 2001–2010
( million; achievement in )
Countries
ADF VIII (2001–2004) ADF IX (2005–2008) ADF X (2009–2010) Grand Total (ADF VIII–X)
Projected ActualAchieve-
ment Projected ActualAchieve-
ment Projected ActualAchieve-
ment Projected ActualAchieve-
ment
ADF-Only 1,275.8 1,245.7 97.6 1,800.8 1,570.7 87.2 749.0 782.9 104.5 3,825.6 3,599.3 94.09
Project 889.2 825.6 92.9 1,409.8 1,255.8 89.1 620.8 591.8 95.3 2,919.8 2,673.2 91.56
Program 386.6 420.0 108.7 390.9 314.9 80.6 128.3 191.1 149.0 905.8 926.1 102.24
Afghanistan 95.6 199.8 208.9 359.0 238.4 66.4 145.1 140.1 96.6 599.7 578.4 96.44
Project 15.8 12.3 77.4 246.0 184.1 74.8 119.7 113.3 94.7 381.5 309.7 81.17
Program 79.8 187.5 235.0 113.0 54.3 48.1 25.4 26.8 105.6 218.2 268.7 123.14
Bhutan 34.6 32.2 93.0 34.6 30.2 87.3 37.9 43.5 114.6 107.1 105.9 98.82
Project 26.9 25.7 95.5 30.6 26.1 85.2 26.4 39.3 148.6 84.0 91.1 108.46
Program 7.7 6.5 84.4 4.0 4.1 103.6 11.5 4.2 36.3 23.2 14.8 63.91
Cambodia 333.1 277.2 83.2 320.1 302.2 94.4 143.6 114.7 79.9 796.7 694.0 87.11
Project 258.5 230.8 89.3 231.7 197.8 85.4 113.6 93.1 82.0 603.7 521.7 86.41
Program 74.6 46.4 62.2 88.4 104.4 118.1 30.0 21.6 71.9 193.0 172.4 89.31
Kiribati 8.0 7.1 88.7 2.0 1.7 85.8 - - - 10.0 8.8 88.10
Project 8.0 7.1 88.7 2.0 1.7 85.8 - - - 10.0 8.8 88.10
Program - - - - - - - - - - - -
Kyrgyz
Republic 159.2 165.6 104.0 139.4 130.1 93.3 37.8 31.8 84.1 336.5 327.6 97.35
Project 88.9 96.3 108.3 114.8 122.1 106.3 29.4 23.1 78.6 233.1 241.5 103.58
Program 70.3 69.3 98.6 24.6 8.0 32.6 8.4 8.7 103.4 103.3 86.1 83.29
Lao PDR 215.8 196.5 91.1 283.6 260.0 91.7 68.5 58.6 85.5 567.9 515.2 90.71
Project 180.8 186.4 103.1 235.4 228.4 97.0 57.8 47.2 81.7 474.0 462.0 97.47
Program 35.0 10.1 28.9 48.2 31.7 65.7 10.7 11.4 106.3 93.9 53.1 56.58
Maldives 15.7 16.1 102.6 33.2 17.7 53.2 35.5 31.3 88.2 84.4 65.0 77.07
Project 15.7 16.1 102.6 33.2 17.7 53.2 17.5 14.7 84.2 66.4 48.5 73.01
Program - - - - - - 18.0 16.6 92.1 18.0 16.6 92.07
Mongolia 157.0 136.1 86.7 129.8 109.4 84.3 49.9 71.8 143.9 336.7 317.3 94.24
Project 90.0 88.1 97.9 107.3 95.5 88.9 41.5 31.0 74.7 238.8 214.6 89.85
Program 67.0 48.0 71.6 22.5 13.9 62.1 8.4 40.7 487.3 97.8 102.7 104.95
Nepal 156.6 141.0 90.0 312.8 309.4 98.9 127.9 153.6 120.1 597.3 604.0 101.11
Project 131.1 109.4 83.4 231.7 221.2 95.5 112.0 107.9 96.3 474.8 438.4 92.34
Program 25.5 31.6 123.9 81.2 88.2 108.7 15.9 45.8 287.8 122.6 165.6 135.10
Samoa 11.7 9.1 77.9 14.5 8.3 57.1 13.3 31.9 239.5 39.5 49.3 124.77
Project 8.3 5.8 70.0 14.5 8.3 57.1 13.3 16.5 123.8 36.1 30.6 84.68
Program 3.4 3.3 97.1 - - - - 15.4 - 3.4 18.7 550.56
Solomon
Islandsa 3.4 1.1 31.9 9.9 10.7 107.3 - - - 13.3 11.7 88.32
Project 3.4 1.1 31.9 9.9 10.7 107.3 - - - 13.3 11.7 88.32
Program - - - - - - - - - - - -
Tajikistan 72.3 51.3 71.0 155.9 149.6 96.0 88.6 104.9 118.4 316.8 305.8 96.53
Project 60.2 46.3 76.9 146.8 139.4 95.0 88.6 104.9 118.4 295.6 290.6 98.32
Program 12.1 5.0 41.3 9.1 10.2 111.8 - - - 21.2 15.2 71.62
Table continues on next page

134134
Appendix 4
Countries
ADF VIII (2001–2004) ADF IX (2005–2008) ADF X (2009–2010) Grand Total (ADF VIII–X)
Projected ActualAchieve-
ment Projected ActualAchieve-
ment Projected ActualAchieve-
ment Projected ActualAchieve-
ment
Tongab 10.2 11.3 110.8 - - - - - - 10.2 11.3 110.78
Project 0.2 0.2 100.0 - - - - - - 0.2 0.2 100.00
Program 10.0 11.1 111.0 - - - - - - 10.0 11.1 111.00
Tuvalu 2.6 1.4 51.2 5.9 3.0 51.5 1.0 0.8 78.6 9.5 5.1 54.16
Project 1.4 0.2 10.6 5.9 3.0 51.5 1.0 0.8 78.6 8.3 3.9 47.50
Program 1.2 1.2 100.0 - - - - - - 1.2 1.2 100.00
Blend 3,214.7 3,018.6 93.9 4,184.0 4,669.5 111.6 2,780.5 2,988.6 107.5 10,179.2 10,676.7 104.89
Project 2,623.4 2,452.3 93.5 3,153.3 3,103.4 98.4 1,853.8 1,826.8 98.5 7,630.5 7,382.5 96.75
Program 591.3 566.3 95.8 1,030.7 1,566.0 151.9 926.8 1,161.8 125.4 2,548.7 3,294.2 129.25
Armenia - - - 8.1 8.0 99.2 - 141.4 - 59.5 149.4 251.01
Project - - - 8.1 8.0 99.2 51.4 60.0 116.7 59.5 68.0 114.28
Program - - - - - - - 81.4 - - 81.4 -
Azerbaijan 1.7 - - 23.4 26.4 112.7 16.4 20.2 122.9 41.6 46.6 112.12
Project 0.9 - - 15.8 26.4 166.8 16.4 20.2 122.9 33.1 46.6 140.74
Program 0.9 - - 7.6 - - - - - 8.5 - -
Bangladesh 680.9 642.0 94.3 848.7 1,172.6 138.2 591.9 633.5 107.0 2,121.5 2,448.1 115.39
Project 674.2 642.0 95.2 739.0 931.4 126.0 458.0 457.9 100.0 1,871.1 2,031.4 108.57
Program 6.8 - - 109.8 241.2 219.7 133.9 175.5 131.1 250.4 416.7 166.39
Cook Islandsc 2.6 2.9 110.8 4.3 2.9 68.7 1.5 0.3 19.9 8.3 6.1 73.20
Project 2.6 2.9 110.8 4.3 2.9 68.7 1.5 0.3 19.9 8.3 6.1 73.20
Program - - - - - - - - - - - -
Georgia - - - - - - 74.0 149.7 202.2 74.0 219.5 296.59
Project - - - - 69.9 - 34.0 69.8 205.3 34.0 139.7 410.63
Program - - - - - - 40.0 79.8 199.6 40.0 79.8 199.61
Indonesiac 124.6 151.9 121.9 349.2 343.1 98.3 229.0 240.7 105.1 702.7 735.6 104.68
Project 124.6 151.9 121.9 349.2 343.1 98.3 229.0 240.7 105.1 702.7 735.6 104.68
Program - - - - - - - - - - - -
Marshall
Islands 22.3 19.3 86.8 1.4 1.0 69.0 - 10.0 - 23.6 30.3 128.01
Project 13.5 10.9 81.2 1.4 1.0 69.0 - - - 14.8 11.9 80.09
Program 8.8 8.4 95.5 - - - - 10.0 - 8.8 18.4 208.86
Micronesia,
Federated
States of
22.2 7.8 35.2 14.0 11.2 79.9 3.1 1.8 58.2 39.3 20.8 52.99
Project 10.5 5.3 50.0 10.5 10.2 96.9 3.1 1.8 58.2 24.1 17.2 71.46
Program 11.7 2.6 21.9 3.5 1.1 29.7 - - - 15.2 3.6 23.71
Pakistan 844.1 831.7 98.5 1,346.5 1,586.5 117.8 846.0 793.2 93.8 3,036.6 3,211.4 105.76
Project 521.1 510.8 98.0 728.1 522.1 71.7 243.1 175.0 72.0 1,492.3 1,207.9 80.94
Program 323.0 320.9 99.4 618.4 1,064.4 172.1 602.9 618.2 102.5 1,544.3 2,003.5 129.74
Papua New
Guinea 37.8 23.0 60.8 30.6 36.1 117.8 14.5 14.4 99.4 82.9 73.5 88.61
Project 37.8 23.0 60.8 30.6 36.1 117.8 14.5 14.4 99.4 82.9 73.5 88.61
Program - - - - - - - - - - - -
Sri Lanka 579.2 519.4 89.7 640.3 588.4 91.9 257.5 253.2 98.4 1,477.0 1,361.0 92.15
Project 449.2 408.2 90.9 640.3 588.4 91.9 257.5 253.2 98.4 1,347.0 1,249.8 92.78
Table continues on next page

135135
Performance
Analysis
of ADF
OperationsCountries
ADF VIII (2001–2004) ADF IX (2005–2008) ADF X (2009–2010) Grand Total (ADF VIII–X)
Projected ActualAchieve-
ment Projected ActualAchieve-
ment Projected ActualAchieve-
ment Projected ActualAchieve-
ment
Program 130.0 111.2 85.5 - - - - - - 130.0 111.2 85.54
Uzbekistan 25.8 17.2 66.7 4.4 3.3 76.1 58.3 56.1 96.3 88.4 76.7 86.70
Project 25.8 17.2 66.7 4.4 3.3 76.1 58.3 56.1 96.3 88.4 76.7 86.70
Program - - - - - - - - - - - -
Viet Nam 873.6 803.5 92.0 913.0 820.1 89.8 637.0 674.2 105.8 2,423.7 2,297.8 94.81
Project 763.4 680.2 89.1 621.6 560.6 90.2 487.0 477.3 98.0 1,872.1 1,718.2 91.78
Program 110.2 123.2 111.8 291.4 259.5 89.0 150.0 196.9 131.3 551.6 579.6 105.07
Total
(ADF-Only and
Blend)
4,490.5 4,264.3 95.0 5,984.7 6,240.2 104.3 3,529.6 3,771.6 106.9 14,004.8 14,276.0 101.94
Project 3,512.6 3,278.0 93.3 4,563.1 4,359.2 95.5 2,474.5 2,418.6 97.7 10,550.3 10,055.8 95.31
Program 977.9 986.3 100.9 1,421.6 1,880.9 132.3 1,055.0 1,353.0 128.2 3,454.5 4,220.2 122.17
ADB = Asian Development Bank, ADF = Asian Development Fund, Lao PDR = Lao People’s Democratic Republic, OCR = ordinary capital resources.a This country had no loans for 2001–2009. b Three loans were approved in Tonga in 1973, 1996, and 2002. However, disbursements are not reflected in the Loan Financial Information
System. c These countries (Cook Islands and Indonesia) were ADF-eligible during a large part of the review period. Sources: ADB databases.

136136
Appendix 4 Table A4.24: Number of Extensions to Loan Closing Date for All Closed Loansa
Country Classificationb/ No. of Extensions
ADF VIII ADF IXc ADF X ADF VIII–X
No. No. No. No.
ADF Countriesd
Total No. of Loans Closed 59 100.0 12 100.0 2 100.0 73 100.0
Loans without extension 8 13.6 7 58.3 2 100.0 17 23.3
1 extension 16 27.1 1 8.3 0 0.0 17 23.3
2 extensions 18 30.5 3 25.0 0 0.0 21 28.8
3 extensions 10 16.9 1 8.3 0 0.0 11 15.1
4 extensions 5 8.5 0 0.0 0 0.0 5 6.8
5 extensions 1 1.7 0 0.0 0 0.0 1 1.4
6 extensions 1 1.7 0 0.0 0 0.0 1 1.4
Blend Countriese
Total No. of Loans Closed 58 100.0 25 100.0 9 100.0 92 100.0
Loans without extension 9 15.5 12 48.0 9 100.0 30 32.6
1 extension 16 27.6 7 28.0 0 0.0 23 25.0
2 extensions 19 32.8 3 12.0 0 0.0 22 23.9
3 extensions 8 13.8 3 12.0 0 0.0 11 12.0
4 extensions 3 5.2 0 0.0 0 0.0 3 3.3
5 extensions 2 3.4 0 0.0 0 0.0 2 2.2
6 extensions 1 1.7 0 0.0 0 0.0 1 1.1
All Countries
Total No. of Loans Closed 117 100.0 37 100.0 11 100.0 165 100.0
Loans without extension 17 14.5 19 51.4 11 100.0 47 28.5
1 extension 32 27.4 8 21.6 0 0.0 40 24.2
2 extensions 37 31.6 6 16.2 0 0.0 43 26.1
3 extensions 18 15.4 4 10.8 0 0.0 22 13.3
4 extensions 8 6.8 0 0.0 0 0.0 8 4.9
5 extensions 3 2.6 0 0.0 0 0.0 3 1.8
6 extensions 2 1.7 0 0.0 0 0.0 2 1.2
ADF = Asian Development Fund.a Includes loans approved during ADF VIII to X that were closed as of end December 2010. b Based on the country classification as of 11 March 2010.c Excludes one regional loan to the Pacific, which was closed without an extension.d Excludes Myanmar, which currently has no access to ADF.e Excludes India, which currently has no access to ADF. Includes Cook Islands and Indonesia, which were still ADF-eligible at the time of loan approval.Source: Loan Financial Information System database.

137137
Performance
Analysis
of ADF
Operations
Table A4.25: Number of Extensions to Loan Closing Date for Closed Program Loansa
Country Classificationb/ No. of Extensions
ADF VIII ADF IX ADF X ADF VIII–X
No. No. No. No.
ADF Countriesc
Total No. of Loans Closed 20 100.0 9 100.0 2 100.0 31 100.0
Loans without extension 6 30.0 6 66.7 2 100.0 14 45.2
1 extension 2 10.0 1 11.1 0 0.0 3 9.7
2 extensions 4 20.0 2 22.2 0 0.0 6 19.4
3 extensions 5 25.0 0 0.0 0 0.0 5 16.1
4 extensions 1 5.0 0 0.0 0 0.0 1 3.2
5 extensions 1 5.0 0 0.0 0 0.0 1 3.2
6 extensions 1 5.0 0 0.0 0 0.0 1 3.2
Blend Countriesd
Total No. of Loans Closed 23 100.0 14 100.0 9 100.0 46 100.0
Loans without extension 6 26.1 11 78.6 9 100.0 26 56.5
1 extension 4 17.4 1 7.1 0 0.0 5 10.9
2 extensions 6 26.1 1 7.1 0 0.0 7 15.2
3 extensions 3 13.0 1 7.1 0 0.0 4 8.7
4 extensions 3 13.0 0 0.0 0 0.0 3 6.5
5 extensions 1 4.3 0 0.0 0 0.0 1 2.2
6 extensions 0 0.0 0 0.0 0 0.0 0 0.0
All Countries
Total No. of Loans Closed 43 100.0 23 100.0 11 100.0 77 100.0
Loans without extension 12 27.9 17 73.9 11 100.0 40 51.9
1 extension 6 14.0 2 8.7 0 0.0 8 10.4
2 extensions 10 23.3 3 13.0 0 0.0 13 16.9
3 extensions 8 18.6 1 4.3 0 0.0 9 11.7
4 extensions 4 9.3 0 0.0 0 0.0 4 5.2
5 extensions 2 4.7 0 0.0 0 0.0 2 2.6
6 extensions 1 2.3 0 0.0 0 0.0 1 1.3
ADF = Asian Development Fund. a Includes loans approved during ADF VIII to X that were closed as of end-December 2010. b Based on the country classification as of 11 March 2010.c Excludes Myanmar, which currently has no access to ADF.d Excludes India, which currently has no access to ADF. Includes Cook Islands and Indonesia, which were still ADF-eligible at the time of loan approval.Source: Loan Financial Information System database.
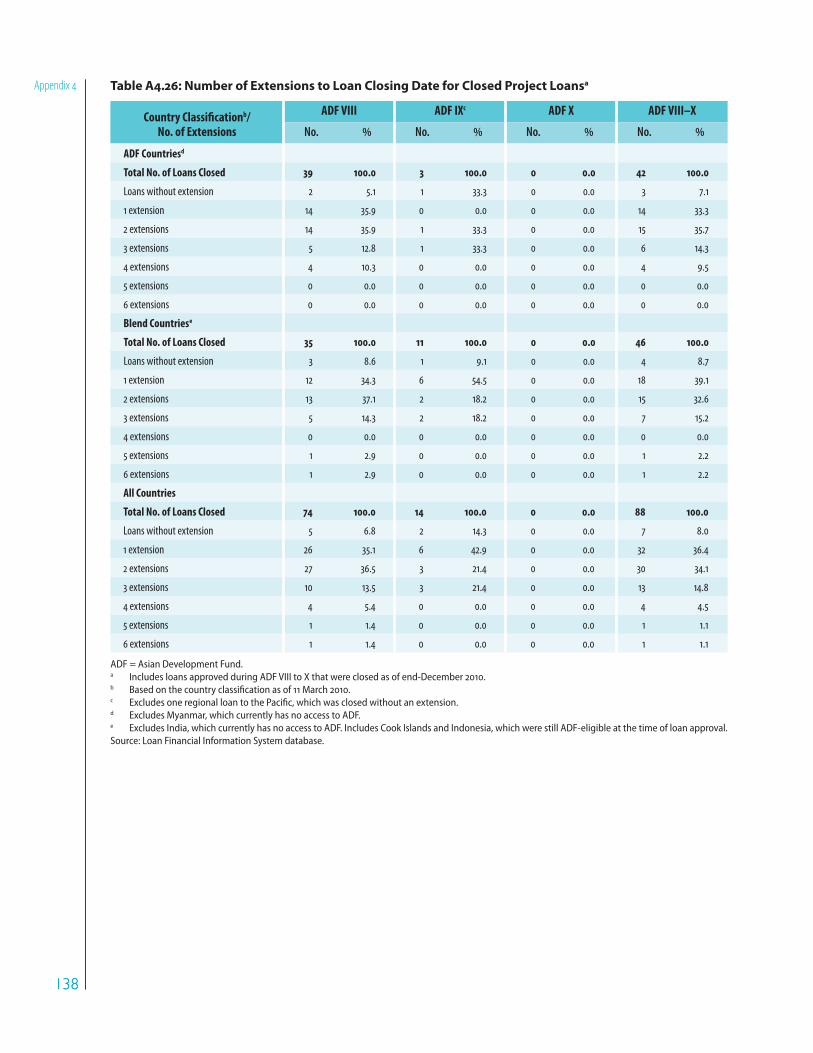
138138
Appendix 4 Table A4.26: Number of Extensions to Loan Closing Date for Closed Project Loansa
Country Classificationb/ No. of Extensions
ADF VIII ADF IXc ADF X ADF VIII–X
No. No. No. No.
ADF Countriesd
Total No. of Loans Closed 39 100.0 3 100.0 0 0.0 42 100.0
Loans without extension 2 5.1 1 33.3 0 0.0 3 7.1
1 extension 14 35.9 0 0.0 0 0.0 14 33.3
2 extensions 14 35.9 1 33.3 0 0.0 15 35.7
3 extensions 5 12.8 1 33.3 0 0.0 6 14.3
4 extensions 4 10.3 0 0.0 0 0.0 4 9.5
5 extensions 0 0.0 0 0.0 0 0.0 0 0.0
6 extensions 0 0.0 0 0.0 0 0.0 0 0.0
Blend Countriese
Total No. of Loans Closed 35 100.0 11 100.0 0 0.0 46 100.0
Loans without extension 3 8.6 1 9.1 0 0.0 4 8.7
1 extension 12 34.3 6 54.5 0 0.0 18 39.1
2 extensions 13 37.1 2 18.2 0 0.0 15 32.6
3 extensions 5 14.3 2 18.2 0 0.0 7 15.2
4 extensions 0 0.0 0 0.0 0 0.0 0 0.0
5 extensions 1 2.9 0 0.0 0 0.0 1 2.2
6 extensions 1 2.9 0 0.0 0 0.0 1 2.2
All Countries
Total No. of Loans Closed 74 100.0 14 100.0 0 0.0 88 100.0
Loans without extension 5 6.8 2 14.3 0 0.0 7 8.0
1 extension 26 35.1 6 42.9 0 0.0 32 36.4
2 extensions 27 36.5 3 21.4 0 0.0 30 34.1
3 extensions 10 13.5 3 21.4 0 0.0 13 14.8
4 extensions 4 5.4 0 0.0 0 0.0 4 4.5
5 extensions 1 1.4 0 0.0 0 0.0 1 1.1
6 extensions 1 1.4 0 0.0 0 0.0 1 1.1
ADF = Asian Development Fund. a Includes loans approved during ADF VIII to X that were closed as of end-December 2010. b Based on the country classification as of 11 March 2010.c Excludes one regional loan to the Pacific, which was closed without an extension.d Excludes Myanmar, which currently has no access to ADF.e Excludes India, which currently has no access to ADF. Includes Cook Islands and Indonesia, which were still ADF-eligible at the time of loan approval.Source: Loan Financial Information System database.
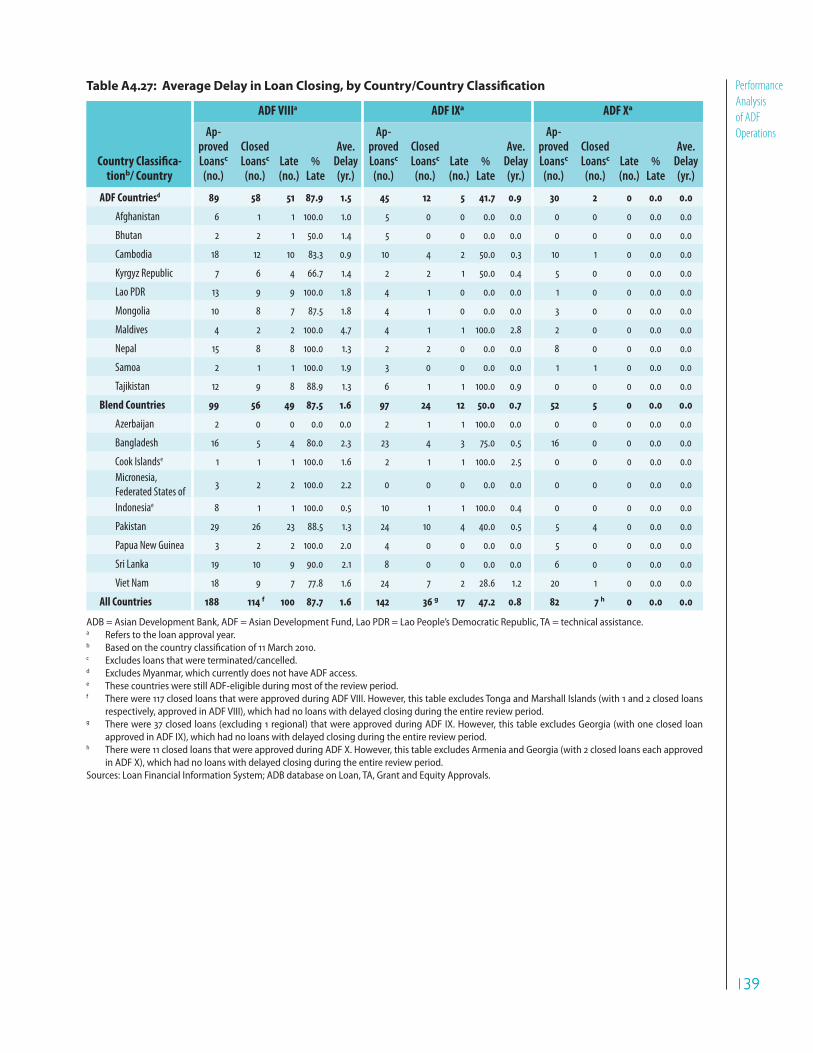
139139
Performance
Analysis
of ADF
Operations
Table A4.27: Average Delay in Loan Closing, by Country/Country Classification
Country Classifica-tionb/ Country
ADF VIIIa ADF IXa ADF Xa
Ap-proved Loansc (no.)
Closed Loansc (no.)
Late (no.)
Late
Ave. Delay (yr.)
Ap-proved Loansc
(no.)
Closed Loansc
(no.)Late (no.)
Late
Ave. Delay (yr.)
Ap-proved Loansc (no.)
Closed Loansc
(no.)Late (no.)
Late
Ave. Delay (yr.)
ADF Countriesd 89 58 51 87.9 1.5 45 12 5 41.7 0.9 30 2 0 0.0 0.0
Afghanistan 6 1 1 100.0 1.0 5 0 0 0.0 0.0 0 0 0 0.0 0.0
Bhutan 2 2 1 50.0 1.4 5 0 0 0.0 0.0 0 0 0 0.0 0.0
Cambodia 18 12 10 83.3 0.9 10 4 2 50.0 0.3 10 1 0 0.0 0.0
Kyrgyz Republic 7 6 4 66.7 1.4 2 2 1 50.0 0.4 5 0 0 0.0 0.0
Lao PDR 13 9 9 100.0 1.8 4 1 0 0.0 0.0 1 0 0 0.0 0.0
Mongolia 10 8 7 87.5 1.8 4 1 0 0.0 0.0 3 0 0 0.0 0.0
Maldives 4 2 2 100.0 4.7 4 1 1 100.0 2.8 2 0 0 0.0 0.0
Nepal 15 8 8 100.0 1.3 2 2 0 0.0 0.0 8 0 0 0.0 0.0
Samoa 2 1 1 100.0 1.9 3 0 0 0.0 0.0 1 1 0 0.0 0.0
Tajikistan 12 9 8 88.9 1.3 6 1 1 100.0 0.9 0 0 0 0.0 0.0
Blend Countries 99 56 49 87.5 1.6 97 24 12 50.0 0.7 52 5 0 0.0 0.0
Azerbaijan 2 0 0 0.0 0.0 2 1 1 100.0 0.0 0 0 0 0.0 0.0
Bangladesh 16 5 4 80.0 2.3 23 4 3 75.0 0.5 16 0 0 0.0 0.0
Cook Islandse 1 1 1 100.0 1.6 2 1 1 100.0 2.5 0 0 0 0.0 0.0
Micronesia,
Federated States of3 2 2 100.0 2.2 0 0 0 0.0 0.0 0 0 0 0.0 0.0
Indonesiae 8 1 1 100.0 0.5 10 1 1 100.0 0.4 0 0 0 0.0 0.0
Pakistan 29 26 23 88.5 1.3 24 10 4 40.0 0.5 5 4 0 0.0 0.0
Papua New Guinea 3 2 2 100.0 2.0 4 0 0 0.0 0.0 5 0 0 0.0 0.0
Sri Lanka 19 10 9 90.0 2.1 8 0 0 0.0 0.0 6 0 0 0.0 0.0
Viet Nam 18 9 7 77.8 1.6 24 7 2 28.6 1.2 20 1 0 0.0 0.0
All Countries 188 114 f 100 87.7 1.6 142 36 g 17 47.2 0.8 82 7 h 0 0.0 0.0
ADB = Asian Development Bank, ADF = Asian Development Fund, Lao PDR = Lao People’s Democratic Republic, TA = technical assistance.a Refers to the loan approval year.b Based on the country classification of 11 March 2010. c Excludes loans that were terminated/cancelled. d Excludes Myanmar, which currently does not have ADF access. e These countries were still ADF-eligible during most of the review period. f There were 117 closed loans that were approved during ADF VIII. However, this table excludes Tonga and Marshall Islands (with 1 and 2 closed loans
respectively, approved in ADF VIII), which had no loans with delayed closing during the entire review period.g There were 37 closed loans (excluding 1 regional) that were approved during ADF IX. However, this table excludes Georgia (with one closed loan
approved in ADF IX), which had no loans with delayed closing during the entire review period.h There were 11 closed loans that were approved during ADF X. However, this table excludes Armenia and Georgia (with 2 closed loans each approved
in ADF X), which had no loans with delayed closing during the entire review period.Sources: Loan Financial Information System; ADB database on Loan, TA, Grant and Equity Approvals.
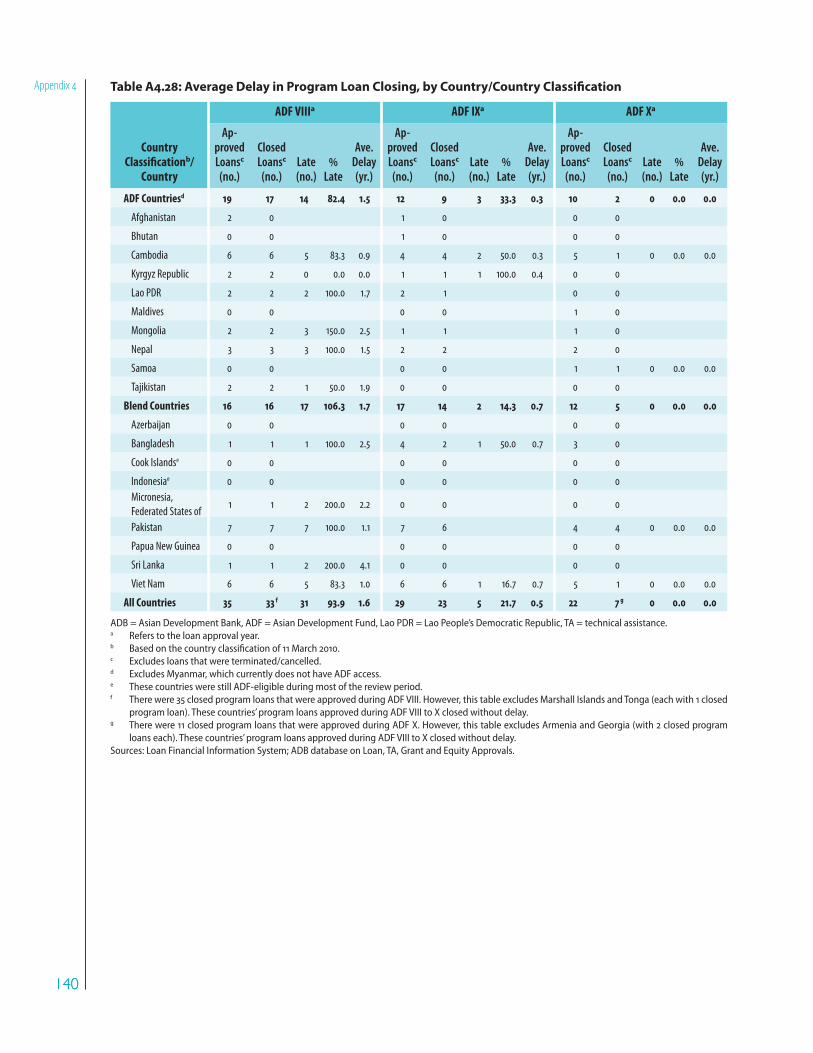
140140
Appendix 4 Table A4.28: Average Delay in Program Loan Closing, by Country/Country Classification
Country Classificationb/
Country
ADF VIIIa ADF IXa ADF Xa
Ap-proved Loansc
(no.)
Closed Loansc (no.)
Late (no.)
Late
Ave. Delay (yr.)
Ap-proved Loansc
(no.)
Closed Loansc
(no.)Late (no.)
Late
Ave. Delay (yr.)
Ap-proved Loansc
(no.)
Closed Loansc
(no.)Late (no.)
Late
Ave. Delay (yr.)
ADF Countriesd 19 17 14 82.4 1.5 12 9 3 33.3 0.3 10 2 0 0.0 0.0
Afghanistan 2 0 1 0 0 0
Bhutan 0 0 1 0 0 0
Cambodia 6 6 5 83.3 0.9 4 4 2 50.0 0.3 5 1 0 0.0 0.0
Kyrgyz Republic 2 2 0 0.0 0.0 1 1 1 100.0 0.4 0 0
Lao PDR 2 2 2 100.0 1.7 2 1 0 0
Maldives 0 0 0 0 1 0
Mongolia 2 2 3 150.0 2.5 1 1 1 0
Nepal 3 3 3 100.0 1.5 2 2 2 0
Samoa 0 0 0 0 1 1 0 0.0 0.0
Tajikistan 2 2 1 50.0 1.9 0 0 0 0
Blend Countries 16 16 17 106.3 1.7 17 14 2 14.3 0.7 12 5 0 0.0 0.0
Azerbaijan 0 0 0 0 0 0
Bangladesh 1 1 1 100.0 2.5 4 2 1 50.0 0.7 3 0
Cook Islandse 0 0 0 0 0 0
Indonesiae 0 0 0 0 0 0
Micronesia,
Federated States of1 1 2 200.0 2.2 0 0 0 0
Pakistan 7 7 7 100.0 1.1 7 6 4 4 0 0.0 0.0
Papua New Guinea 0 0 0 0 0 0
Sri Lanka 1 1 2 200.0 4.1 0 0 0 0
Viet Nam 6 6 5 83.3 1.0 6 6 1 16.7 0.7 5 1 0 0.0 0.0
All Countries 35 33 f 31 93.9 1.6 29 23 5 21.7 0.5 22 7 g 0 0.0 0.0
ADB = Asian Development Bank, ADF = Asian Development Fund, Lao PDR = Lao People’s Democratic Republic, TA = technical assistance.a Refers to the loan approval year. b Based on the country classification of 11 March 2010. c Excludes loans that were terminated/cancelled. d Excludes Myanmar, which currently does not have ADF access.e These countries were still ADF-eligible during most of the review period.f There were 35 closed program loans that were approved during ADF VIII. However, this table excludes Marshall Islands and Tonga (each with 1 closed
program loan). These countries’ program loans approved during ADF VIII to X closed without delay.g There were 11 closed program loans that were approved during ADF X. However, this table excludes Armenia and Georgia (with 2 closed program
loans each). These countries’ program loans approved during ADF VIII to X closed without delay.Sources: Loan Financial Information System; ADB database on Loan, TA, Grant and Equity Approvals.

141141
Performance
Analysis
of ADF
Operations
Table A4.29: Average Delay in Project Loan Closing, by Country/Country Classification
Country Classificationb/
Country
ADF VIIIa ADF IXa ADF Xa
Ap-proved Loansc (no.)
Closed Loansc (no.)
Late (no.)
Late
Ave. Delay (yr.)
Ap-proved Loansc
(no.)
Closed Loansc
(no.)Late (no.)
Late
Ave. Delay (yr.)
Ap-proved Loansc (no.)
Closed Loansc
(no.)Late (no.)
Late
Ave. Delay (yr.)
ADF Countriesd 70 41 37 90.2 1.5 33 3 2 66.7 1.8 20 0 0 0.0 0.0
Afghanistan 1 1 100.0 1.0 4 0 0 0
Bhutan 2 1 50.0 1.4 4 0 0 0
Cambodia 6 5 83.3 1.0 6 0 5 0
Kyrgyz Republic 4 4 100.0 1.4 1 1 5 0
Lao PDR 7 7 100.0 1.8 2 0 1 0
Maldives 2 2 100.0 4.7 4 1 1 100.0 2.8 1 0
Mongolia 6 4 66.7 1.3 3 0 2 0
Nepal 5 5 100.0 1.3 0 0 6 0
Samoa 1 1 100.0 1.9 3 0 0 0
Tajikistan 7 7 100.0 1.2 6 1 1 100.0 0.9 0 0
Blend Countries 83 40 32 80.0 1.6 80 10 10 100.0 0.7 40 0 0 0.0 0.0
Azerbaijan 2 0 0 0.0 2 1 1 100.0 0.0 0 0
Bangladesh 15 4 3 75.0 2.3 19 2 2 100.0 0.4 13 0
Cook Islandse 1 1 1 100.0 1.6 2 1 1 100.0 2.5 0 0
Indonesiae 8 1 1 100.0 0.5 10 1 1 100.0 0.4 0 0
Micronesia,
Federated States of2 1 0 0.0 0 0 0 0
Pakistan 22 19 16 84.2 1.4 17 4 4 100.0 0.5 1 0
Papua New Guinea 3 2 2 100.0 2.0 4 0 5 0
Sri Lanka 18 9 7 77.8 1.5 8 0 6 0
Viet Nam 12 3 2 66.7 3.0 18 1 1 100.0 1.6 15 0
All Countries 153 81 f 69 85.2 1.6 113 13 g 12 92.3 0.9 60 0 0 0.0 0.0
ADB = Asian Development Bank, ADF = Asian Development Fund, Lao PDR = Lao People’s Democratic Republic, TA = technical assistance.a Refers to the loan approval year.b Based on the country classification of 11 March 2010. c Excludes loans that were terminated/cancelled. d Excludes Myanmar, which currently does not have ADF access. e These countries were still ADF-eligible during most of the review period. f There were 82 closed project loans that were approved during ADF VIII. However, this table excludes Marshall Islands (with 1 closed project loan). This
country’s project loans approved during ADF VIII to X closed without delay.g There were 15 closed project loans that were approved during ADF IX. However, this table excludes one regional project loan and another in Georgia.
These project loans approved during ADF VIII to X closed without delay.Sources: Loan Financial Information System; ADB database on Loan, TA, Grant and Equity Approvals.

142142
Appendix 4 Table A4.30: ADF Loan and Grant Cancellations, by Country and Financial Status
(for approvals in 2001–2010)
Country Classification/ Country
No. of Loans and Grants with Cancellations
Amount ( million)
Approved Cancelled
Active Closed Total Active Closed Total Active Closed Total
A. ADF-Only 11 52 63 350.9 809.1 1,160.0 47.4 129.6 177.0
Afghanistan 2 2 4 140.5 12.0 152.5 20.2 6.0 26.2
Bhutan 0 2 2 16.4 16.4 - 1.1 1.1
Cambodia 3 7 10 77.4 103.9 181.3 11.6 6.8 18.4
Kyrgyz Republiic 0 5 5 103.3 103.3 - 22.0 22.0
Lao PDR 2 7 9 33.0 135.9 168.9 5.3 2.5 7.8
Maldives 1 3 4 6.0 19.3 25.3 0.4 1.2 1.6
Mongolia 0 8 8 93.8 93.8 - 28.2 28.2
Nepal 3 7 10 94.0 200.6 294.6 9.8 50.4 60.2
Samoa 0 1 1 6.0 6.0 - 6.5 6.5
Tajikistan 0 9 9 107.9 107.9 - 4.8 4.8
Timor-Leste 0 1 1 10.0 10.0 - 0.1 0.1
B. Blend 19 53 72 881.3 1,792.7 2,674.0 188.7 685.3 874.0
Azerbaijan 0 1 1 3.0 3.0 - 2.0 2.0
Bangladesh 11 6 17 672.1 542.6 1,214.7 145.3 101.6 247.0
Cook Islands 0 1 1 2.8 2.8 - 0.4 0.4
Indonesia 3 2 5 128.2 150.0 278.2 20.1 5.3 25.3
Marshall Islands 0 1 1 7.0 7.0 - 7.4 7.4
Micronesia, Fed. States of 0 2 2 13.0 13.0 - 5.0 5.0
Pakistan 3 25 28 26.0 658.8 684.8 17.6 498.9 516.5
Papua New Guinea 0 2 2 11.6 11.6 - 7.7 7.7
Sri Lanka 2 9 11 55.0 224.8 279.8 5.7 45.3 51.0
Viet Nam 0 4 4 179.1 179.1 - 11.6 11.6
C. Regional 0 1 1 1.5 1.5 - 0.0 0.0
All ADF-Eligible Countries 30 106 136 1,232.2 2,603.4 3,835.6 236.1 814.9 1,051.0
ADB = Asian Development Bank, ADF = Asian Development Fund, Lao PDR = Lao People’s Democratic Republic.Sources: ADB database on Loan, Technical Assistance, Grant and Equity Approvals, Monthly Statement of Loans, Grant Summary, and Cancellation of Loan and Grant Proceeds (Quarterly Portfolio Update, various issues).
Table A4.31: Targeting and Governance Classification of ADF-Supported Case Study Projects in Five
Selected DMCs
Classification
Number
Total BAN LAO NEP PAK VIE
Targeting Classificationa
Targeted Intervention 6 9 2 5 8 30 61.2
General Intervention 4 1 7 5 2 19 38.8
Governance as a Themea
Yes 4 2 3 2 3 14 28.6
No 6 8 6 8 7 35 71.4
ADF = Asian Development Fund, BAN = Bangladesh, DMC = developing member country, LAO = Lao People’s Democratic Republic, NEP = Nepal, PAK = Pakistan, VIE = Viet Nam.a Excludes two projects which were not classified.Sources: Report and recommendation of the President, Central Operations Services Office database.

143143
Performance
Analysis
of ADF
Operations
Table A4.32: Number of Rateda Projects and Programs, by Sector and by ADF Replenishment Period
Sector
ADF I–V ADF VI ADF VII ADF VIII–X
HS/GS/S PS US Total
HS/GS/S PS US Total
HS/GS/S PS US Total
HS/GS/S PS US Total
Agriculture and Natural
Resources58 73 16 147 24 17 6 47 18 6 3 27 10 3 2 15
Education 13 12 1 26 16 4 20 14 4 0 18 4 0 2 6
Energy 37 9 1 47 13 2 15 9 0 0 9 1 1 1 3
Finance 9 26 7 42 7 3 10 5 6 1 12 4 4 1 9
Health and Social
Protection2 7 1 10 6 6 12 8 1 0 9 5 0 1 6
Industry and Trade 13 5 3 21 2 3 5 0 1 0 1 5 1 1 7
Multisector 11 2 3 16 9 2 11 13 4 0 17 15 3 0 18
Public Sector Management 0 0 0 0 1 1 2 6 4 1 11 7 5 1 13
Transport and ICT 26 6 4 36 23 3 26 17 3 0 20 7 2 1 10
Water and Other Municipal
Infrastructure and Services7 14 2 23 15 5 20 7 4 1 12 5 1 2 8
Total 176 154 38 368 116 46 6 168 97 33 6 136 63 20 12 95
ADB = Asian Development Bank, ADF = Asian Development Fund, GS = generally successful, HS = highly successful, ICT = information and communication technology, IED = Independent Evaluation Department, PCR = project/program completion report, PVR = project/program completion report validation, PEIS = Post Evaluation Information System, PPER = project/program performance evaluation report, PS = partly successful, S = successful, TA = technical assistance, US = unsuccessful. a Based on the latest performance assessment available (i.e., PCR, PVR, or PPER).Sources: ADB database on Loan, TA, Grant and Equity Approvals; PEIS; IED website; IED database; PCRs; PVRs; PPERs.
Table A4.33: Performance Ratinga (%) of Projects and Programs, by Sector and by ADF Replenishment
Period
Sector
ADF I–V ADF VI ADF VII ADF VIII–X
HS/GS/S PS US Total
HS/GS/S PS US Total
HS/GS/S PS US Total
HS/GS/S PS US Total
Agriculture and Natural
Resources39.5 49.7 10.9 100.0 51.1 36.2 12.8 100.0 66.7 22.2 11.1 100.0 66.7 20.0 13.3 100.0
Education 50.0 46.2 3.8 100.0 80.0 20.0 - 100.0 77.8 22.2 - 100.0 66.7 - 33.3 100.0
Energy 78.7 19.1 2.1 100.0 86.7 13.3 - 100.0 100.0 - - 100.0 33.3 33.3 33.3 100.0
Finance 21.4 61.9 16.7 100.0 70.0 30.0 - 100.0 41.7 50.0 8.3 100.0 44.4 44.4 11.1 100.0
Health and Social
Protection20.0 70.0 10.0 100.0 50.0 50.0 - 100.0 88.9 11.1 - 100.0 83.3 - 16.7 100.0
Industry and Trade 61.9 23.8 14.3 100.0 40.0 60.0 - 100.0 - 100.0 - 100.0 71.4 14.3 14.3 100.0
Multisector 68.8 12.5 18.8 100.0 81.8 18.2 - 100.0 76.5 23.5 - 100.0 83.3 16.7 - 100.0
Public Sector
Management- - - - 50.0 50.0 - 100.0 54.5 36.4 9.1 100.0 53.8 38.5 7.7 100.0
Transport and ICT 72.2 16.7 11.1 100.0 88.5 11.5 - 100.0 85.0 15.0 - 100.0 70.0 20.0 10.0 100.0
Water and Other
Municipal Infrastructure
and Services
30.4 60.9 8.7 100.0 75.0 25.0 - 100.0 58.3 33.3 8.3 100.0 62.5 12.5 25.0 100.0
Total 47.8 41.8 10.3 100.0 69.0 27.4 3.6 100.0 71.3 24.3 4.4 100.0 66.3 21.1 12.6 100.0
ADB = Asian Development Bank, ADF = Asian Development Fund, GS = generally successful, HS = highly successful, ICT = information and communication technology, IED = Independent Evaluation Department, PCR = project/program completion report, PVR = project/program completion report validation, PEIS = Post Evaluation Information System, PPER = project/program performance evaluation report, PS = partly successful, S = successful, TA = technical assistance, US = unsuccessful. a Based on the latest performance assessment available (i.e., PCR, PVR, or PPER).Sources: ADB database on Loan, TA, Grant and Equity Approvals; PEIS; IED website; IED database; PCRs; PVRs; PPERs.
144144
Appendix 5
A. Key Country-Level Outcomes
1. Bangladesh. The Asian Development Bank (ADB) contributed substantially to improved governance in the energy sector by helping the government develop and carry out reforms to cut power losses from theft and corruption, reduce political interference, and strengthen accountability. The Asian Development Fund (ADF) made substantial �����.������ �� [�� ����������&� W��� ��4��Z����� ��������������������� ��� ��� ���4�������� ������ ����� ����� ���� ��������than other technologies in controlling bank erosion, and at a fraction ��������&�W���[��3���������������� �����.����,��������������������� ����.����������������������������[��&������� �����urban water supply and sanitation (WSS) contributed substantially to improved public health. ADB continued its program in WSS in secondary cities, took on a new and crucial role in Dhaka, and played a key role in starting a comprehensive WSS program among other development partners. In transport, ADB has been steadily working with the government and other development partners on policy reforms, and contributed substantially to the National Land Transport Policy and ���� ���� ;������ ����&� ��� ��� � ���� ����� ����� ����� �������� ���the education sector, ADB has had a substantial impact in helping ���������������������� ����;��������������� �����|���� �;�|�%�for universal primary education and gender equality. The program, �3����+�����������*�����������������������������/���������������������strengthen institutions.
2. ADB made limited contributions to agriculture and natural ��������� ����%������ ��������� �.��������������������� ���;%&�The caretaker government invited ADB to support crucial reforms in anticorruption and in separating the judiciary from the executive. Those reforms have major potential, but have started to falter early in the term of the elected government. Promoting private sector participation has been an important feature of ADB’s work in ANR, but poor implementation has constrained progress.
3. Bhutan.��������������������.�����������������������������the commercialization of the power sector; the preparation and application of a public–private partnership model for hydropower projects; the development of basic infrastructure in two major urban centers; the establishment of a legal, regulatory, and institutional ����3�*� �� ���� ��������� �������������� ����� ���� ���� �����������������������������������������������������������������������transactions costs due to continued state involvement in the sector, lack of effective competition until recently, and lack of sustainable outreach mechanisms—and the development of capacity for debt management, road planning, road safety, and construction management. Ongoing assistance will likely result in further outcomes including the new Southern East–West Highway, which is expected to facilitate trade
Appendix 5
ADF Outputs and Outcomes at
Country- and Sector-Levels

145145
ADF Outputs
and Outcomes
at Country-
and Sector-
Levels
and development of southern Bhutan and the expansion of urban infrastructure covering an additional 60,000 persons. Rural connectivity projects have helped increase income levels in rural areas, mainly due to improved prices for agricultural products and/or increased opportunities for non-farm income. The effects were larger in areas that were comparatively better off prior to the infrastructure project in question because of other economic factors such as tourism-related income, the availability of extension services, and closer proximity to economic centers.
4. Cambodia. ADB has been a constant presence and ADF was a large source of funds over the evaluation period. Investment in physical assets plus sector reforms boosted connectivity, lowered production costs, and encouraged foreign direct investment (FDI). Sustained ��������� ������ ����� ���� �� ��� �� ����������� ����� �����encouraged the mobilization of domestic funds and improved access �� ������&� ������������+� ����������� 3��*� �� ����������� �� ������and enforcement of the adopted reform measures resulted in lower-than-anticipated effectiveness. Support to agriculture and rural �������������+���� ���� �� ���������������������+� ��������� ����������yields and extended markets. Assistance in the education sector helped increase enrollment rates and provided a useful test of the sector-wide � ����� ���� %� �������&� W��� |������� ;�*��� ��.������ �|;�%�operations enhanced connectivity and information exchange among ����������������.�����+�������������.���������������������������as expected.
5. Lao People’s Democratic Republic. While the outcomes and immediate impacts achieved from physical interventions remain relatively strong in all sectors, the outcomes of institutional development support, largely delivered through one-off technical assistance, were �������3��*���&�&+������;+������������+�����.��*��������������������weaknesses of banking sector supervision and the dominant position �����������������.��*�%&�{����3�������,� ����������������� ���for institutional development, areas for further improvement remain. In the transport sector, ADF operations contributed to an expansion and improvement of the country’s road network, which reduced transport costs and travel time. The only rural roads project that has been completed improved connectivity between farm communities, ������������ �������������+��������*����������+�����������������this road was below the forecast levels, owing to the dearth of economic ������������� ����������� ��� ���� ����������&�;����������� ������-�use of infrastructure remains low, since production has yet to develop at the same pace as the physical infrastructure (e.g., the East–West Corridor Project). Some outcomes of the Nam Theun 2 project (energy generation, energy supply to consumers, energy exports, and sales revenues) are less uncertain than others (mitigation of environmental and social impacts and the deployment of government receipts from the project to meet social objectives). In the urban sector, ADF support �����������������4� ������������������.���������������������environmental improvements projects, but poor outcomes from the institutional development component which sought to establish a ������������������������;����� �������������������������� ����������autonomous urban management organization.
6. ADF projects contributed to steady progress made in developing commercial agriculture and fostering rural development.
146146
Appendix 5 Strong investment in irrigation has paid off in terms of rapid growth in rice production and household food security, with rice production reaching a record 2.9 million tons in 2008, more than double the 1.4 million tons produced in 1995. ADB’s interventions in the education sector helped improve enrollment rates of girls. Between 2000 and 2007, approximately 17,000 additional girls stayed in project schools to make the transfer from grade 3 to grade 4, and an additional 5,000 girls completed grade 5. ADF support for improvements of the primary ���������������3�*�����������������������.����������������������development of communities, bringing improved access to health-care services, reduced infant and child mortality rates, and expanded immunization of children. Villagers recognized improvement in access to medical facilities and affordable medical services and drugs.
7. Mongolia. The development results of ADF support for the country were considerable, particularly with regard to support for market-oriented policy reform, social sector development, economic corridor development, and capacity development for public sector governance, procurement systems, project management, and a number �������� ������ �.���������� �������������������������������&�Important accomplishments include ADB’s contributions to restoring ������ ���.������� �� ������ ����� ��� �����������+� ���� ��������� �district heating in Ulaanbaatar, and access to essential municipal services in the secondary cities; restoring primary education enrollment rates; and introducing a network of primary health care providers.
8. Nepal. ADB spread its support widely to poor and excluded people to develop rural infrastructure, provide universal education and ������ ������+� ���� ���������� ������������ �������� ���� ���*�����&�'������� ������ ���.��*� ���������� ����� ���� .������� 3���� ���� ���������from improvements in irrigation and other services to agricultural communities, higher quality and availability of education for the poor and excluded, improved rural roads to bring excluded regions and communities into the economic mainstream, and the provision of basic WSS in smaller towns and cities. While early results are encouraging, the sustainability of such rural infrastructure as roads and irrigation is unclear as there is no certainty of a maintenance regime. A sustainable maintenance regime would require government assistance as well as community participation and ownership in asset management.
9. The experience of ADF interventions for promoting good governance by combating corruption, improving public service delivery, and strengthening capacity has been mixed. ADB has provided considerable support to improve the legal and judicial system in Nepal through the drafting of many important laws. However, the weakness is in the effective implementation of these laws. There are still many institutions in Nepal with large capacity gaps, including the judiciary, and enforcement needs to be strengthened if the legal and judicial systems in Nepal are to lead to the intended development results. Experience with supporting universal education through the sector-wide approach has been positive. ADF supported primary, secondary, and technical education through teacher training, vocational training, physical infrastructure development, rehabilitation of secondary schools, and construction of hostels. The net enrollment rate in primary education increased, with 91% of households having access to a primary school and the gender-related development index increasing from 0.3 in 1995 to 0.5 in 2005. ADF support facilitated an increase

147147
ADF Outputs
and Outcomes
at Country-
and Sector-
Levels
in the provision of scholarships and school grants from 150,000 in 2002 to more than 700,000 in 2007. The percentage of trained teachers increased almost threefold over the same period. Despite the appreciable efforts to enhance basic education, project targets for enrollment in primary school were not attained, and the government ������������������������������ �����������������/�������������������all levels.
10. Pakistan. In the social sectors, targets for the production of physical outputs, particularly infrastructure, were substantially met (sometimes exceeded) in quantitative terms. The quality of project physical outputs was variable and sometimes a problem. The delivery of nonphysical outputs (particularly institutional development and capacity building) was frequently well below targets (even absent) in both quantitative and qualitative terms. Even where the outputs were ����������� ��������� ��� ������ � /�������� ���� /������+� ����� ������limited or even prevented the achievement of intended development outcomes. Factors differed somewhat from sector to sector. In health, problems with recruiting incremental staff resulted in a low utilization ���������������&�'����������+����*���������������������� �����incremental teachers resulted in new ADF-funded facilities operating well below capacity. The late or partial delivery of “soft” outputs such as revised curricula, textbooks, new teaching materials, and trained teachers affected the quality of teaching. In the urban sector, the ��������� ���� ����������� 3��*����� � ���� ��.��� ����������+� ������lack of engagement and unwillingness to take over project components have also been a recurring feature of urban development projects—in some cases related to the poor quality of the facilities, their non-operational state, nonviability, or uncertainty regarding land ownership. Rural water supply schemes were generally designed and installed by the concerned department and then “handed over” to the community after a brief period of training. This is a very inadequate degree of participation. In some cases, schemes were poorly constructed and not �� �.������������ ������&���������� ���+��������������������problems in levying and collecting user fees to ensure operation and maintenance.
11. In general, completed road projects and road components successfully achieved their main intended outcomes, namely the improvement of rural access and reduction in transport costs. In comparison, efforts to improve road maintenance and safety and ������������� ��������+� ��������� ������&� ?��������� �� ����� ����performance improvement of those working in the power sector were neither complete nor consistent. Sector unbundling, corporatization, and privatization have proceeded very slowly. Technical transmission and distribution losses have continued and, in the case of Karachi Electric Supply Company (KESC), grown over the past decade. Lack of reform commitment also affected the implementation and effectiveness � ��,4�� ����� ��������� ������ ���� �.���� ������ �����������reforms.
12. Sri Lanka. In the transport sector, while outcomes in some cases fell short of expectations, all completed road projects resulted in reduced user costs, improved accessibility and connectivity, and .���� ������ ���� ������� .������� �� ���� �&� '�� �����������+�political interventions hampered plantation reforms and affected privatization efforts. ADF support for natural resource management
148148
Appendix 5 was less effective due to institutional issues related to multiple agencies with overlapping functions, staff capacity constraints, and competing concerns. Integrated rural development projects also posed coordination challenges. The performance of projects in the North ����{����3��������������.��������������������������[���+�3�����outcomes of projects in some coastal areas were negated by the effects of the tsunami. ADF support for education achieved various outcomes that responded to improving the quality of secondary and vocational education and their responsiveness to the labor market. However, actions related to the private education, particularly the establishment of private universities were delayed due to lack of political acceptance. ADF support for WSS achieved anticipated outputs and outcomes, and greatly helped expand the number of people with access to safe water, although delays in enforcing rational tariff structures, inadequate enforcement of cost recovery measures for operations and maintenance, slow progress on other sector reforms, capacity issues and resistance among federal staff to decentralization and �������������������� �Z�������������������������������������sustainability of ADF support.
13. Uzbekistan.������������� �������������������������+���������+�and water sectors. ADF support helped ease agricultural production constraints by rehabilitating irrigation systems and improving irrigation and drainage, although they have had little impact beyond ������ �����������&����4�������� ������������������ �������� ����water supplies in rural and urban areas. ADB has tried to promote the ������������� ������������������ �����+�.��������������������tariffs could only meet operating costs. In education, the textbook rental scheme, which was not included in the original project design, emerged as a high point of the Basic Education Textbook Development Project, with the government and development partners heralding it as ADB’s most successful intervention in the sector. The ADB-promoted engagement of employers, parents, and civil society organizations in school matters also holds promise for better governance at the ��������������������������+������������� ����������� �����.���������effects beyond schools.
14. Viet Nam. ADF’s sustained support in the transport and rural development sectors contributed to visible outputs that improved connectivity. ADF support helped improve about 1,000 kilometers (km) of national roads, 4,000 km of provincial and district roads, and 2,100 km of rural roads; and hundreds of small bridges. The rehabilitation and development of roads has facilitated the movement of goods throughout the country, particularly from farmers and producers to markets. Roads are also contributing to increased labor mobility, which has increased opportunities for off-farm employment and other sources of income. Support for technical and vocational training, while on a small scale, helped address a binding constraint of skilled workers in Viet Nam. Graduates of the supported schools achieved employment rates in excess of 80% and about 108,000 skilled workers and production technicians received preemployment and skills upgrade training. ADB contributed to institutional development, particularly in the area of government inspectorate reforms. However, lack of follow-up has left a key reform issue (state-owned enterprises [SOEs]) poorly supported. ���4��������� ��������� ������ ������ ����� �����.����� �� 3��������the access of private sector companies to capital market and leasing ����������������������������������/���������������������� �����+�����

149149
ADF Outputs
and Outcomes
at Country-
and Sector-
Levels
�3�����3���������.�������� ��������������������������+���������the government’s preference for majority shareholdings in larger or �����������/���������}{��������� ���������������.������&
15. Irrigation and drainage facilities were improved on 660,000 hectares (ha), comprising about 15.0% of the total rice land in the country. These were located mainly in the Central and Red River Delta regions, where rehabilitation was most needed. Similarly, over 6!!+!!!�.��3���� ��������� ������ ������������� ������������� �������or components, although it is debatable to what extent ADF support has helped create sustainable market-based mechanisms to lend to this market segment. ADF supported the construction of health and education facilities in a large number of districts, which plausibly �����.����� �� ���� ������-�� ������������ � �������� ;�|�&� ��,�contributed to policy dialogue on improving the focus of the health insurance system toward the poor, which led to increased government support for health insurance premiums of the poor. This subsequently helped increase the utilization of health services by the poor and reduced their out-of-pocket spending.
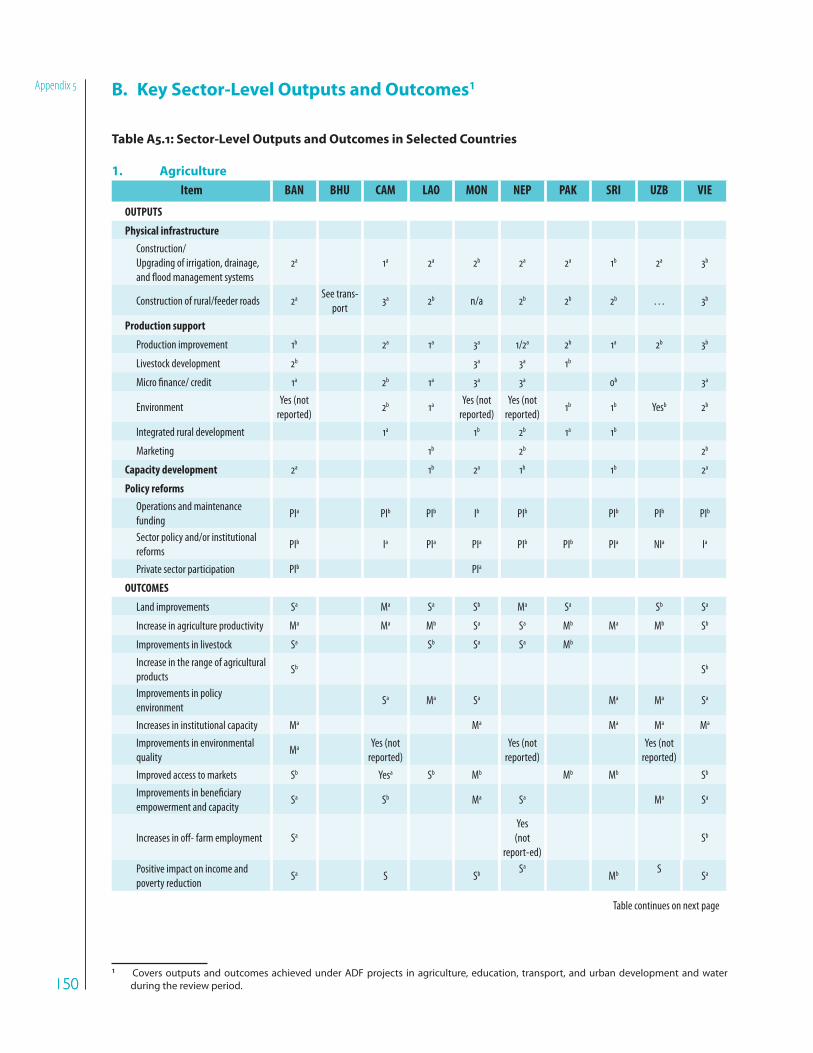
150150
Appendix 5 B. Key Sector-Level Outputs and Outcomes1
Table A5.1: Sector-Level Outputs and Outcomes in Selected Countries
1. Agriculture
Item BAN BHU CAM LAO MON NEP PAK SRI UZB VIE
OUTPUTS
Physical infrastructure
Construction/
Upgrading of irrigation, drainage,
and flood management systems
2a 1a 2a 2b 2a 2a 1b 2a 3b
Construction of rural/feeder roads 2aSee trans-
port3a 2b n/a 2b 2b 2b … 3b
Production support
Production improvement 1b 2a 1a 3a 1/2a 2b 1a 2b 3b
Livestock development 2b 3a 3a 1b
Micro finance/ credit 1a 2b 1a 3a 3a 0b 3a
EnvironmentYes (not
reported)2b 1a
Yes (not
reported)
Yes (not
reported)1b 1b Yesb 2b
Integrated rural development 1a 1b 2b 1a 1b
Marketing 1b 2b 2b
Capacity development 2a 1b 2a 1b 1b 2a
Policy reforms
Operations and maintenance
fundingPIa PIb PIb Ib PIb PIb PIb PIb
Sector policy and/or institutional
reformsPIb Ia PIa PIa PIb PIb PIa NIa Ia
Private sector participation PIb PIa
OUTCOMES
Land improvements Sa Ma Sa Sb Ma Sa Sb Sa
Increase in agriculture productivity Ma Ma Mb Sa Sa Mb Ma Mb Sb
Improvements in livestock Sa Sb Sa Sa Mb
Increase in the range of agricultural
products Sb Sb
Improvements in policy
environmentSa Ma Sa Ma Ma Sa
Increases in institutional capacity Ma Ma Ma Ma Ma
Improvements in environmental
qualityMa
Yes (not
reported)
Yes (not
reported)
Yes (not
reported)
Improved access to markets Sb Yesa Sb Mb Mb Mb Sb
Improvements in beneficiary
empowerment and capacity Sa Sb Ma Sa Ma Sa
Increases in off- farm employment Sa
Yes
(not
report-ed)
Sb
Positive impact on income and
poverty reductionSa S Sb
Sa
MbS
Sa
1 Covers outputs and outcomes achieved under ADF projects in agriculture, education, transport, and urban development and water during the review period.
Table continues on next page
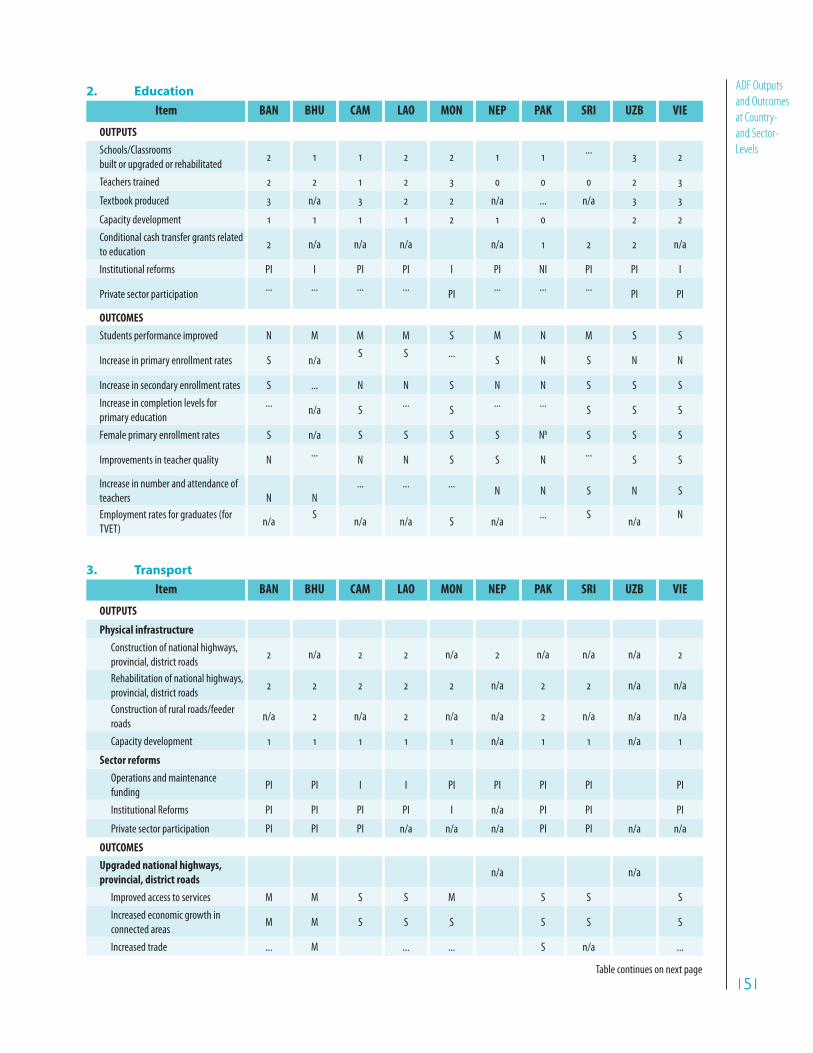
151151
ADF Outputs
and Outcomes
at Country-
and Sector-
Levels
2. Education
Item BAN BHU CAM LAO MON NEP PAK SRI UZB VIE
OUTPUTS
Schools/Classrooms
built or upgraded or rehabilitated2 1 1 2 2 1 1
...3 2
Teachers trained 2 2 1 2 3 0 0 0 2 3
Textbook produced 3 n/a 3 2 2 n/a ... n/a 3 3
Capacity development 1 1 1 1 2 1 0 2 2
Conditional cash transfer grants related
to education2 n/a n/a n/a n/a 1 2 2 n/a
Institutional reforms PI I PI PI I PI NI PI PI I
Private sector participation... ... ... ...
PI... ... ...
PI PI
OUTCOMES
Students performance improved N M M M S M N M S S
Increase in primary enrollment rates S n/aS S ...
S N S N N
Increase in secondary enrollment rates S ... N N S N N S S S
Increase in completion levels for
primary education
...n/a S
...S
... ...S S S
Female primary enrollment rates S n/a S S S S Nb S S S
Improvements in teacher quality N...
N N S S N...
S S
Increase in number and attendance of
teachers N N
... ... ...N N S N S
Employment rates for graduates (for
TVET)n/a
Sn/a n/a S n/a
... Sn/a
N
3. Transport
Item BAN BHU CAM LAO MON NEP PAK SRI UZB VIE
OUTPUTS
Physical infrastructure
Construction of national highways,
provincial, district roads 2 n/a 2 2 n/a 2 n/a n/a n/a 2
Rehabilitation of national highways,
provincial, district roads2 2 2 2 2 n/a 2 2 n/a n/a
Construction of rural roads/feeder
roadsn/a 2 n/a 2 n/a n/a 2 n/a n/a n/a
Capacity development 1 1 1 1 1 n/a 1 1 n/a 1
Sector reforms
Operations and maintenance
fundingPI PI I I PI PI PI PI PI
Institutional Reforms PI PI PI PI I n/a PI PI PI
Private sector participation PI PI PI n/a n/a n/a PI PI n/a n/a
OUTCOMES
Upgraded national highways,
provincial, district roadsn/a n/a
Improved access to services M M S S M S S S
Increased economic growth in
connected areas M M S S S S S S
Increased trade ... M ... ... S n/a ...
Table continues on next page

152152
Appendix 5 Item BAN BHU CAM LAO MON NEP PAK SRI UZB VIE
New national highways,
provincial, district roadsn/a n/a n/a n/a n/a n/a
Improved access to services M S ... S
Increased economic growth in
connected areas M S ... S
Increased trade ... ... ... ...
New rural roads/feeder roads n/a n/a n/a n/a n/a n/a n/a
Improved access to services M S M
Improved access to markets S S M
Increased economic growth in
connected areas S M M
Positive impact on poverty
reductionS M M
4. Water and Urban Services
Item BAN BHU CAM LAO MON NEP PAK SRI UZB VIE
OUTPUTS
Physical Infrastructure
Construction/
upgrading of non-water urban
infrastructure
2 3 3 2 1
Expansion of water supply capacity 2 2 2 1 3 3 3
Expansion/upgrading of water
distribution system 2 2 2 2
Expansion of wastewater treatment
capacity 2 canceled 2 3 1 3 1
Connection of new households to
water supply… 1 3 2 1 1
Increase in waste management
capacity2 3 2 2 0 2
Capacity development 1 1 1 1
Sector reforms
Policy reforms PI PI PI PI PI I
Operations and maintenance
fundingPI PI PI NI PI PI PI PI
Institutional reforms PI NI PI PI PI NI PI PI
Private sector participation I PI NI PI
OUTCOMES
Increase in share of urban
population with access to
sustainable water sources/increase
in consumption levels
M M N S M S S S
Increase in share of rural population
with access to sustainable water
sources/increase in consumption
levels
S S S
Reduction in NRW S S … N … S M
Increase in the share of urban
population with access to improved
sanitation
S M S M M S M
Table continues on next page

153153
ADF Outputs
and Outcomes
at Country-
and Sector-
Levels
Item BAN BHU CAM LAO MON NEP PAK SRI UZB VIE
Increase in the share of rural
population with access to improved
sanitation
S S S
Increase in the share of treated
wastewater M M S N S
Improvement in living conditions for
urban populationS S S S
... = no data are available, 0 = targets not met (<30%), 1 = targets partly met, 2 = targets substantially met (>70%), 3 = targets met or exceeded, BAN = Bangladesh, BHU = Bhutan, CAM = Cambodia, I = implemented, IED = Independent Evaluation Department, LAO = Lao People’s Democratic Republic, M = modest, MON = Mongolia, N = negligible, n/a = not applicable, because related intervention was not included in programs, NEP = Nepal, NI =not implemented, NRW = nonrevenue water, PAK = Pakistan, PI = partly implemented, S = substantial, SRI = Sri Lanka, TVET = technical vocational education and training, UZB = Uzbekistan, VIE = Viet Nam.a Sufficient evidence presented.b Weaker evidence/evaluator judgment required.Sources: IED evaluation reports.
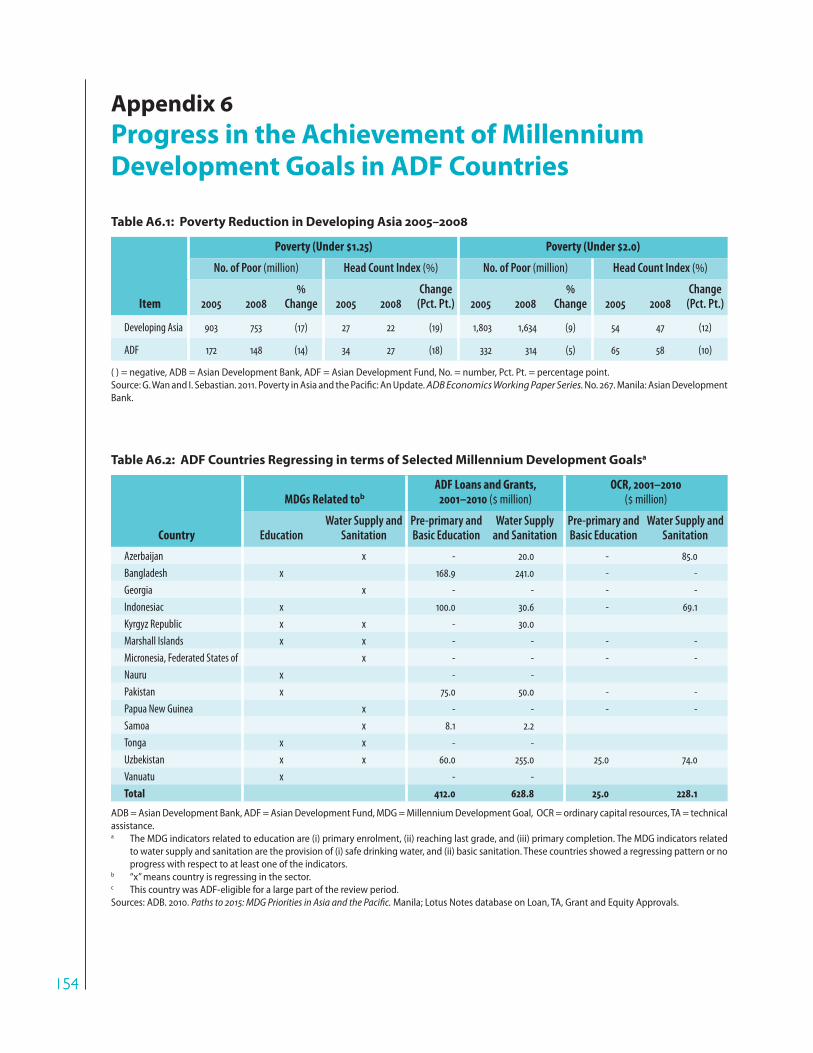
154154
Appendix 6
Table A6.1: Poverty Reduction in Developing Asia 2005–2008
Item
Poverty (Under 1.25) Poverty (Under 2.0)
No. of Poor (million) Head Count Index () No. of Poor (million) Head Count Index ()
2005 2008
Change 2005 2008Change
(Pct. Pt.) 2005 2008
Change 2005 2008Change
(Pct. Pt.)
Developing Asia 903 753 (17) 27 22 (19) 1,803 1,634 (9) 54 47 (12)
ADF 172 148 (14) 34 27 (18) 332 314 (5) 65 58 (10)
( ) = negative, ADB = Asian Development Bank, ADF = Asian Development Fund, No. = number, Pct. Pt. = percentage point. Source: G. Wan and I. Sebastian. 2011. Poverty in Asia and the Pacific: An Update. ADB Economics Working Paper Series. No. 267. Manila: Asian Development Bank.
Table A6.2: ADF Countries Regressing in terms of Selected Millennium Development Goalsa
Country
MDGs Related tob
ADF Loans and Grants, 2001–2010 ( million)
OCR, 2001–2010 ( million)
EducationWater Supply and
SanitationPre-primary and Basic Education
Water Supply and Sanitation
Pre-primary and Basic Education
Water Supply and Sanitation
Azerbaijan x - 20.0 - 85.0
Bangladesh x 168.9 241.0 - -
Georgia x - - - -
Indonesiac x 100.0 30.6 - 69.1
Kyrgyz Republic x x - 30.0
Marshall Islands x x - - - -
Micronesia, Federated States of x - - - -
Nauru x - -
Pakistan x 75.0 50.0 - -
Papua New Guinea x - - - -
Samoa x 8.1 2.2
Tonga x x - -
Uzbekistan x x 60.0 255.0 25.0 74.0
Vanuatu x - -
Total 412.0 628.8 25.0 228.1
ADB = Asian Development Bank, ADF = Asian Development Fund, MDG = Millennium Development Goal, OCR = ordinary capital resources, TA = technical assistance. a The MDG indicators related to education are (i) primary enrolment, (ii) reaching last grade, and (iii) primary completion. The MDG indicators related
to water supply and sanitation are the provision of (i) safe drinking water, and (ii) basic sanitation. These countries showed a regressing pattern or no progress with respect to at least one of the indicators.
b “x” means country is regressing in the sector. c This country was ADF-eligible for a large part of the review period. Sources: ADB. 2010. Paths to 2015: MDG Priorities in Asia and the Pacific. Manila; Lotus Notes database on Loan, TA, Grant and Equity Approvals.
Appendix 6
Progress in the Achievement of Millennium
Development Goals in ADF Countries
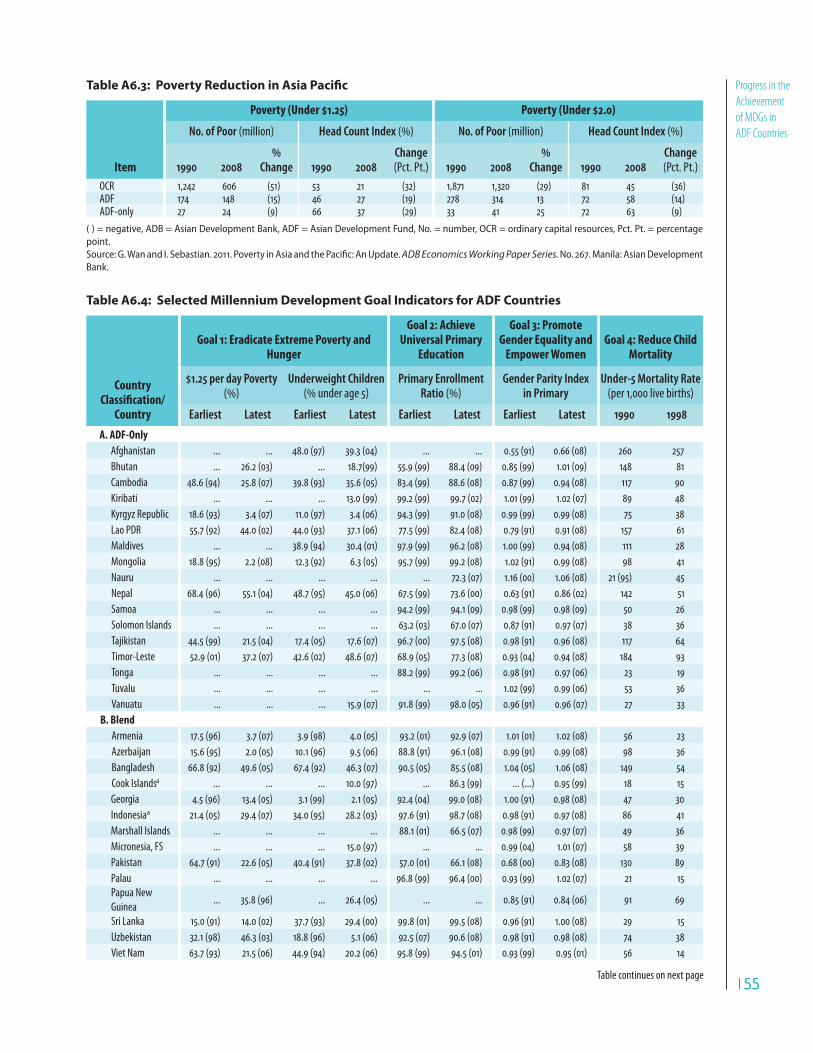
155155
Progress in the
Achievement
of MDGs in
ADF Countries
Table A6.3: Poverty Reduction in Asia Pacific
Item
Poverty (Under 1.25) Poverty (Under 2.0)
No. of Poor (million) Head Count Index () No. of Poor (million) Head Count Index ()
1990 2008
Change 1990 2008Change (Pct. Pt.) 1990 2008
Change 1990 2008
Change(Pct. Pt.)
OCR 1,242 606 (51) 53 21 (32) 1,871 1,320 (29) 81 45 (36) ADF 174 148 (15) 46 27 (19) 278 314 13 72 58 (14) ADF-only 27 24 (9) 66 37 (29) 33 41 25 72 63 (9)
( ) = negative, ADB = Asian Development Bank, ADF = Asian Development Fund, No. = number, OCR = ordinary capital resources, Pct. Pt. = percentage point. Source: G. Wan and I. Sebastian. 2011. Poverty in Asia and the Pacific: An Update. ADB Economics Working Paper Series. No. 267. Manila: Asian Development Bank.
Table A6.4: Selected Millennium Development Goal Indicators for ADF Countries
Country Classification/
Country
Goal 1: Eradicate Extreme Poverty and Hunger
Goal 2: Achieve Universal Primary
Education
Goal 3: Promote Gender Equality and
Empower WomenGoal 4: Reduce Child
Mortality
1.25 per day Poverty ()
Underweight Children ( under age 5)
Primary Enrollment Ratio ()
Gender Parity Index in Primary
Under-5 Mortality Rate (per 1,000 live births)
Earliest Latest Earliest Latest Earliest Latest Earliest Latest 1990 1998
A. ADF-Only
Afghanistan ... ... 48.0 (97) 39.3 (04) ... ... 0.55 (91) 0.66 (08) 260 257
Bhutan ... 26.2 (03) ... 18.7(99) 55.9 (99) 88.4 (09) 0.85 (99) 1.01 (09) 148 81
Cambodia 48.6 (94) 25.8 (07) 39.8 (93) 35.6 (05) 83.4 (99) 88.6 (08) 0.87 (99) 0.94 (08) 117 90
Kiribati ... ... ... 13.0 (99) 99.2 (99) 99.7 (02) 1.01 (99) 1.02 (07) 89 48
Kyrgyz Republic 18.6 (93) 3.4 (07) 11.0 (97) 3.4 (06) 94.3 (99) 91.0 (08) 0.99 (99) 0.99 (08) 75 38
Lao PDR 55.7 (92) 44.0 (02) 44.0 (93) 37.1 (06) 77.5 (99) 82.4 (08) 0.79 (91) 0.91 (08) 157 61
Maldives ... ... 38.9 (94) 30.4 (01) 97.9 (99) 96.2 (08) 1.00 (99) 0.94 (08) 111 28
Mongolia 18.8 (95) 2.2 (08) 12.3 (92) 6.3 (05) 95.7 (99) 99.2 (08) 1.02 (91) 0.99 (08) 98 41
Nauru ... ... ... ... ... 72.3 (07) 1.16 (00) 1.06 (08) 21 (95) 45
Nepal 68.4 (96) 55.1 (04) 48.7 (95) 45.0 (06) 67.5 (99) 73.6 (00) 0.63 (91) 0.86 (02) 142 51
Samoa ... ... ... ... 94.2 (99) 94.1 (09) 0.98 (99) 0.98 (09) 50 26
Solomon Islands ... ... ... ... 63.2 (03) 67.0 (07) 0.87 (91) 0.97 (07) 38 36
Tajikistan 44.5 (99) 21.5 (04) 17.4 (05) 17.6 (07) 96.7 (00) 97.5 (08) 0.98 (91) 0.96 (08) 117 64
Timor-Leste 52.9 (01) 37.2 (07) 42.6 (02) 48.6 (07) 68.9 (05) 77.3 (08) 0.93 (04) 0.94 (08) 184 93
Tonga ... ... ... ... 88.2 (99) 99.2 (06) 0.98 (91) 0.97 (06) 23 19
Tuvalu ... ... ... ... ... ... 1.02 (99) 0.99 (06) 53 36
Vanuatu ... ... ... 15.9 (07) 91.8 (99) 98.0 (05) 0.96 (91) 0.96 (07) 27 33
B. Blend
Armenia 17.5 (96) 3.7 (07) 3.9 (98) 4.0 (05) 93.2 (01) 92.9 (07) 1.01 (01) 1.02 (08) 56 23
Azerbaijan 15.6 (95) 2.0 (05) 10.1 (96) 9.5 (06) 88.8 (91) 96.1 (08) 0.99 (91) 0.99 (08) 98 36
Bangladesh 66.8 (92) 49.6 (05) 67.4 (92) 46.3 (07) 90.5 (05) 85.5 (08) 1.04 (05) 1.06 (08) 149 54
Cook Islandsa ... ... ... 10.0 (97) ... 86.3 (99) ... (...) 0.95 (99) 18 15
Georgia 4.5 (96) 13.4 (05) 3.1 (99) 2.1 (05) 92.4 (04) 99.0 (08) 1.00 (91) 0.98 (08) 47 30
Indonesiaa 21.4 (05) 29.4 (07) 34.0 (95) 28.2 (03) 97.6 (91) 98.7 (08) 0.98 (91) 0.97 (08) 86 41
Marshall Islands ... ... ... ... 88.1 (01) 66.5 (07) 0.98 (99) 0.97 (07) 49 36
Micronesia, FS ... ... ... 15.0 (97) ... ... 0.99 (04) 1.01 (07) 58 39
Pakistan 64.7 (91) 22.6 (05) 40.4 (91) 37.8 (02) 57.0 (01) 66.1 (08) 0.68 (00) 0.83 (08) 130 89
Palau ... ... ... ... 96.8 (99) 96.4 (00) 0.93 (99) 1.02 (07) 21 15
Papua New
Guinea... 35.8 (96) ... 26.4 (05) ... ... 0.85 (91) 0.84 (06) 91 69
Sri Lanka 15.0 (91) 14.0 (02) 37.7 (93) 29.4 (00) 99.8 (01) 99.5 (08) 0.96 (91) 1.00 (08) 29 15
Uzbekistan 32.1 (98) 46.3 (03) 18.8 (96) 5.1 (06) 92.5 (07) 90.6 (08) 0.98 (91) 0.98 (08) 74 38
Viet Nam 63.7 (93) 21.5 (06) 44.9 (94) 20.2 (06) 95.8 (99) 94.5 (01) 0.93 (99) 0.95 (01) 56 14
Table continues on next page

156156
Appendix 6
Country Classification/
Country
Goal 5: Improve Maternal Health
Goal 6: Combat HIV and AIDS, Malaria, and
Other Diseases Goal 7: Ensure Environmental Sustainability Income Gini Coefficient
Skilled Birth Assistance
()HIV Prevalence ( ages 15-49)
Forest Cover ( land area)
Safe Drinking Water
( population)Basic Sanitation ( population) Move-
ment
Earliest Latest 2001 2007 1990 2005 1990 2008 1990 2008 1995 Latest
A. ADF-Only
Afghanistan 12.4 (00) 14.3 (03) … … 2 1.3 3 (95) 48 29 (95) 37 … …
Bhutan 14.9 (94) 71.4 (07) 0.1 0.1 64.6 68 91 (00) 92 62 (00) 65 … 0.468 (03)
Cambodia 34.0 (98) 43.8 (05) 1.8 0.8 73.3 59.2 35 61 9 29 0.383 (94) 0.443 (07) -
Kiribati 72.0 (94) 63.0 (05) … … 3 3 48 64 (05) 26 35 (05) … …
Kyrgyz Republic 98.1 (97) 97.6 (06) 0.1 0.1 4.4 4.5 78 (95) 90 93 (95) 93 0.537 (93) 0.335 (07) +
Lao PDR 19.4 (01) 20.3 (06) 1 0.2 75 69.9 44 (95) 57 18 (95) 53 0.349 (97) 0.326 (02) +
Maldives 90.0 (94) 84.0 (04) 0.1 0.1 3 3 90 91 69 98 … 0.374 (04)
Mongolia 93.6 (98) 99.2 (06) 0.1 0.1 7.3 6.5 58 76 49 (95) 50 0.332 0.366 (08) -
Nauru ... 97.4 (07) … … … … … … … … … …
Nepal 7.4 (91) 18.7 (06) 0.5 0.5 33.7 25.4 76 88 11 31 0.377 (96) 0.473 (04) -
Samoa 76.0 (90) 100.0 (98) … … 45.9 60.4 91 88 (05) 98 100 … 0.430 (02)
Solomon Islands 85.0 (94) 70.1 (07) … … 98.9 77.6 69 (95) 90 (05) 30 (95) 32 (05) … …
Tajikistan 79.0 (96) 88.4 (07) 0.1 0.3 2.9 2.9 58 (95) 70 89 (95) 94 0.315 (99) 0.336 (04) -
Timor-Leste 25.8 (97) 18.4 (03) … … 65 53.7 52 (00) 69 32 (00) 50 0.395 (01) 0.319 (07) +
Tonga 92.0 (91) 95.0 (01) … … 5 5 100(95) 100 96 96 … 0.420 (01)
Tuvalu 100.0 (90) 97.9 (07) … … 33.3 33.3 90 97 80 84 … …
Vanuatu 87.0 (94) 74.0 (07) … … 36.1 36.1 57 83 35 (95) 52 … …
B. Blend
Armenia 96.4 (97) 99.9 (07) 0.1 0.1 12.3 10 92 (95) 96 88 (95) 900.444
(96)0.302 (07) +
Azerbaijan 99.8 (98) 88.0 (06) 0.1 0.2 11.3 11.3 70 80 57 (95) 45 0.35 0.168 (05) +
Bangladesh 9.5 (94) 18.0 (07) 0.1 0.1 6.8 6.7 78 80 34 53 0.335 (96) 0.332 (05) +
Cook Islandsa 99.0 (91) 98.0 (01) … … 63.9 66.5 94 95 (05) 96 100 … …
Georgia 96.6 (90) 98.3 (05) 0.1 0.1 39.7 39.7 81 98 96 95 0.371 (96) 0.408 (05) -
Indonesiaa 40.7 (90) 79.4 (07) 1 0.2 64.3 48.8 71 80 33 52 0.344 (93) 0.376 (07) -
Marshall Islands 94.9 (98) 86.2 (07) … … … … 95 94 64 73 … …
Micronesia, FS 92.8 (99) 87.7 (01) … … 90.6 90.6 89 94 (05) 29 25 (05) … 0.408 (98)
Pakistan 18.8 (91) 38.8 (07) 0.1 0.1 3.3 2.5 86 90 28 45 0.287 (97) 0.312 (05) -
Palau 99.0 (90) 100.0 (02) … … 82.9 87.6 81 84 (05) 69 83 (05) … …
Papua New
Guinea 53.2 (96) 53.0 (06) 0.3 1.5 69.6 65 41 40 47 45 … 0.509 (96)
Sri Lanka 94.1 (93) 98.5 (07) 0.1 0.1 36.4 29.9 67 90 70 91 0.354 0.411 (02) -
Uzbekistan 97.5 (96) 99.9 (06) 0.1 0.1 7.4 8 90 87 84 100 0.454 (98) 0.367 (03) +
Viet Nam 77.1 (97) 87.7 (06) 0.3 0.5 28.8 39.7 58 94 35 75 0.357 (93) 0.378 (06) -
… = not available, ADB = Asian Development Bank, ADF = Asian Development Fund, AIDS = acquired immune deficiency syndrome, DMC = developing member country, HIV = human immunodeficiency virus, Lao PDR = Lao People’s Democratic Republic, MDG = Millennium Development Goal, Micronesia, FS = Federated States of, UNDP = United Nations Development Programme, UNESCAP = United Nations Economic and Social Commission for Asia and the Pacific. a These countries were still ADF-eligible for a large part of the review period.Note: The number in parentheses is the year of the data point.Sources: Paths to 2015: MDG Priorities in Asia and the Pacific (ADB, UNESCAP, and UNDP) (for data on MDGs); Key Indicators for Asia and the Pacific 2010 (for data on income Gini coefficient).
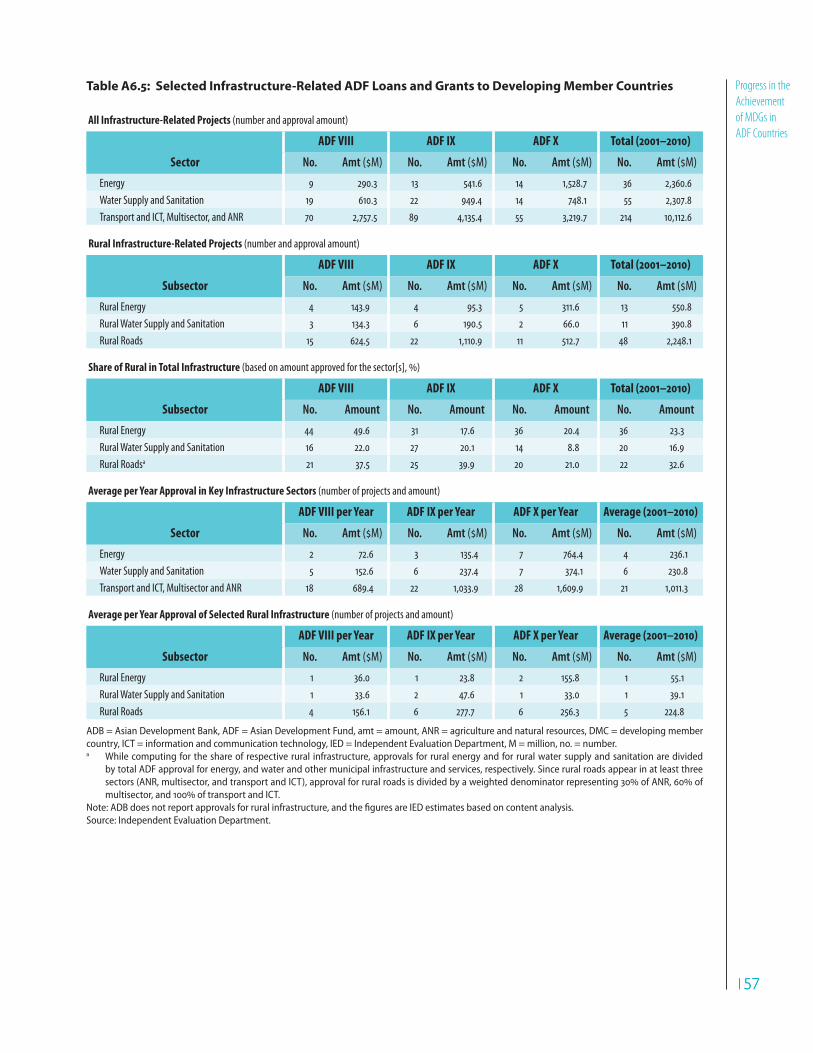
157157
Progress in the
Achievement
of MDGs in
ADF Countries
Table A6.5: Selected Infrastructure-Related ADF Loans and Grants to Developing Member Countries
All Infrastructure-Related Projects (number and approval amount)
Sector
ADF VIII ADF IX ADF X Total (2001–2010)
No. Amt (M) No. Amt (M) No. Amt (M) No. Amt (M)
Energy 9 290.3 13 541.6 14 1,528.7 36 2,360.6
Water Supply and Sanitation 19 610.3 22 949.4 14 748.1 55 2,307.8
Transport and ICT, Multisector, and ANR 70 2,757.5 89 4,135.4 55 3,219.7 214 10,112.6
Rural Infrastructure-Related Projects (number and approval amount)
Subsector
ADF VIII ADF IX ADF X Total (2001–2010)
No. Amt (M) No. Amt (M) No. Amt (M) No. Amt (M)
Rural Energy 4 143.9 4 95.3 5 311.6 13 550.8
Rural Water Supply and Sanitation 3 134.3 6 190.5 2 66.0 11 390.8
Rural Roads 15 624.5 22 1,110.9 11 512.7 48 2,248.1
Share of Rural in Total Infrastructure (based on amount approved for the sector[s], )
Subsector
ADF VIII ADF IX ADF X Total (2001–2010)
No. Amount No. Amount No. Amount No. Amount
Rural Energy 44 49.6 31 17.6 36 20.4 36 23.3
Rural Water Supply and Sanitation 16 22.0 27 20.1 14 8.8 20 16.9
Rural Roadsa 21 37.5 25 39.9 20 21.0 22 32.6
Average per Year Approval in Key Infrastructure Sectors (number of projects and amount)
Sector
ADF VIII per Year ADF IX per Year ADF X per Year Average (2001–2010)
No. Amt (M) No. Amt (M) No. Amt (M) No. Amt (M)
Energy 2 72.6 3 135.4 7 764.4 4 236.1
Water Supply and Sanitation 5 152.6 6 237.4 7 374.1 6 230.8
Transport and ICT, Multisector and ANR 18 689.4 22 1,033.9 28 1,609.9 21 1,011.3
Average per Year Approval of Selected Rural Infrastructure (number of projects and amount)
Subsector
ADF VIII per Year ADF IX per Year ADF X per Year Average (2001–2010)
No. Amt (M) No. Amt (M) No. Amt (M) No. Amt (M)
Rural Energy 1 36.0 1 23.8 2 155.8 1 55.1
Rural Water Supply and Sanitation 1 33.6 2 47.6 1 33.0 1 39.1
Rural Roads 4 156.1 6 277.7 6 256.3 5 224.8
ADB = Asian Development Bank, ADF = Asian Development Fund, amt = amount, ANR = agriculture and natural resources, DMC = developing member country, ICT = information and communication technology, IED = Independent Evaluation Department, M = million, no. = number.a While computing for the share of respective rural infrastructure, approvals for rural energy and for rural water supply and sanitation are divided
by total ADF approval for energy, and water and other municipal infrastructure and services, respectively. Since rural roads appear in at least three sectors (ANR, multisector, and transport and ICT), approval for rural roads is divided by a weighted denominator representing 30% of ANR, 60% of multisector, and 100% of transport and ICT.
Note: ADB does not report approvals for rural infrastructure, and the figures are IED estimates based on content analysis.Source: Independent Evaluation Department.
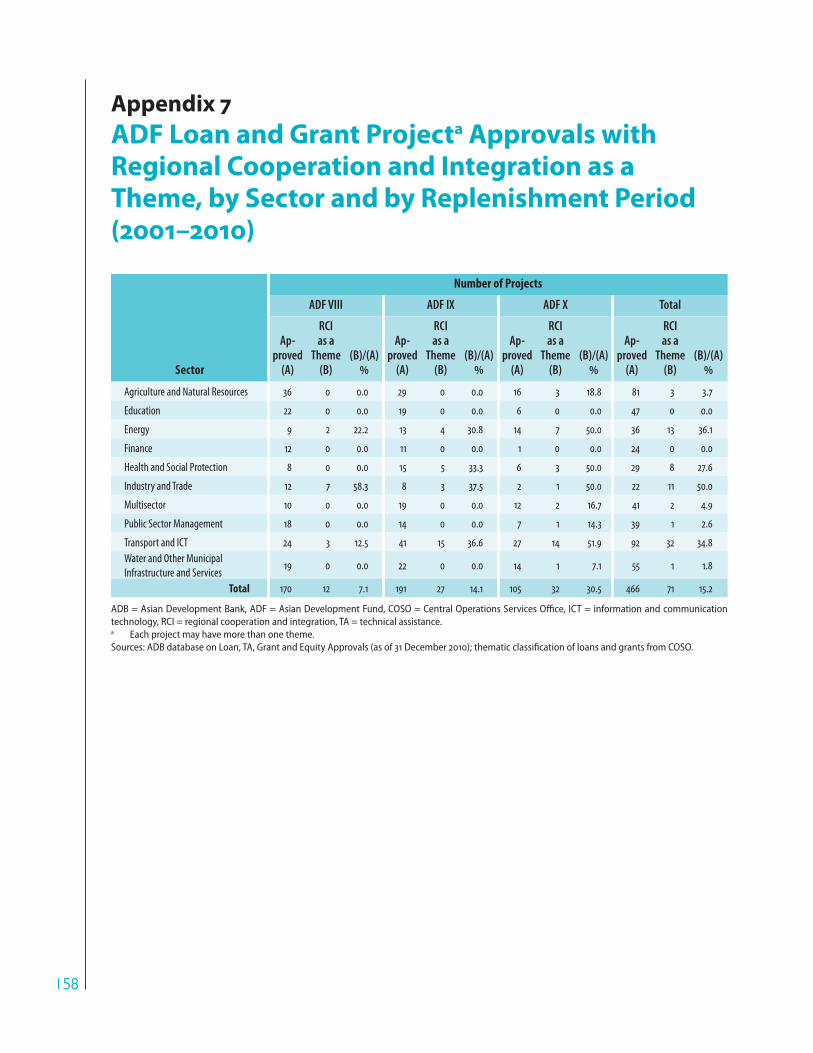
158158
Appendix 7
Sector
Number of Projects
ADF VIII ADF IX ADF X Total
Ap-proved
(A)
RCIas a
Theme (B)
(B)/(A)
Ap-proved
(A)
RCI as a
Theme (B)
(B)/(A)
Ap-proved
(A)
RCI as a
Theme (B)
(B)/(A)
Ap-proved
(A)
RCI as a
Theme (B)
(B)/(A)
Agriculture and Natural Resources 36 0 0.0 29 0 0.0 16 3 18.8 81 3 3.7
Education 22 0 0.0 19 0 0.0 6 0 0.0 47 0 0.0
Energy 9 2 22.2 13 4 30.8 14 7 50.0 36 13 36.1
Finance 12 0 0.0 11 0 0.0 1 0 0.0 24 0 0.0
Health and Social Protection 8 0 0.0 15 5 33.3 6 3 50.0 29 8 27.6
Industry and Trade 12 7 58.3 8 3 37.5 2 1 50.0 22 11 50.0
Multisector 10 0 0.0 19 0 0.0 12 2 16.7 41 2 4.9
Public Sector Management 18 0 0.0 14 0 0.0 7 1 14.3 39 1 2.6
Transport and ICT 24 3 12.5 41 15 36.6 27 14 51.9 92 32 34.8
Water and Other Municipal
Infrastructure and Services19 0 0.0 22 0 0.0 14 1 7.1 55 1 1.8
Total 170 12 7.1 191 27 14.1 105 32 30.5 466 71 15.2
ADB = Asian Development Bank, ADF = Asian Development Fund, COSO = Central Operations Services Office, ICT = information and communication technology, RCI = regional cooperation and integration, TA = technical assistance. a Each project may have more than one theme. Sources: ADB database on Loan, TA, Grant and Equity Approvals (as of 31 December 2010); thematic classification of loans and grants from COSO.
Appendix 7
ADF Loan and Grant Projecta Approvals with
Regional Cooperation and Integration as a
Theme, by Sector and by Replenishment Period
(2001–2010)

159159
Appendix 8
Major Environmental Initiatives
1. Detailed description and operational procedures of various initiatives are available from the Asian Development Bank’s (ADB) Regional and Sustainable Development Department website. This appendix outlines key environmental initiatives undertaken by ADB during the review period.
2. The Asian Environment Outlook reviews key environmental ������� ������ ���� ����� ���� ������� ������ ���� ���������� �������� ���������� ��������� �� �������� ����&� '�� 3��� ����� ��������� ��� �!!$+�followed by the second one in 2005.
3. The Cities Development Initiative for Asia, established in 2007 as a regional initiative, promotes livable cities that are competitive and environmentally attractive. All Asian Development Fund developing ���.������������ ��;?�%�/������ ��?��������� ����� '���������� ��Asia. The Clean Air Initiative for Asian Cities was established in 2001 by ADB, the United States-Asia Environmental Partnership, and the World ,��*������[����� ���������������� ���������/������&1 ADB has signed a letter of intent with the Clean Air Initiative Asia Center to improve urban air quality and reduce greenhouse gas emissions in Asia. ADB established an ������� ���������� "�� � ��� (EEI) in 2005 to help �;?��������������������+��������.�������������������������� ����patterns while securing a low carbon future. Through this initiative, ADB conducts studies on institutional and external barriers to widespread � �������������3�.��������������������������������������;?�&2
4. The Climate Change Program addresses the causes and consequences of climate change and provides support by ������������������������������������� �������+��.��������������+�and developing capacity and knowledge. Under its climate change mitigation activities, it is helping Asia transition to low-carbon growth .�� ������� ��%� ������� ��������+� ����3�.��� ������+� �3�������� ���������� ����+� ���� ����� �34���.�� ������� ������ ���%� ��������transport systems; (iii) improved urban sanitation and reduction of fugitive methane emissions; and (iv) sustainable land use and forestry. ��,����������� ���������;?����� ������������������ ��������������change; its adaptation activities are focused on (i) addressing climate vulnerability and risks in national development strategies and action plans, (ii) assessing climate resilience in vulnerable sectors and geo-
1 The Clean Air Initiative for Asian Cities became the leading convener on air quality management (AQM) through the Better Air Quality Workshops, the largest regional gathering of AQM stakeholders in Asia. ADB was instrumental in formally structuring the initiative in 2007 as the Clean Air Initiative for Asian Cities Partnership, the Clean Air Initiative Asia Center, and the Clean Air Initiative Asia Country Networks. The Clean Air Initiative Asia Center was registered as a nonstock, nonprofit corporation in the Philippines.
2 ADB clean energy investments under the EEI include end-use energy efficiency, renewable energy, and cleaner fuels. To help finance EEI, the Clean Energy Financing Partnership Facility was established in April 2007 to fund small energy efficiency investments that require quick transactions, finance some technology transfer costs of clean technologies, and provide grant assistance for activities such as developing the knowledge base on clean energy technologies.
160160
Appendix 8 climatic regions, (iii) addressing social dimensions of climate change, ���� ���%� �������� ����� � ������&� ��,� ����.������� ���� ?�������Change Fund and works with partners such as the Global Environment ��������� �� ��� � ���� �;?�� ������� ������ ��������� �� ��� ������ ����mitigation programs and investments.
5. The Poverty and Environment Program was established to promote mainstreaming the environment in ADB operations and �;?�-� ��������� ������&�������������������������������W�%9���� ���in learning and understanding the link between poverty reduction and the promotion of environmental sustainability through targeted interventions in three focal areas: sustainable livelihoods, pollution and health, and environmental vulnerability. The TA also helped in establishing the Poverty Environment Net website (http://www.povertyenvironment.net). Currently, ADB is implementing another TA4 that expands the scope of the Poverty and Environment Program and includes opportunities for environmental mainstreaming in ADB operations.
6. ADB’s Sustainable Transport Initiative promotes transport solutions while ensuring inclusive and environmentally sustainable growth and mitigating negative externalities of the sector. It supports integrated land use development and mobility needs, promoting shifts �� ������4�������� ����� � ����� ������+� ���� �� ������ ��������������������������&�'������ ��������,-�������������3�����;?��on sustainable, low-carbon transport.
7. Other programs. Other regional and subregional initiatives to mainstream environmental considerations into the region’s economic programs, and to restore, maintain, and enhance the productive functions of natural resources for the improved wellbeing of those who depend on these resources, while preserving ecological functions, �������� ��%�|�������;�*�����.������#�?���{����������������+� (ii) Coral Triangle Initiative, (iii) Central Asian Countries Initiative for Land ;���������+� ���� ���%�������� ,���� '���������&���,�3�*�� �������with other development partners such as the Global Environment Facility, Asian Environmental Compliance and Enforcement Network, United Nations Environment Programme, International Union for Conservation of Nature, World Wide Fund for Nature, and United �������{����������������?�����������������������������&�
3 ADB. 2003. Technical Assistance for Poverty and Environment Program. Manila.4 ADB. 2007. Technical Assistance for Mainstreaming Environment for Poverty Reduction. Manila.
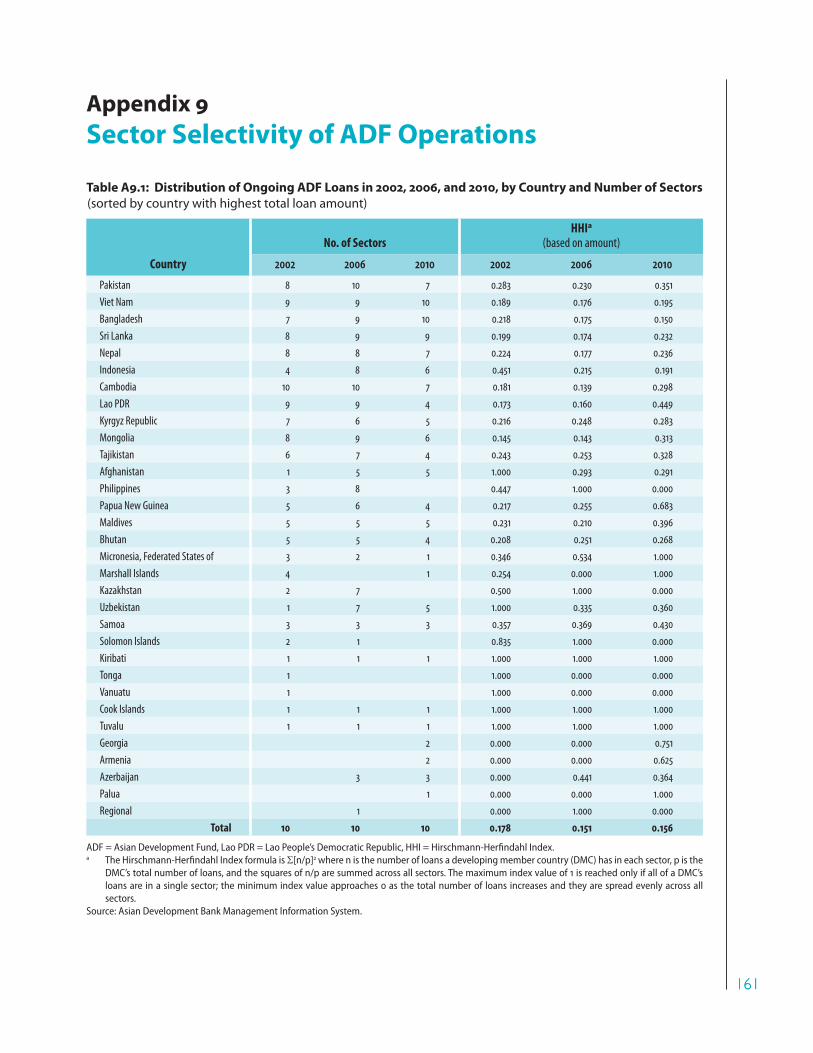
161161
Sector
Selectivity
of ADF
Operations
Table A9.1: Distribution of Ongoing ADF Loans in 2002, 2006, and 2010, by Country and Number of Sectors (sorted by country with highest total loan amount)
No. of SectorsHHIa
(based on amount)
Country 2002 2006 2010 2002 2006 2010
Pakistan 8 10 7 0.283 0.230 0.351
Viet Nam 9 9 10 0.189 0.176 0.195
Bangladesh 7 9 10 0.218 0.175 0.150
Sri Lanka 8 9 9 0.199 0.174 0.232
Nepal 8 8 7 0.224 0.177 0.236
Indonesia 4 8 6 0.451 0.215 0.191
Cambodia 10 10 7 0.181 0.139 0.298
Lao PDR 9 9 4 0.173 0.160 0.449
Kyrgyz Republic 7 6 5 0.216 0.248 0.283
Mongolia 8 9 6 0.145 0.143 0.313
Tajikistan 6 7 4 0.243 0.253 0.328
Afghanistan 1 5 5 1.000 0.293 0.291
Philippines 3 8 0.447 1.000 0.000
Papua New Guinea 5 6 4 0.217 0.255 0.683
Maldives 5 5 5 0.231 0.210 0.396
Bhutan 5 5 4 0.208 0.251 0.268
Micronesia, Federated States of 3 2 1 0.346 0.534 1.000
Marshall Islands 4 1 0.254 0.000 1.000
Kazakhstan 2 7 0.500 1.000 0.000
Uzbekistan 1 7 5 1.000 0.335 0.360
Samoa 3 3 3 0.357 0.369 0.430
Solomon Islands 2 1 0.835 1.000 0.000
Kiribati 1 1 1 1.000 1.000 1.000
Tonga 1 1.000 0.000 0.000
Vanuatu 1 1.000 0.000 0.000
Cook Islands 1 1 1 1.000 1.000 1.000
Tuvalu 1 1 1 1.000 1.000 1.000
Georgia 2 0.000 0.000 0.751
Armenia 2 0.000 0.000 0.625
Azerbaijan 3 3 0.000 0.441 0.364
Palua 1 0.000 0.000 1.000
Regional 1 0.000 1.000 0.000
Total 10 10 10 0.178 0.151 0.156
ADF = Asian Development Fund, Lao PDR = Lao People’s Democratic Republic, HHI = Hirschmann-Herfindahl Index.a The Hirschmann-Herfindahl Index formula is �[n/p]2 where n is the number of loans a developing member country (DMC) has in each sector, p is the
DMC’s total number of loans, and the squares of n/p are summed across all sectors. The maximum index value of 1 is reached only if all of a DMC’s loans are in a single sector; the minimum index value approaches 0 as the total number of loans increases and they are spread evenly across all sectors.
Source: Asian Development Bank Management Information System.
Appendix 9
Sector Selectivity of ADF Operations

162162
Appendix 9
Table A9.2: Distribution of Ongoing ADF Loans in 2002, by Country and Sector
(number of loans; sorted by country with most number of loans)
Country
Sector Total No. of Loans
Total No. of
Sectors
No. of Loans/ Sector HHIaAG ED ENE FI HL IN LW MS TC WS
Pakistan 14 5 2 2 3 5 2 4 37 8 4.6 0.207
Viet Nam 10 4 1 2 2 2 1 5 4 31 9 3.4 0.178
Bangladesh 13 4 5 0 1 1 6 1 31 8 3.9 0.259
Sri Lanka 13 3 2 1 0 2 1 6 1 29 9 3.2 0.268
Lao PDR 6 3 2 2 1 1 2 5 2 24 9 2.7 0.153
Cambodia 5 4 1 2 2 1 1 2 4 1 23 10 2.3 0.138
Nepal 9 2 2 1 0 1 1 1 4 21 9 2.3 0.247
Mongolia 3 2 1 4 3 1 1 1 16 8 2.0 0.164
Indonesia 11 2 0 0 1 1 15 6 2.5 0.564
Kyrgyz Republic 2 1 0 0 0 1 2 2 3 1 12 10 1.2 0.167
Tajikistan 2 0 2 0 0 1 2 1 1 9 9 1.0 0.185
Philippines 5 0 0 0 2 1 8 6 1.3 0.469
Papua New Guinea 2 1 0 1 1 1 6 6 1.0 0.222
Maldives 0 1 2 0 0 1 1 1 6 8 0.8 0.222
Bhutan 0 1 1 2 0 1 1 6 7 0.9 0.222
Micronesia, Fed. States of 0 0 0 0 1 2 1 4 7 0.6 0.375
Marshall Islands 0 1 0 0 1 1 1 4 7 0.6 0.250
Samoa 0 1 1 1 0 3 5 0.6 0.333
Kazakhstan 1 1 0 0 0 2 5 0.4 0.500
Solomon Islands 0 0 0 0 0 1 1 2 7 0.3 0.500
Afghanistan 0 0 0 0 0 1 1 6 0.2 1.000
Uzbekistan 0 1 0 0 0 1 5 0.2 1.000
Kiribati 0 0 0 0 0 1 1 6 0.2 1.000
Tonga 0 0 0 0 0 1 1 6 0.2 1.000
Vanuatu 0 0 0 0 0 1 1 6 0.2 1.000
Cook Islands 0 0 0 0 0 1 1 6 0.2 1.000
Tuvalu 0 1 0 0 0 1 5 0.2 1.000
Total 96 38 22 18 18 9 16 17 37 25 296 10 29.6 0.164
ADF = Asian Development Fund; AG = agriculture and natural resources; ED = education; ENE = energy; FI = finance; HHI = Hirschmann-Herfindahl Index; HL = health, nutrition, and social protection; IN = industry and trade; Lao PDR = Lao People’s Democratic Republic; LW = law, economic management, and public policy; MS = multisector; TC = transport and communications; WS = water supply and sanitation.a The Hirschmann-Herfindahl Index formula is �[n/p]2 where n is the number of loans a developing member country (DMC) has in each sector, p is the
DMC’s total number of loans, and the squares of n/p are summed across all sectors. The maximum index value of 1 is reached only if all of a DMC’s loans are in a single sector; the minimum index value approaches 0 as the total number of loans increases and they are spread evenly across all sectors.
Source: Asian Development Bank Management Information System.

163163
Sector
Selectivity
of ADF
Operations
Table A9.3: Distribution of Ongoing ADF Loans in 2002, by Country and Sector
( million; sorted by country with highest total loan amount)
Country
Sector Total Loan
Amount
Total No. of
Sectors
Loan Amount/
Sector HHIaAG ED ENE FI HL IN LW MS TC WS
Pakistan 1,087.2 298.0 105.0 6.0 143.0 201.0 215.0 188.8 2,244.0 8 280.5 0.283
Viet Nam 594.8 184.0 100.0 80.0 111.3 68.5 70.0 445.0 260.0 1,913.6 9 212.6 0.189
Bangladesh 507.2 297.0 419.0 40.0 65.0 476.8 60.0 1,865.0 7 266.4 0.218
Sri Lanka 334.1 88.8 150.0 85.0 26.0 70.0 321.5 75.0 1,150.4 8 143.8 0.199
Nepal 147.7 49.6 210.0 7.3 17.2 30.0 46.0 205.0 712.8 8 89.1 0.224
Indonesia 382.2 115.0 65.0 43.2 605.4 4 151.3 0.451
Cambodia 99.2 78.0 18.6 20.0 40.0 15.6 10.0 75.0 173.0 20.0 549.4 10 54.9 0.181
Lao PDR 74.0 60.0 82.0 19.0 20.0 10.9 47.0 159.0 45.0 516.9 9 57.4 0.173
Kyrgyz Republic 48.5 13.7 15.0 39.0 15.0 95.0 36.0 262.2 7 37.5 0.216
Mongolia 26.9 23.0 40.0 41.7 23.9 6.8 25.0 20.1 207.4 8 25.9 0.145
Tajikistan 40.3 54.0 10.0 25.0 20.0 3.6 152.9 6 25.5 0.243
Afghanistan 150.0 150.0 1 150.0 1.000
Philippines 79.5 34.7 18.5 132.7 3 44.2 0.447
Papua New Guinea 11.6 20.0 9.6 10.0 15.3 66.5 5 13.3 0.217
Maldives 6.3 15.0 5.0 8.0 9.5 43.8 5 8.8 0.231
Bhutan 6.9 10.0 8.0 5.7 9.6 40.2 5 8.0 0.208
Micronesia, Fed. States of 8.0 13.0 10.6 31.6 3 10.5 0.346
Marshall Islands 6.8 9.3 8.0 7.0 31.1 4 7.8 0.254
Kazakhstan 10.0 10.0 20.0 2 10.0 0.500
Uzbekistan 20.0 20.0 1 20.0 1.000
Samoa 7.0 6.0 3.5 16.5 3 5.5 0.357
Solomon Islands 1.0 10.0 11.0 2 5.5 0.835
Kiribati 10.2 10.2 1 10.2 1.000
Tonga 10.0 10.0 1 10.0 1.000
Vanuatu 10.0 10.0 1 10.0 1.000
Cook Islands 2.2 2.2 1 2.2 1.000
Tuvalu 1.8 1.8 1 1.8 1.000
Total 3,443.1 1,286.0 1,209.6 280.1 505.2 163.2 360.2 557.5 2,002.4 970.3 10,777.7 10 1,077.8 0.178
ADF = Asian Development Fund; AG = agriculture and natural resources; ED = education; ENE = energy; FI = finance; HHI = Hirschmann-Herfindahl Index; HL = health, nutrition, and social protection; IN = industry and trade; Lao PDR = Lao People’s Democratic Republic; LW = law, economic management, and public policy; MS = multisector; TC = transport and communications; WS = water supply and sanitation.a The Hirschmann-Herfindahl Index formula is �[n/p]2 where n is the number of loans a developing member country (DMC) has in each sector, p is the
DMC’s total number of loans, and the squares of n/p are summed across all sectors. The maximum index value of 1 is reached only if all of a DMC’s loans are in a single sector; the minimum index value approaches 0 as the total number of loans increases and they are spread evenly across all sectors.
Source: Asian Development Bank Management Information System.

164164
Appendix 9
Table A9.4: Distribution of Ongoing ADF Loans in 2006, by Country and Sector
(number of loans; sorted by country with most loans)
Country
Total No. of Loans
Total No. of Sectors
Total No. of Loans/
Sector HHIaAG ED ENE FI HL IN LW MS TC WS
Pakistan 11 7 2 4 2 2 7 15 4 2 56 10 5.6 0.157
Sri Lanka 10 5 1 2 1 1 7 5 4 36 9 4.0 0.171
Viet Nam 10 5 3 3 3 3 5 3 35 8 4.4 0.159
Bangladesh 7 6 4 2 1 3 4 4 1 32 9 3.6 0.145
Lao PDR 6 3 1 4 1 1 3 4 1 24 9 2.7 0.156
Nepal 7 4 1 2 1 1 2 5 23 8 2.9 0.191
Cambodia 4 3 3 1 1 2 1 2 2 2 21 10 2.1 0.120
Mongolia 2 2 1 3 3 1 2 2 2 18 9 2.0 0.123
Indonesia 5 2 2 3 5 17 5 3.4 0.232
Tajikistan 3 1 2 1 1 1 3 12 7 1.7 0.181
Afghanistan 2 2 1 3 3 11 5 2.2 0.223
Kyrgyz Republic 1 2 1 1 2 3 10 6 1.7 0.200
Papua New Guinea 2 1 1 2 1 7 5 1.4 0.224
Maldives 0 2 1 2 1 1 7 6 1.2 0.224
Bhutan 0 1 1 2 1 1 6 6 1.0 0.222
Micronesia, Fed. States of 2 2 4 2 2.0 0.500
Uzbekistan 1 1 1 3 3 1.0 0.333
Azerbaijan 1 1 1 3 3 1.0 0.333
Samoa 1 1 1 3 3 1.0 0.333
Tuvalu 2 2 1 2.0 1.000
Kiribati 1 1 1 1.0 1.000
Kazakhstan 1 1 1 1.0 1.000
Solomon Islands 1 1 1 1.0 1.000
Philippines 1 1 1 1.0 1.000
Cook Islands 1 1 1 1.0 1.000
Regional 1 1 1 1.0 1.000
Total 73 46 19 27 16 16 18 52 43 26 336 10 33.6 0.129
ADF = Asian Development Fund; AG = agriculture and natural resources; ED = education; ENE = energy; FI = finance; HHI = Hirschmann-Herfindahl Index; HL = health, nutrition, and social protection; IN = industry and trade; Lao PDR = Lao People’s Democratic Republic; LW = law, economic management, and public policy; MS = multisector; TC = transport and communications; WS = water supply and sanitation.a The Hirschmann-Herfindahl Index formula is �[n/p]2 where n is the number of loans a developing member country (DMC) has in each sector, p is the
DMC’s total number of loans, and the squares of n/p are summed across all sectors. The maximum index value of 1 is reached only if all of a DMC’s loans are in a single sector; the minimum index value approaches 0 as the total number of loans increases and they are spread evenly across all sectors.
Source: Asian Development Bank Management Information System.

165165
Sector
Selectivity
of ADF
OperationsTable A9.5: Distribution of Ongoing ADF Loans in 2006, by Country and Sector
( million; sorted by country with highest total loan amount)
Country
Sector Total Loan
Amount
Total No. of
Sectors
Loan Amount/
Sector HHIaAG ED ENE FI HL IN LW MS TC WS
Pakistan 754.6 325.0 20.0 106.0 83.0 23.0 163.8 811.8 84.0 90.0 2,461.2 10 246.1 0.230
Bangladesh 301.1 408.9 182.6 45.6 30.0 50.0 350.0 323.0 41.0 1,732.2 9 192.5 0.175
Viet Nam 523.5 223.0 145.0 116.2 88.5 128.1 255.5 157.2 1,637.0 9 181.9 0.176
Sri Lanka 224.1 168.8 70.0 15.0 6.0 10.0 213.0 251.5 231.8 1,190.2 9 132.2 0.174
Afghanistan 115.5 61.5 48.0 322.2 188.2 735.4 5 147.1 0.293
Indonesia 191.3 150.0 100.2 97.2 177.1 715.8 8 89.5 0.215
Nepal 151.0 99.6 50.0 63.3 30.0 30.0 66.0 194.0 683.9 8 85.5 0.177
Cambodia 58.6 63.0 82.9 10.0 20.0 35.6 10.0 43.2 92.0 26.3 441.6 10 44.2 0.139
Lao PDR 68.8 48.9 30.0 29.0 20.0 10.9 46.6 104.7 20.0 378.9 9 42.1 0.160
Mongolia 19.9 27.0 40.0 33.7 26.0 5.0 15.5 62.1 48.3 277.5 9 30.8 0.143
Tajikistan 63.2 7.5 55.5 4.0 7.5 10.7 64.5 212.9 7 30.4 0.253
Kyrgyz Republic 36.0 28.0 10.5 7.5 41.0 77.8 200.8 6 33.5 0.248
Papua New Guinea 11.6 20.0 9.6 37.0 15.3 93.5 6 15.6 0.255
Uzbekistan 27.6 30.0 25.0 82.6 7 11.8 0.335
Bhutan 7.0 9.4 13.0 27.3 24.6 81.3 5 16.3 0.251
Maldives 12.3 8.0 9.8 9.5 6.0 45.6 5 9.1 0.210
Azerbaijan 22.0 3.0 20.0 45.0 3 15.0 0.441
Micronesia, Fed.
States of13.0 22.2 35.2 2 17.6 0.534
Samoa 8.1 3.5 8.0 19.6 3 6.5 0.369
Kiribati 10.2 10.2 1 10.2 1.000
Kazakhstan 10.0 10.0 7 1.4 1.000
Solomon Islands 10.0 10.0 1 10.0 1.000
Philippines 8.8 8.8 8 1.1 1.000
Tuvalu 3.8 3.8 1 3.8 1.000
Cook Islands 2.8 2.8 1 2.8 1.000
Regional 1.5 1.5 1 1.5 1.000
Total 2,578.8 1,602.9 609.9 502.2 422.2 240.7 387.5 2,215.8 1,647.6 909.7 11,117.4 10 1,111.7 0.151
ADF = Asian Development Fund; AG = agriculture and natural resources; ED = education; ENE = energy; FI = finance; HHI = Hirschmann-Herfindahl Index; HL = health, nutrition, and social protection; IN = industry and trade; Lao PDR = Lao People’s Democratic Republic; LW = law, economic management, and public policy; MS = multisector; TC = transport and communications; WS = water supply and sanitation.a The Hirschmann-Herfindahl Index formula is �[n/p]2 where n is the number of loans a developing member country (DMC) has in each sector, p is the
DMC’s total number of loans, and the squares of n/p are summed across all sectors. The maximum index value of 1 is reached only if all of a DMC’s loans are in a single sector; the minimum index value approaches 0 as the total number of loans increases and they are spread evenly across all sectors.
Source: Asian Development Bank Management Information System.
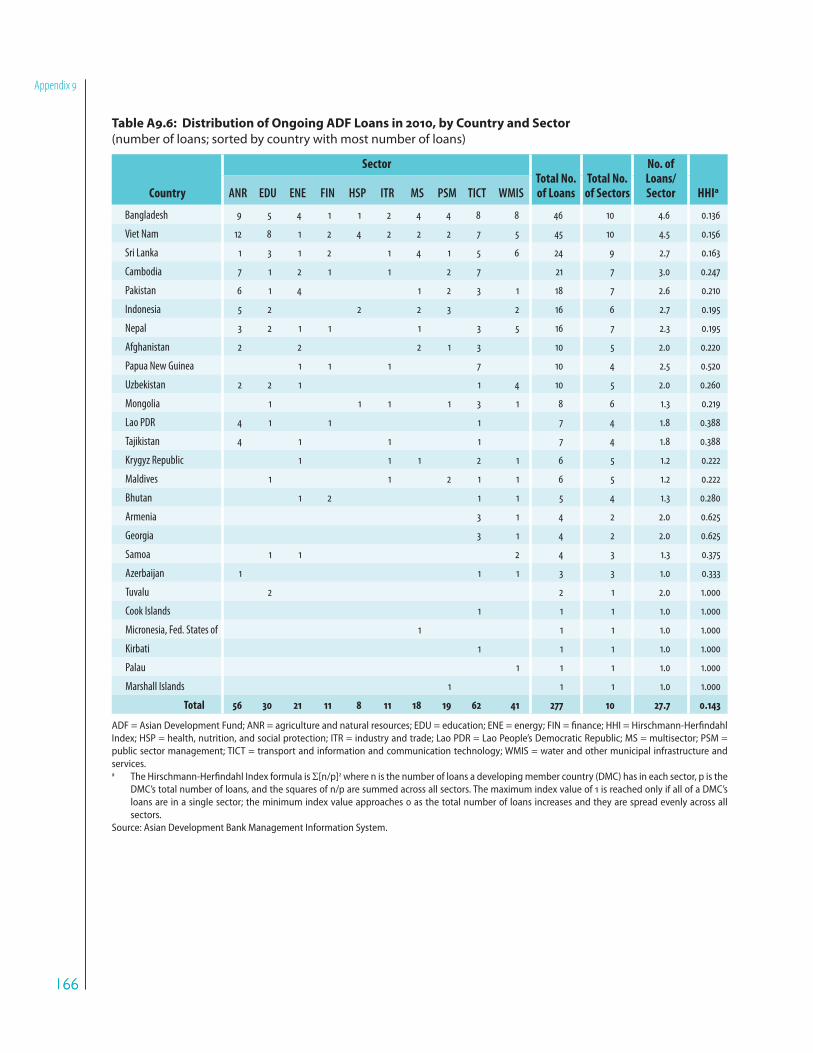
166166
Appendix 9
Table A9.6: Distribution of Ongoing ADF Loans in 2010, by Country and Sector
(number of loans; sorted by country with most number of loans)
Country
SectorTotal No. of Loans
Total No. of Sectors
No. of Loans/ Sector HHIaANR EDU ENE FIN HSP ITR MS PSM TICT WMIS
Bangladesh 9 5 4 1 1 2 4 4 8 8 46 10 4.6 0.136
Viet Nam 12 8 1 2 4 2 2 2 7 5 45 10 4.5 0.156
Sri Lanka 1 3 1 2 1 4 1 5 6 24 9 2.7 0.163
Cambodia 7 1 2 1 1 2 7 21 7 3.0 0.247
Pakistan 6 1 4 1 2 3 1 18 7 2.6 0.210
Indonesia 5 2 2 2 3 2 16 6 2.7 0.195
Nepal 3 2 1 1 1 3 5 16 7 2.3 0.195
Afghanistan 2 2 2 1 3 10 5 2.0 0.220
Papua New Guinea 1 1 1 7 10 4 2.5 0.520
Uzbekistan 2 2 1 1 4 10 5 2.0 0.260
Mongolia 1 1 1 1 3 1 8 6 1.3 0.219
Lao PDR 4 1 1 1 7 4 1.8 0.388
Tajikistan 4 1 1 1 7 4 1.8 0.388
Krygyz Republic 1 1 1 2 1 6 5 1.2 0.222
Maldives 1 1 2 1 1 6 5 1.2 0.222
Bhutan 1 2 1 1 5 4 1.3 0.280
Armenia 3 1 4 2 2.0 0.625
Georgia 3 1 4 2 2.0 0.625
Samoa 1 1 2 4 3 1.3 0.375
Azerbaijan 1 1 1 3 3 1.0 0.333
Tuvalu 2 2 1 2.0 1.000
Cook Islands 1 1 1 1.0 1.000
Micronesia, Fed. States of 1 1 1 1.0 1.000
Kirbati 1 1 1 1.0 1.000
Palau 1 1 1 1.0 1.000
Marshall Islands 1 1 1 1.0 1.000
Total 56 30 21 11 8 11 18 19 62 41 277 10 27.7 0.143
ADF = Asian Development Fund; ANR = agriculture and natural resources; EDU = education; ENE = energy; FIN = finance; HHI = Hirschmann-Herfindahl Index; HSP = health, nutrition, and social protection; ITR = industry and trade; Lao PDR = Lao People’s Democratic Republic; MS = multisector; PSM = public sector management; TICT = transport and information and communication technology; WMIS = water and other municipal infrastructure and services.a The Hirschmann-Herfindahl Index formula is �[n/p]2 where n is the number of loans a developing member country (DMC) has in each sector, p is the
DMC’s total number of loans, and the squares of n/p are summed across all sectors. The maximum index value of 1 is reached only if all of a DMC’s loans are in a single sector; the minimum index value approaches 0 as the total number of loans increases and they are spread evenly across all sectors.
Source: Asian Development Bank Management Information System.

167167
Sector
Selectivity
of ADF
Operations
Table A9.7: Distribution of Ongoing ADF Loans in 2010, by Country and Sector
( million; sorted by country with highest total loan amount)
Sector Total Loan
Amount
Total No. of
Sectors
Loan Amount/
Sector HHIaCountry ANR EDU ENE FIN HSP ITR MS PSM TICT WMIS
Bangladesh 409.8 368.9 115.0 3.0 30.0 81.0 335.0 319.9 350.7 598.0 2,611.3 10 261.1 0.150
Viet Nam 808.8 324.0 151.0 90.0 146.9 18.5 60.0 50.0 540.5 274.2 2,463.9 10 246.4 0.195
Sri Lanka 20.0 120.0 25.0 15.0 50.0 95.8 10.0 255.9 306.6 898.3 9 99.8 0.232
Afghanistan 115.5 61.5 317.2 48.0 188.2 730.4 5 146.1 0.291
Pakistan 345.0 16.0 50.0 220.0 13.8 18.0 38.0 700.8 7 100.1 0.351
Indonesia 171.3 130.0 85.2 76.5 97.2 50.6 610.8 6 101.8 0.191
Nepal 70.0 45.0 65.0 60.4 12.8 104.5 244.0 601.7 7 86.0 0.236
Uzbekistan 42.6 60.0 10.0 115.0 255.0 482.6 5 96.5 0.360
Cambodia 83.7 25.0 64.3 10.0 15.6 20.0 198.3 416.9 7 59.6 0.298
Papua New Guinea 16.4 13.0 25.0 247.0 301.4 4 75.4 0.683
Georgia 233.8 40.0 273.8 2 136.9 0.751
Mongolia 13.0 43.1 5.0 2.0 85.1 35.2 183.5 6 30.6 0.313
Armenia 107.9 36.0 143.9 2 72.0 0.625
Kyrgyz Republic 16.7 7.5 48.5 51.0 16.5 140.2 5 28.0 0.283
Tajikistan 59.0 21.5 10.7 40.9 132.1 4 33.0 0.328
Bhutan 29.0 13.0 27.3 24.6 93.9 4 23.5 0.268
Lao PDR 46.3 8.9 2.3 17.7 75.2 4 18.8 0.449
Maldives 6.0 7.5 36.5 5.3 6.0 61.3 5 12.3 0.396
Azerbaijan 22.0 10.0 20.0 52.0 3 17.3 0.364
Samoa 8.1 26.6 10.8 45.5 3 15.2 0.430
Micronesia, Fed.
States of14.2 14.2 1 14.2 1.000
Kiribati 12.0 12.0 1 12.0 1.000
Marshall Islands 9.5 9.5 1 9.5 1.000
Cook Islands 6.9 6.9 1 6.9 1.000
Tuvalu 3.8 3.8 1 3.8 1.000
Palau 3.4 3.4 1 3.4 1.000
Total 2,194.0 1,128.7 652.0 206.7 305.2 220.8 1,179.9 606.9 2,616.0 1,958.9 11,069.1 10 1,106.9 0.156
ADF = Asian Development Fund, ANR = agriculture and natural resources; EDU = education; ENE = energy; FIN = finance; HHI = Hirschmann-Herfindahl Index; HSP = health and social protection; ITR = industry and trade; Lao PDR = Lao People’s Democratic Republic; MS = multisector; PSM = public sector management; TICT = transport and information and communication technology; WMIS = water and other municipal infrastructure and services.a The Hirschmann-Herfindahl Index formula is �[n/p]2 where n is the number of loans a developing member country (DMC) has in each sector, p is the
DMC’s total number of loans, and the squares of n/p are summed across all sectors. The maximum index value of 1 is reached only if all of a DMC’s loans are in a single sector; the minimum index value approaches 0 as the total number of loans increases and they are spread evenly across all sectors.
Source of basic data: Asian Development Bank Management Information System.

168168
Appendix 10
Appendix 10
Progress Made in Implementing the
Recommendations from the 2007 Special
Evaluation Study
No. SES Recommendation Management Response
1 The ADF’s size should increase if it is to accelerate the
achievement of the MDGs. Despite its modest size relative to
the massive challenge of development, the ADF can be an effective
instrument in achieving the MDGs in a range of countries if the
congested agenda and project administration issues are addressed. The
size of the ADF is important, not only for the acceleration of poverty
reduction and attention to non-income MDG concerns, but also to
ensure the leverage needed to achieve policy change and governance
objectives in weakly performing countries and other DMCs. Increased
blending of OCR loans with ADF components to target capacity
development may add significant value to the projects in many blend
countries.
We agree with the SES recommendation to ADF donors that the ADF’s size should increase if
it is to accelerate the achievement of the MDGs. We believe that a certain critical mass has to
be deployed not only to achieve poverty reduction and address non-income MDGs, but also to
ensure the leverage needed to achieve policy change and governance objectives.
2 ADF donors should consider the role and credibility of the ADF
as ADB’s main special- purpose vehicle for addressing poverty
and achieving the MDGs in the Asia and Pacific region. The
ADF currently addresses a subset of countries with only 18 of the
poor. Given ADB’s graduation policy, this proportion will decrease at
the start of ADF X. Some DMCs with large poor populations (notably
People’s Republic of China, India, Philippines, and soon Indonesia)
are not allocated ADF resources for projects and programs, whereas
the official development assistance per capita they receive is low by
comparison. With expanding reflows from earlier ADF loans and new
contributions from ADF donors, ADF X may provide an opportunity
to address this issue, perhaps through set- asides to cap otherwise
large PBAs to populous countries. Alternative options are to revisit
the ADF graduation policy, or to consider a third window to provide
concessional resources (or transfers of net income from OCR) with
financing on terms harder than for the ADF but softer than for OCR to
more creditworthy countries that are below the gross domestic product
per capita cutoff. An increase in the number of eligible countries should
not lead to a reduced allocation to the existing ADF recipients. A critical
mass in poor countries is needed for policy leverage.
3 ADF X should avoid goal congestion in operations and in ADB
as a whole. The 1999 Poverty Reduction Strategy and the ADF VIII
and ADF IX donor reports have broadened ADB’s policy aspirations.
The unintended effect of the ADF donor meetings may be a very broad
agenda of priorities when DMCs are not involved to the same extent.
New activities have implications for ADB staffing and human resources,
and these are difficult to provide when ADB shareholders have placed
strict limits on increasing ADB’s budget. The report for the ADF X
replenishment should include a small number of feasible priorities and
targets that are achievable with available resources, are measurable,
and have clear baseline values. The new LTSF should provide further
guidance. The ADF should support focused operations. A new inclusive
growth objective should not lead to overly inclusive project designs;
inclusive growth, like poverty reduction, should be addressed at the
country strategy level.
We fully agree that ADB should avoid “goal congestion” in its ADF operations. This objective
has already been anchored in the selectivity approach of MTS II, and is also a crucial
component of LTSF 2008–2020 currently being finalized.

169169
Progress
Made in
Implementing
the Recom-
mendations
from the 2007
Special Evalu-
ation Study
Action Taken by Management IED’s Comments
ADF assistance increased substantially under ADF X. Average annual approvals are projected to
reach 3.2 billion under ADF X compared with 2 billion under ADF IX. This increase reflects the
strong demand from ADF countries affected by the economic crisis and the timely response by
ADB, which was made possible by the larger ADF X replenishment (equivalent to 11.8 billion
compared with 7 billion in ADF IX).
ADB successfully negotiated with donors a larger envelope for ADF
X; hence, the recommendation for the replenishment period is fully
addressed.
ADB’s overall mandate is to reduce poverty in the region. Hence, all ADB operations (OCR and ADF
combined) seek in one way or another to address the need of the poor. This is not limited to ADF
operations.
The regulations of the ADF clearly indicate that it should focus on the less developed members
among ADB’s DMCs, and should carefully consider other financing sources the country can attract.
While it is correct that a substantial number of poor people in Asia reside in middle- income
countries that do not have access to the ADF, this fact does not warrant that the ADF should
redirect its assistance to those countries. Doing so would redirect limited ADF resources to a small
number of large middle- income countries with substantial access to other financing sources,
including ADB’s OCR, and away from a large number of smaller and substantially poorer countries,
for which the ADF is a crucial source of assistance, in the absence of sustained capital inflows and
limited or non-existent capacity to borrow on non-concessional terms.
Under ADF X, a soft cap was introduced on ADF allocation to blend countries. As a result, a greater
share of total ADF allocation went to ADF-only countries (35 under ADF X versus 29 under ADF
IX).
The mandate to expand access to ADF resources lies with the donors.
Under the current mandate, it is not relevant to address poverty reduction
in middle-income countries that are homes to millions of the poor. ADB
has demonstrated that in selected countries OCR-funded projects have had
direct relevance to the poverty needs of the poor. However, it should be
noted that ADB’s vision of a poverty-free Asia and Pacific region cannot be
achieved by “trickle down” alone and hence will require concerted efforts
from respective governments in a more tangible and substantial way.
The concern to reach out to poor populations in middle- income countries
through ADB assistance can be partly addressed by ensuring that OCR
projects are carried out in less developed areas.
The spirit of the recommendation was not to divert current allocation to
middle-income countries, but to seek an expanded envelope to cover the
poor in those countries. The recommendation is considered not addressed.
Under Strategy 2020, ADB decided to be more selective and focused in its operations based on
DMC needs, ADB’s comparative strengths, and to ensure complementarities of efforts with other
development partners. To maximize results, efficiency, and impact, Strategy 2020 identified
five core areas of operations (infrastructure, finance, education, environment, and regional
cooperation) where ADB operations are expected to increasingly concentrate. ADF deputies
endorsed this approach in the ADF X donors’ report, reducing further the number of core sectors to
two (education and infrastructure), which appeared especially relevant in the ADF context. Under
ADF X, about 75 of total ADF approvals are expected to be concentrated in these two sectors.
ADB has generally moved away from direct poverty targeting within
projects, towards more systemic approaches of addressing poverty at
the country level. The level of project complexity has slightly decreased
in recent years. Sector focus has increased under Strategy 2020. The
recommendation has been largely achieved.
Table continues on next page
170170
Appendix 10 No. SES Recommendation Management Response
4 The ADF needs to be more selective in its support for sectors
(and within them, the subsectors) in many countries. ADB
should continue reviewing sector focus at the corporate level, but
especially at the country level. Some country programs spread
resources thinly, and the operations in some sectors have little critical
mass. While past success needs to be studied carefully, low historical
success rates should not automatically lead the ADF to turn away from
sectors with greater challenges in some countries. Creative staffing
solutions need to be found if complex operations that are responsive to
binding constraints and appropriate to some sectors require more staff
input than hitherto assigned.
We fully agree with this recommendation. In the ongoing ADF X replenishment
negotiations, donors have for their part supported the need for selectivity, and the
emerging consensus is that the ADF should focus on what it has been doing best
over the years, mainly infrastructure projects that will address poverty reduction in
an indirect manner through economic growth and job opportunities, and increased
access to markets and social services (health services, water and sanitation, and
education).
5 Poverty reduction is an appropriate goal for ADF operations,
and requires more than direct targeting of the poor in each
country. ADB and ADF IX have already internalized this lesson of ADF
VIII. It should not be lost. Poverty reduction is generally driven by an
appropriate mix of operations addressing inclusive growth and social
development. In some weakly performing countries or conflict-affected
countries, attention to targeting the poor may be more appropriate,
while governance reforms may be less feasible. More effort is needed
in addressing the non-income dimensions of poverty embodied in the
MDGs, as well as in reducing inequality. In most transition economies,
it remains important to strengthen the institutional framework to
develop a market economy.
We agree with the SES recommendation that poverty reduction should be the main goal of
ADF operations. We also support the SES finding that poverty reduction requires more than
direct targeting of the poor in each country. As stated in the SES, we have already internalized
this lesson of ADF VIII into our operations.
6 An ADF geared to poverty reduction and governance is staff
intensive and needs specialized skills. Poverty reduction and
good governance are challenging goals. Increased stakeholders’
demands for development effectiveness, due diligence and safeguards,
transparency, governance, gender, knowledge management, and
targeting of the poor require a staff-intensive approach to project
processing and administration. ADB staff need to expand. ADB should
continue to expand its staff contingent in resident missions, rather
than rely on loan or TA consultants posted to project implementation
units, as the latter often lack authority (and possibly credibility)
vis-à-vis executing agencies. If expanding the staff is impossible,
an improvement over the present situation would be more reliance
on long-term ADB staff consultants, or on TA consultants posted to
resident missions, to assist directly with project administration. In the
long run, however, this alternative would be suboptimal, particularly
for effective knowledge management.
We acknowledge this SES recommendation. As part of the HRS adopted in October 2004,
measures are being introduced to address ADB’s skills mix issues and skills gaps. We have
also aligned our skills mix more closely with the priorities of MTS II. Subsequent to the staff
engagement survey undertaken in early 2008 and the adoption of LTSF (2008–2020), we will
review the HRS with the assistance of external experts and plan for appropriately increasing
investments, if required. This review of the HRS will include the staffing issues to implement
ADF operations and the specific requirements in resident missions.
7 Aid harmonization and coordination remain necessary
elements of the ADF approach. ADB should continue to pursue the
harmonization of aid processes and procedures, taking into account
marginal costs and benefits. Coordination of country programs among
major donors to increase sector specializations should be the priority,
and should complement ADB’s move toward less goal congestion.
Attempts to advance the harmonization agenda through increased
sector selectivity should be accompanied by country-led agreements
regarding the division of labor among major aid agencies. ADB should
investigate how to reduce the administrative costs involved in forging
partnerships and, more generally, the implementation of the Paris
Declaration. ADB needs to help governments to reduce their own
transaction costs in dealing with multiple aid agencies. ADF donors can
improve overall aid harmonization by increasing their contribution,
as the ADF and IDA modalities are set up in part to ensure this among
otherwise more fragmented aid systems.
We agree with the SES finding that donor harmonization and aid coordination are crucial for
aid effectiveness. We also agree that coordination of country programs among major donors
to increase sector specialization should be a priority. However, as the implementation of the
Paris Declaration should be, and in fact is, mostly countrydriven, an effective division of labor
between various actors depends significantly on country-specific circumstances.

171171
Progress
Made in
Implementing
the Recom-
mendations
from the 2007
Special Evalu-
ation Study
Action Taken by Management IED’s Comments
This is in line with Strategy 2020 and the ADF X donors report. See point 3 above. ADF X is closely aligned with Strategy 2020, and ADF approvals
have demonstrated greater alignment with ADF X strategic and
operational objectives. Sector selectivity at the country level has
improved in some countries, although sector distribution varies
widely across countries. The spirit of the recommendation has been
achieved.
Under Strategy 2020, ADB moved away from direct poverty targeting. Under ADF X, about two
thirds of ADF interventions are estimated to be general interventions, while about one third are
targeted interventions. To ensure inclusiveness, ADF investment operations not only involve large
infrastructure projects, but also strongly focus on basic infrastructure such as rural roads, water
supply, sanitation, and electricity provision in rural areas.
ADB has adopted an inclusive sustainable growth concept under Strategy
2020, and the operations are accordingly guided. Needs of disadvantaged
communities continue to remain, and the inclusive growth approach only
partly addresses this concern. Social protection of vulnerable populations
and fragile environments should not be overlooked. Efforts to address
non-income poverty are not adequate, and more needs to be done in
assisting DMCs to progress in achieving MDGs.
Through the review of the HRS by external experts in 2008, preparation of the HR action plan in
2009, and the approval of our People Strategy and the HR Function strategic framework in early
2010, ADB has made significant progress in implementing HR reforms. The objective of these
reforms is to improve the recruitment, management, and development of ADB’s workforce to
successfully implement Strategy 2020.
The WPBF 2010−2012 presented the requirement for 500 additional positions to remedy current
staff shortages and implement the growing portfolio of projects effectively. Subsequently in the
2010 and 2011 budgets, the Board approved significant increases in the number of staff (250 in
2010 and 160 in 2011), including staff in resident missions (67 in 2010 and 59 in 2011, representing
27 and 37 of new positions added, respectively). In terms of skills mix, 24 positions were
added for safeguards, 5 for governance and public sector management, 14 for gender and social
development over 2010−2011, while 7 positions were added for knowledge management.
The spirit of the recommendation has been fully addressed, and several
initiatives are ongoing within ADB.
Under the Paris Declaration, ADB and other development partners committed to coordinate
and harmonize their assistance to increase aid effectiveness. The ADF X donors report further
highlighted the importance of donor coordination as a special consideration to be pursued across
all ADF operations. Partnerships are being sought at all levels (country, sector, and project). Details
of collaboration are usually worked out at the country level through the CPS. Under the CPS, ADB
operations are chosen in close partnership with other agencies to ensure complementarities of
efforts. All CPSs are accompanied by a donor coordination matrix as a key supporting document.
In recent years, efforts have also been made to develop joint country strategies. For example, the
recently approved Tajikistan CPS covering 2001−2014 was designed as a joint strategy among 12
development partners and the government, and highlights key sectors on which each partner will
focus.
ADB measures its progress against the Paris Declaration indicators annually. The latest survey,
which was conducted in early 2010, showed that ADB is on track to meet most targets but needs to
improve the use of country procurement systems and program-based approaches.
ADB has done well in aid harmonization and coordination and it has met
or exceeded the 2010 targets of the Paris Declaration. ADB has initiated
a number of initiatives to improve internal efficiency (e.g., streamlined
business processes, eOperations Project, P3M, etc.). It is not clear to what
extent ADB has taken steps to reduce DMCs’ transaction costs in dealing
with multiple aid agencies, except for the adoption of sector-wide
approaches in education and health in a couple of countries. IED considers
the spirit of the recommendation to have been fully addressed.
Table continues on next page
172172
Appendix 10 No. SES Recommendation Management Response
8 Major governance issues should be addressed primarily
through program lending, with agreed-upon reforms being
supported by advisory and capacity development TA. Specialized
TA and capacity development-oriented loans can be utilized to
improve organizational and human resource aspects of governance
reforms, and in cases where use of program lending is not suitable
or agreed to. Governance components in some investment projects
can help build on earlier reforms or demonstrate good practice. Such
components, however, should be realistic with respect to prevailing
institutional capacity and not clutter the project agenda. ADB needs
to be more willing to suspend disbursements if progress on essential
governance reforms and capacity building is not being made. This also
applies to sector development programs, where reforms supported by
program components need to take place before the start of the project
investment components.
We believe this SES suggestion has to be qualified. The choice of lending modality should
be determined on a case-by-case basis. We note that when a country’s budget framework
and financial management system are weak, provision of program loans could involve a
significant degree of fiduciary risk. Also, one must recognize that governance efforts can also
be effectively pursued by focusing efforts on the key sectors in which we deliver investment
projects. Investment projects can also help strengthen institutions and capacity at the sector
level, as highlighted by GACAP II.
9 ADB should undertake a rigorous analysis to test the validity
of the various CPA indicators. This exercise should analyze what
are the binding constraints for development, as well as causal factors
for good economic performance, poverty reduction, achievement of
other development results, good portfolio performance, and project
success. Low average scores for certain countries may need to lead
to aid strategies different from those to be applied to countries with
high scores, rather than the automatic application of a low PBA. This
needs to be investigated better. OED recommended such an analysis,
and the DEC later endorsed it. The study should preferably be done in
partnership with the World Bank.
We note the SES recommendation. However, although not perfect, the present CPA system is
considered collectively by the MDBs and donors as the best practice presently available. It is
not clear if alternative methods cited by the SES, like tying allocations to DMCs’ commitments
to remove “binding constraints” to development, would be less subjective and produce more
comparable results across the range of ADF recipients.
General Response on the Soundness of the PBA System. The SES questions the
soundness of the PBA system introduced during ADF VIII. We maintain that the PBA system
is the best practice available for achieving the highest level of development effectiveness
with the limited resources we have. Like other MDBs, we acknowledge that it is not perfect,
and we endeavor to fine-tune it as we go along (for example, for the Manila meeting, we
plan to present donors with concrete proposals to attenuate some of the volatility and
unpredictability of PBA outcomes).
10 ADB needs to pursue a varied approach to debt distress of ADF
countries and not rely mainly on the institution of an ADF
grant mechanism. As a first step, ADB should work with IMF and
the World Bank to require that all DMCs, within 5 years, have a legal
framework related to public debt and are able to monitor and manage
their debt. Some further recommendations elaborating on the more
varied approach are in Appendix 12.a An evaluation of the advantages
and disadvantages of grants versus loans should be conducted. This
evaluation should be carried out in about 3 years, after ADB has gained
more experience with large ADF grants for investment projects and the
results are more evident.
While the main purpose of the ADF grant framework is to promote debt sustainability, we
agree with the SES observation that this instrument alone is insufficient. As the SES notes,
countries must have a sound legal framework to monitor and manage public debt—in
conjunction with sound macroeconomic management—to ensure that levels of public
debt do not become burdensome. The Bretton Woods institutions are leading initiatives to
strengthen debt management, and ADB will coordinate with them to ensure a consistent
approach.
General Response on the Usefulness of ADF Grants. The SES casts doubts on the
effectiveness of ADF grants. However, we believe that it is too early to make any judgment
calls on the usefulness for development outcomes of the ADF grant instrument, which was
introduced in ADF IX. And given that grants are processed, disbursed, and supervised in the
same way as ADF loans, it is difficult to see how they would provide fewer opportunities
for policy dialogue than loans. Finally, as the SES observes, our grants framework is closely
aligned with that of IDA, so that any changes would have to be embedded in a wider
reassessment of grants as a development tool.
ADB = Asian Development Bank, ADF = Asian Development Fund, CPA = country performance assessment, CPIA = country policy and institutional assessment, CPS = country partnership strategy, DEC = Development Effectiveness Committee, DMC = developing member country, GACAP II = second Governance and Anticorruption Action Plan, HR = human resources, HRS = Human Resources Strategy, IDA = International Development Association, IED = Independent Evaluation Department, IMF = International Monetary Fund, LTSF = long-term strategic framework, MDB = multilateral development bank, MDG = Millennium Development Goal, MFI = multilateral financial institution, MTS = medium-term strategy, OCR = ordinary capital resources, OED = Operations Evaluation Department (now the Independent Evaluation Department [IED]), P3M = project processing and portfolio management system, PBA = performance-based allocation, RAMP = risk assessment and management plan, SES = special evaluation study, SPD = Strategy and Policy Department, TA = technical assistance, WPBF = work program and budget framework.a IED. 2007. Special Evaluation Study: Asian Development Fund VIII and IX Operations. Manila: ADB.Sources: Independent Evaluation Department, and Strategy and Policy Department.
173173
Progress
Made in
Implementing
the Recom-
mendations
from the 2007
Special Evalu-
ation Study
Action Taken by Management IED’s Comments
The ADF operational approach to governance under ADF X is guided by GACAP II, under which
ADB introduced a thematic focus on (i) strengthening of country systems in public financial
management, procurement, and combating corruption; and (ii) adoption of a risk-based approach
to governance assessment and the development of risk management plans in priority sectors. The
approach is pursued through all ADB instruments, including program loans, project loans and TA.
As required by GACAP II, country-level risk assessments and management plans (RAMPs) have
been completed for 17 ADF countries and 33 sector-level RAMPs have been prepared in 14 ADF
countries.
Use of program loans increased in ADF X. Program loans are expected to account for 22.5 of
total approvals under ADF X, compared with 18 under ADF IX. This is attributed primarily to the
economic crisis, as ADB provided quick-disbursing program loans to help ADF countries deal with
the immediate impact of the crisis.
Program loans can also be used to facilitate DMC’s governance-related institutional reforms. These
two aspects of program lending (budget support on the one hand and policy-based lending on
the other hand) have been carefully considered in the ongoing work of review of policy-based
lending. A balanced perspective is required to decide on optimal lending modalities to suit the
contextual background of each DMC.
ADB has approved increasing levels of policy-based ADF support for
governance-related operations and public sector management. It is
a difficult area in which results may not be visible for several years. A
number of governance programs had to be closed due to noncompliance
with the tranche release requirements. ADB also needs to further
strengthen the implementation of GACAP II. IED believes that ADB has
addressed the spirit of the recommendation and hence considers it
achieved.
ADB is using a CPIA questionnaire developed by IDA in its CPA exercise. Although not perfect, the
current system is considered by the MDBs and donors as the best in assessing the overall policy
and institutional environment of the borrowing countries. The system itself is also evolving over
time into a better assessment framework. As an example, the Independent Evaluation Group of
the World Bank conducted an evaluation of the World Bank’s CPIA in 2009. The result confirmed
the usefulness of the system and overall relevance of the assessment contents. Some refinements
on a couple of clusters are expected to be reflected in the revised 2012 CPIA. ADB hosted an MDB/
MFI PBA workshop on 30−31 August 2010 and discussed the CPIA/CPA as part of the agenda.
Participants confirmed the overall validity of the system. MDBs/MFIs will continue their joint
efforts to improve the CPA/CPIA framework through annual PBA technical meetings. While CPA
scores are directly linked to the ADF allocation level, they also affect the grant/loan proportion
within the allocation together with the outcome of the debt sustainability analysis. Thus ADB will
continue to closely monitor and ensure the quality of the annual exercise. The outcome of the
exercise is being publicly disclosed and, although the narratives are kept confidential, regional
departments are encouraged to feed findings from the exercise into their operational strategies.
ADB refined the PBA mechanism in 2008, but the action does not address
the spirit of the recommendation.
ADB is working closely with IMF and the World Bank on debt sustainability issues in ADF countries
through joint training workshops for government officials on debt sustainability analysis, and
public debt management through regional TA (e.g., debt sustainability workshop, Public Debt
Management Forum). In 2008, two extra professional staff positions (economists) were allocated
to SPD to ensure that SPD actively undertakes missions to low-income countries to collaborate
with the IMF/World Bank on debt sustainability analyses.
In addition, ADB continues to provide support to DMCs, through loans and TA, sovereign and
nonsovereign operations, treasury operations including local currency bond issues, to strengthen
public finance management, develop domestic and regional capital markets (e.g., Asia Bond
Market Initiative), reform financial sectors, and improve investment climates including reforms of
legal and regulatory frameworks. These efforts continue to contribute to public debt management
and debt sustainability of our DMCs.
The recommendation to evaluate the advantages and disadvantages of ADF grants is welcome,
and IED would be the most appropriate department to carry out such an evaluation.
The spirit of the recommendation has been addressed, and IED considers
the recommendation to have been followed.
Not many grant projects or programs have been completed. Therefore, it is
too early to undertake such an evaluation at this stage.

174174
Appendix 11
Appendix 11
Technical Assistance and Performance of ADF
Projects and Programs
Table A11.1: Ratio of TA Approvals to Loan and Grant Approvalsa to ADF Eligible Countries, 2001–2010 (cents per dollar of loan and grant approval)
Country Group
PPTA ADTAb PPTA and ADTA
ADF VIII
ADF IX
ADFX
ADF VIII–X
ADF VIII
ADF IX
ADF X
ADF VIII–X
ADF VIII
ADF IX
ADF X
ADF VIII–X
ADF-only 2.42 2.09 1.22 1.85 5.89 4.46 1.98 3.91 8.31 6.55 3.20 5.76
Blend 0.91 0.50 0.44 0.59 1.54 0.94 0.41 0.95 2.45 1.44 0.85 1.54
Total 1.18 0.71 0.61 0.80 2.32 1.41 0.76 1.45 3.50 2.12 1.37 2.26
ADB = Asian Development Bank, ADF = Asian Development Fund, ADTA = advisory technical assistance, OCR = ordinary capital resources, PCR = project completion report, PPTA = project preparatory technical assistance, RRP = report and recommendation of the President, TA = technical assistance.a Includes the OCR loan component of blend-financed projects and OCR stand-alone projects for blend countries. Excludes loan, grant and TA approvals
to Uzbekistan during ADF VIII, and Cook Islands and Indonesia during ADF X.b Includes advisory, capacity development, and policy and advisory TA.Source: ADB database on Loan, TA, Grant, and Equity Approvals; RRPs and PCRs.

175175
Technical
Assistance and
Performance
of ADF
Projects and
Programs
Table A11.2: Number of Rateda ADF Projects/Programs With and Without PPTA
(approved from 2001–2010)
Country Classification/Country
Without PPTA With PPTA
HS/GS/S PS US Total HS/GS/S PS US Total
A. ADF-Only Countries 15 7 0 22 21 0 2 23
Afghanistan 2 1 0 3 1 0 0 1
Bhutan 0 0 0 0 2 0 0 2
Cambodia 3 0 0 3 4 0 0 4
Kyrgyz Republic 2 1 0 3 3 0 0 3
Lao PDR 0 1 0 1 4 0 0 4
Maldives 1 0 0 1 0 0 0 0
Mongolia 0 1 0 1 4 0 1 5
Nepal 0 2 0 2 0 0 0 0
Samoa 0 0 0 0 0 0 1 1
Tajikistan 6 0 0 6 3 0 0 3
Timor-Leste 1 0 0 1 0 0 0 0
Tonga 0 1 0 1 0 0 0 0
B. Blend Countries 12 9 4 25 15 4 6 25
Armenia 1 0 0 1 0 0 0 0
Azerbaijan 0 0 0 0 1 0 0 1
Bangladesh 1 0 0 1 1 0 0 1
Cook Islandsb 1 0 0 1 1 0 0 1
Georgia 2 0 0 2 0 0 0 0
Indonesiab 1 0 0 1 0 0 0 0
Marshall Islands 0 1 0 1 0 0 1 1
Micronesia, Federated States of 0 0 0 0 1 0 0 1
Pakistan 3 7 4 14 1 1 5 7
Papua New Guinea 0 1 0 1 0 1 0 1
Sri Lanka 0 0 0 0 3 2 0 5
Viet Nam 3 0 0 3 7 0 0 7
Total 27 16 4 47 36 4 8 48
ADB = Asian Development Bank, ADF = Asian Development Fund, GS = generally successful, HS = highly successful, IED = Independent Evaluation Department, Lao PDR = Lao People’s Democratic Republic, PCR = project/program completion report, PPTA = project preparatory technical assistance, PS = partly successful, RRP = report and recommendation of the President, S = successful, TA = technical assistance, US = unsuccessful.a Based on the latest performance assessment available (i.e., PCR, PCR validation report, or project/program performance evaluation report).b These countries were still ADF-eligible during a large part of the review period.Sources: ADB database on Loan, TA, Grant and Equity Approvals; IED database; PCRs; PCR validation reports; RRPs.
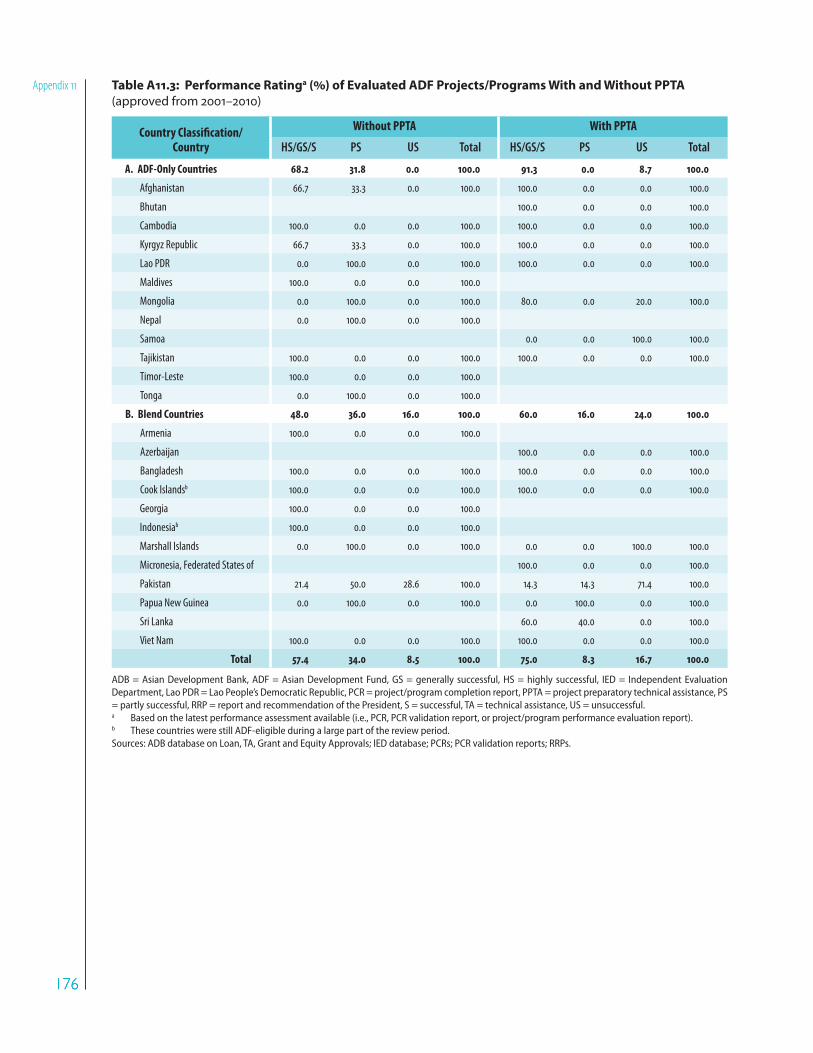
176176
Appendix 11 Table A11.3: Performance Ratinga (%) of Evaluated ADF Projects/Programs With and Without PPTA
(approved from 2001–2010)
Country Classification/Country
Without PPTA With PPTA
HS/GS/S PS US Total HS/GS/S PS US Total
A. ADF-Only Countries 68.2 31.8 0.0 100.0 91.3 0.0 8.7 100.0
Afghanistan 66.7 33.3 0.0 100.0 100.0 0.0 0.0 100.0
Bhutan 100.0 0.0 0.0 100.0
Cambodia 100.0 0.0 0.0 100.0 100.0 0.0 0.0 100.0
Kyrgyz Republic 66.7 33.3 0.0 100.0 100.0 0.0 0.0 100.0
Lao PDR 0.0 100.0 0.0 100.0 100.0 0.0 0.0 100.0
Maldives 100.0 0.0 0.0 100.0
Mongolia 0.0 100.0 0.0 100.0 80.0 0.0 20.0 100.0
Nepal 0.0 100.0 0.0 100.0
Samoa 0.0 0.0 100.0 100.0
Tajikistan 100.0 0.0 0.0 100.0 100.0 0.0 0.0 100.0
Timor-Leste 100.0 0.0 0.0 100.0
Tonga 0.0 100.0 0.0 100.0
B. Blend Countries 48.0 36.0 16.0 100.0 60.0 16.0 24.0 100.0
Armenia 100.0 0.0 0.0 100.0
Azerbaijan 100.0 0.0 0.0 100.0
Bangladesh 100.0 0.0 0.0 100.0 100.0 0.0 0.0 100.0
Cook Islandsb 100.0 0.0 0.0 100.0 100.0 0.0 0.0 100.0
Georgia 100.0 0.0 0.0 100.0
Indonesiab 100.0 0.0 0.0 100.0
Marshall Islands 0.0 100.0 0.0 100.0 0.0 0.0 100.0 100.0
Micronesia, Federated States of 100.0 0.0 0.0 100.0
Pakistan 21.4 50.0 28.6 100.0 14.3 14.3 71.4 100.0
Papua New Guinea 0.0 100.0 0.0 100.0 0.0 100.0 0.0 100.0
Sri Lanka 60.0 40.0 0.0 100.0
Viet Nam 100.0 0.0 0.0 100.0 100.0 0.0 0.0 100.0
Total 57.4 34.0 8.5 100.0 75.0 8.3 16.7 100.0
ADB = Asian Development Bank, ADF = Asian Development Fund, GS = generally successful, HS = highly successful, IED = Independent Evaluation Department, Lao PDR = Lao People’s Democratic Republic, PCR = project/program completion report, PPTA = project preparatory technical assistance, PS = partly successful, RRP = report and recommendation of the President, S = successful, TA = technical assistance, US = unsuccessful.a Based on the latest performance assessment available (i.e., PCR, PCR validation report, or project/program performance evaluation report).b These countries were still ADF-eligible during a large part of the review period.Sources: ADB database on Loan, TA, Grant and Equity Approvals; IED database; PCRs; PCR validation reports; RRPs.


The Asian Development Fund Operations������������ ��������������������������������������������������
This study reviews the development effectiveness of the operations of the Asian Development Fund (ADF) approved during ADF VIII and ADF IX (2001–2008) and reports on progress in �������������������� ������������������!!"#�!$!%&�'������������*���������+������������������������������������������� �������������,-������� �������.�����������&
About the Asian Development Bank
��,-����������������������������������������� �����&�'������������������ ���������� ������.������������������� ������������ ��������/������������������� � ��&���� ������������-����������������+�������������������34������������3���-�� �5�$&6�.������ � ��3�������������������7�������+�3����"!9�������������������������������7$&�:������&���,����������������������� ��������������������������������3��+�����������������������.�����3��+�����������������������&
,��������;�����+���,����3����.��<=����.���+�����������>6�������������&�'������������������������ ������������� �������.���������������� ������������+�����+��/���������������+�����������+�������+�������������������������&
Printed on recycled paper
Independent Evaluation at the ����������� �����,��*<���,�������+�;����������?���$::!�;����;�����+������ ����333&��.&��@���������


