Whitepaper Network inefficiency is a critical issue for today’s virtualized datacenters. This paper examines the major challenges facing virtualized datacenter networks and discusses control plane solutions to enhance their network performance. Title Subhead: 14/16 Myriad Pro Regular 1. Executive Summary Wireless network operators are adding bandwidth with 3G and more recently 4G LTE technologies to meet the growing data de- mands of smartphone users. This bandwidth will provide coverage and capacity; however, it does not address the need for low latency. Data providers like Google recognize that low latency is a key requirement for their users. They believe that web page response times need to be in the range of 0.25 second in order to deliver exceptional user experience. 1 Today’s LTE data networks are delivering 7-20 seconds of response time. Wireline networks have used content delivery networks (CDNs) and caching extensively in the Internet in order to reduce response time. This paper analyzes embedding cache in wireless networks to achieve significant reduction in response time and thus provide exceptional wireless user experience. The business case for CDNs in large wired networks has been well established. This paper further analyzes the business case for caching in wireless networks. Because caching reduces backhaul traffic, particularly peak busy hour traffic, the financial benefits of implementing caching in the core network as well as at the edge of the network were investigated. Using the WiROI™ Tool, an industry-recognized LTE business model, we calculated and translated the peak busy hour traffic reduction into OpEx savings for three sample markets. Table of Contents 1. Executive Summary 1 2. Benefits of Caching LTE Traffic 2 a. Faster Response Time 2 b. Reduced Backhaul Traffic 2 3. Caching in the LTE Network 2 a. Caching in the LTE Core Network (Layer 2 Caching) 2 b. Caching at the Edge of the Network (Layer 1 Caching) 3 4. Case Study Methodology 3 a. CapEx and Technical Assumptions 4 b. OpEx Assumptions 4 5. Business Case Study Findings 6 a. Network OpEx Savings 6 b. Total Cost of Ownership 7 6. Conclusion 7 The Business Case for Caching in 4G LTE Networks Prepared for LSI By Haig Sarkissian - Wireless 20|20 The results show that implementing Level 2 caching in the core network will result in savings of the Internet connection fees. Implementing Level 1 caching at the edge of the network offers significant backhaul traffic reduction that translates to sizeable cost savings in both OpEx and TCO. The analysis showed that network operating cost savings ranged from 29% to 35% and TCO savings ranged from 8% to 11% over the ten-year study period. Since backhaul transmission expense was the highest cost element in the TCO for all three markets analyzed, the larg- est amount of savings came from the traffic reduction due to the Level 1 cache in the base station. 2. Benefits of Caching LTE Traffic Caching is a mechanism for temporary storage of mobile data traffic, including HTML pages, images and video in order to reduce backhaul bandwidth and server load. The main benefits of caching are to reduce response time and improve network efficiencies. a. Faster Response Time Response time is used to describe the time it takes for a mobile broadband user to request information by clicking on their device until getting online, opening a web page or receiving the first frame of a video clip. Hence response time includes the time to encode the packet for transmission and transmit it, (cont. p.2) 1 http://www.nytimes.com/2012/03/01/technology/impatient-web-users-flee-slow-loading-sites.html?pagewanted=all In order to deliver exceptional user experience, LTE networks must reduce response time to a fraction of a second.
Transcript
Whitepaper
Network inefficiency is a critical issue for today’s virtualized datacenters. This paper examines the major challenges facing virtualized datacenter networks and discusses control plane solutions to enhance their network performance.
Title Subhead: 14/16 Myriad Pro Regular
1. Executive Summary
Wireless network operators are adding
bandwidth with 3G and more recently 4G LTE
technologies to meet the growing data de-
mands of smartphone users. This bandwidth
will provide coverage and capacity; however,
it does not address the need for low latency.
Data providers like Google recognize that
low latency is a key requirement for their
users. They believe that web page response
times need to be in the range of 0.25 second
in order to deliver exceptional user experience.1
Today’s LTE data networks are delivering 7-20
seconds of response time.
Wireline networks have used content delivery
networks (CDNs) and caching extensively
in the Internet in order to reduce response
time. This paper analyzes embedding cache
in wireless networks to achieve significant
reduction in response time and thus provide
exceptional wireless user experience.
The business case for CDNs in large wired
networks has been well established. This
paper further analyzes the business case
for caching in wireless networks. Because
caching reduces backhaul traffic, particularly
peak busy hour traffic, the financial benefits
of implementing caching in the core network
as well as at the edge of the network were
investigated. Using the WiROI™ Tool, an
industry-recognized LTE business model, we
calculated and translated the peak busy hour
traffic reduction into OpEx savings for three
sample markets.
Table of Contents
1. Executive Summary 1
2. Benefits of Caching LTE Traffic 2 a. Faster Response Time 2 b. Reduced Backhaul Traffic 2
3. Caching in the LTE Network 2 a. Caching in the LTE Core Network (Layer 2 Caching) 2 b. Caching at the Edge of the Network (Layer 1 Caching) 3
4. Case Study Methodology 3 a. CapEx and Technical Assumptions 4 b. OpEx Assumptions 4
5. Business Case Study Findings 6 a. Network OpEx Savings 6 b. Total Cost of Ownership 7
6. Conclusion 7
The Business Case for Caching in 4G LTE Networks Prepared for LSIBy Haig Sarkissian - Wireless 20|20
In order to deliver exceptional user experience, LTE
networks must reduce response time to a fraction of a second.
Whitepaper
| 2
plus the time for that data to traverse the
access network equipment, including the
base station, backhaul, transport and the
core network. Once at the core network, the
request often needs to be served over the
Internet by a server at a remote datacenter.
This Internet latency is highly variable
and depends on the proximity of the data
center to the mobile network operator’s
point of connection to the Internet. Once
at the datacenter, the request is subject to
further processing by the server, including
data gathering and checking. Although a
minimum bound on latency is determined
by the distance between communicating
devices and the speed at which the signal
propagates in the circuits, actual latency
is often much higher because of packet
processing by the Internet networking
equipment. Data sent by the server is often
subject to further data filtering, virus checking
and scrubbing for unwanted information
prior to deliver to the mobile device.
The goal of caching is to bring popular content
closer to the mobile user by intelligently
duplicating it in the core as well as at the edge
of the LTE network. This process practically
eliminates the variable latency of the Internet
and significantly reduces server response time
by assuring that the content of the cache is
pre-scrubbed and ready for delivery.
b. Reduced Backhaul Traffic
Advanced caching techniques promise to
reduce the overall backhaul traffic and improve
network efficiencies. By incorporating large
amounts of storage (64GB-256GB) in the base
station, user data can be pre-fetched and
stored at the edge of the network for instant
access by the base station scheduler.
This data is often gathered during idle
timeslots on the backhaul network, thereby
significantly reducing busy hour traffic.
According to industry sources, up to 40% of
backhaul traffic can be reduced at the busy
hour.2 This significant reduction in busy hour
traffic can translate to measurable cost savings
of recurring monthly backhaul operating ex-
penses. News events such as sporting bring
many users to similar content in a short
period of time, thereby creating traffic spikes.
Caching at the edge of the network has an
effect of smoothening of traffic spikes and
averaging the backhaul traffic over a longer
period of time.
3. Caching in the LTE Network
Caching can be used by mobile network
operators to store and serve popular content
in the network in order to provide instant
access of this content to mobile subscribers.
Initially, caching is being implemented in the
core network as operators take a centralized
approach to caching. This reduces the uncer-
tainties of Internet latency and remote server
response times.
As data traffic increases on LTE networks
and backhaul links become congested,
distributed approaches to CDN deployment
are becoming practical, thanks to the all-IP
architecture of LTE eNodeBs. These new tech-
niques are promising further improvement
in latency and network efficiency by pushing
the cache to the edge of the network.
(cont. p.3)
Caching improves OpEX by reducing total throughput,
and improves CapEX by reducing peak
bandwidth required.
2 From various sources. See, for example,” should be inserted in front of the URL http://www.altobridge.com/2012/12/03/altobridge-proves-40-data-backhaul-savings-with- intelligent-content-delivery-in-commercial-wireless-networks/3
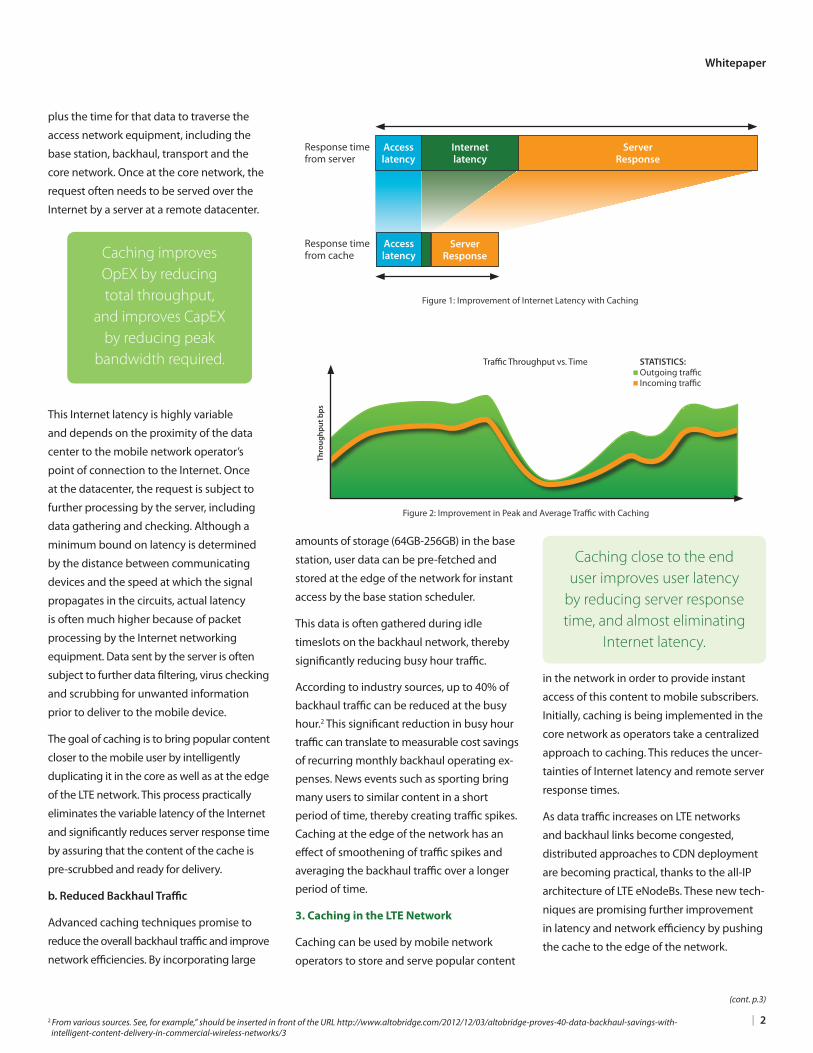
Caching close to the end user improves user latency
by reducing server response time, and almost eliminating
Internet latency.
Figure 1: Improvement of Internet Latency with Caching
Response time from server
Response time from cache
5 - 20 ms 50 - 450 ms 200 - 1,700 ms
Access latency
Internet latency
Server Response
10 - 50 ms
Access latency
Server Response
250 - 2,200 ms
Traffic Throughput vs. Time STATISTICS: Outgoing traffic Incoming traffic
Thro
ughp
ut b
ps
Figure 2: Improvement in Peak and Average Traffic with Caching
Whitepaper
| 3
a. Caching in the LTE Core Network
(Layer 2 Caching)
Caching servers can be deployed anywhere
within an all-IP network. In LTE networks,
Layer 2 (L2) caching is typically deployed
at the packet data network gateway or the
PGW, within the evolved packet core (EPC).
These cache servers offer multi-terabytes of
data storage capacity and capture popular
content that is accessed by a large number of
users. The beauty and simplicity of deploy-
ing a centralized cache in the EPC is making
them popular in LTE networks. They provide
a mobile network operator with many of
the benefits of caching. Centralized caching
reduces the uncertainties of Internet latency
and remote server response times. Because
they have visibility of data seen by large
number of subscribers, L2 caches will enjoy
high hit ratios.
When a popular content is found in an L2
cache in the EPC, this information is no
longer obtained from the remote server
of origin. This reduces the traffic between
the EPC and the Internet, thus reducing the
bandwidth and cost of the Internet connection.
Therefore, the financial benefit of L2 caching
is limited to the cost reduction of the
Internet transit.
b. Caching at the Edge of the Network
(Layer 1 Caching)
The popular content in the example above
still needs to traverse the transport and
backhaul links of an LTE network. Often
times, the most expensive part of the
network operating cost is the cost of the
various fiber leased lines that connect the
LTE base station to its core network. Layer
1 (L1) caching brings this functionality as
close to the end use as possible by placing
it in the base station. LTE macro and metro
base stations, and pico base stations are ideal
platforms to incorporate L1 caching because
of their all-IP architecture and their proximity
to the end user.
Sophisticated caching algorithms, including
proactive, predictive and coherent caching,
coordinate information flow between the
L1 and L2 caches in order to increase the
probability of hits. Special video optimization
algorithms further improve the buffering of
video streams and coherently synch them
with the base station scheduler in order to
make optimum utilization of precious radio
access network resources.
By placing caching in the radio access
network (i.e., in the base stations), backhaul
traffic is considerably reduced, and since
backhaul and transport costs are often the
largest parts of the LTE network OpEx, the
financial savings can be significant.
4. Case Study Methodology
To study the impact of caching on an LTE
service provider business case, Wireless 20/20
selected three network markets for the case
study. These were Chicago, USA; Munich,
Germany; and Hangzhou, China. Wireless
20/20 has developed over 60 business cases
using the WiROI™ Business Case Tool for
clients all over the world including these
markets, and the network models, cost data
and population metrics for each of these
markets was generated using real-world
data from these studies. Each of these cities
presented a variation in population density,
backhaul costs and mobile data usage, mak-
ing them appealing and exemplary scenarios
to analyze. A complete LTE network model
was built for each of the three markets using
the WiROI Business Case Tool. The output of
the WiROI Tool, an investment-grade, 10-year
business case including full income state-
ment, was captured to establish the baseline
CapEx, OpEx, TCO, NPV and IRR.
An L2 caching model was built to simulate
the impact of L2 caching on the business
case. CapEx for this system was incurred up
front as well as during the course of the ten-
year study period in order to accommodate
the incremental storage and intelligence
required as traffic and number of subscribers
increased over time. The percentage of traffic
savings from the Core Network connection to
(cont. p.4)
Figure 3: Layer 1 and Layer 2 Caching Locations in a Wireless Network
eNodeB
NodeB
NodeB
RNC
MSC
SAE GW
MME
SGSN GGSN
Data Center/ SAN Storage
Internet
Data Center/ SAN Storage
3G
LTE
Caching at the network edge further improves caching in
the core network.
eNodeB
CoreRAN
Layer 2Layer 1
Whitepaper
| 4
the Internet was used to calculate the Internet
connection cost savings and to capture the
associated network efficiency improvements.
Similarly, an L1 caching model was built where
caching functionality was added in each
eNodeB during the initial deployment of the
LTE network. As the network was expanded
to handle the increased capacity needs of the
users, new eNodeBs were added equipped
with caching. Both macro and pico base
stations were used for coverage and capacity,
respectively. The incremental cost of adding
caching functionality to the base stations
was calculated as part of the CapEx. Any traf-
fic savings due to the L1 cache was captured
in order to calculate reduction in backhaul
and transport OpEx. These savings were
calculated on an annual basis for the ten-year
study period.
The WiROI Tool’s easy-to-use graphical user
interface dashboard allows the user to
separately turn L1 and L2 caching on and off
and view the impact of each caching method
on the LTE network. The two scenarios that
were analyzed were an LTE network with L2
caching only and an LTE network with both
L1 and L2 caching. The results were captured
and then compared with the baseline case
where no caching was used.
a. CapEx and Technical Assumptions
The cost to add L2 caching functionality to
the core network was set to US$50,000, which
provided caching capability to handle up to
1Gbps traffic at the busy hour.3 The amount
of traffic reduction due to the L2 cache was
set to 30%. In order to allow for sensitivity
analysis, sliders were set with a range on each
of these parameters as shown in Figure 4.
The cost to add L1 caching functionality in a
base station was set differently for a macro vs.
a pico base station. For an omni-directional
pico BTS, the price was set at $1,500. In the
case of a three-sector macro BTS, the price
was set at $5,000 since more memory and
intelligence is needed to manage a larger
number of users on a macro base station.
The amount of traffic reduction due to an
L1 cache was set at 35% for video traffic and
30% for non-video traffic. In addition, 65% of
the total traffic volume was assumed to be
video. These assumptions are consistent with
industry sources.
b. OpEx Assumptions
Since one of the main financial benefits of
caching is due to the reduction of expensive
backhaul and international Internet connec-
tion (IIC) costs, it was important to obtain
accurate cost information for these OpEx
parameters. These costs are typically paid on
a recurring basis and are usually expressed in
monthly terms for each leased line channel
capacity. For example, a base station back-
haul connection to a fiber DS3 line provides
45Mbps peak capacity and could be priced at
$2,500 per month. Often, the mobile network
operators lease a portion of their backhaul
network from fiber network operators who are
sometimes their competitors. These costs vary
greatly from country to country and from op-
erator to operator and are sometimes subject
to government-mandated tariffs that change
slowly. For example, the cost to connect to the
Internet in an island country or an African
country may be significantly higher than in
Europe or North America. As traffic consump-
tion increases, the cost of the backhaul and
Internet connection is projected to increase.
A backhaul network for a large mobile opera-
tor can be complicated and usually not het-
erogeneous. An operator uses a mix of fiber,
copper, P2P microwave and P2MP microwave
connections as the first level of backhaul
from their base stations. These links get ag-
gregated at various aggregation points and
the combined traffic is then carried by a fiber
transport network to the EPC core where it is
connected to the Internet.
Our model assumed a mix of microwave and
leased line connections as the first-level back-
haul from base stations, with 60% microwave
and 40% leased line. This mix was presented
as a slider on the dashboard, which allowed
the user to vary this mix from 0% to 100%. Figure 4: Cache Cost Sliders
(cont. p.5)
3 Costs based on early estimates of cache equipment costs, but may vary from market to market. The WiROI model can be used to adjust such cost estimates for sensitivity analysis.
Figure 5: Backhaul Cost Sliders The cache ROI model allows a user to select the estimated
costs and bandwidth reductions from caching.
The caching ROI model uses realistic costs for backhaul transport, but
allows the user to change the costs for different scenarios or markets.
Whitepaper
| 5
Figure 6: Detailed Cost Categories in the WiROI Model
We also assumed that on the average every
10 base stations were connected with an ag-
gregator. This parameter was also presented
as a slider. Finally a scalable set of fiber
transport channel options was set up to carry
the aggregate traffic to the core network.
These included DS3-45Mbps, OC3-155Mbps
and OC12-622Mbps lines, each with its own
monthly lease expense.
A least cost algorithm was set up in the WiROI
Tool to calculate the lowest-cost method
of transporting the traffic based on the
busy hour traffic capacity needed. This was
adjusted year over year to accommodate
the increase in the busy hour traffic. Further-
more, an annual cost-reduction parameter
was included to allow for such reduction.
5. Business Case Study Findings
The WiROI Tool calculates the total cost of a
network and provides several financial met-
rics to evaluate the impact of caching on the
network. Financial metrics include yearly and
cumulative OpEx, CapEx and TCO, as well as
IRR and ROI metrics. An example output from
the WiROI model, showing ten-year TCO, is
shown in Figure 6. Cost categories include all
(cont. p.6)Figure 8: 10-Year Total Cost of Ownership
Cumulative CapEx & OpEx Chicago
10-Year Network OpEx (Chicago Market)
10-Year TCO without L1 or L2 ($M) (Chicago Market)
10-Year TCO with L2 Only ($M) (Chicago Market)
10-Year TCO with L1 and L2 ($M) (Chicago Market)
The caching ROI model provides detailed breakdowns for all aspects
of network OpEx and CapEx.
L1 and L2 caching combined shows the greatest improvement in TCO.
Figure 7: 10-Year Network OpEx
Site Rental and Maintenance Costs Backhaul Transmission Expense International Internet Connection Voice Termination Charges WiFi Network OpEx Spectrum OpEx CPE Subsidy Fixed Marketing Costs Promotion Costs Billing Cost Bad Debt Expense Customer Care Costs CPE Refresh Cost Spectrum OpEx Overhead 3G Base Station LTE Base Station Fiber Backhaul Wireless Backhaul 3G Site Dev. LTE Site Dev. 3G Core Network LTE Core Network Maintenance WiFi CapEx
TCO = $6,030 M TCO = $5,964 M TCO = $5,539 M
Whitepaper
| 6
aspects of building, maintaining, marketing
and administering a network.
To study the impact of caching on the busi-
ness case of an LTE service provider, the
WiROI model was run for all three markets
(Chicago, Munich and Hangzhou), with and
without caching implemented in the net-
work. Two types of caching were modeled:
L2 caching alone (in the core network) and
a combination of L1 caching at the network
edge (eNodeB) with L2 caching in the core.
The results showed that network operating
cost savings for combined L1 and L2 caching
ranged from 29% to 35% and TCO savings
ranged from 8% to 11% over the ten-year
study period. The largest cost improvement
came from reduction in backhaul transmis-
sion expenses, followed by Internet intercon-
nection expenses, as shown in the Figure 7
(from the Chicago market).
While the cost of caching equipment increased
the total CapEx, the benefit of lower network
operating costs was far greater, resulting in a
net decrease in total cost of ownership (TCO)
over a ten-year period. The ten-year TCO for the
Chicago market is shown in Figure 8. Backhaul
transmission expense was the highest cost ele-
ment in the TCO for this market, and the largest
amount of savings came from traffic reduction
due to the L1 cache in the base station. While
some additional CapEx was required, due to
the additional cost of caching equipment, the
improvement in OpEx was far greater than the
increased CapEx.
a. Network OpEx Savings
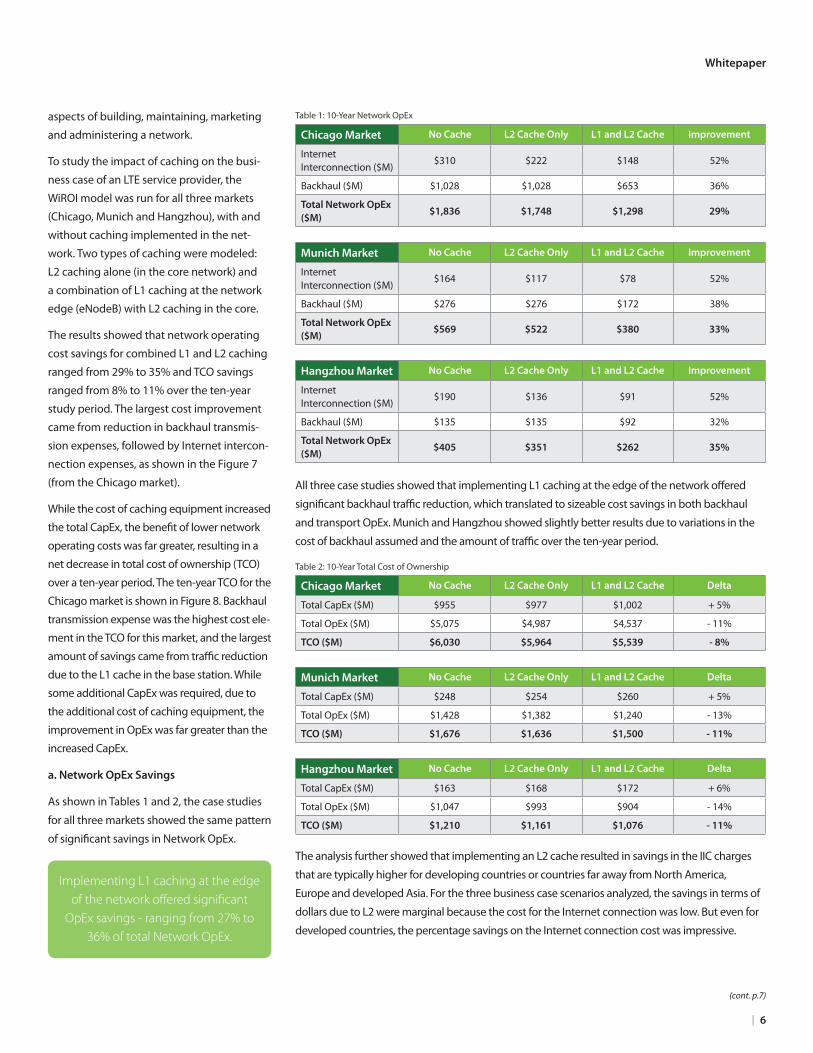
As shown in Tables 1 and 2, the case studies
for all three markets showed the same pattern
of significant savings in Network OpEx.
All three case studies showed that implementing L1 caching at the edge of the network offered
significant backhaul traffic reduction, which translated to sizeable cost savings in both backhaul
and transport OpEx. Munich and Hangzhou showed slightly better results due to variations in the
cost of backhaul assumed and the amount of traffic over the ten-year period.
The analysis further showed that implementing an L2 cache resulted in savings in the IIC charges
that are typically higher for developing countries or countries far away from North America,
Europe and developed Asia. For the three business case scenarios analyzed, the savings in terms of
dollars due to L2 were marginal because the cost for the Internet connection was low. But even for
developed countries, the percentage savings on the Internet connection cost was impressive.
(cont. p.7)
Implementing L1 caching at the edge of the network offered significant
OpEx savings - ranging from 27% to 36% of total Network OpEx.
Chicago Market No Cache L2 Cache Only L1 and L2 Cache Improvement
Internet Interconnection ($M)
$310 $222 $148 52%
Backhaul ($M) $1,028 $1,028 $653 36%
Total Network OpEx ($M)
$1,836 $1,748 $1,298 29%
Munich Market No Cache L2 Cache Only L1 and L2 Cache Improvement
Internet Interconnection ($M)
$164 $117 $78 52%
Backhaul ($M) $276 $276 $172 38%
Total Network OpEx ($M)
$569 $522 $380 33%
Hangzhou Market No Cache L2 Cache Only L1 and L2 Cache Improvement
Internet Interconnection ($M)
$190 $136 $91 52%
Backhaul ($M) $135 $135 $92 32%
Total Network OpEx ($M)
$405 $351 $262 35%
Chicago Market No Cache L2 Cache Only L1 and L2 Cache Delta
Total CapEx ($M) $955 $977 $1,002 + 5%
Total OpEx ($M) $5,075 $4,987 $4,537 - 11%
TCO ($M) $6,030 $5,964 $5,539 - 8%
Munich Market No Cache L2 Cache Only L1 and L2 Cache Delta
Total CapEx ($M) $248 $254 $260 + 5%
Total OpEx ($M) $1,428 $1,382 $1,240 - 13%
TCO ($M) $1,676 $1,636 $1,500 - 11%
Hangzhou Market No Cache L2 Cache Only L1 and L2 Cache Delta
Total CapEx ($M) $163 $168 $172 + 6%
Total OpEx ($M) $1,047 $993 $904 - 14%
TCO ($M) $1,210 $1,161 $1,076 - 11%
Table 1: 10-Year Network OpEx
Table 2: 10-Year Total Cost of Ownership
Whitepaper
For more information and sales office locations, please visit the LSI web sites at: lsi.com lsi.com/contacts
LSI, the LSI & Design logo, Storage.Networking.Accelerated. are trademarks or registered trademarks of LSI Corporation in the United States and/or other countries. All other brand or product names may be trademarks or registered trademarks of their respective companies.
LSI Corporation reserves the right to make changes to any products and services herein at any time without notice. LSI does not assume any responsibility or liability arising out of the application or use of any product or service described herein, except as expressly agreed to in writing by LSI; nor does the purchase, lease, or use of a product or service from LSI convey a license under any patent rights, copyrights, trademark rights, or any other of the intellectual property rights of LSI or of third parties.