28
THE CASE FOR FLEXIBLE ENERGY STORAGE March 19 2018
THE CASE FOR FLEXIBLE ENERGY STORAGE
March 19 2018
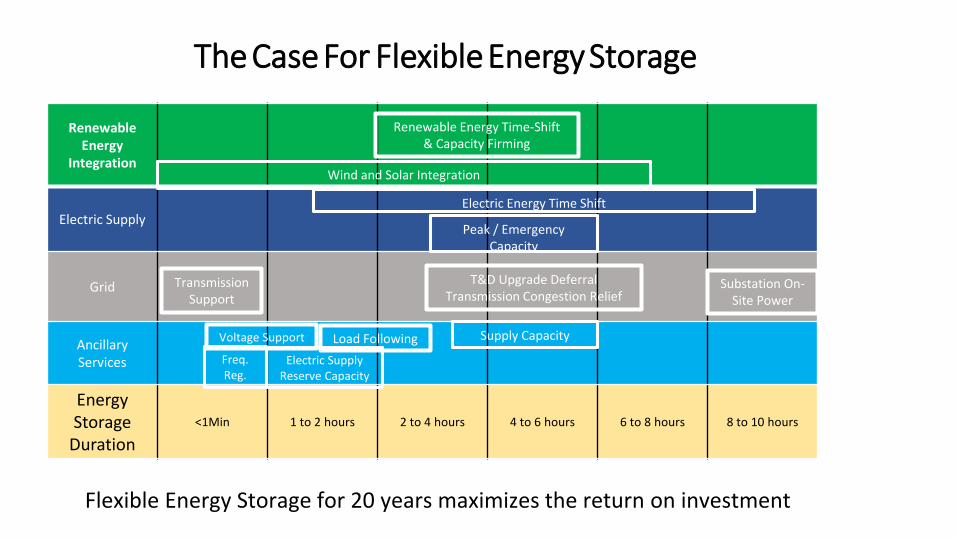
The Case For Flexible Energy Storage
Renewable Energy
Integration
Electric Supply
Grid
Ancillary Services
Energy Storage
Duration
<1Min 1 to 2 hours 2 to 4 hours 4 to 6 hours 6 to 8 hours 8 to 10 hours
Renewable Energy Time-Shift & Capacity Firming
Wind and Solar Integration
Transmission Support
Substation On-Site Power
T&D Upgrade DeferralTransmission Congestion Relief
Electric Energy Time Shift
Peak / Emergency Capacity
Voltage Support Load Following Supply Capacity
Electric Supply Reserve Capacity
Freq. Reg.
Flexible Energy Storage for 20 years maximizes the return on investment
3/31/2016 ESS Tech, Inc. Proprietary and Confidential 16
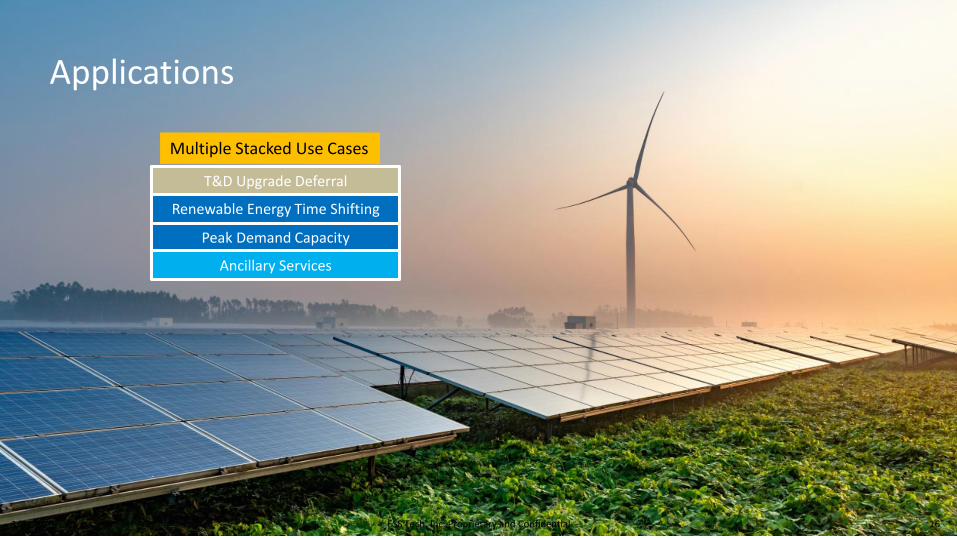
Applications
Peak Demand Capacity
Ancillary Services
T&D Upgrade Deferral
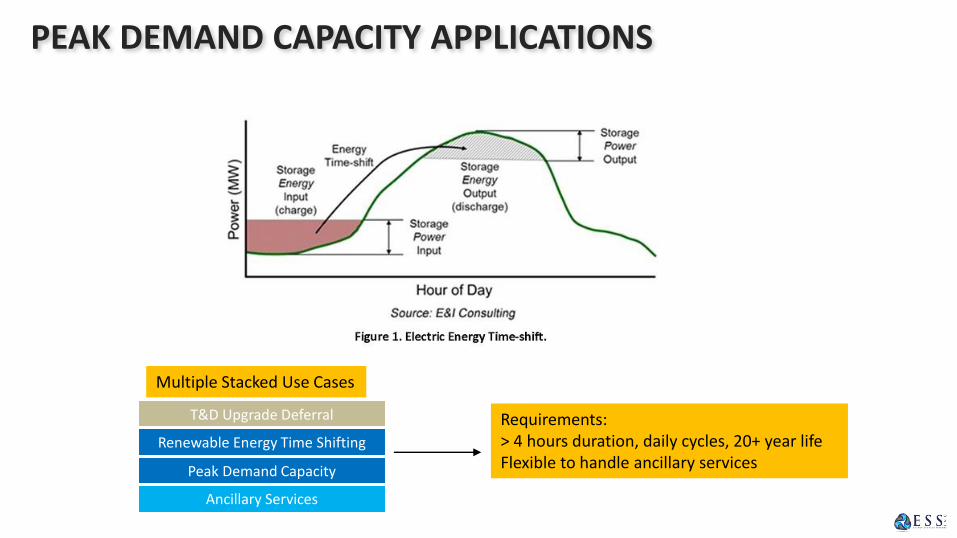
Multiple Stacked Use Cases
Renewable Energy Time Shifting

Requirements:> 4 hours duration, daily cycles, 20+ year lifeFlexible to handle ancillary services
Peak Demand Capacity
Ancillary Services
T&D Upgrade Deferral
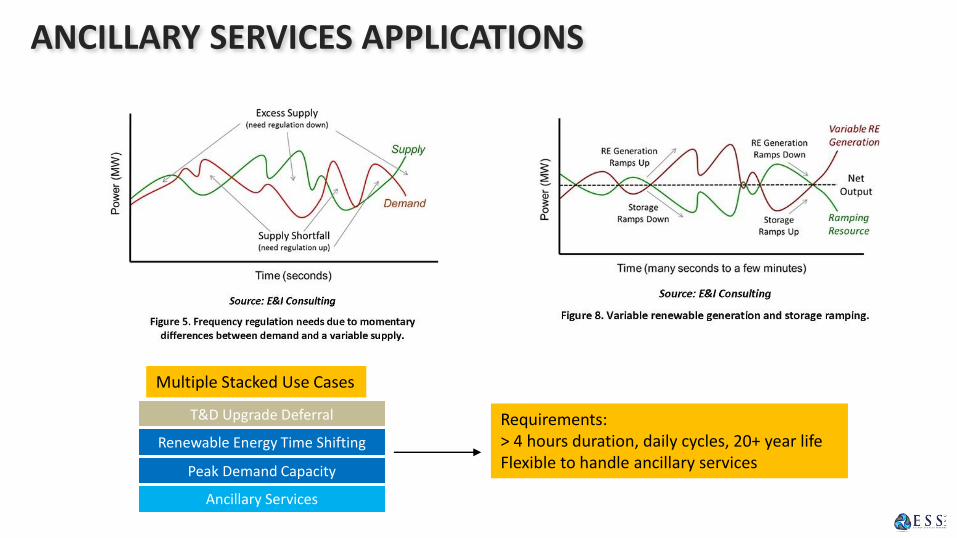
Multiple Stacked Use Cases
Renewable Energy Time Shifting
T&D DEFERRAL APPLICATIONS
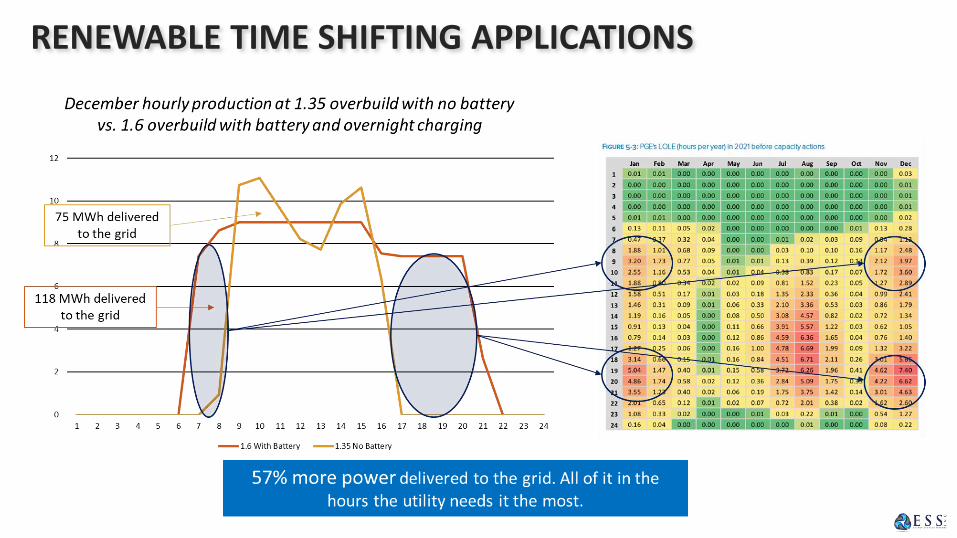
RENEWABLE TIME SHIFTING APPLICATIONS
Requirements:> 4 hours duration, daily cycles, 20+ year lifeFlexible to handle ancillary services
Peak Demand Capacity
Ancillary Services
T&D Upgrade Deferral
Multiple Stacked Use Cases
Renewable Energy Time Shifting
PEAK DEMAND CAPACITY APPLICATIONS
Requirements:> 4 hours duration, daily cycles, 20+ year lifeFlexible to handle ancillary services
Peak Demand Capacity
Ancillary Services
T&D Upgrade Deferral
Multiple Stacked Use Cases
Renewable Energy Time Shifting
ANCILLARY SERVICES APPLICATIONS
ESS Tech, Inc. 3
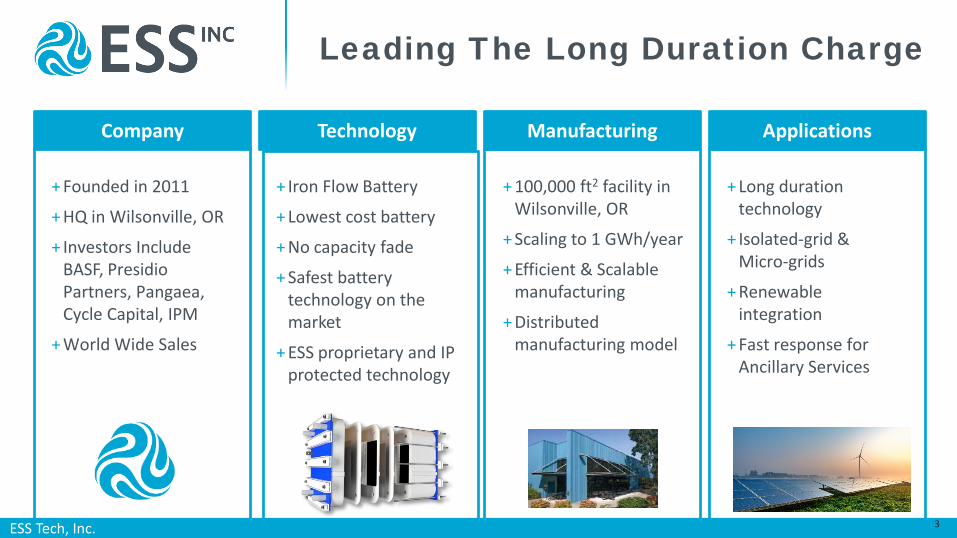
Leading The Long Duration Charge
Company Technology ApplicationsManufacturing
+ Founded in 2011
+ HQ in Wilsonville, OR
+ Investors Include BASF, Presidio Partners, Pangaea, Cycle Capital, IPM
+ World Wide Sales
+ Iron Flow Battery
+ Lowest cost battery
+ No capacity fade
+ Safest batterytechnology on themarket
+ ESS proprietary and IPprotected technology
+ 100,000 ft2 facility inWilsonville, OR
+ Scaling to 1 GWh/year
+ Efficient & Scalablemanufacturing
+ Distributedmanufacturing model
+ Long duration technology
+ Isolated-grid & Micro-grids
+ Renewable integration
+ Fast response for Ancillary Services
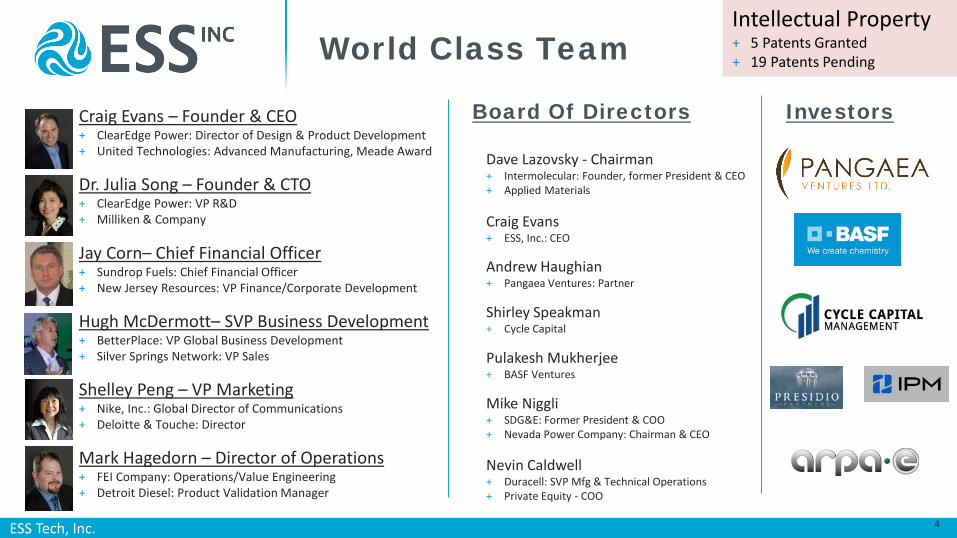
Board Of DirectorsCraig Evans – Founder & CEO+ ClearEdge Power: Director of Design & Product Development+ United Technologies: Advanced Manufacturing, Meade Award
Dr. Julia Song – Founder & CTO+ ClearEdge Power: VP R&D+ Milliken & Company
Hugh McDermott– SVP Business Development+ BetterPlace: VP Global Business Development+ Silver Springs Network: VP Sales
Mark Hagedorn – Director of Operations+ FEI Company: Operations/Value Engineering+ Detroit Diesel: Product Validation Manager
Nevin Caldwell+ Duracell: SVP Mfg & Technical Operations+ Private Equity - COO
Shirley Speakman+ Cycle Capital
Andrew Haughian+ Pangaea Ventures: Partner
Dave Lazovsky - Chairman+ Intermolecular: Founder, former President & CEO+ Applied Materials
Mike Niggli+ SDG&E: Former President & COO+ Nevada Power Company: Chairman & CEO
Shelley Peng – VP Marketing+ Nike, Inc.: Global Director of Communications+ Deloitte & Touche: Director
Pulakesh Mukherjee+ BASF Ventures
Craig Evans+ ESS, Inc.: CEO
World Class Team
Jay Corn– Chief Financial Officer+ Sundrop Fuels: Chief Financial Officer+ New Jersey Resources: VP Finance/Corporate Development
Investors
ESS Tech, Inc. 4
Intellectual Property+ 5 Patents Granted+ 19 Patents Pending
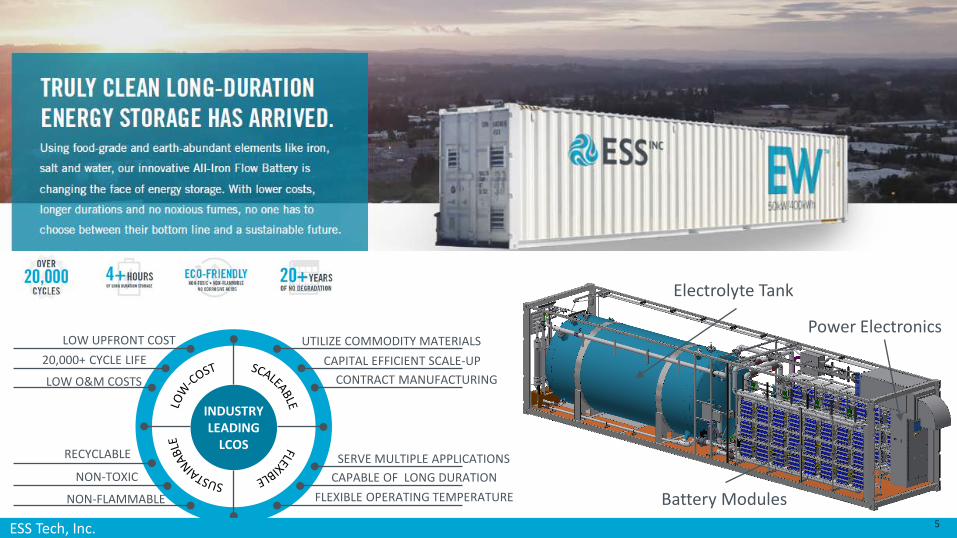
Energy Warehouse
Power Electronics
Battery Modules
Electrolyte Tank
INDUSTRY LEADING
LCOS
UTILIZE COMMODITY MATERIALSCAPITAL EFFICIENT SCALE-UP
LOW UPFRONT COST20,000+ CYCLE LIFE
LOW O&M COSTS
RECYCLABLE
NON-TOXIC
NON-FLAMMABLE
SERVE MULTIPLE APPLICATIONSCAPABLE OF LONG DURATION
FLEXIBLE OPERATING TEMPERATURE
CONTRACT MANUFACTURING
ESS Tech, Inc. 5
ESS Tech, Inc.
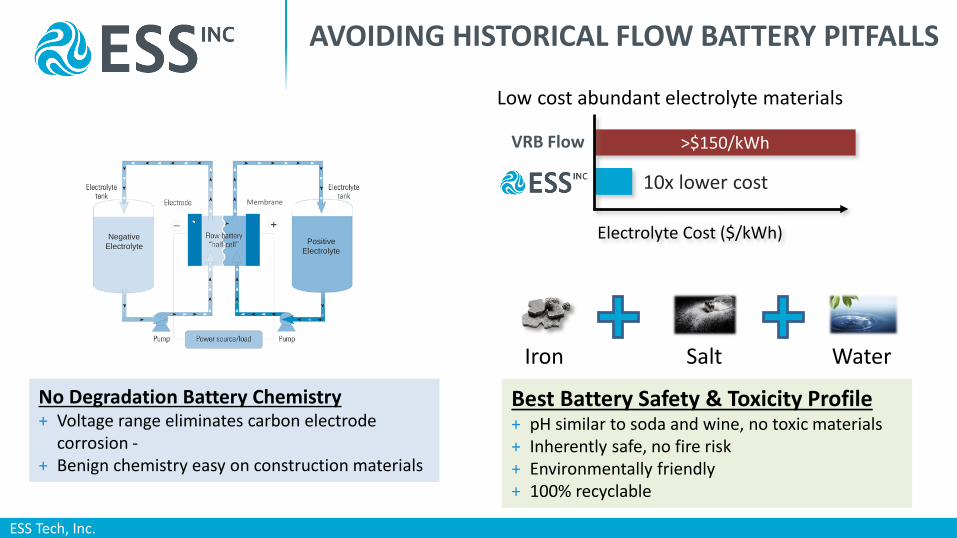
AVOIDING HISTORICAL FLOW BATTERY PITFALLS
>$150/kWhVRB Flow
Electrolyte Cost ($/kWh)
10x lower cost
Iron Salt Water
Low cost abundant electrolyte materials
Best Battery Safety & Toxicity Profile+ pH similar to soda and wine, no toxic materials+ Inherently safe, no fire risk+ Environmentally friendly+ 100% recyclable
No Degradation Battery Chemistry+ Voltage range eliminates carbon electrode
corrosion -+ Benign chemistry easy on construction materials
Negative
ElectrolytePositive
Electrolyte
Membrane
ESS Tech, Inc.
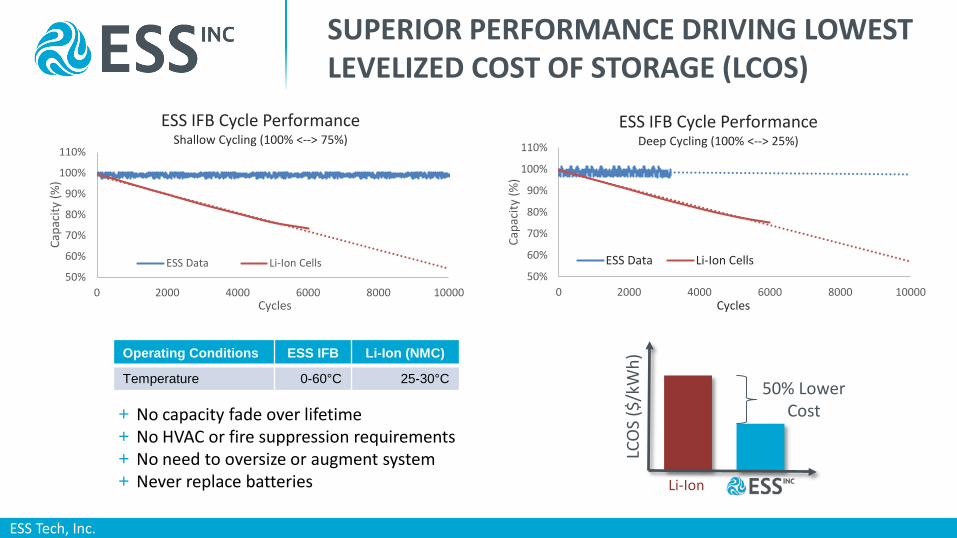
SUPERIOR PERFORMANCE DRIVING LOWEST LEVELIZED COST OF STORAGE (LCOS)
Operating Conditions ESS IFB Li-Ion (NMC)
Temperature 0-60°C 25-30°C
50%
60%
70%
80%
90%
100%
110%
0 2000 4000 6000 8000 10000
Capa
city
(%)
Cycles
ESS IFB Cycle PerformanceDeep Cycling (100% <--> 25%)
ESS Data Li-Ion Cells
+ No capacity fade over lifetime+ No HVAC or fire suppression requirements+ No need to oversize or augment system+ Never replace batteries
50%
60%
70%
80%
90%
100%
110%
0 2000 4000 6000 8000 10000
Capa
city
(%)
Cycles
ESS IFB Cycle PerformanceShallow Cycling (100% <--> 75%)
ESS Data Li-Ion Cells
Li-Ion
LCO
S ($
/kW
h)
50% Lower Cost
8/29/2017 8
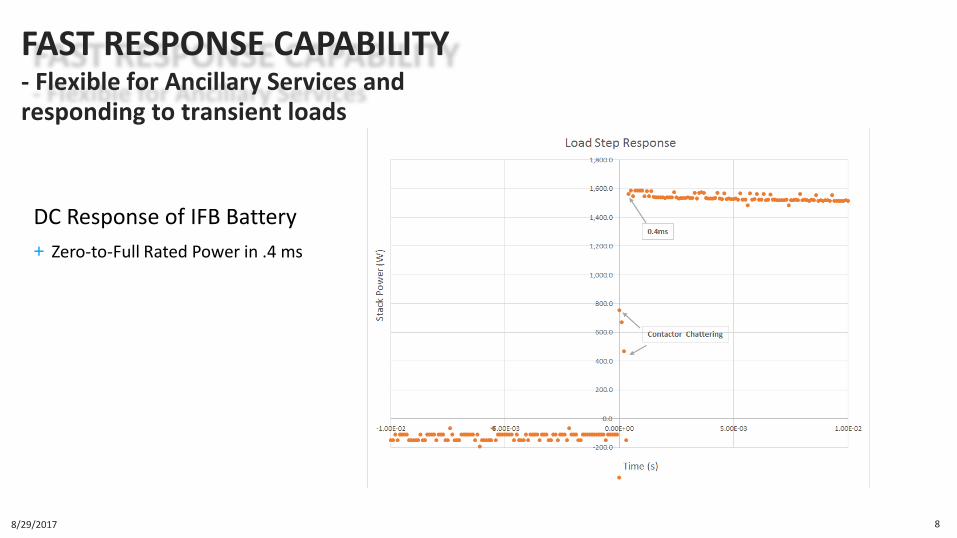
FAST RESPONSE CAPABILITY- Flexible for Ancillary Services andresponding to transient loads
DC Response of IFB Battery
+ Zero-to-Full Rated Power in .4 ms

Minimal permitting requirements• No fire risk• No hazmat risk• No explosion risk
Fast to deploy and commission• No special siting requirements• No HVAC requirements – operates up to 60C• No fire suppression requirements• Engineered for seismic zones
Minimal on-going compliance requirements• No specialized training or licensing for operation• No specialized incident response requirements
LOWEST SOFT COSTS – FASTEST TO DEPLOY
LTO NMC Zn Flow VRBNaSPb-AcidMore Safe
32
2W
32
1COR
30
2W
20
0cor
30
2cor
Less Safe
Safe
ty
32
2W
ESS
20
0cor
Best Battery Safety & Toxicity Profile
ESS Tech, Inc. 8

ESS Tech, Inc.
FLEXIBLE ENERGY STORAGE
Energy Warehouse+ Flexible building block+ Instantaneous response+ Turnkey design for fast installation+ Inverter and Power electronics included+ Nominal Power: 50kW+ Capacity at nominal power: 8 hours
Stackable
Flexible Power and Energy+ Scalable to MW and MWh Utility Scale+ Smooth the renewables or bulk shift the energy+ Reduce demand charges+ Support utility application+ Or…. do all of the above
TM

ESS Tech, Inc.
ESS SPOTLIGHT INSTALLATIONS
UCSD Microgrid400kWhMicrogridOperational Q2 2017
DNV-GL400kWhRenewable IntegrationOperational Q2 2017
US Army Corps225kWhOff-grid/RenewablesOperational Q2 2016
Stone Edge Farms60 kWhMicrogrid/RenewablesOperational Q1 2015
Additional 2.4MWh currently under production for delivery in North America, Latin America and Western Europe

ESS Tech, Inc.
FLEXIBLE ENERGY STORAGE
11
2015 2016 2017 2018 2019
Mili
tary
10kW/60kWh
30MW/120MWh
50kW/400kWh
60kW/225kWh
100kW/400kWh
75kW/600kWh
Commercial
PRODUCT ROADMAP - INCREASING ENERGY DENSITY
ESS Energy Centers
Utility
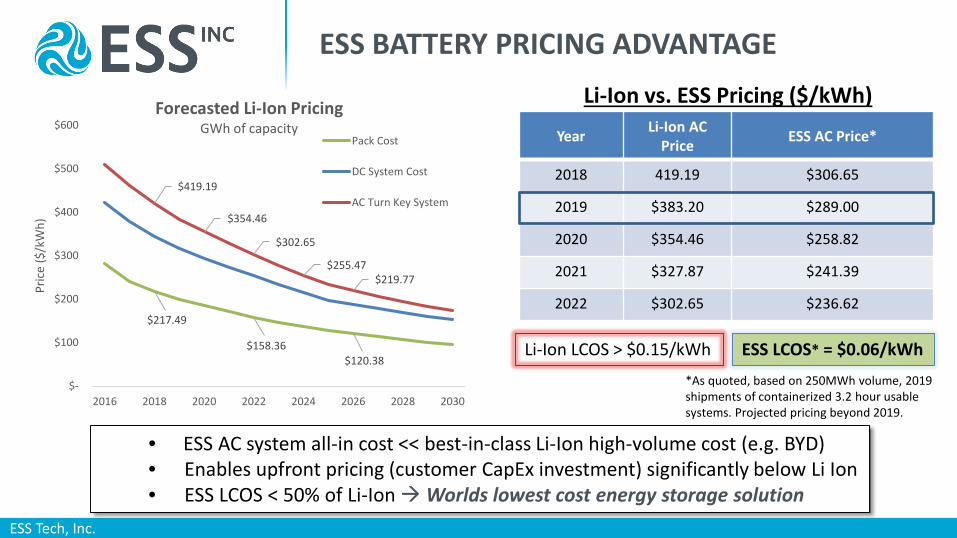
ESS BATTERY PRICING ADVANTAGE
ESS Tech, Inc.
$217.49
$158.36 $120.38
$419.19
$354.46
$302.65
$255.47 $219.77
$-
$100
$200
$300
$400
$500
$600
2016 2018 2020 2022 2024 2026 2028 2030
Pric
e ($
/kW
h)
Forecasted Li-Ion PricingGWh of capacity
Pack Cost
DC System Cost
AC Turn Key System
• ESS AC system all-in cost << best-in-class Li-Ion high-volume cost (e.g. BYD)• Enables upfront pricing (customer CapEx investment) significantly below Li Ion• ESS LCOS < 50% of Li-Ion Worlds lowest cost energy storage solution
Li-Ion vs. ESS Pricing ($/kWh)
*As quoted, based on 250MWh volume, 2019shipments of containerized 3.2 hour usablesystems. Projected pricing beyond 2019.
Li-Ion LCOS > $0.15/kWh ESS LCOS* = $0.06/kWh
Year Li-Ion AC Price ESS AC Price*
2018 419.19 $306.65
2019 $383.20 $289.00
2020 $354.46 $258.82
2021 $327.87 $241.39
2022 $302.65 $236.62
LCO
S ($
/kW
h)
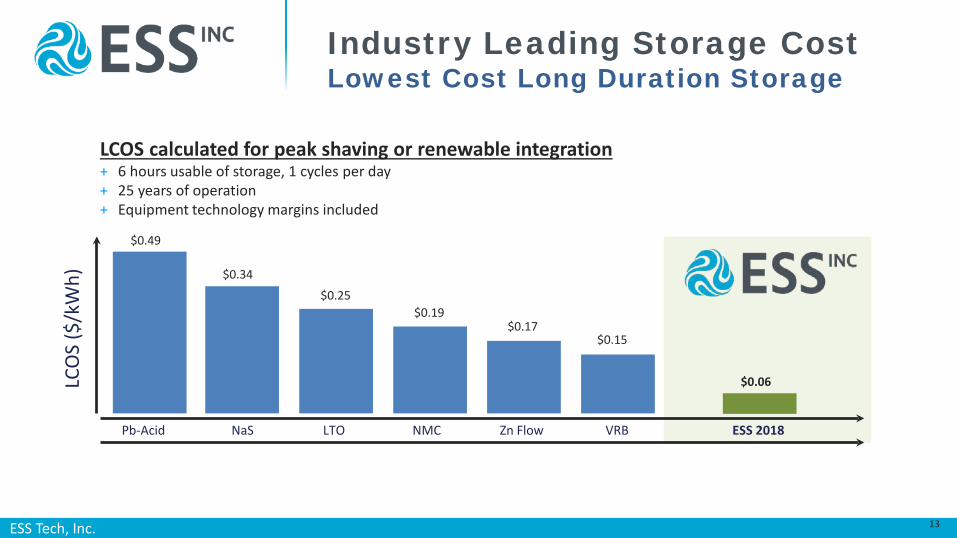
$0.15$0.17
$0.19$0.25
$0.34
$0.49
LCOS calculated for peak shaving or renewable integration+ 6 hours usable of storage, 1 cycles per day+ 25 years of operation+ Equipment technology margins included
$0.06
Industry Leading Storage CostLowest Cost Long Duration Storage
LTO NMC Zn Flow VRBNaSPb-Acid ESS 2018
ESS Tech, Inc. 13
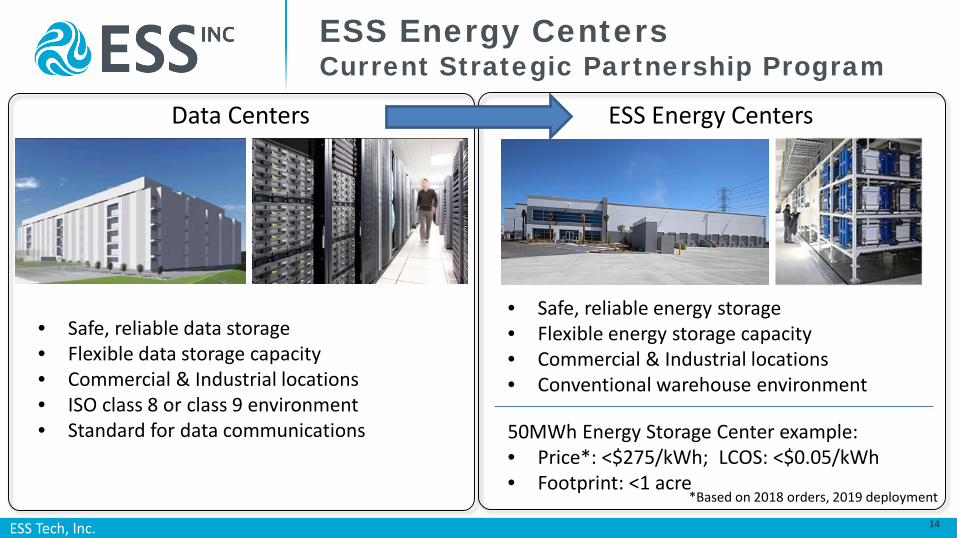
ESS Energy CentersCurrent Strategic Partnership Program
Data Centers ESS Energy Centers
• Safe, reliable data storage• Flexible data storage capacity• Commercial & Industrial locations• ISO class 8 or class 9 environment• Standard for data communications
• Safe, reliable energy storage• Flexible energy storage capacity• Commercial & Industrial locations• Conventional warehouse environment
50MWh Energy Storage Center example:• Price*: <$275/kWh; LCOS: <$0.05/kWh• Footprint: <1 acre
*Based on 2018 orders, 2019 deployment
ESS Tech, Inc. 14

Richard PhillipsPresident [email protected] Ltda. www.vedantaess.comRUA SERGIPE, 475 - 4º ANDAR SÃO PAULOCEP 01243-001, +55-11-99971-1330
LCO
S ($
/kW
h)
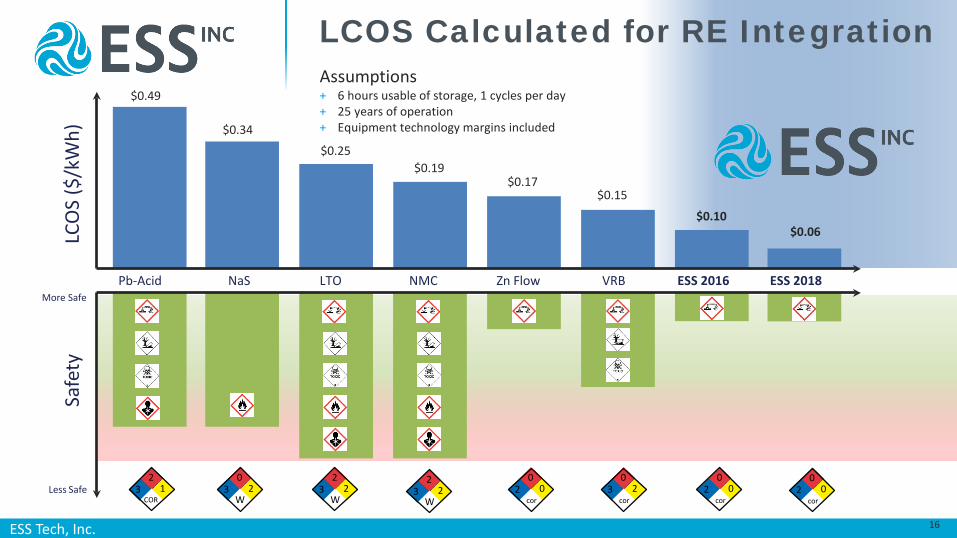
$0.10
$0.15$0.17
$0.19$0.25
$0.34
$0.49Assumptions+ 6 hours usable of storage, 1 cycles per day+ 25 years of operation+ Equipment technology margins included
$0.06
LTO NMC Zn Flow VRB ESS 2016NaSPb-AcidMore Safe
32
2W
32
1COR
30
2W
20
0cor
30
2cor
20
0cor
Less Safe
Safe
ty
32
2W
ESS 2018
20
0cor
LCOS Calculated for RE Integration
ESS Tech, Inc. 16
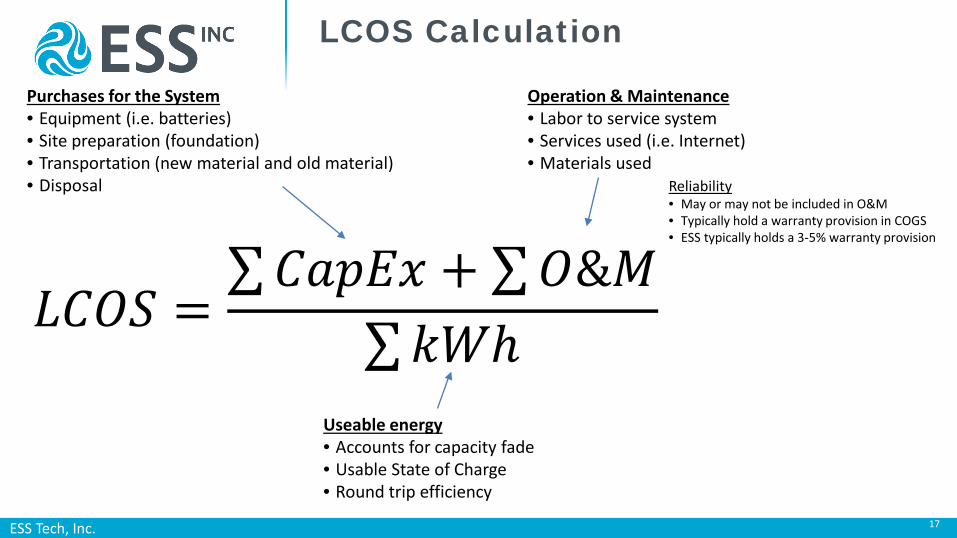
𝐿𝐿𝐿𝐿𝐿𝐿𝐿𝐿 =∑𝐿𝐿𝐶𝐶𝐶𝐶𝐶𝐶𝐶𝐶 + ∑𝐿𝐿&𝑀𝑀
∑𝑘𝑘𝑘𝑘𝑘
Purchases for the System• Equipment (i.e. batteries)• Site preparation (foundation)• Transportation (new material and old material)• Disposal
Operation & Maintenance• Labor to service system• Services used (i.e. Internet)• Materials used
Useable energy• Accounts for capacity fade• Usable State of Charge• Round trip efficiency
Reliability• May or may not be included in O&M• Typically hold a warranty provision in COGS• ESS typically holds a 3-5% warranty provision
LCOS Calculation
ESS Tech, Inc. 17
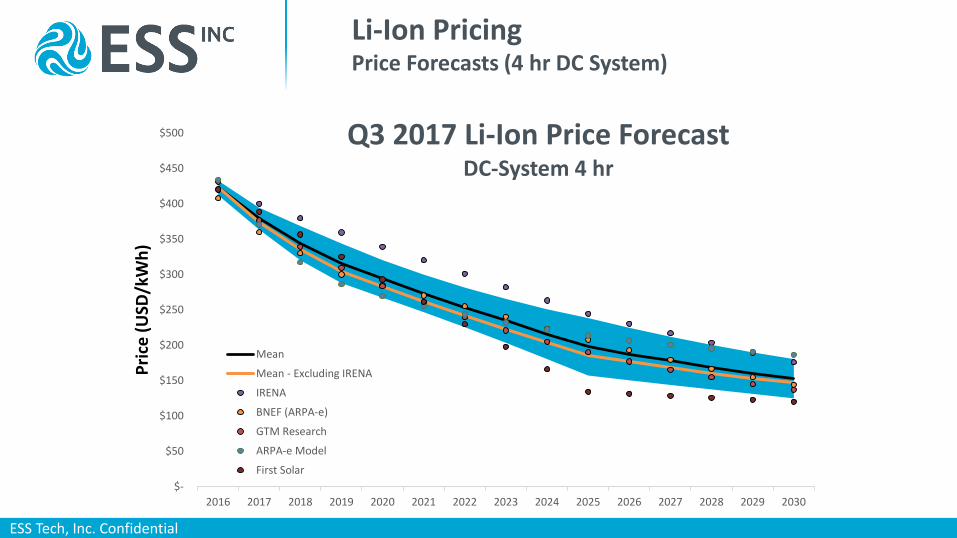
Li-Ion PricingPrice Forecasts (4 hr DC System)
ESS Tech, Inc. Confidential
$-
$50
$100
$150
$200
$250
$300
$350
$400
$450
$500
2016 2017 2018 2019 2020 2021 2022 2023 2024 2025 2026 2027 2028 2029 2030
Pric
e (U
SD/k
Wh)
Q3 2017 Li-Ion Price ForecastDC-System 4 hr
Mean
Mean - Excluding IRENA
IRENA
BNEF (ARPA-e)
GTM Research
ARPA-e Model
First Solar

LCOS COMPARISON - 2020
$0.23 $0.22 $0.22
$0.18
$0.12$0.12
$0.10 $0.10$0.09
$0.05
$0.00
$0.05
$0.10
$0.15
$0.20
$0.25
Aquion Primus Redflow EOS ViZn LTO NMC(Tesla)
LFP(BYD)
VRB ESS
Levelized Cost Analysis - 2020 CapEx Cost Analysis
ESS Tech, Inc. 19
Mar
ket S
ize ($
Billi
on)
2018 2019 2020 2021 2022 2023 2024 2025
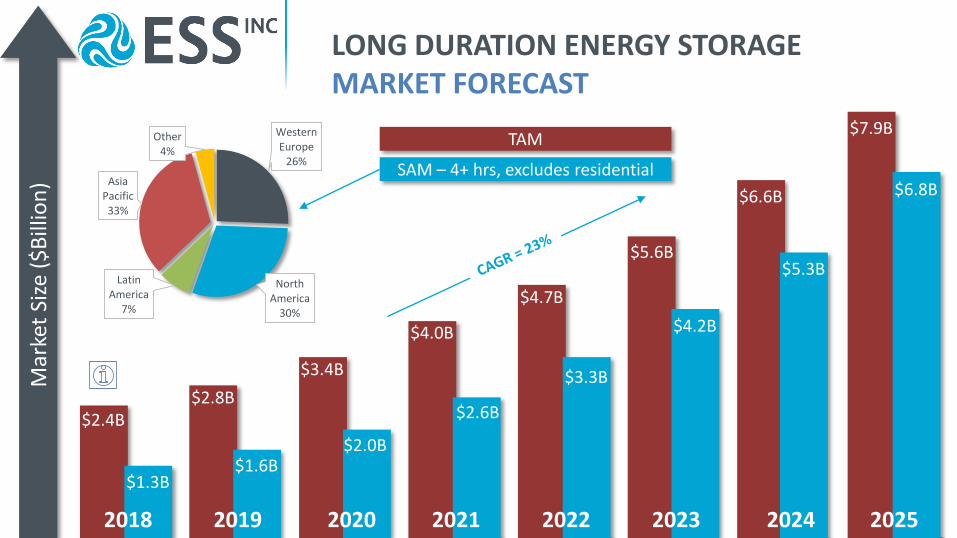
$2.4B$2.8B
$3.4B
$4.0B
$4.7B
$5.6B
$6.6B
$7.9B
$1.3B$1.6B
$2.0B
$2.6B
$3.3B
$4.2B
$5.3B
$6.8B
Western Europe
26%
North America
30%
Latin America
7%
Asia Pacific33%
Other4%
LONG DURATION ENERGY STORAGEMARKET FORECAST
TAM
SAM – 4+ hrs, excludes residential
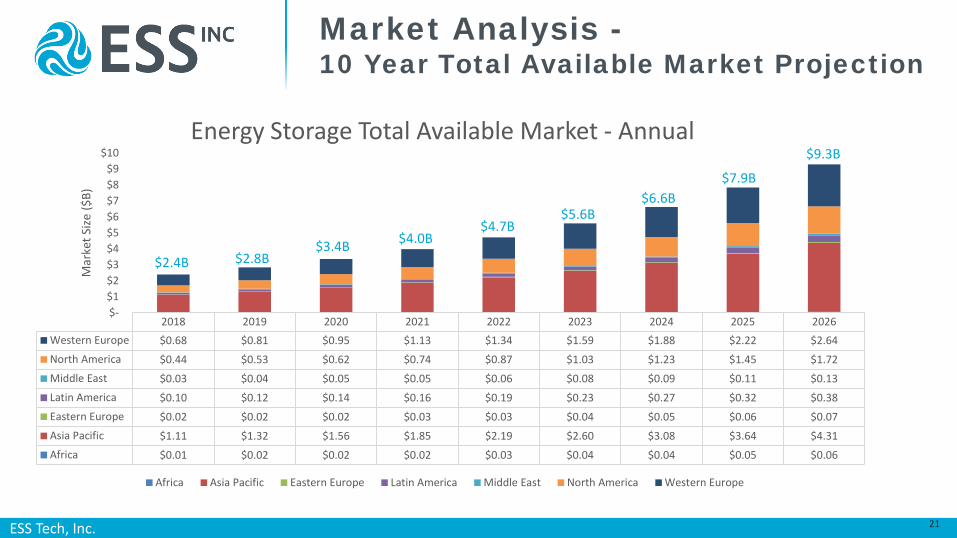
Market Analysis -10 Year Total Available Market Projection
2018 2019 2020 2021 2022 2023 2024 2025 2026Western Europe $0.68 $0.81 $0.95 $1.13 $1.34 $1.59 $1.88 $2.22 $2.64North America $0.44 $0.53 $0.62 $0.74 $0.87 $1.03 $1.23 $1.45 $1.72Middle East $0.03 $0.04 $0.05 $0.05 $0.06 $0.08 $0.09 $0.11 $0.13Latin America $0.10 $0.12 $0.14 $0.16 $0.19 $0.23 $0.27 $0.32 $0.38Eastern Europe $0.02 $0.02 $0.02 $0.03 $0.03 $0.04 $0.05 $0.06 $0.07Asia Pacific $1.11 $1.32 $1.56 $1.85 $2.19 $2.60 $3.08 $3.64 $4.31Africa $0.01 $0.02 $0.02 $0.02 $0.03 $0.04 $0.04 $0.05 $0.06
$- $1 $2 $3 $4 $5 $6 $7 $8 $9
$10
Mar
ket S
ize ($
B)
Energy Storage Total Available Market - Annual
Africa Asia Pacific Eastern Europe Latin America Middle East North America Western Europe
$2.4B $2.8B$3.4B $4.0B
$4.7B$5.6B
$6.6B$7.9B
$9.3B
ESS Tech, Inc. 21
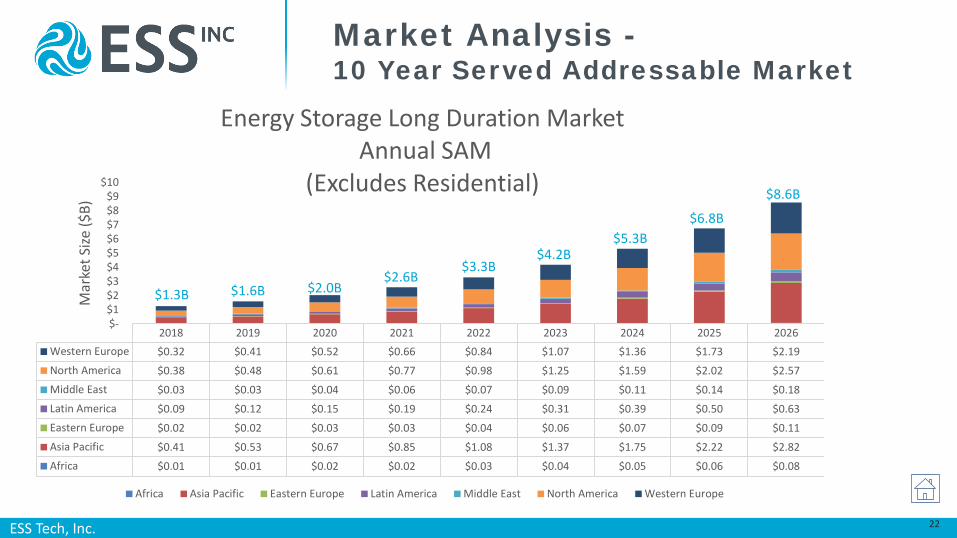
Market Analysis -10 Year Served Addressable Market
2018 2019 2020 2021 2022 2023 2024 2025 2026Western Europe $0.32 $0.41 $0.52 $0.66 $0.84 $1.07 $1.36 $1.73 $2.19North America $0.38 $0.48 $0.61 $0.77 $0.98 $1.25 $1.59 $2.02 $2.57Middle East $0.03 $0.03 $0.04 $0.06 $0.07 $0.09 $0.11 $0.14 $0.18Latin America $0.09 $0.12 $0.15 $0.19 $0.24 $0.31 $0.39 $0.50 $0.63Eastern Europe $0.02 $0.02 $0.03 $0.03 $0.04 $0.06 $0.07 $0.09 $0.11Asia Pacific $0.41 $0.53 $0.67 $0.85 $1.08 $1.37 $1.75 $2.22 $2.82Africa $0.01 $0.01 $0.02 $0.02 $0.03 $0.04 $0.05 $0.06 $0.08
$- $1 $2 $3 $4 $5 $6 $7 $8 $9
$10
Mar
ket S
ize ($
B)
Energy Storage Long Duration MarketAnnual SAM
(Excludes Residential)
Africa Asia Pacific Eastern Europe Latin America Middle East North America Western Europe
$1.6B $2.0B$2.6B
$3.3B$4.2B
$5.3B$6.8B
$8.6B
$1.3B
ESS Tech, Inc. 22


