FINAL REPORT July 2015 The Case for Space 2015 The impact of space on the UK economy FULL REPORT A study for the Satellite Applications Catapult, Innovate UK, UKspace and the UK Space Agency
Transcript
FINAL REPORT
July 2015
The Case for Space 2015
The impact of space on the UK economy
FULL REPORT
A study for the Satellite Applications Catapult,Innovate UK, UKspace and the UK Space Agency
About London Economics
London Economics (LE) is a leading independent economic consultancy, headquartered in London, with a dedicated team of professional economists specialised in the application of best practice economic and financial analysis to the space sector. As a firm, our reputation for independent analysis and client‐driven, world‐class and academically robust economic research has been built up over 25 years.
Drawing on our solid understanding of the economics of space, expertise in economic analysis and best practice industry knowledge, our space team has extensive experience of providing independent analysis and innovative solutions to advise clients in the public, private and third sectors on the economic fundamentals, commercial potential of existing, developing and speculative market opportunities to reduce uncertainty and guide decision‐makers in this most challenging of operating environments.
All consultants of our space team are highly‐qualified economists with extensive experience in applying a wide variety of analytical techniques to the space sector, including:
Insightful and accurate market analysis and demand forecasting; Analysis of industrial structure, strategy and competitive forces; New technology adoption modelling; Estimation of public utility benefits; Opportunity prioritisation and targeting to maximise exploitation of investment; Sophisticated statistical analysis (econometrics, regression); Economic and financial modelling, including: Cost‐Benefit Analysis (CBA), cost effectiveness
analysis, Value for Money (VfM), impact assessment, policy evaluation, business case development, cash flow and sustainability modelling.
Head Office: Somerset House, New Wing, Strand, London WC2R 1LA, United Kingdom. w: londoneconomics.co.uk/aerospace e: [email protected] t: +44 (0)20 3701 7700 :@LE_Aerospace
Acknowledgements
We would like to acknowledge the useful guidance and feedback provided by the Satellite Applications Catapult, Innovate UK, UKspace and the UK Space Agency throughout this research. We would also like to thank all of the stakeholders consulted for their time and informative response. Responsibility for the contents of this report remains with London Economics.
Wherever possible London Economics uses paper sourced from sustainably managed forests using production processes that meet the EU eco‐label requirements.
London Economics Ltd is a Limited Company registered in England and Wales with registered number 04083204 and registered offices at Somerset House, New Wing, Strand, London WC2R 1LA. London Economics Ltd's registration number for Value Added Tax in the United Kingdom is GB769529863.
1.3 Differences compared to the ‘Size and Health’ study 3
1.4 Caveats and limitations 3
1.5 Structure of the report 4
2 Defining the UK space economy 6
2.1 Defining ‘space economy’ 6
2.2 Challenges of measuring the space economy 7
2.3 Segmentation of the space economy 8
3 UK space economy in perspective 10
3.1 Turnover 10
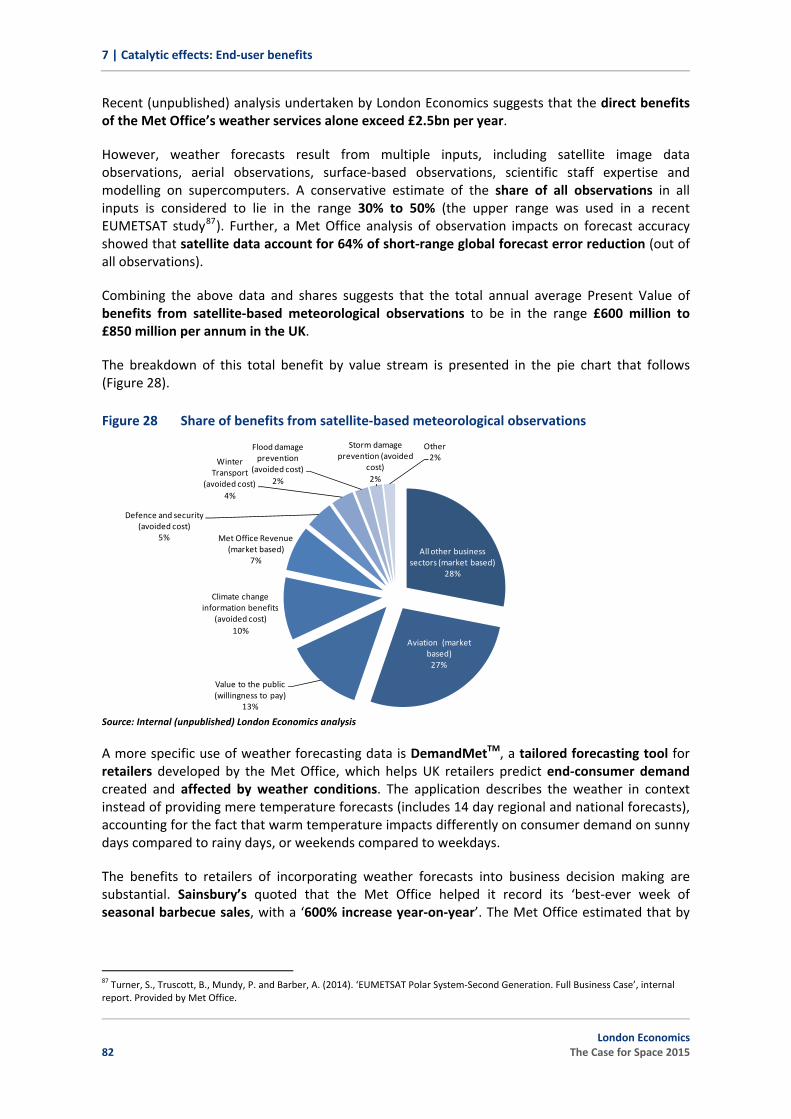
3.2 Composition 20
3.3 Skills and qualifications 21
3.4 Customer mix 23
3.5 Export intensity and markets 24
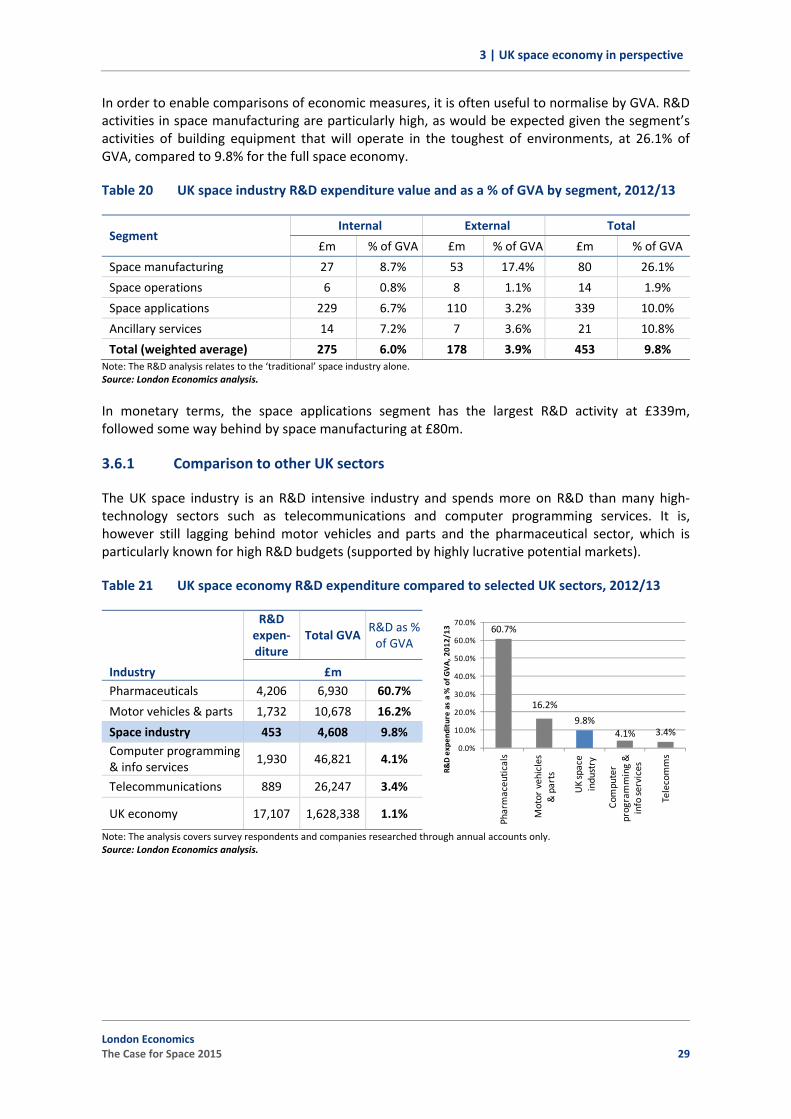
3.6 R&D investment 27
4 Government engagement in the space economy 31
4.1 Rationale for government intervention in space 31
4.2 UK Government support to the space economy 35
5 Economic impact of the UK space economy: Direct, indirect and induced effects 41
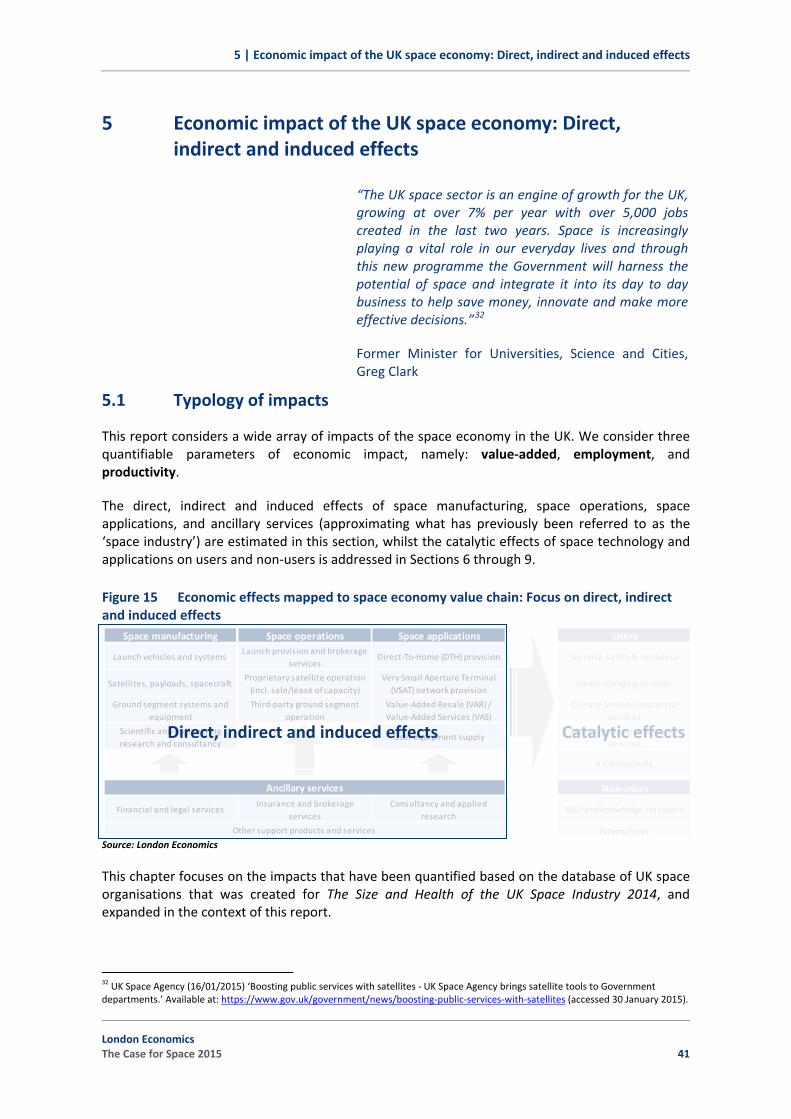
5.1 Typology of impacts 41
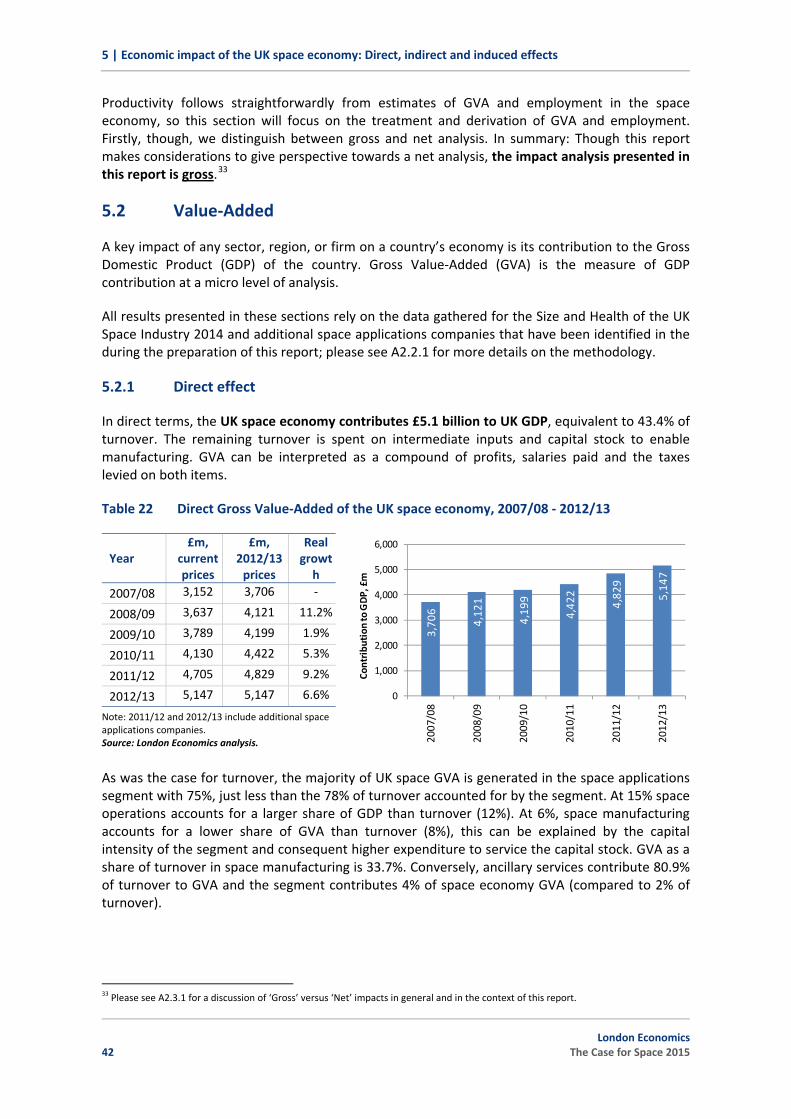
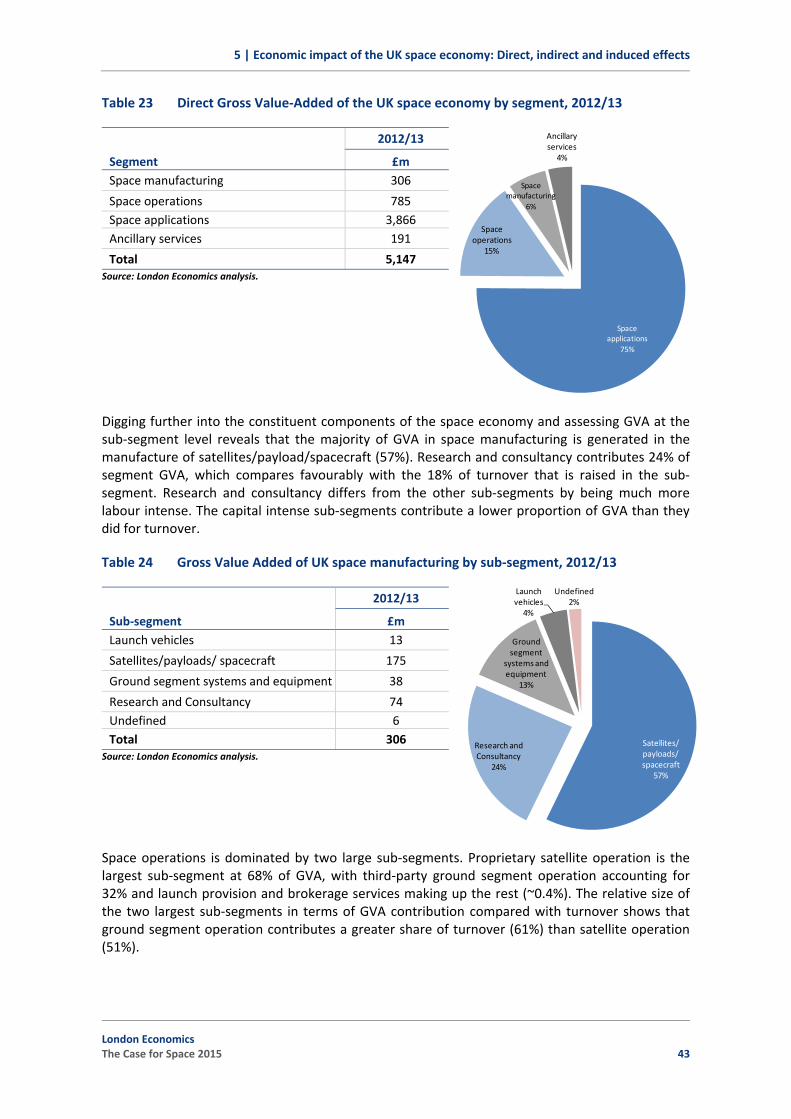
5.2 Value‐Added 42
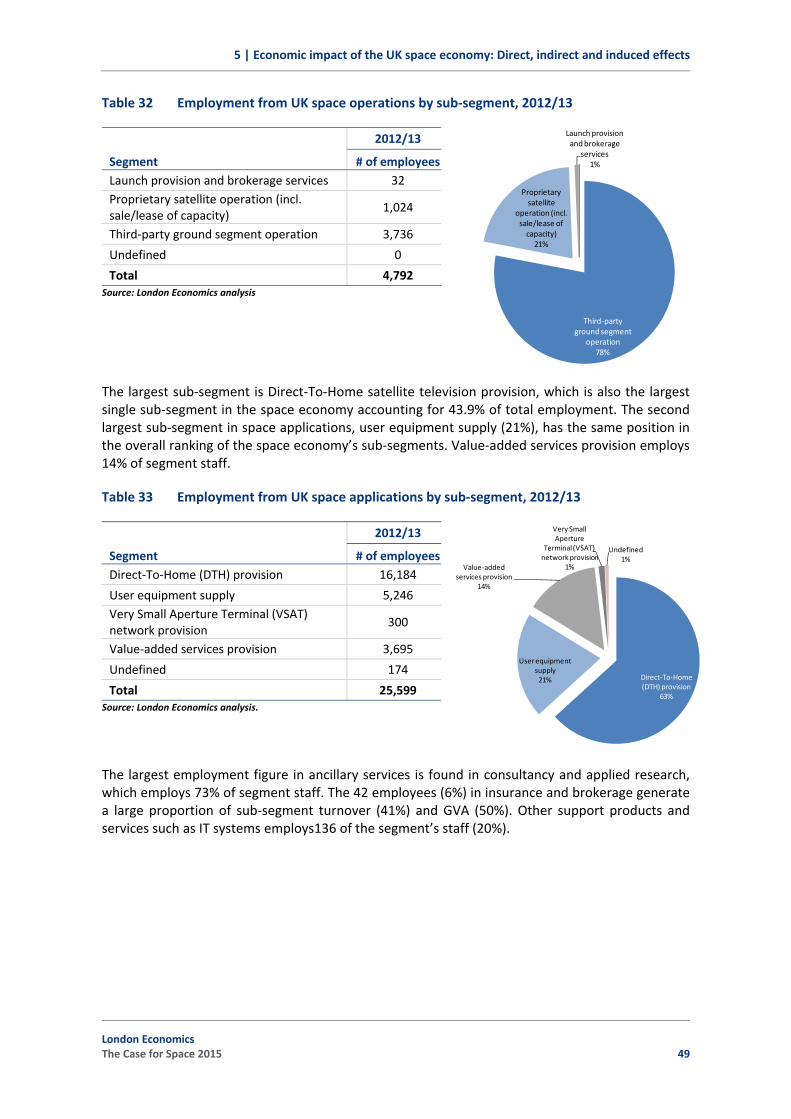
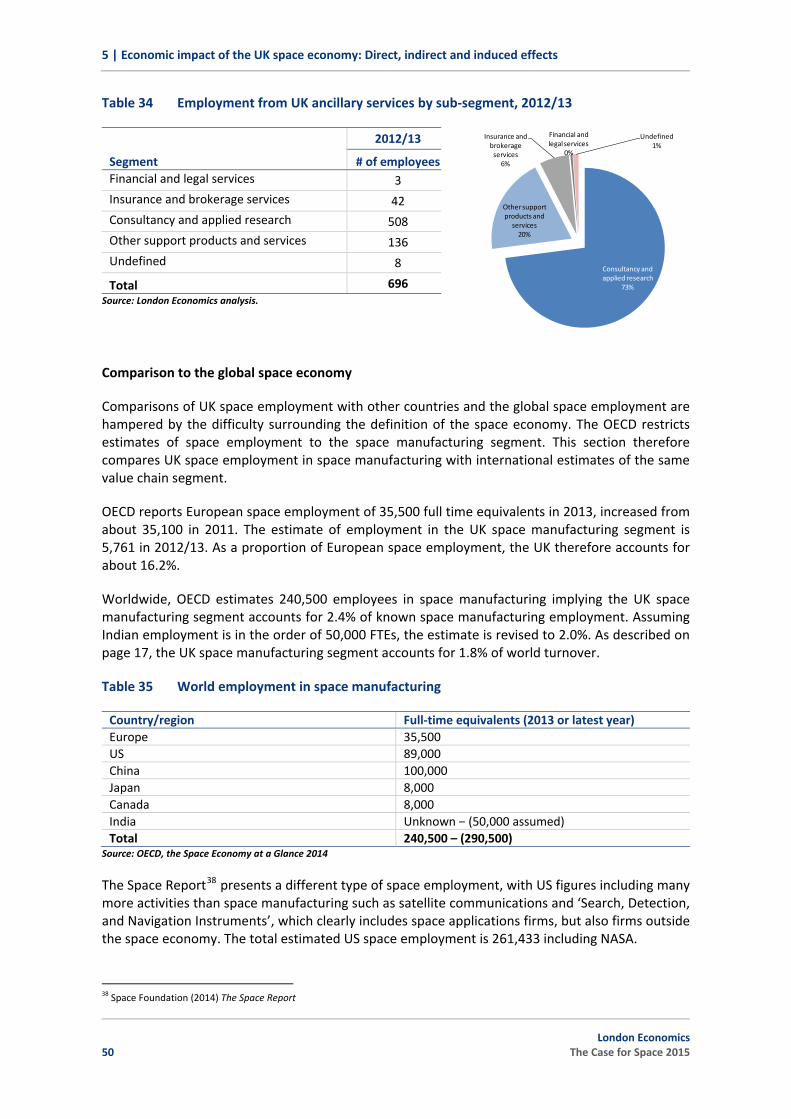
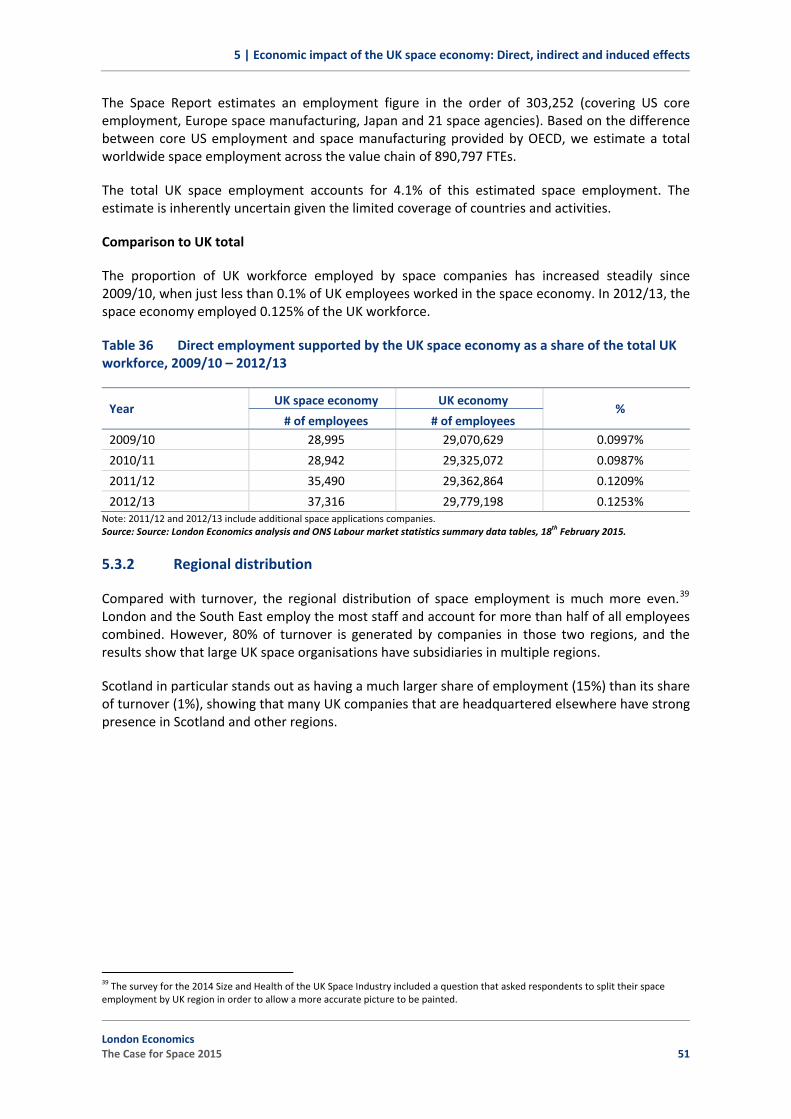
5.3 Employment 47
5.4 Productivity 55
5.5 Foreign Direct Investment (FDI) 57
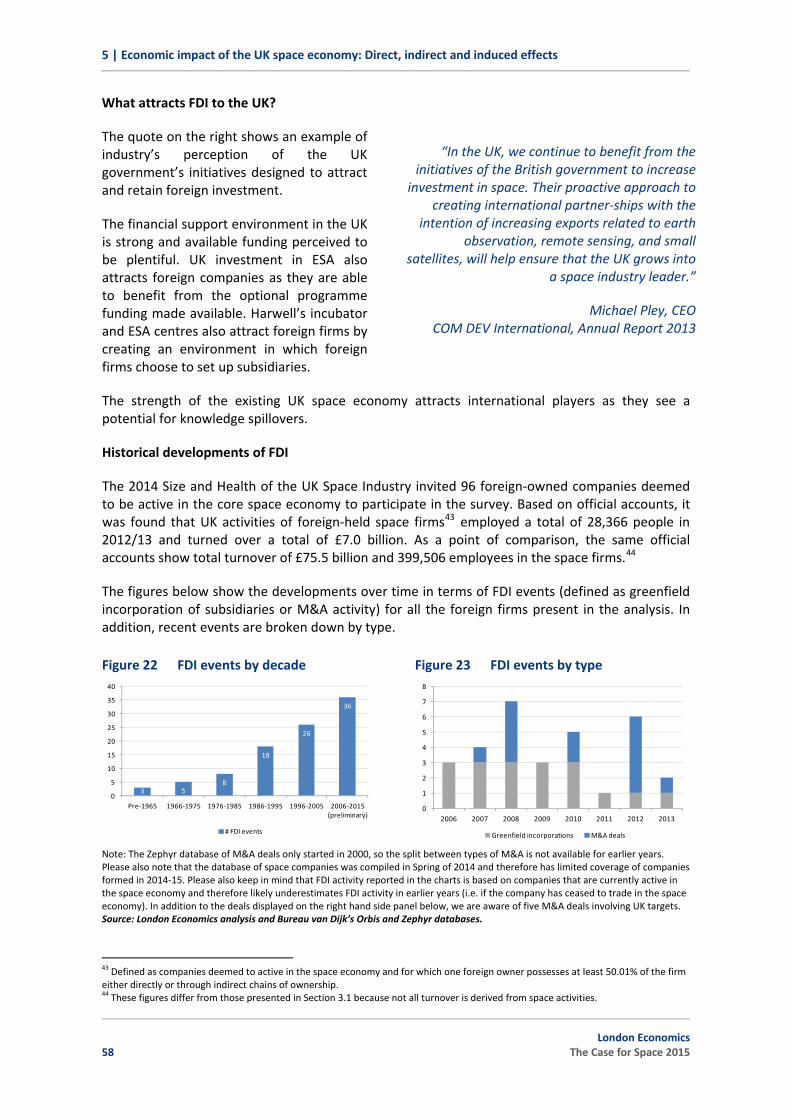
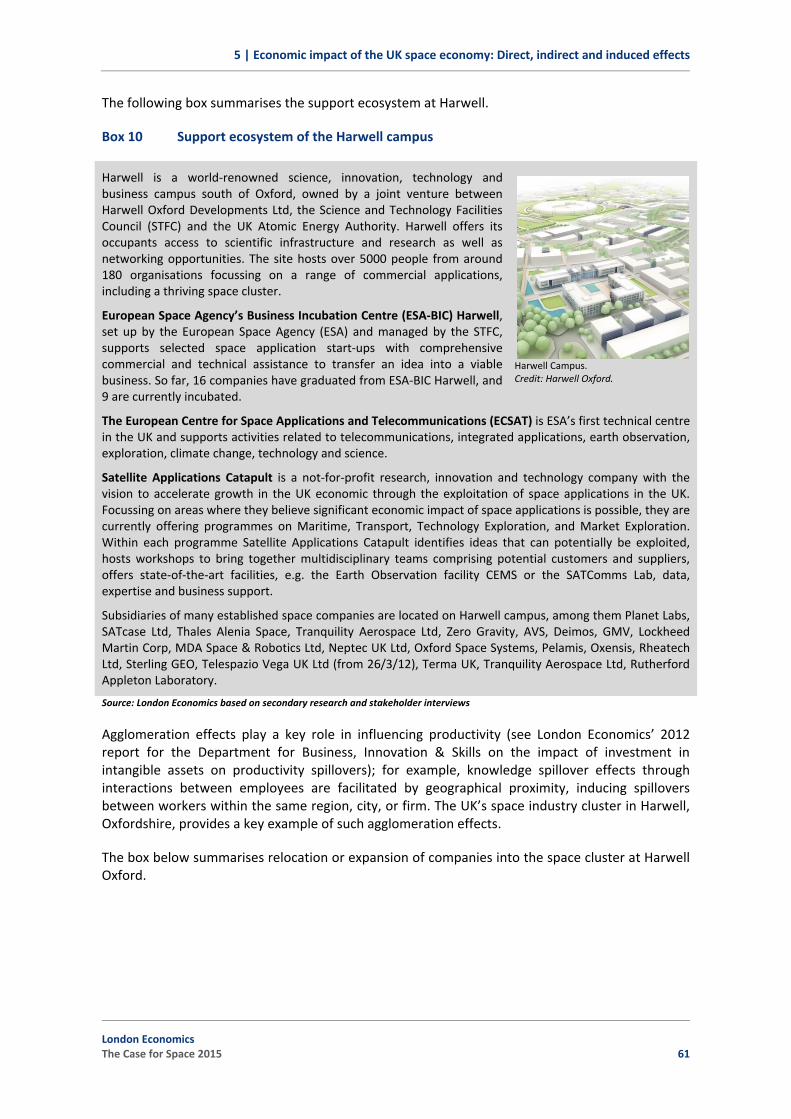
5.6 Harwell Oxford campus 60
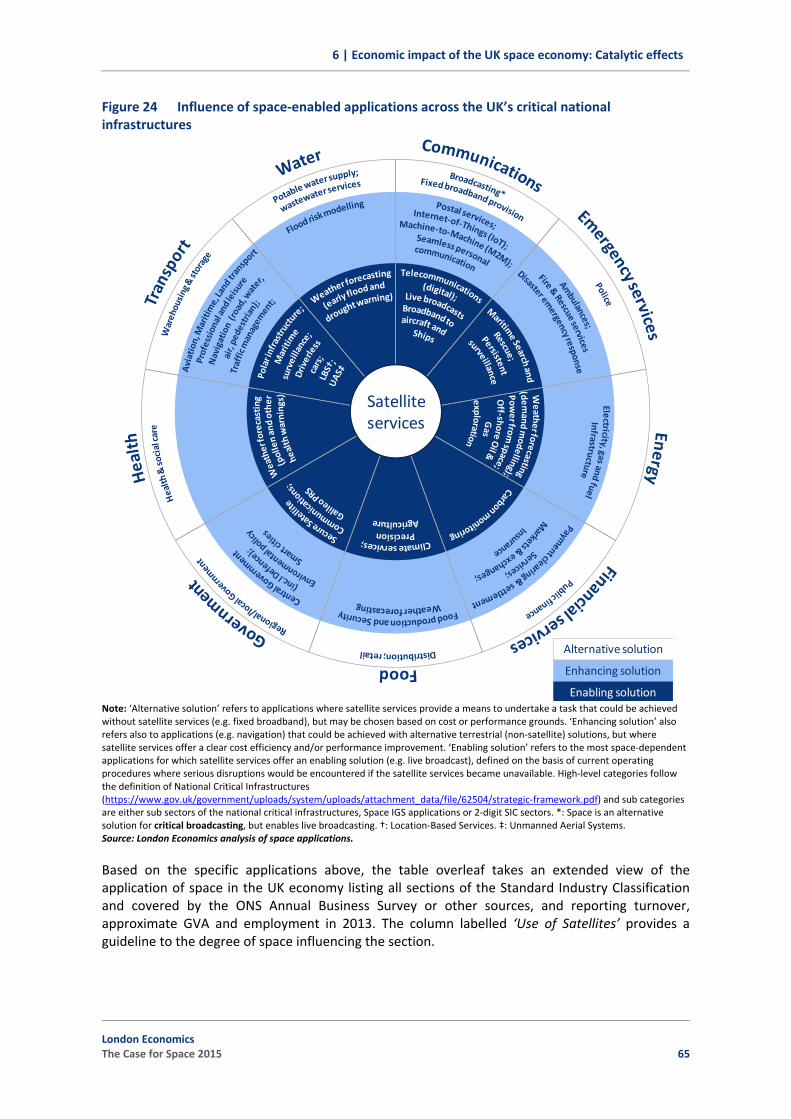
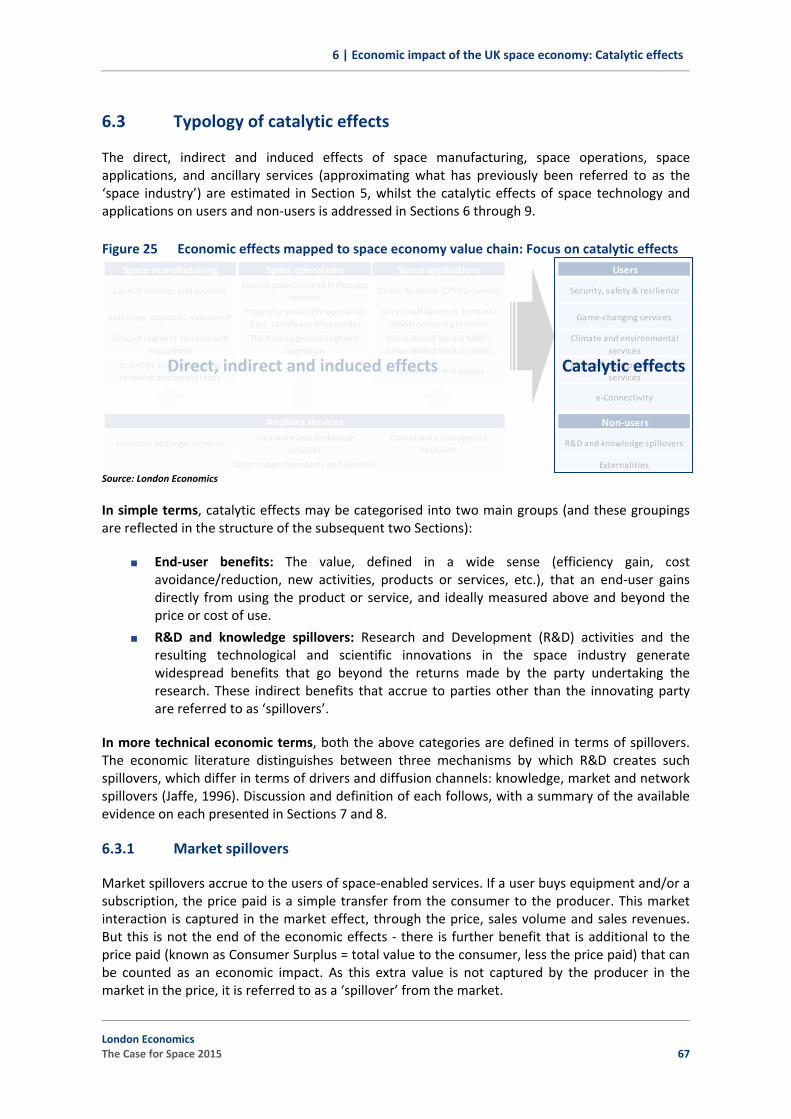
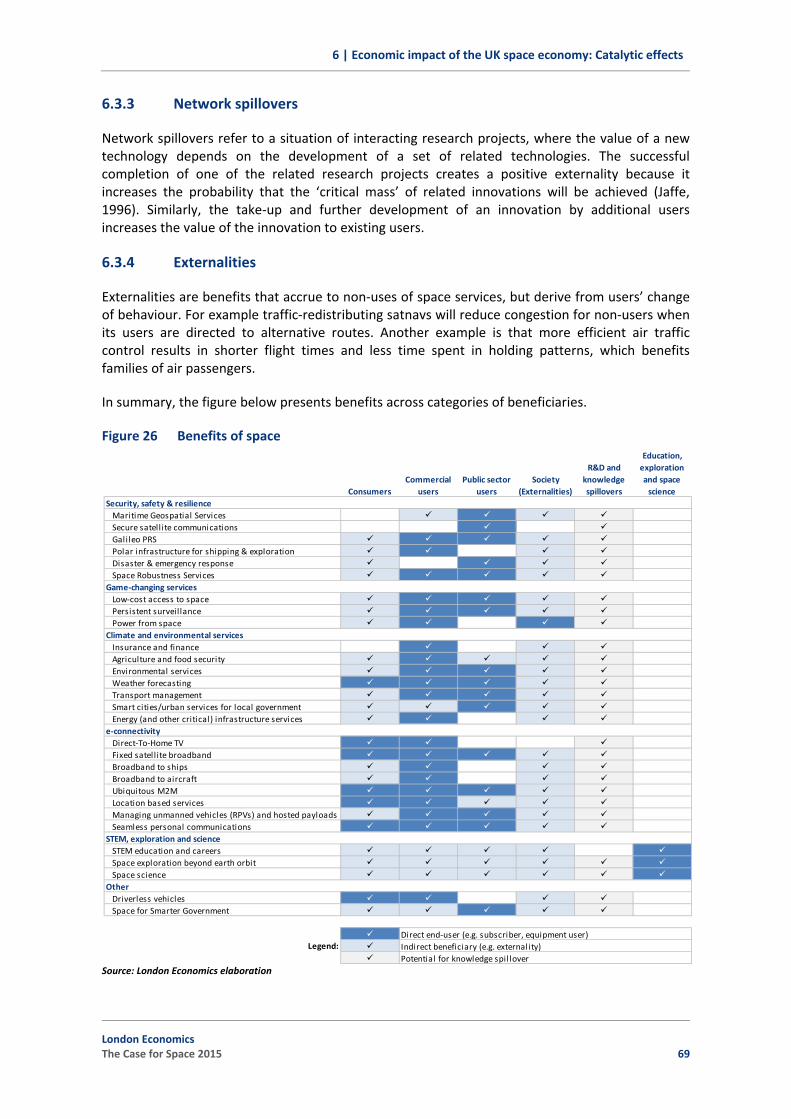
6 Economic impact of the UK space economy: Catalytic effects 63
6.1 Space applications as ‘General Purpose Technologies’ 63
6.2 Span of influence of space‐enabled applications 64
6.3 Typology of catalytic effects 67
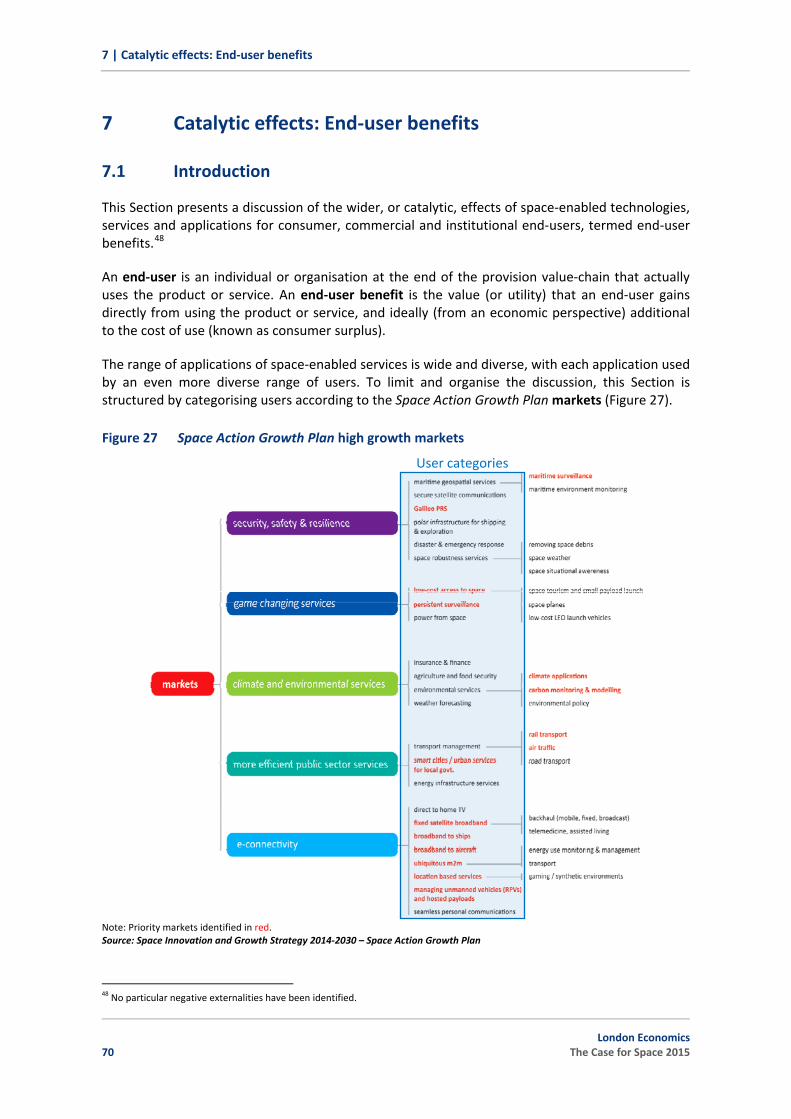
7 Catalytic effects: End‐user benefits 70
7.1 Introduction 70
7.2 Security, safety & resilience 71
7.3 Game‐changing services 77
7.4 Climate and environmental services 79
7.5 More efficient public sector services 83
Table of Contents Page
ii London Economics
The Case for Space 2015
7.6 e‐connectivity 86
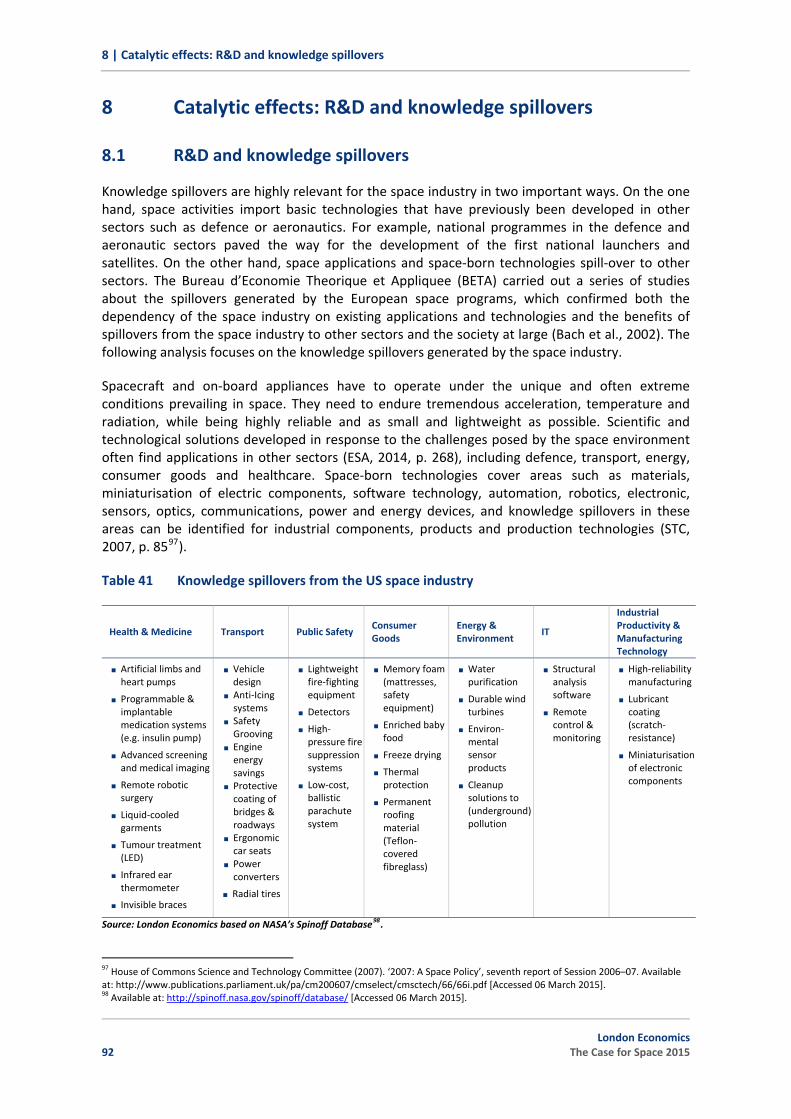
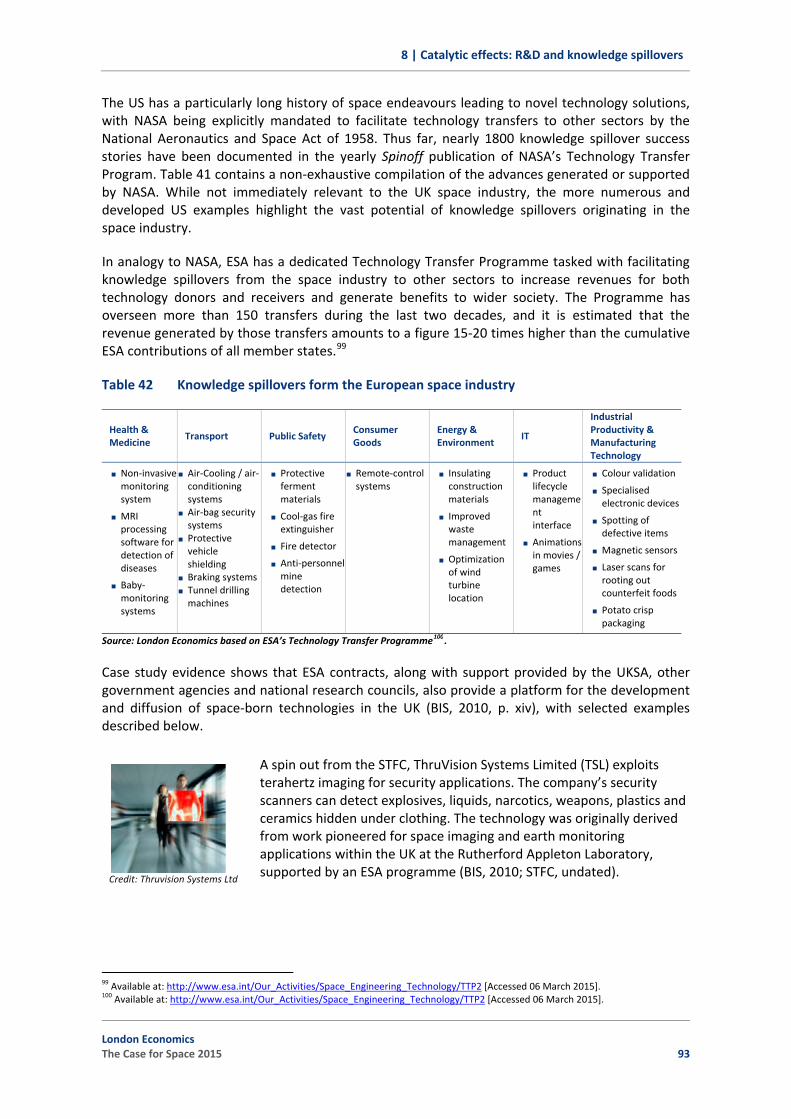
8 Catalytic effects: R&D and knowledge spillovers 92
8.1 R&D and knowledge spillovers 92
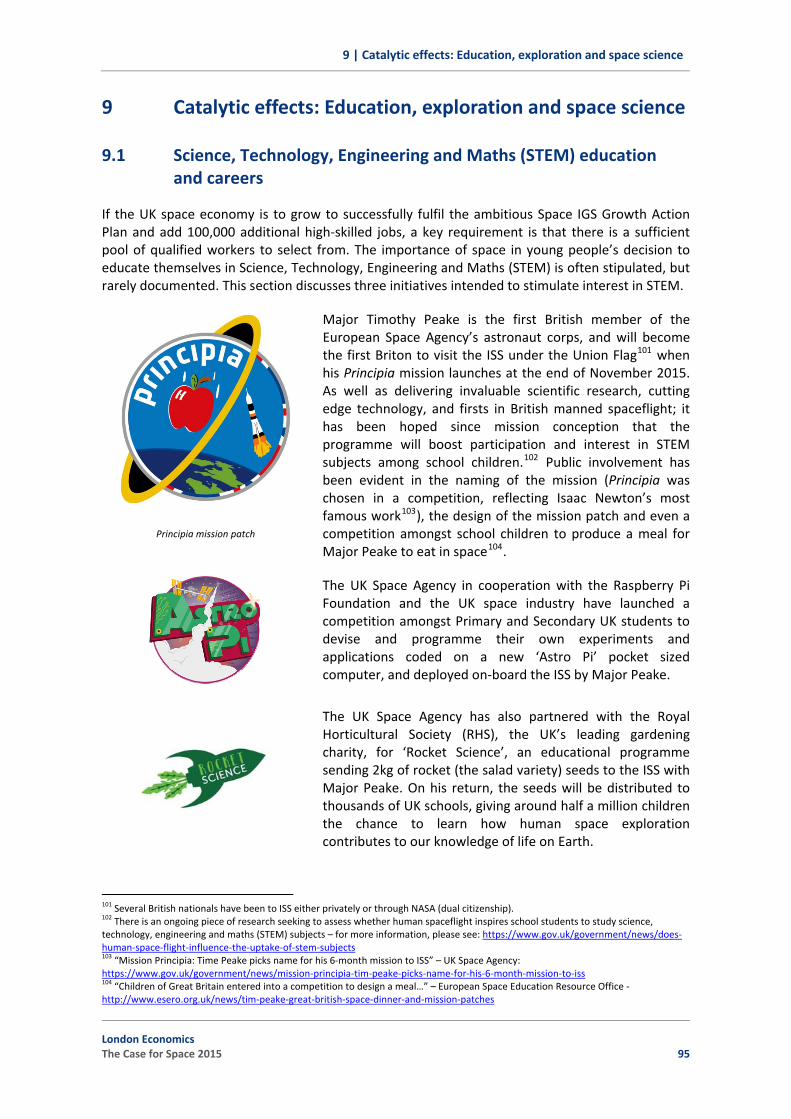
9 Catalytic effects: Education, exploration and space science 95
9.1 Science, Technology, Engineering and Maths (STEM) education and careers 95
9.2 Space exploration beyond earth orbit 96
9.3 Space science 99
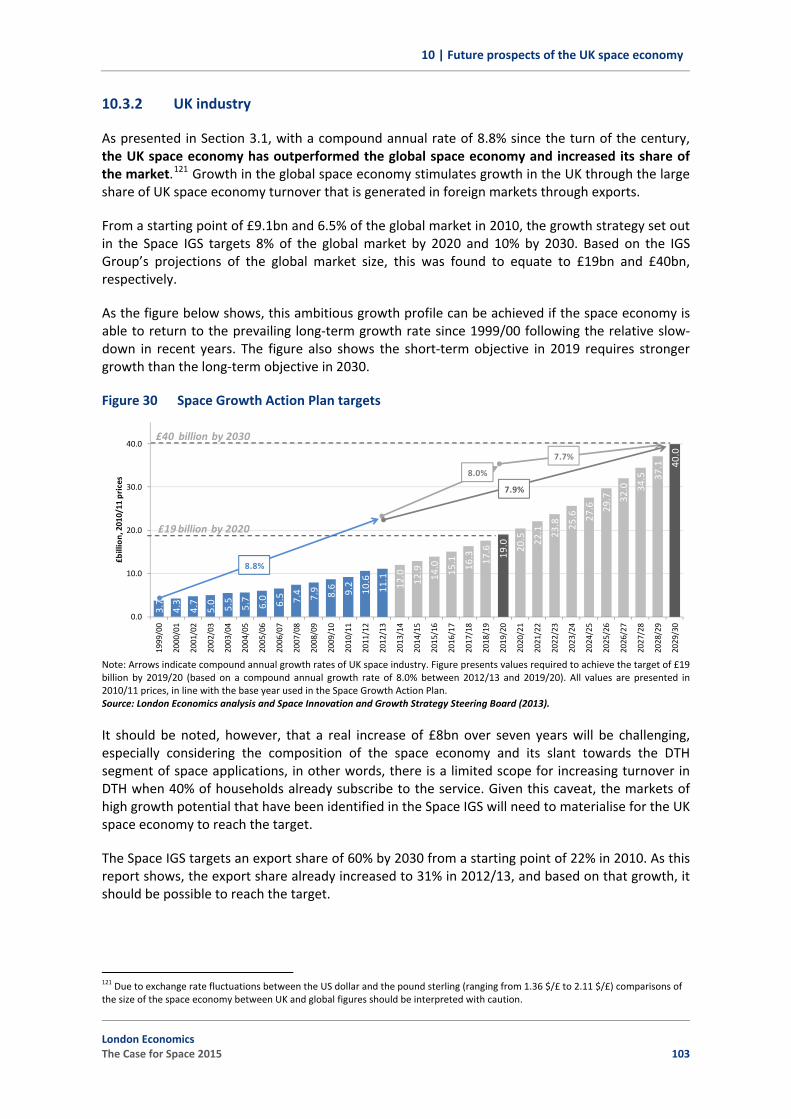
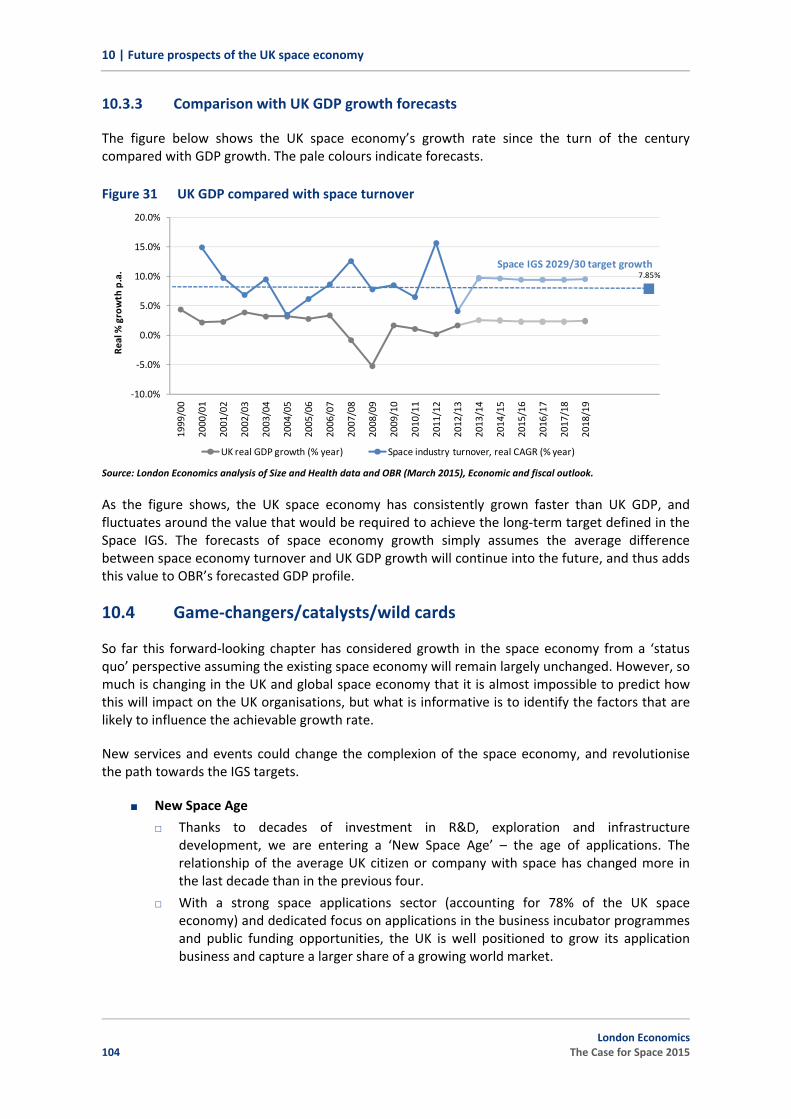
10 Future prospects of the UK space economy 101
10.1 Introduction 101
10.2 Strengths of the UK space economy 101
10.3 Potential growth path 102
10.4 Game‐changers/catalysts/wild cards 104
10.5 Applications and end‐users: Space IGS high growth markets 109
10.6 Summary 110
Glossary 112
References 113
Index of Tables, Figures and Boxes 114
ANNEXES 118
Annex 1 Steering Committee 119
A1.1 Steering Committee membership 119
Annex 2 Methodology 119
A2.1 Defining the space economy 119
A2.2 UK space economy in perspective 126
A2.3 Economic impact of the UK space economy: Direct, indirect and induced effects 128
A2.4 Foreign Direct Investment (FDI) 132
1 | Introduction and context
1 Introduction and context
Space technology is already woven into the fabric of modern daily life in the UK. From weather forecasts consulted before leaving home, location‐based services on smartphones, live events broadcast to television screens, to broadband connectivity in rural ‘not‐spots’, space‐enabled technologies are an integral part, and enhancement, of the everyday lives of UK citizens. Space technologies also enable an increasingly diverse range of business applications for professionals (e.g. aviation, surveying, agriculture, fisheries), commercial organisations (e.g. geological exploration, infrastructure monitoring, communication connectivity), critical infrastructures (e.g. transport, power, energy, telecoms, financial and civil infrastructures), public safety and security (e.g. defence forces, police, emergency services), and public agency users (e.g. environmental monitoring and disaster response, criminal justice). With such a span of influence, the availability and continuity of space services is of significant economic importance. Looking to the future, the considerable potential for the continued development of applications will drive innovation, providing important spillovers of knowledge and skills to the wider economy.
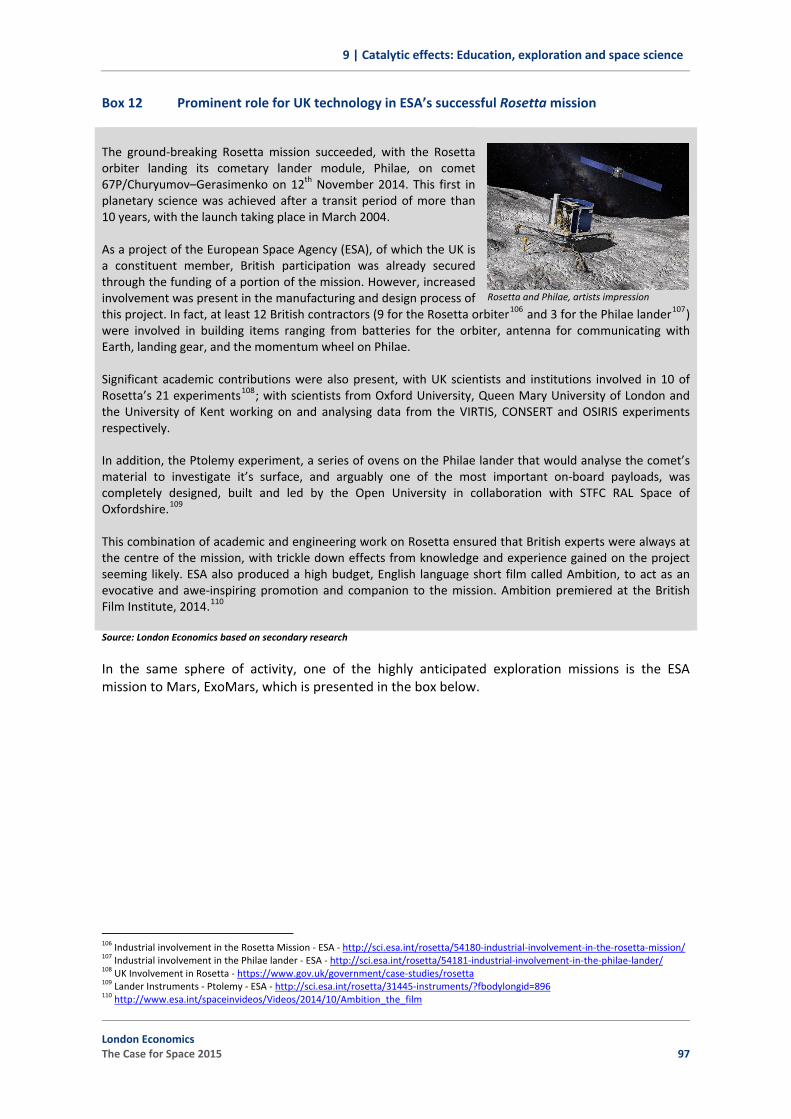
On the supply side, the UK has a long and distinguished history of involvement in space.1 Indeed, in 2012 the UK celebrated 50 years of UK space science. Since Ariel‐1, the world’s first international satellite, carried UK experiments to solar orbit and made the UK the world’s 3rd space‐faring nation in 1962, the UK’s involvement in space has grown substantially, both institutionally and commercially. The path hasn’t always run smooth, but with ambitious long‐term objectives set out to 2030, the future is promising. Following on from a successful role in the Rosetta (Philae) mission, the UK Space Agency’s first CubeSat mission (UKube‐1), record industry performance, and recently announced government investment that will see the UK will playing the lead role in Europe's 2018 ExoMars mission, this report comes at an exciting time for the UK in space.
The supply and consumption of space technologies in the UK contributes to GDP, provides employment, boosts productivity in space and non‐space sectors (knowledge spillovers), and offers utility benefits for consumers, producers, and society (environment, policy‐making, defence, etc.). The aggregate of these effects is the gross impact of space on the UK economy.
1.1 Research objectives
This report aims to draw together existing evidence and conduct new analysis to assess this impact and provide answers to the questions: How significant is the contribution of space to the UK economy?; and how important is UK government support for the space economy?
Whilst an accurate answer (i.e. net impact) would require a much larger piece of research consisting of a meta‐analysis of economic studies to rigorously assess the additionality of each investment and activity, this study endeavours to provide an assessment of gross impact.
London Economics were commissioned to undertake this study on behalf of Innovate UK, the Satellite Applications Catapult, UKspace trade association and the UK Space Agency (represented by, and hereafter referred to as, ‘the Steering Committee’). This study complements and satisfies an Action (4.3) in the IGS Space Growth Action Plan 2014‐2030 for stakeholders to undertake a number of studies, including updating the economic impact study of the benefits of space for private business, UK citizens and government itself.
1 Please see Section 4.2 for a more detailed overview of the history of UK space involvement and government support.
London Economics The Case for Space 2015 1
1 | Introduction and context
This study, The Case for Space 2015, represents an update and extension of research originally undertaken in 2006, and updated in 2009, to assess the impact of space on the UK economy. This updated study has a base year of the 2012/13 financial year.2
This report is targeted towards a two‐part audience: 1) governmental economists and policymakers; and 2) industry, users and the general public. Its aim is to provide a broader and deeper economic case to promote a better understanding of the economic arguments for further government involvement in this growing sector.
1.2 Overall approach
This research has been carried out using a mix of desk‐based research of existing literature and information sources, re‐orientation of previous industrial analysis, enhanced by additional comparative analysis of secondary sources, and supplemented by a short programme of qualitative research involving semi‐structured interviews with selected key stakeholders. This report presents the findings of our research and analysis. More specifically, the tasks were:
Review of segmentation and definitions: Developments in the space value chain since 2009, and advancements in analytical best practice towards international consensus, motivated and necessitated a review and modernisation of the value chain segmentation to be used as the framework for the study.
Re‐orientation of previous analysis: The most recent data on the space industry and economy is that collected for the latest edition of the UK Space Agency’s biennial The Size and Health of the UK Space Industry, undertaken by London Economics. With a modernised segmentation,3 it has been necessary to re‐orientate the existing analysis.
Additional comparative analysis: For additional context and perspective, data was also sourced at the national and company levels from a variety of secondary sources – both publicly available (e.g. UK Space Agency, ESA, ONS, OECD, Companies House, company websites) and subscription‐based (e.g. Bureau van Dijk’s ORBIS financial database).
Desk‐based research of existing literature: The study benefits from a programme of secondary research covering: previous Case for Space studies; relevant UK space strategy documents; historical UK investment in space programmes; R&D spillover literature; and published information for case studies (including EU studies on Galileo and Copernicus and other UK studies such as an evaluation of Met Office activities).
Short programme of qualitative research: To supplement the analysis and provide a richer understanding of the impact of space, we supplemented our research with a small programme of semi‐structured interviews with selected key stakeholders. The application of the knowledge gain through this qualitative research was primarily employed to enrich the Case Studies to illustrate the catalytic effects of space‐enabled services and applications.
2 The base year was determined by the available data – the latest comprehensive data on the sector comes from The Size & Health of the UK Space Industry (October 2014) which has 2012/13 as its base year. 3 The Size and Health study series is constrained by the need for historical consistency of the data series, and thus consistency of the segmentation. The modernised segmentation adopted for the current study is consistent with that segmentation, representing a reorganisation of sub‐sector activities.
2 London Economics
The Case for Space 2015
1 | Introduction and context
1.3 Differences compared to the ‘Size and Health’ study
Since 1992, the UK Space Agency4 has periodically surveyed organisations in the UK that supply to the space sector in a series of studies entitled The Size and Health of the UK Space Industry, providing a historically consistent series of the state of the UK space industry.
This report complements the Size and Health studies by focusing on the impact of space in the UK, providing a more detailed assessment of the full economic contribution of space to the UK economy. It highlights the important role that UK Government support has played in developing the space economy to achieve growth that outstrips that of the wider UK economy, and should hopefully continue to play in promoting the further expansion of this UK industrial success story that provides capabilities to benefit UK citizens and organisations.
It differs from the recently published analysis of The Size and Health of the UK Space Industry 2014 (hereafter referred to as, ‘the Size and Health study’) in a number of important aspects:
Metrics: The Size and Health study primarily measures the total size (in terms of revenues) of the UK space industry, whereas The Case for Space is focused on measuring the wide ranging impacts and contribution of space to the UK economy and society.
Catalytic impacts: Whilst the Size and Health study includes initial estimates of the use of space services by the wider space economy, The Case for Space seeks to de‐lineate applications from use and explicitly describe, quantify and monetise (where possible) benefits to non‐space users of space assets and services: both private benefits (e.g. cost efficiencies, productivity boost) and social benefits (externalities).
Legacy definitions: The Size and Health study is the latest in a long series of biennial studies providing a historically consistent series of observations on the state of the UK space industry. The industry and economy definition and value chain segmentation were thus constrained by the need to preserve the consistency and comparability of the historical data series. The Case for Space study is not anchored to any particular definition, and so is free to move towards the emerging international standard of the OECD definitions.
Nonetheless, The Size and Health of the UK Space Industry 2014 remains a very important input into this impact analysis.
1.4 Caveats and limitations
The research has been conducted by a team of independent professional economists with specialist knowledge of the space sector, using best practice and best judgement to calculate the most robust and fair estimates. The methodology used and assumptions made are described in this report in a transparent manner, with caveats noted as required. Nonetheless, the reader should bear in mind the following high‐level limitations and caveats throughout:
Measurement error uncertainty: Characteristics of the space sector make it inherently difficult to measure economic activity (see Section 2.2). In the absence of a matching industrial classification in Official Statistics, the analysis employs estimation and approximation techniques based on survey data (collected as part of the Size and Health study), supplemented by financial account data (statutory reporting, ORBIS database) and
4 And its predecessor, the British National Space Centre (BNSC).
London Economics The Case for Space 2015 3
1 | Introduction and context
desk‐based research. It is therefore not possible to accurately assess the coverage of the analysis (measured impact is a lower‐bound estimate – a conservative bias) and the measurement error associated with survey respondent data. This report marks the first attempt at broadening the analysis from UK space industry to space economy which has required compromises and extrapolation of existing data. In future studies, such lessons can be applied at the data collection stage to yield more robust estimates.
Gross impact: This research estimates the gross impact of the space economy in the UK. Whilst it notes the role and contribution of HM Government historically, it does not draw causality between the two. A net impact (return on investment of public funding) analysis would require strict establishment of the counterfactual scenario for each instance of funding (e.g. in the case of ESA programmes: the hypothetical performance of individual ESA contractors without award and fulfilment of the ESA contract(s) that they were awarded), and causality of effects (e.g. additional sales to space and non‐space sector stimulated by the research, capability and/or technology developed under the ESA contract(s) over a period of years following completion of the contract; indirect effects on ESA contractors’ supply chains). Establishment of both would require a bespoke survey, and is beyond the scope of this study. For further discussion, please see section A2.3.1.
Catalytic effects of UK space capabilities: As noted by the OECD (2014)5, there has been a trend towards the internationalisation (or ‘globalisation’) of product and service supply chains for space systems.6 This complicates attribution of the value of multi‐national, multi‐constellation and multi‐generational space initiatives to the UK (e.g. the Galileo programme7). Accordingly, the wider utility, catalytic and spillover effects of R&D activity and services provided by the space industry are not measured quantitatively, but rather illustrated qualitatively (with quantification of benefits wherever information availability allows) using a selection of Case Study vignettes.
1.5 Structure of the report
The report is comprised of 6 distinct chapters, with additional information provided in the Annex. Following this introduction to the study (Section 1), the report proceeds as follows:
Section 2 outlines important definitions and segmentations used to frame the analysis; Section 3 provides a profile of the UK space economy in terms of size (revenue),
composition and performance (skills, export, R&D), both in absolute terms and relative to the UK economy, other UK sectors, and internationally against the global space economy;
Section 4 sets out the rationale for government intervention in the space sector, an overview of current and historical UK Government involvement, with international comparisons;
5 OECD (2014) The Space Economy at a Glance 2014. 6 Although, recent developments (e.g. restrictions on trade in engines and satellites between the US and Russia, and Russia’s potential secession from the International Space Station after 2024) may signal a turning of the tide. Nonetheless, the UK model of space exploitation and exploration will continue to rely on collaboration with its European and other international partners. 7 For example: The Galileo programme – Europe’s satellite navigation system in development – is funded by EC Member States and ESA Member States (incl. Norway and Switzerland). Galileo will be either the 3rd or 4th Global Navigation Satellite System (GNSS) constellation to reach Full Operational Capability (FOC), after the ubiquitous GPS, GLONASS (e.g. in most smartphones, many professional devices), and potentially China’s developing BeiDou II (also known as COMPASS). As the downstream GNSS user equipment market moves towards multi‐constellation, multi‐sensor and multi‐functional receivers and solutions, the return to EU/ESA/national citizens of EU/ESA/national investment in Galileo be measured? Add to this generational evolution of GPS (3rd gen: GPS III) / GLONASS (3rd gen: GLONASS‐K), each offering incremental service and performance improvements (thus evolving the counterfactual baseline) and the question gets further complex – Galileo 1st gen should reach FOC before GPS III FOC.
4 London Economics
The Case for Space 2015
1 | Introduction and context
Section 5 presents a broad evidence‐based assessment of the gross direct, indirect and induced economic impact of the UK space economy, and economic contribution to the UK economy;
Looking beyond industrial activity to the catalytic effects of the downstream utilisation of space‐enabled services, Section 6 explains the role that space plays in supporting economic activity across a broad range of sectors and introduces a typology of the catalytic effects to be expanded on in subsequent sections: Section 7 illustrates the benefits of space‐enabled technologies for consumer, commercial and institutional end‐users; Section 8 reviews evidence on the catalytic effects of knowledge spillovers; and Section 9 considers the important inspirational impact of space on education, exploration and space science.
Section 10 looks to the future to consider the future prospects for the UK space economy to continue and expand its substantial economic impact.
London Economics The Case for Space 2015 5
2 | Defining the UK space economy
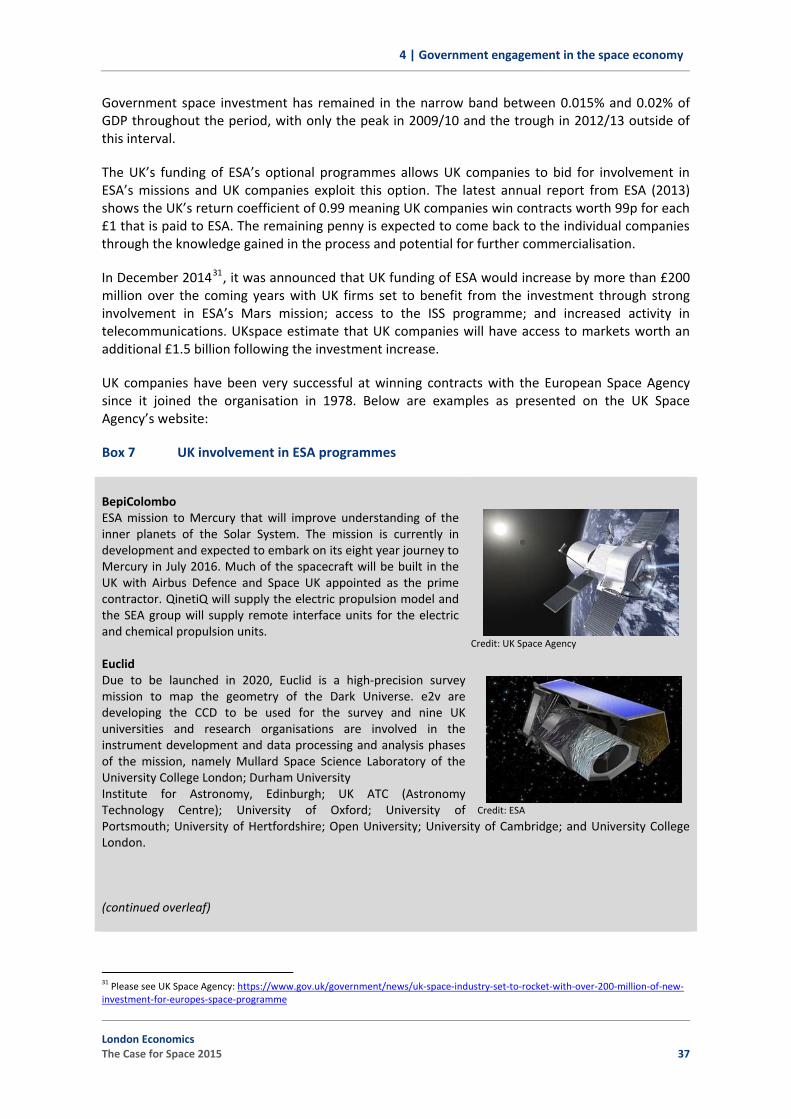
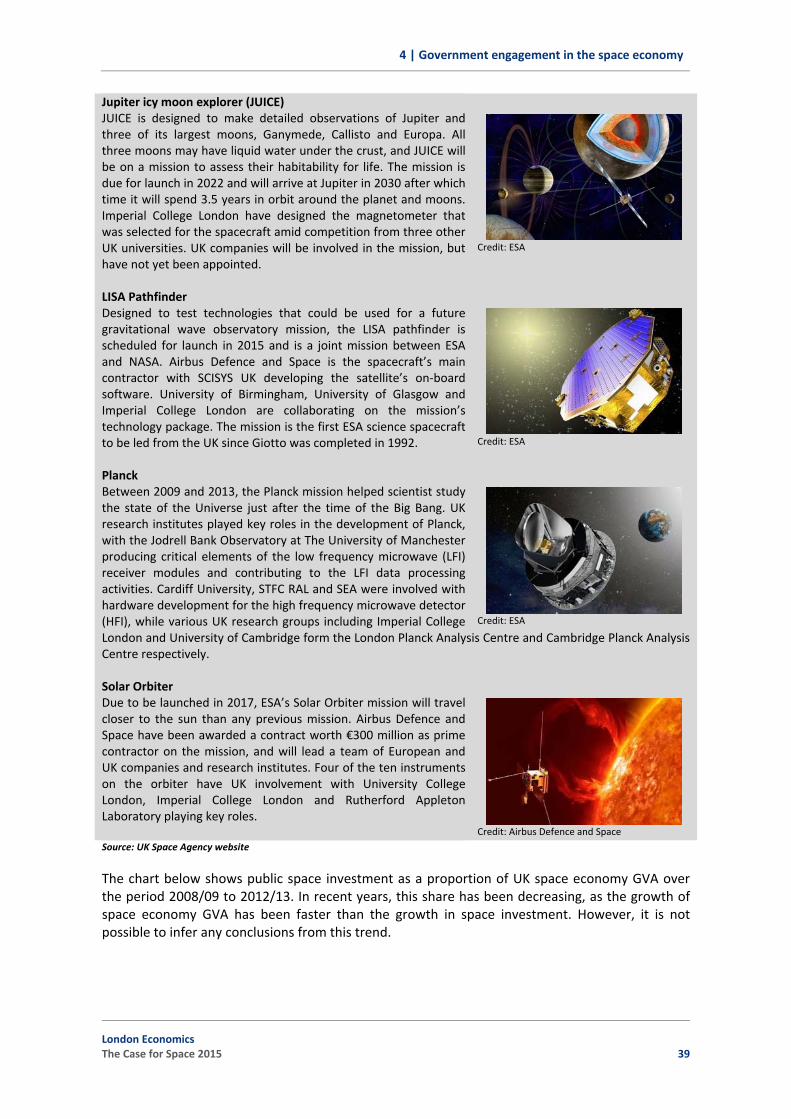
2 Defining the UK space economy
2.1 Defining ‘space economy’
Before measuring the impact of space activity, it is first necessary to define ‘space activity’, the associated concept of the ‘space economy’, and the application of each to the UK case.
The OECD is one of the thought‐leaders in this area, and has published a Handbook on Measuring the Space Economy (OECD, 2012). A strict definition proffered by the OECD in the Handbook based on the specifics of space activities is that: “The space sector includes all actors involved in the systematic application of engineering and scientific disciplines to the exploration and utilisation of outer space, an area which extends beyond the earth’s atmosphere.” However, this is acknowledged as being overly limited, especially with respect to the developing sphere of value‐added services and applications of space.
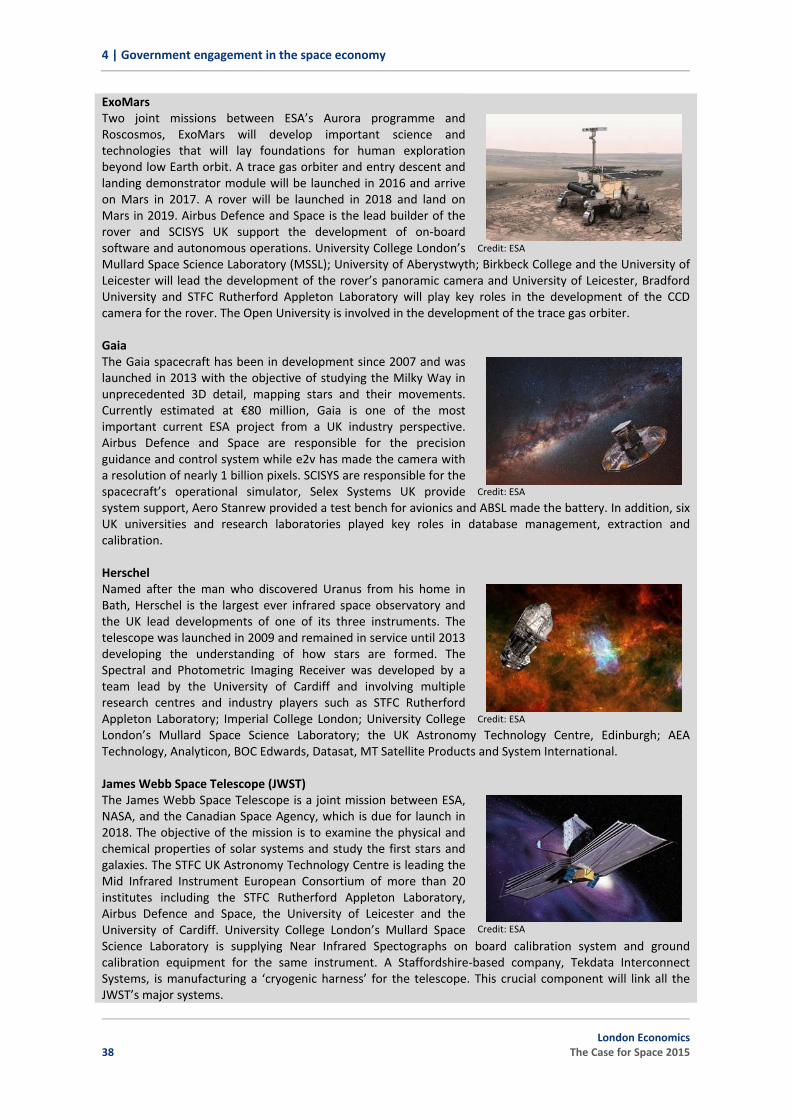
The influence of space expands even beyond direct applications, as companies in non‐space sectors benefit directly from space‐enabled services, and indirectly via knowledge and technological spillovers.
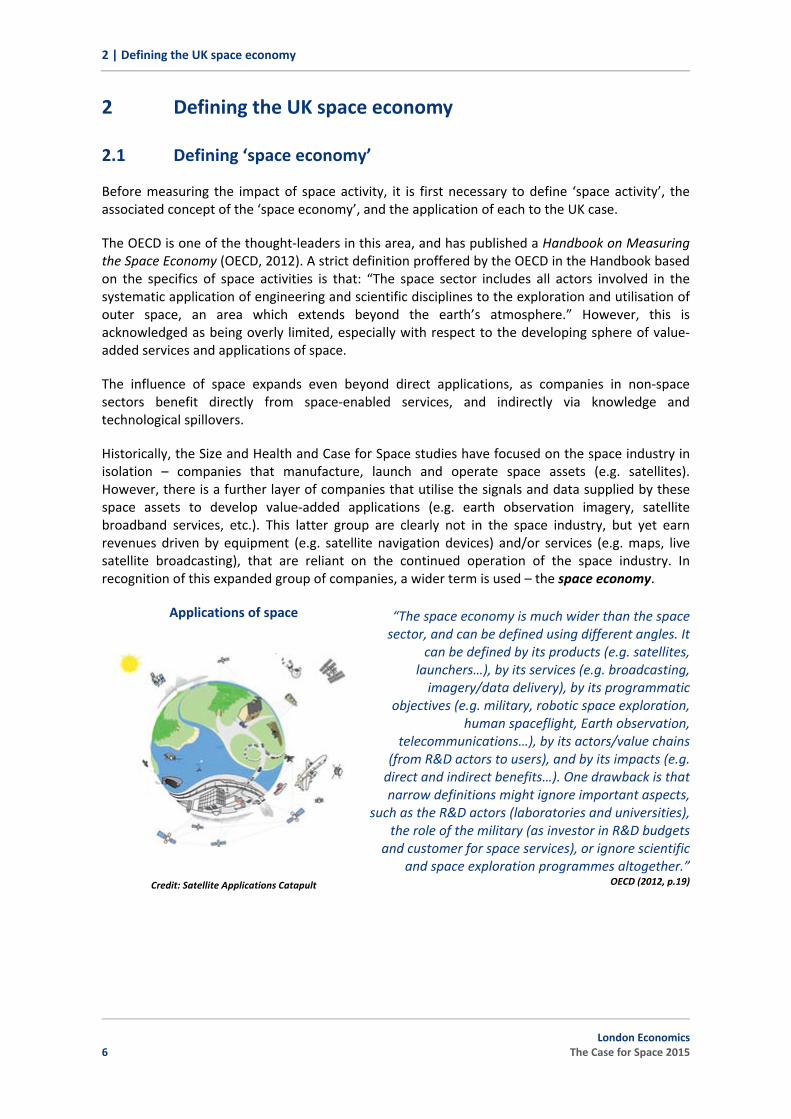
Historically, the Size and Health and Case for Space studies have focused on the space industry in isolation – companies that manufacture, launch and operate space assets (e.g. satellites). However, there is a further layer of companies that utilise the signals and data supplied by these space assets to develop value‐added applications (e.g. earth observation imagery, satellite broadband services, etc.). This latter group are clearly not in the space industry, but yet earn revenues driven by equipment (e.g. satellite navigation devices) and/or services (e.g. maps, live satellite broadcasting), that are reliant on the continued operation of the space industry. In recognition of this expanded group of companies, a wider term is used – the space economy.
Applications of space
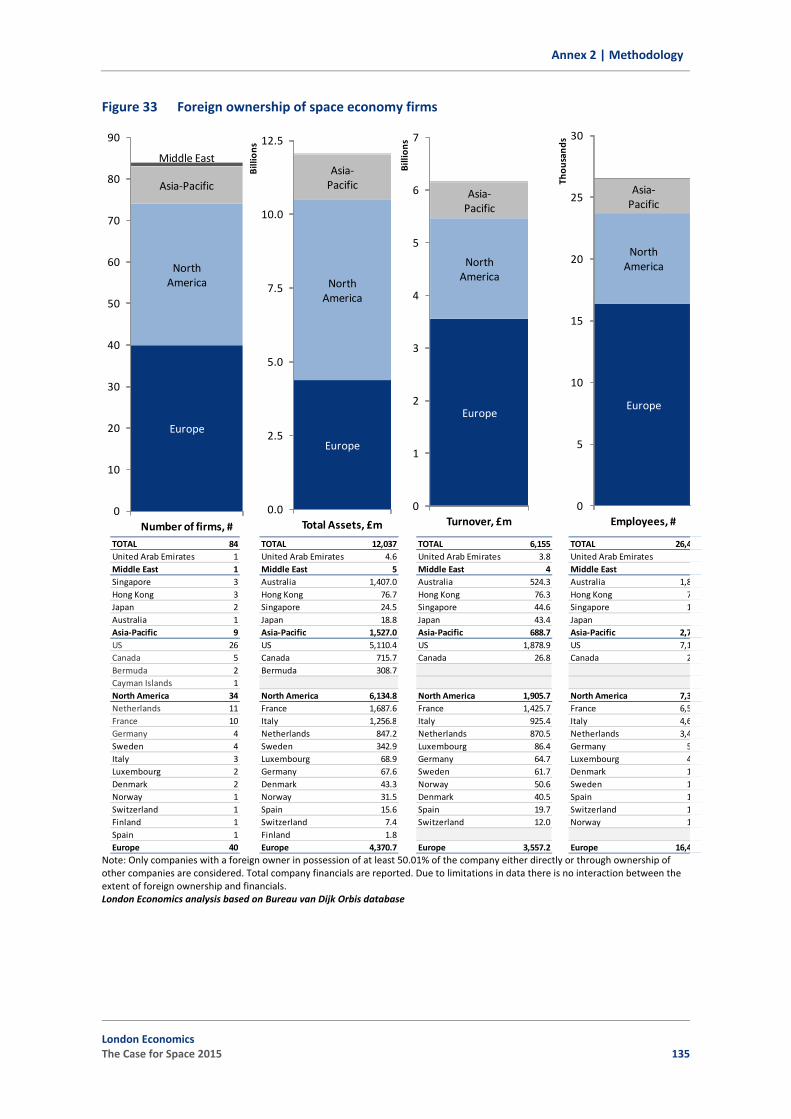
Credit: Satellite Applications Catapult
“The space economy is much wider than the space sector, and can be defined using different angles. It
can be defined by its products (e.g. satellites, launchers…), by its services (e.g. broadcasting, imagery/data delivery), by its programmatic
objectives (e.g. military, robotic space exploration, human spaceflight, Earth observation,
telecommunications…), by its actors/value chains (from R&D actors to users), and by its impacts (e.g. direct and indirect benefits…). One drawback is that narrow definitions might ignore important aspects,
such as the R&D actors (laboratories and universities), the role of the military (as investor in R&D budgets
and customer for space services), or ignore scientific and space exploration programmes altogether.”
OECD (2012, p.19)
6 London Economics
The Case for Space 2015
2 | Defining the UK space economy
The working definition offered by the OECD, and adopted by this study, ultimately is:
“The Space Economy is the full range of activities and the use of resources that create and provide value and benefits to human beings in the course of exploring, understanding, managing and utilising space. Hence, it includes all public and private actors involved in developing, providing and using space‐related products and services, ranging from research and development, the manufacture and use of space infrastructure (ground stations, launch vehicles and satellites) to space‐enabled applications (navigation equipment, satellite phones, meteorological services, etc.) and the scientific knowledge generated by such activities. It follows that the Space Economy goes well beyond the space sector itself, since it also comprises the increasingly pervasive and continually changing impacts (both quantitative and qualitative) of space‐derived products, services and knowledge on economy and society.”’8
This is consistent with, though more detailed than, a definition used in an earlier UK study by the Department for Business, Innovation and Skills (BIS) in a 2010 paper:
‘The “Space Economy” comprises several and interdependent economic activities that are required to facilitate the exploration of space and the exploitation of the opportunities that it currently enables – or might enable in the near or distant future.’9
2.2 Challenges of measuring the space economy
With such a broad‐based definition of the space economy, there are some obvious, and some not so obvious, challenges to measuring activity and effects. As summarised by Bruston (2014)10 there are some structural difficulties, inherent to the space sector, which make the measurement and evaluation of the socio‐economic impacts of space activities difficult, such as:
Fragmented structure of recording and reporting economic data – space is not recognised as a category in international standards of industrial classification (e.g. UK SIC 2007). For example: data on the space manufacturing sector are captured, and lost, within the much larger sectors of aerospace and electronic equipment. As a result, Official Statistics data do not allow for space to be isolated as a distinct economic activity and the measurement of space within the overall economy must be approximated;
Wide and prolonged diffusion of impacts of space activities – space infrastructure, downstream applications, value‐added services, and knowledge and market spillovers are:
a) cross‐cutting, enabling and enhancing a huge number of diverse applications – some obvious, and others hidden (e.g. timing & synchronisation using GPS satellites) – with wide‐ranging and widely disseminated economic and social benefits throughout many sectors; and
b) diffused over a long period, owing to the advanced R&D nature of the technologies, complicating the task of linking the returns to the investment.
8 See OECD (2012, p.20). 9 Department for Business, Innovation and Skills, BIS (2010) The Space Economy in the UK: An economic analysis of the sector and the role of policy, BIS Economics Paper No. 3, February 2010, p.vii. Available at: http://webarchive.nationalarchives.gov.uk/20121212135622/http://bis.gov.uk/assets/biscore/economics‐and‐statistics/docs/10‐624‐bis‐economics‐paper‐03.pdf 10 Bruston, J.* (2014) “Space: the Last Frontier for Socio‐economic Impacts Evaluation?”, Yearbook on Space Policy 2011/2012 ‐ Space in Times of Financial Crisis, pp. 183‐191. * DG’s Office for EU Relations, European Space Agency.
Late acceptance of the need, and planning, for evaluation by the space community – As a result, the space sector is not yet set up to routinely collect and report data that could support the evaluation of socio‐economic impacts.
There are further complicating factors:
Sensitive and classified information: The extent and nature of government activity in the sector, comprising both civil and military applications, also poses difficulties in terms of data availability and granularity;
Population of small and new companies: The downstream market for space applications is growing, fuelled by micro and SME application developers. Attempts to capture the economic activity of these smaller and newer organisations is frustrated by two factors:
a) Most fall within the small company exemption from statutory reporting limiting available quantitative information.
b) For those that are above the threshold there is typically a one‐year lag in annual report publication.
Seamless integration of space technology: The success of space‐enabled capabilities in becoming seamlessly and ‘silently’ integrated within value‐added services, equipment and applications means that users, and often even vendors, are not aware of the enabling contribution of space technologies.
Small, but significant, fringe suppliers: Space manufacturing supply chains often depend on inputs from suppliers for whom the space industry represents only a very small proportion of their overall output. Identifying, engaging and measuring the contribution of these suppliers is challenging.
Lack of international comparability: National statistics vary in definition, coverage and methodology, limiting international comparison, though this is changing thanks to the thought leadership of the OECD.
2.3 Segmentation of the space economy
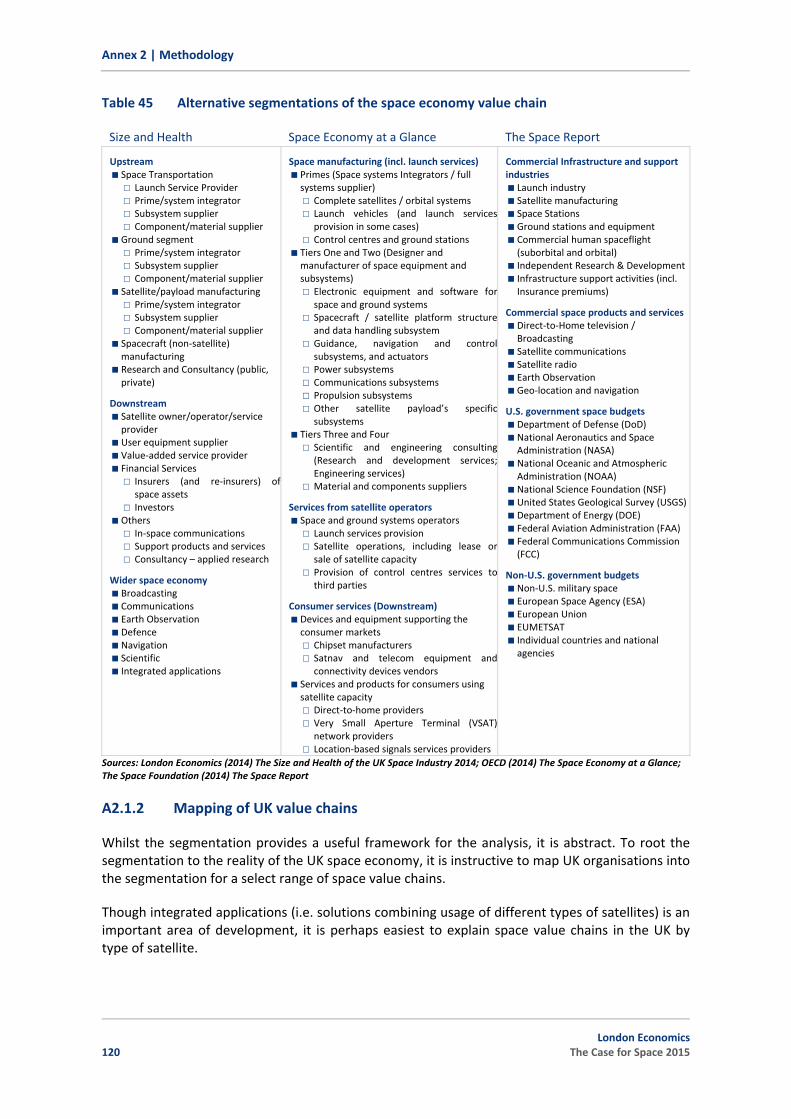
Reflecting the challenges of definition and measurement, it is perhaps not surprising that there is currently no single universally accepted standard classification of activities in the space economy. There are a number of alternative segmentations, which are discussed in more detail in the Annex (A2.1.1), including: the Size and Health segmentation, which governs the structure of the most recent available data; The Space Economy at a Glance segmentation, resulting from the OECD’s pioneering work towards universal coverage, standardised data collection and international comparability; and The Space Report, whose estimates were used as the basis for the Space IGS Growth Action Plan market size forecasts and targets.
However, although alternative segmentations differ, a common broad classification of industrial activities (excluding users) may be summarised as:
Manufacture of space assets (launch, satellite, spacecraft and ground segment systems); Operation of space assets; Manufacture of end‐user equipment and provision of value‐added services exploiting the
space assets; and Specialist support activities.
Reflecting this summary classification, for the purposes of this study, we have created a consolidated value chain, based on the internationally comparable and proposed best practice
8 London Economics
The Case for Space 2015
2 | Defining the UK space economy
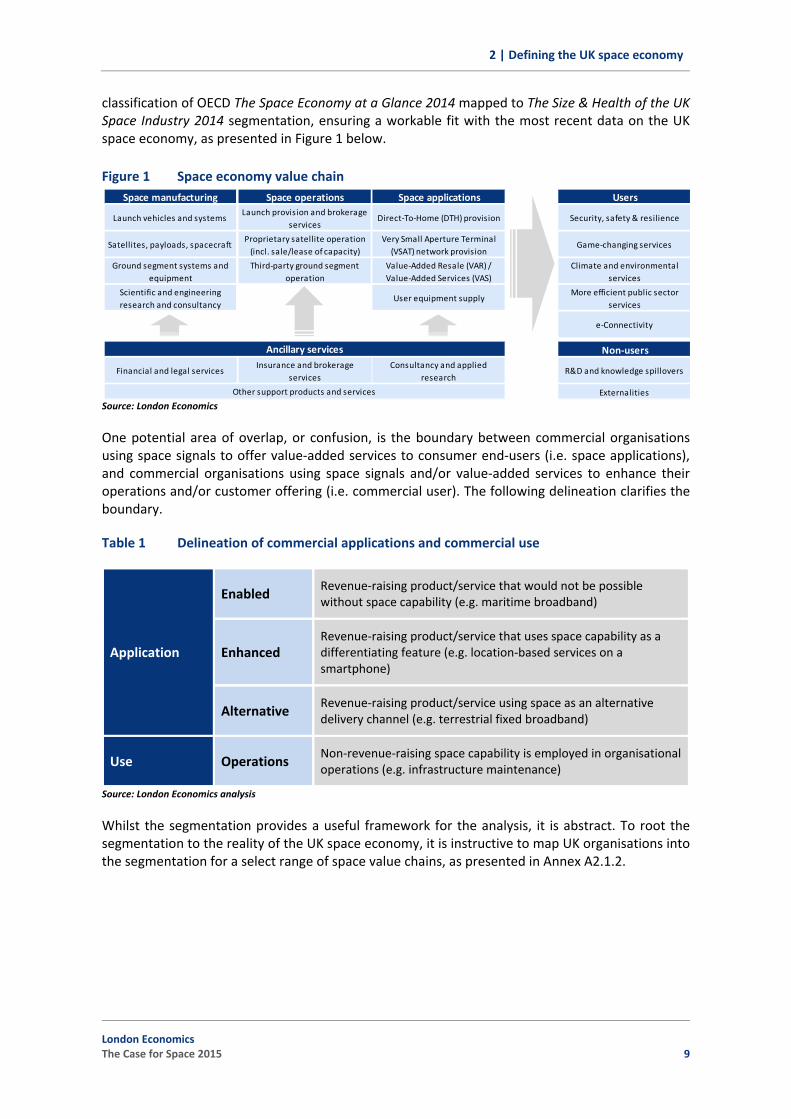
classification of OECD The Space Economy at a Glance 2014 mapped to The Size & Health of the UK Space Industry 2014 segmentation, ensuring a workable fit with the most recent data on the UK space economy, as presented in Figure 1 below.
Figure 1 Space economy value chain
Source: London Economics
One potential area of overlap, or confusion, is the boundary between commercial organisations using space signals to offer value‐added services to consumer end‐users (i.e. space applications), and commercial organisations using space signals and/or value‐added services to enhance their operations and/or customer offering (i.e. commercial user). The following delineation clarifies theboundary.
Table 1 Delineation of commercial applications and commercial use
Application
Enabled Revenue‐raising product/service that would not be possible without space capability (e.g. maritime broadband)
Enhanced Revenue‐raising product/service that uses space capability as a differentiating feature (e.g. location‐based services on a smartphone)
Alternative Revenue‐raising product/service using space as an alternative delivery channel (e.g. terrestrial fixed broadband)
Use Operations Non‐revenue‐raising space capability is employed in organisational operations (e.g. infrastructure maintenance)
Source: London Economics analysis
Space manufacturing Space operations Space applications Users
Launch vehicles and systemsLaunch provision and brokerage
Scientific and engineering research and consultancy
User equipment supplyMore efficient public sector
services
e‐Connectivity
Non‐users
Financial and legal servicesInsurance and brokerage
servicesConsultancy and applied
researchR&D and knowledge spillovers
Externalities
Ancillary services
Other support products and services
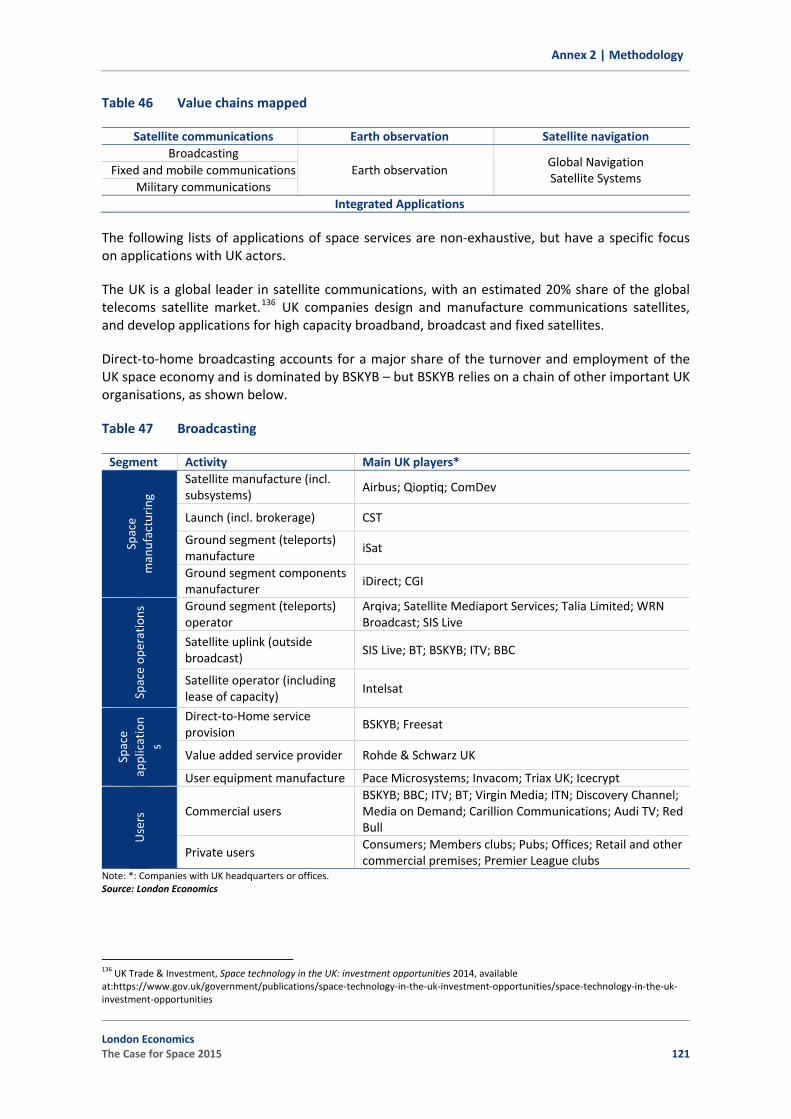
Whilst the segmentation provides a useful framework for the analysis, it is abstract. To root the segmentation to the reality of the UK space economy, it is instructive to map UK organisations into the segmentation for a select range of space value chains, as presented in Annex A2.1.2.
London Economics The Case for Space 2015 9
3 | UK space economy in perspective
3 UK space economy in perspective
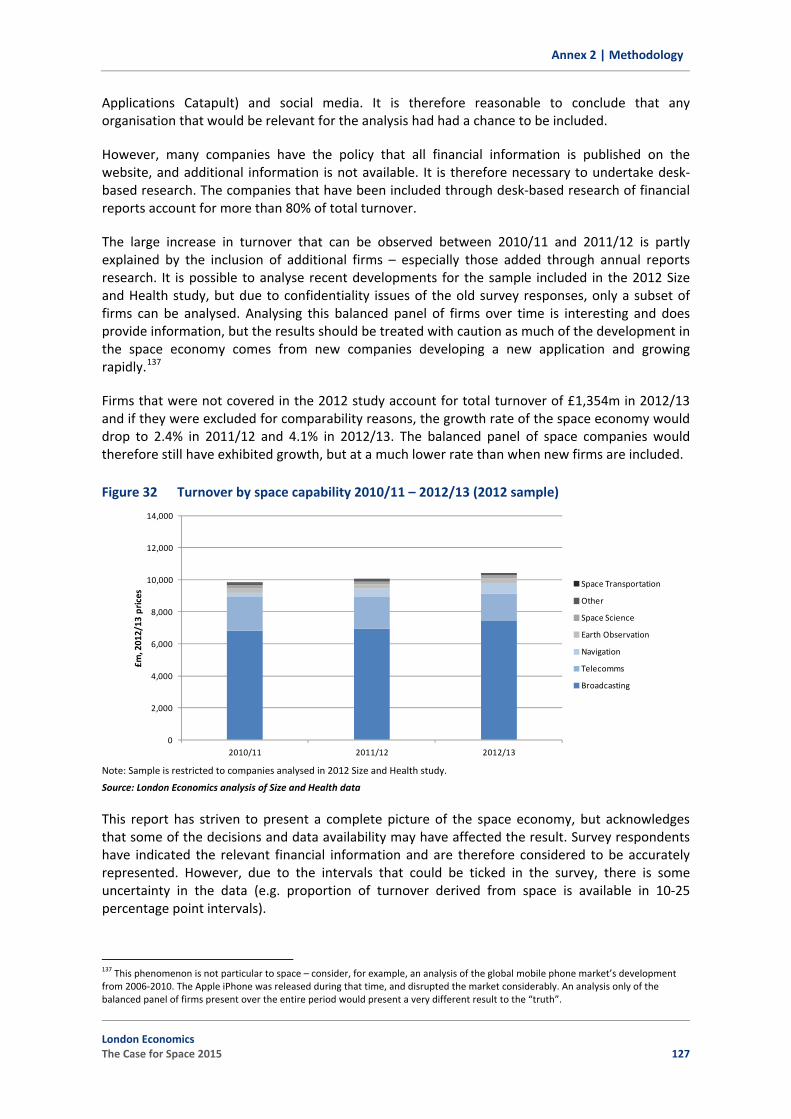
All results presented in these sections rely on the data gathered for the Size and Health of the UK Space Industry 2014 and additional space applications companies that have been identified in the during the preparation of this report; please see A2.2.1 for more details on the methodology.
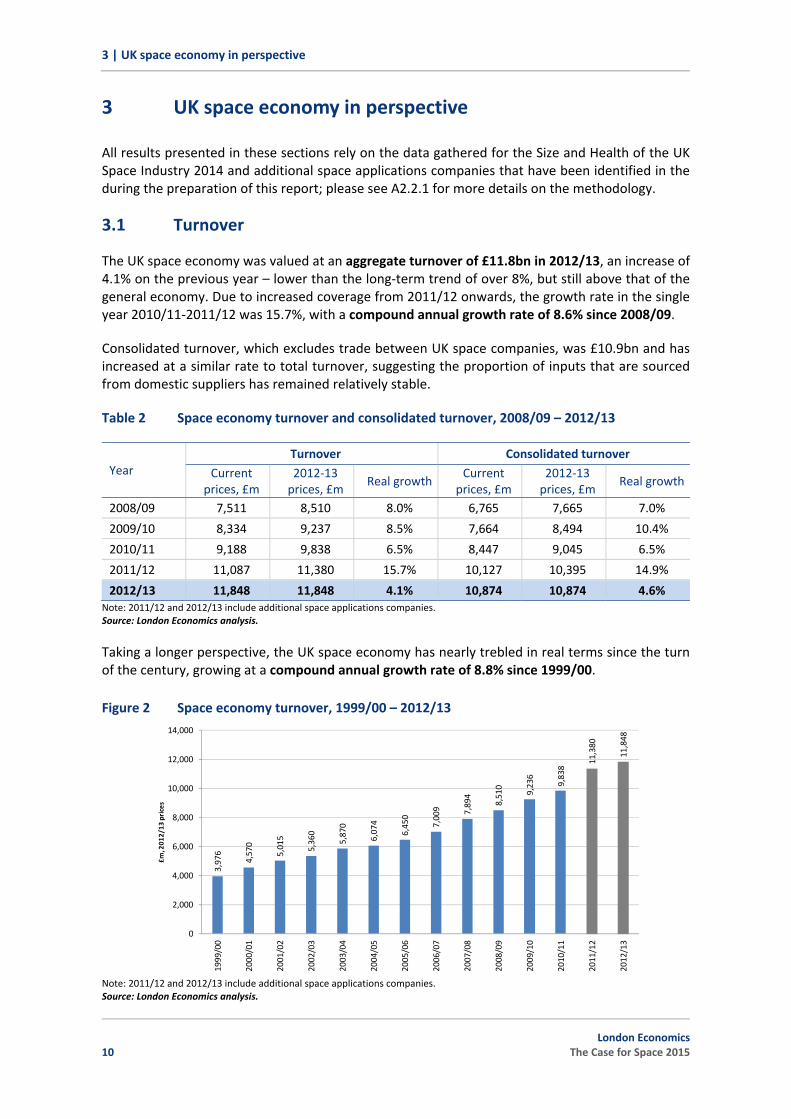
3.1 Turnover
The UK space economy was valued at an aggregate turnover of £11.8bn in 2012/13, an increase of 4.1% on the previous year – lower than the long‐term trend of over 8%, but still above that of the general economy. Due to increased coverage from 2011/12 onwards, the growth rate in the single year 2010/11‐2011/12 was 15.7%, with a compound annual growth rate of 8.6% since 2008/09.
Consolidated turnover, which excludes trade between UK space companies, was £10.9bn and has increased at a similar rate to total turnover, suggesting the proportion of inputs that are sourced from domestic suppliers has remained relatively stable.
Table 2 Space economy turnover and consolidated turnover, 2008/09 – 2012/13
Year Turnover Consolidated turnover
Current prices, £m
2012‐13 prices, £m
Real growthCurrent
prices, £m 2012‐13 prices, £m
Real growth
2008/09 7,511 8,510 8.0% 6,765 7,665 7.0%
2009/10 8,334 9,237 8.5% 7,664 8,494 10.4%
2010/11 9,188 9,838 6.5% 8,447 9,045 6.5%
2011/12 11,087 11,380 15.7% 10,127 10,395 14.9%
2012/13 11,848 11,848 4.1% 10,874 10,874 4.6% Note: 2011/12 and 2012/13 include additional space applications companies. Source: London Economics analysis.
Taking a longer perspective, the UK space economy has nearly trebled in real terms since the turn of the century, growing at a compound annual growth rate of 8.8% since 1999/00.
Figure 2 Space economy turnover, 1999/00 – 2012/13
Note: 2011/12 and 2012/13 include additional space applications companies.Source: London Economics analysis.
3,976
4,570
5,015
5,360
5,870
6,074
6,450
7,009 7,894
8,510
9,236
9,838
11,380
11,848
0
2,000
4,000
6,000
8,000
10,000
12,000
14,000
1999/00
2000/01
2001/02
2002/03
2003/04
2004/05
2005/06
2006/07
2007/08
2008/09
2009/10
2010/11
2011/12
2012/13
£m, 201
2/13
prices
10 London Economics
The Case for Space 2015
3 | UK space economy in perspective
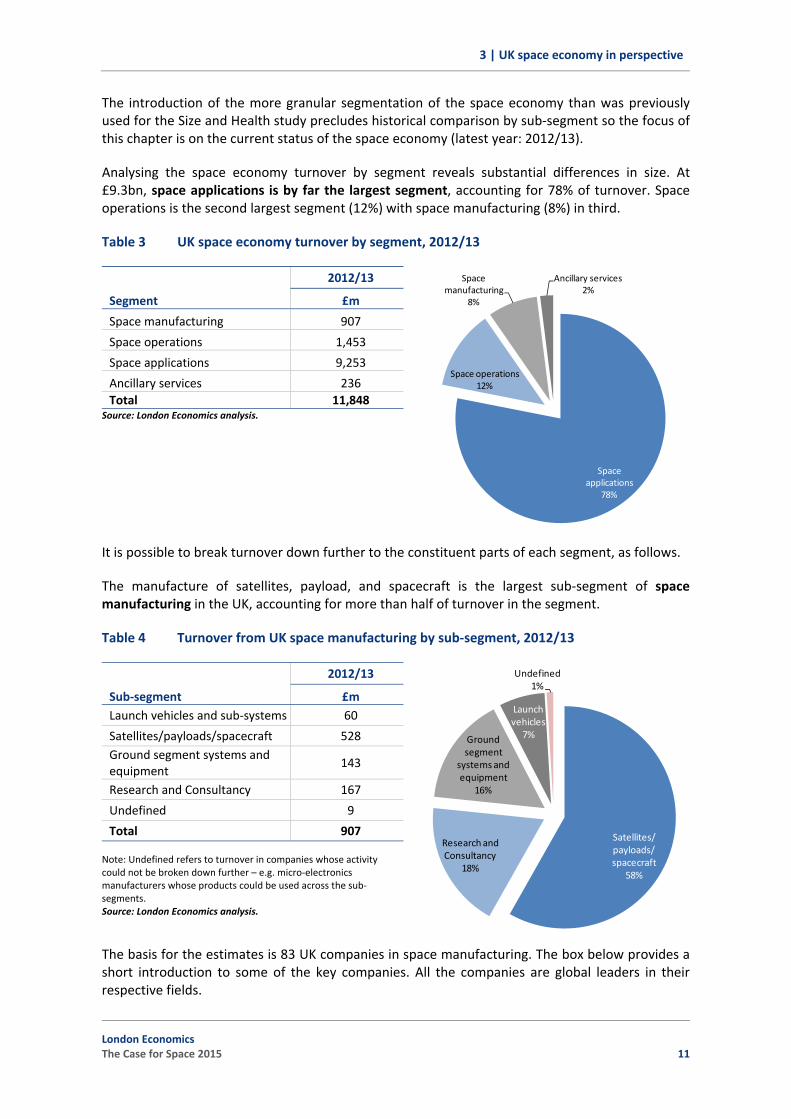
The introduction of the more granular segmentation of the space economy than was previously used for the Size and Health study precludes historical comparison by sub‐segment so the focus of this chapter is on the current status of the space economy (latest year: 2012/13).
Analysing the space economy turnover by segment reveals substantial differences in size. At £9.3bn, space applications is by far the largest segment, accounting for 78% of turnover. Space operations is the second largest segment (12%) with space manufacturing (8%) in third.
Table 3 UK space economy turnover by segment, 2012/13
Segment
2012/13
£m
Space manufacturing 907
Space operations 1,453
Space applications 9,253
Ancillary services 236 Total 11,848
Source: London Economics analysis.
Space applications
78%
Space operations12%
Space manufacturing
8%
Ancillary services2%
It is possible to break turnover down further to the constituent parts of each segment, as follows.
The manufacture of satellites, payload, and spacecraft is the largest sub‐segment of space manufacturing in the UK, accounting for more than half of turnover in the segment.
Table 4 Turnover from UK space manufacturing by sub‐segment, 2012/13
Sub‐segment
2012/13
£m Launch vehicles and sub‐systems 60
Satellites/payloads/spacecraft 528 Ground segment systems and equipment
143
Research and Consultancy 167
Undefined 9
Total 907
Note: Undefined refers to turnover in companies whose activity could not be broken down further – e.g. micro‐electronics manufacturers whose products could be used across the sub‐segments. Source: London Economics analysis.
Satellites/ payloads/ spacecraft
58%
Research and Consultancy
18%
Ground segment
systems and equipment
16%
Launch vehicles
7%
1%Undefined
The basis for the estimates is 83 UK companies in space manufacturing. The box below provides a short introduction to some of the key companies. All the companies are global leaders in their respective fields.
London Economics The Case for Space 2015 11
3 | UK space economy in perspective
Box 1 Selected UK global leaders in space manufacturing
Airbus Defence and Space UK Airbus Defence and Space holds the space activity of the European multinational Airbus Group. The company manufactures satellites for satellite communications and Earth Observation, is prime contractor on ESA science missions such as Rosetta and Orion and provides value added services for exploitation of Earth Observation data. Airbus DS is headquartered in the South East with additional facilities in the East Midlands and the North East. Surrey Satellite Technology Limited (SSTL) Originally a spin‐out company from Surrey University, SSTL is a world leader in the manufacture of small satellites for use in Earth Observation. The company also manufactured the first Galileo satellites for the European Union and ESA, and continues to supply payload to the on‐going project. SSTL is headquartered in Guildford, Surrey, and the parent company of DMCii (Earth Observation value added) and an American subsidiary. 43 SSTL satellites have been launched over more than 25 years – a considerable share of which has been exported. SSTL has more than 350 staff. In 2009 EADS Astrium (later Airbus Group) acquired 99% of SSTL. QinetiQ Group Manufacturer of micro satellites, satellite payloads, and subsystems, Farnborough‐b sed QinetiQ Group is a UK company with presence in a strongthe US, exports to which generate 42% of annual revenue (£1.2bn in 2014). QinetiQ employs 5,100 staff in the UK and is a member of the 5% club for apprentices and graduates. Qioptiq Space Technology Ltd. Previously known as Pilkington Space Technologies, Wales‐based Qioptiq supplies 80% of the global demand for solar cell cover glass and optical solar reflectors and has been used on over 2,500 satellites across the world. The company is part of an international group whose ultimate headquarters are in Munich, Germany. Source: London Economics based on company websites
Space operations is dominated by propriety satellite operation and lease of capacity (72% of
Table 5 Turnover from UK space operations by sub‐segment, 2012/13
Sub‐segment
2012/13
segment turnover), though UK companies also generate substantial turnover in operation of ground segment (28%).
£m Launch provision and brokerage services 7 Proprietary satellite operation (incl. sale/lease of capacity)
1, 040
Third‐party ground segment operation 406
Undefined 0
Total 1, 3 45Source: London Economics analysis.
Proprietary satellite
operation (incl. sale/lease of capacity)72%
Third‐party ground segment
operation28%
Launch provision and brokerage
services0%
12 London Economics
The Case for Space 2015
3 | UK space economy in perspective
The box below provides a short introduction to key UK companies in space operations. All the companies are global or European leaders in their respective fields. Estimates of the segment are based on a sample of 35 UK firms.
Box 2 Selected UK global leaders in space operations
Inmarsat plc Headquartered in London’s silicon roundabout, Inmarsat is a global leader in satellite communication. The company turned over more than £700 million in 2012/13 and employed 1,600 staff in London and across multiple locations worldwide. The company supplies mobile communications to 370,000 terminals across the globe and is currently expanding its portfolio through the introduction of a powerful new constellation. Inmarsat owns and operates the 11 satellites that not only provide communications services to subscribers, but also carry payloads for the European Geostationary Navigation Overlay Service (EGNOS) and the private – UK‐based – differential GNSS provider Veripos. Airbus Defence and Space UK Previously known as Paradigm, Airbus Defence and Space offers satellite communications services for commercial and government users. The services range from VSAT services for maritime or land use to retail of Inmarsat broadband for aircraft. Airbus Defence and Space (formerly trading as Infoterra) also operates a fleet of Earth Observation satellites selling imagery straight to commercial users. Airbus Defence and Space holds the space activity of the European multinational Airbus Group. Arqiva World Teleport Association’s ‘Independent Teleport Operator of the Year’ 2014, the British group Arqiva (owned by Australian company Frequency Infrastructure) provides the infrastructure that enables television and radio in the UK. BBC, ITV and BSkyB all rely on Arqiva’s services to deliver and broadcast programmes. Arqiva’s story began in 1928 when it provided transmission capability for the first broadcast of the UK Government’s Budget. The company employs more than 2,000 people and turns over more than £800 million per year. Commercial Space Technologies (CST) For more than 20 years, CST has provided launch brokerage services to UK and international companies with the company’s first brokered launch lifting off in 1995 and serving SSTL. In total, the company has brokered 32 satellites launches with SSTL and other UK companies continuing to use the service. Most recently, CST brokered the launch of TechDemoSat‐1 and UKube‐1. In addition to brokerage, CST provides consultancy services. CST is based in London, and has operations in Moscow. SIS Live SIS Live is Europe’s largest uplink supplier and delivers 80% of the UK’s live news contribution feeds. The company also manufactures personal satellite uplinks for use by lone reporters in areas of poor connectivity. Source: London Economics based on company websites
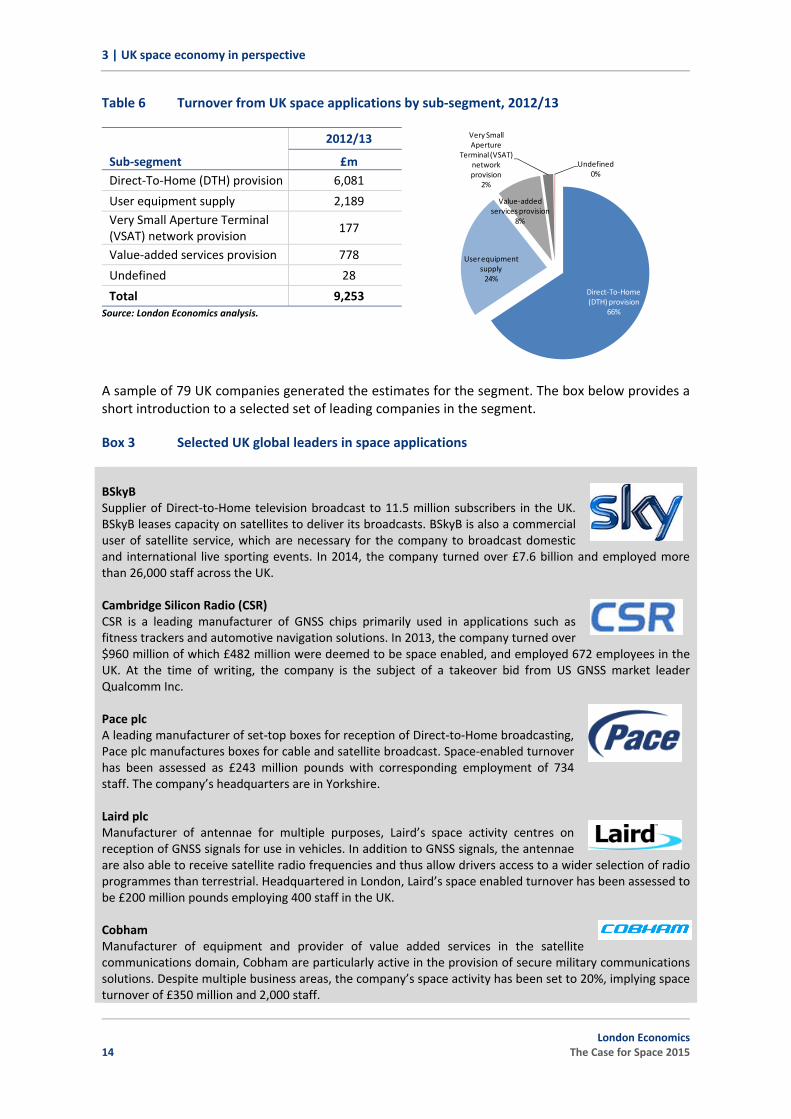
Space applications, the largest segment, is dominated by Direct‐To‐Home (DTH) satellite television provision at two‐thirds of sub‐segment turnover. The remainder is made up by user equipment supply (24%) and value‐added service provision (8%). Space applications firms primarily cater to end‐users (consumers and businesses), and the large turnover in the segment shows that space is used in the daily lives of a large section of society.
London Economics The Case for Space 2015 13
3 | UK space economy in perspective
Table 6 Turnover from UK space applications by sub‐segment, 2012/13
Sub‐segment
2012/13
£m Direct‐To‐Home (DTH) provision 6,081
User equipment supply 2,189 Very Small Aperture Terminal (VSAT) network provision
177
Value‐added services provision 778
Undefined 28
Total 9,253 Source: London Economics analysis.
A sample of 79 UK companies generated the estimates for the segment. The box below provides a short introduction to a selected set of leading companies in the segment.
Box 3 Selected UK global leaders in space applications
BSkyB Supplier of Direct‐to‐Home television broadcast to 11.5 million subscribers in the UK. BSkyB leases capacity on satellites to deliver its broadcasts. BSkyB is also a commercial user of satellite service, which are necessary for the company to broadcast domestic and international live sporting events. In 2014, the company turned over £7.6 billion and employed more than 26,000 staff across the UK. Cambridge Silicon Radio (CSR) CSR is a leading manufacturer of GNSS chips primarily used in applications such as fitness trackers and automotive navigation solutions. In 2013, the company turned over $960 million of which £482 million were deemed to be space enabled, and employed 672 employees in the UK. At the time of writing, the company is the subject of a takeover bid from US GNSS market leader Qualcomm Inc. Pace plc A leading manufacturer of set‐top boxes for reception of Direct‐to‐Home broadcasting, Pace plc manufactures boxes for cable and satellite broadcast. Space‐enabled turnover has been assessed as £243 million pounds with corresponding employment of 734 staff. The company’s headquarters are in Yorkshire. Laird plc Manufacturer of antennae for multiple purposes, Laird’s space activity centres on reception of GNSS signals for use in vehicles. In addition to GNSS signals, the antennae are also able to receive satellite radio frequencies and thus allow drivers access to a wider selection of radio programmes than terrestrial. Headquartered in London, Laird’s space enabled turnover has been assessed to be £200 million pounds employing 400 staff in the UK. Cobham Manufacturer of equipment and provider of value added services in the satellite communications domain, Cobham are particularly active in the provision of secure military communications solutions. Despite multiple business areas, the company’s space activity has been set to 20%, implying space turnover of £350 million and 2,000 staff.
Direct‐To‐Home (DTH) provision
66%
User equipment supply24%
Value‐added services provision
8%
Very Small Aperture
Terminal (VSAT) network provision
2%
Undefined0%
14 London Economics
The Case for Space 2015
3 | UK space economy in perspective
Honeywell Global Tracking Integrating satellite communications and navigation, Honeywell Global Tracking is a US company with strong presence in the South West of England. The company manufactures equipment and provides software and added value services for tracking of high‐value vehicles and goods. In addition, the company is a retailer of Inmarsat communication services. Source: London Economics based on company websites
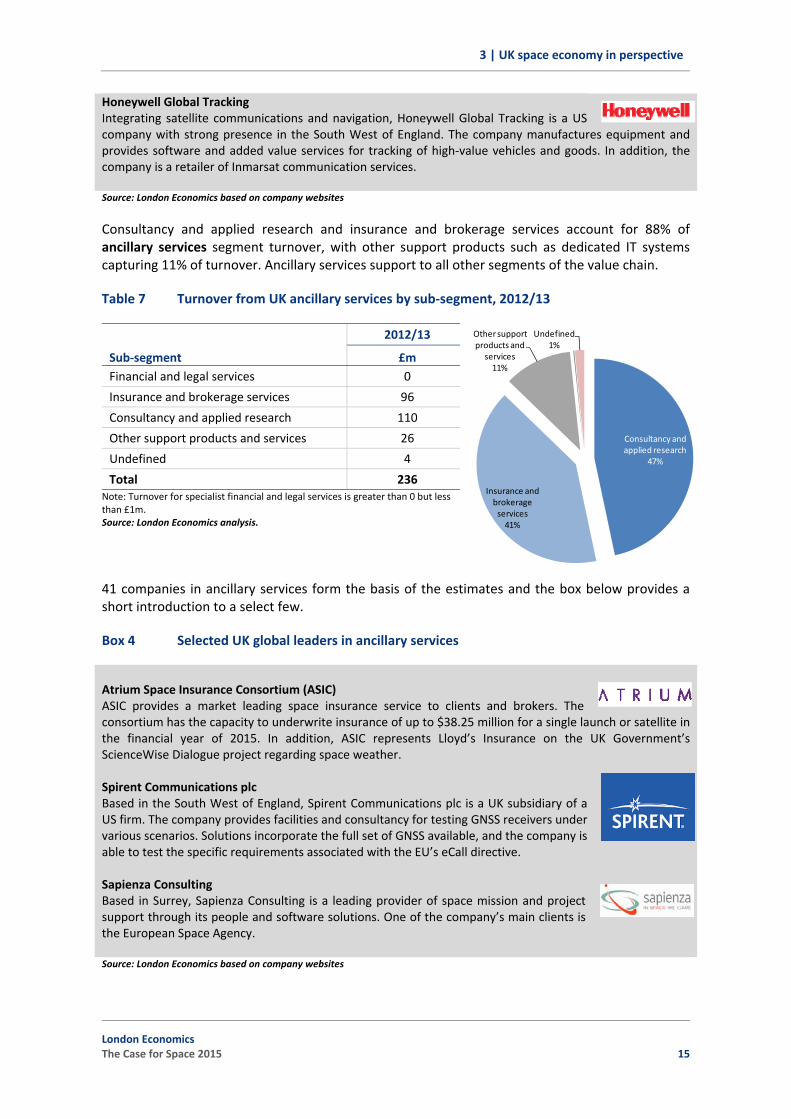
Consultancy and applied research and insurance and brokerage services account for 88% of ancillary services segment turnover, with other support products such as dedicated IT systems capturing 11% of turnover. Ancillary services support to all other segments of the value chain.
Table 7 Turnover from UK ancillary services by sub‐segment, 2012/13
Sub‐segment
2012/13
£m Financial and legal services 0
Insurance and brokerage services 96
Consultancy and applied research 110
Other support products and services 26
Undefined 4
Total 236 Note: Turnover for specialist financial and legal services is greater than 0 but less than £1m. Source: London Economics analysis.
Consultancy and applied research
47%
Insurance and brokerage services41%
Other support products and services11%
Undefined1%
41 companies in ancillary services form the basis of the estimates and the box below provides a short introduction to a select few.
Box 4 Selected UK global leaders in ancillary services
Atrium Space Insurance Consortium (ASIC) ASIC provides a market leading space insurance service to clients and brokers. The consortium has the capacity to underwrite insurance of up to $38.25 million for a single launch or satellite in the financial year of 2015. In addition, ASIC represents Lloyd’s Insurance on the UK Government’s ScienceWise Dialogue project regarding space weather. Spirent Communications plc Based in the South West of England, Spirent Communications plc is a UK subsidiary of a US firm. The company provides facilities and consultancy for testing GNSS receivers under various scenarios. Solutions incorporate the full set of GNSS available, and the company is able to test the specific requirements associated with the EU’s eCall directive. Sapienza Consulting Based in Surrey, Sapienza Consulting is a leading provider of space mission and project support through its people and software solutions. One of the company’s main clients is the European Space Agency. Source: London Economics based on company websites
London Economics The Case for Space 2015 15
3 | UK space economy in perspective
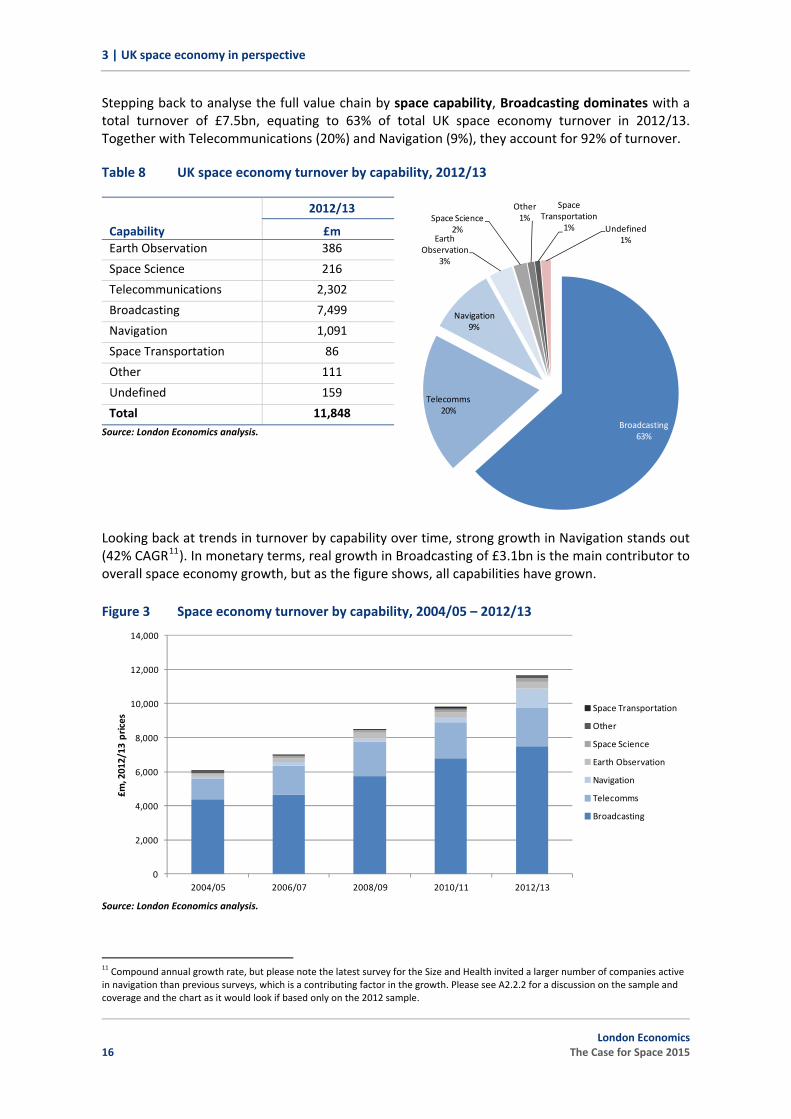
Stepping back to analyse the full value chain by space capability, Broadcasting dominates with a total turnover of £7.5bn, equating to 63% of total UK space economy turnover in 2012/13. Together with Telecommunications (20%) and Navigation (9%), they account for 92% of turnover.
Table 8 UK space economy turnover by capability, 2012/13
Capability
2012/13
£m Earth Observation 386
Space Science 216
Telecommunications 2,302
Broadcasting 7,499
Navigation 1,091
Space Transportation 86
Other 111
Undefined 159
Total 11,848Source: London Economics analysis.
Broadcasting63%
Telecomms20%
Navigation9%
Earth Observation
3%
Space Science2%
Other1%
Space Transportation
1% Undefined1%
Looking back at trends in turnover by capability over time, strong growth in Navigation stands out (42% CAGR11). In monetary terms, real growth in Broadcasting of £3.1bn is the main contributor to overall space economy growth, but as the figure shows, all capabilities have grown.
Figure 3 Space economy turnover by capability, 2004/05 – 2012/13
Source: London Economics analysis.
0
2,000
4,000
6,000
8,000
10,000
12,000
14,000
2004/05 2006/07 2008/09 2010/11 2012/13
£m, 2012/13
prices
Space Transportation
Other
Space Science
Earth Observation
Navigation
Telecomms
Broadcasting
11 Compound annual growth rate, but please note the latest survey for the Size and Health invited a larger number of companies active in navigation than previous surveys, which is a contributing factor in the growth. Please see A2.2.2 for a discussion on the sample and coverage and the chart as it would look if based only on the 2012 sample.
16 London Economics
The Case for Space 2015
3 | UK space economy in perspective
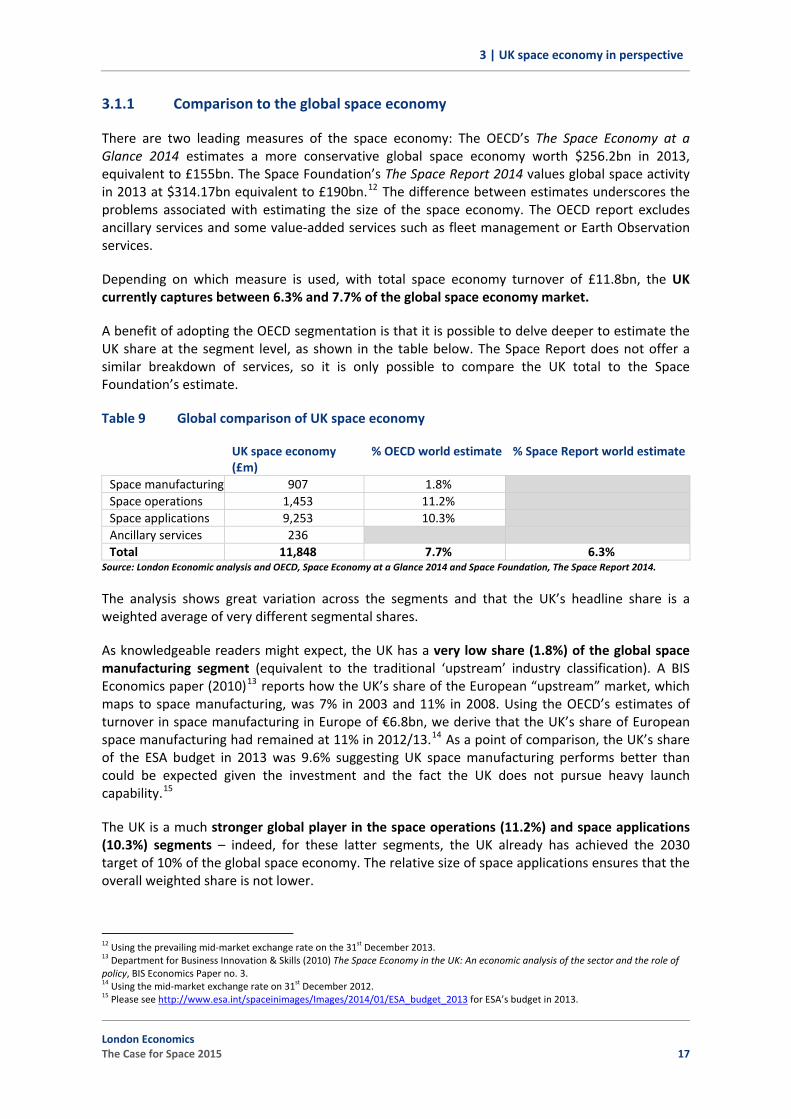
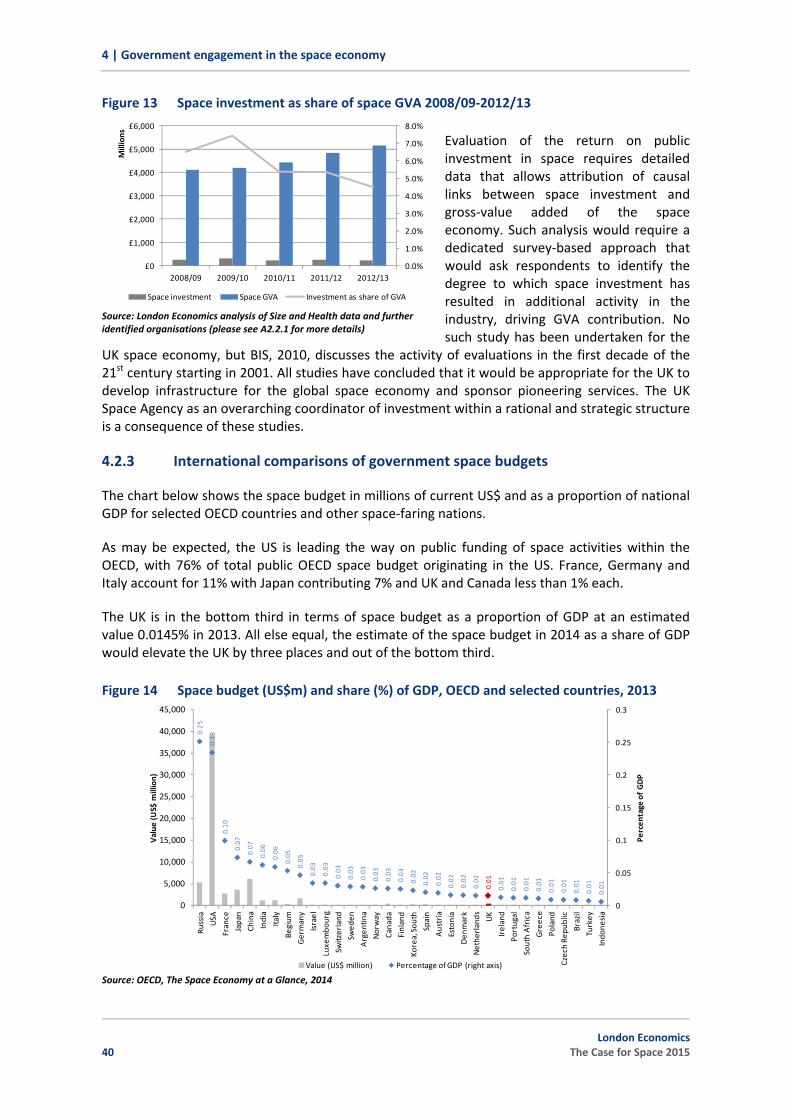
3.1.1 Comparison to the global space economy
There are two leading measures of the space economy: The OECD’s The Space Economy at a Glance 2014 estimates a more conservative global space economy worth $256.2bn in 2013, equivalent to £155bn. The Space Foundation’s The Space Report 2014 values global space activity in 2013 at $314.17bn equivalent to £190bn.12 The difference between estimates underscores the problems associated with estimating the size of the space economy. The OECD report excludes ancillary services and some value‐added services such as fleet management or Earth Observation services.
Depending on which measure is used, with total space economy turnover of £11.8bn, the UK currently captures between 6.3% and 7.7% of the global space economy market.
A benefit of adopting the OECD segmentation is that it is possible to delve deeper to estimate the UK share at the segment level, as shown in the table below. The Space Report does not offer a similar breakdown of services, so it is only possible to compare the UK total to the Space Foundation’s estimate.
Table 9 Global comparison of UK space economy
UK space economy (£m)
% OECD world estimate % Space Report world estimate
Space manufacturing 907 1.8% Space operations 1,453 11.2% Space applications 9,253 10.3% Ancillary services 236 Total 11,848 7.7% 6.3%
Source: London Economic analysis and OECD, Space Economy at a Glance 2014 and Space Foundation, The Space Report 2014.
The analysis shows great variation across the segments and that the UK’s headline share is a weighted average of very different segmental shares.
As knowledgeable readers might expect, the UK has a very low share (1.8%) of the global space manufacturing segment (equivalent to the traditional ‘upstream’ industry classification). A BIS Economics paper (2010)13 reports how the UK’s share of the European “upstream” market, which maps to space manufacturing, was 7% in 2003 and 11% in 2008. Using the OECD’s estimates of turnover in space manufacturing in Europe of €6.8bn, we derive that the UK’s share of European space manufacturing had remained at 11% in 2012/13.14 As a point of comparison, the UK’s share of the ESA budget in 2013 was 9.6% suggesting UK space manufacturing performs better than could be expected given the investment and the fact the UK does not pursue heavy launch capability.15
The UK is a much stronger global player in the space operations (11.2%) and space applications (10.3%) segments – indeed, for these latter segments, the UK already has achieved the 2030 target of 10% of the global space economy. The relative size of space applications ensures that the overall weighted share is not lower.
12 Using the prevailing mid‐market exchange rate on the 31st December 2013. 13 Department for Business Innovation & Skills (2010) The Space Economy in the UK: An economic analysis of the sector and the role of policy, BIS Economics Paper no. 3. 14 Using the mid‐market exchange rate on 31st December 2012. 15 Please see http://www.esa.int/spaceinimages/Images/2014/01/ESA_budget_2013 for ESA’s budget in 2013.
The ONS Annual Business Survey16 estimates the total turnover of the UK economy, excluding financial service industries, at £3.6 trillion. At £11.8 billion, the UK space economy accounts for 0.33% of total UK economy turnover (excluding financial services).17
Caveat: The total turnover of UK’s non‐financial businesses is not related to GDP or gross value‐added, and is not a measure of economic impact.
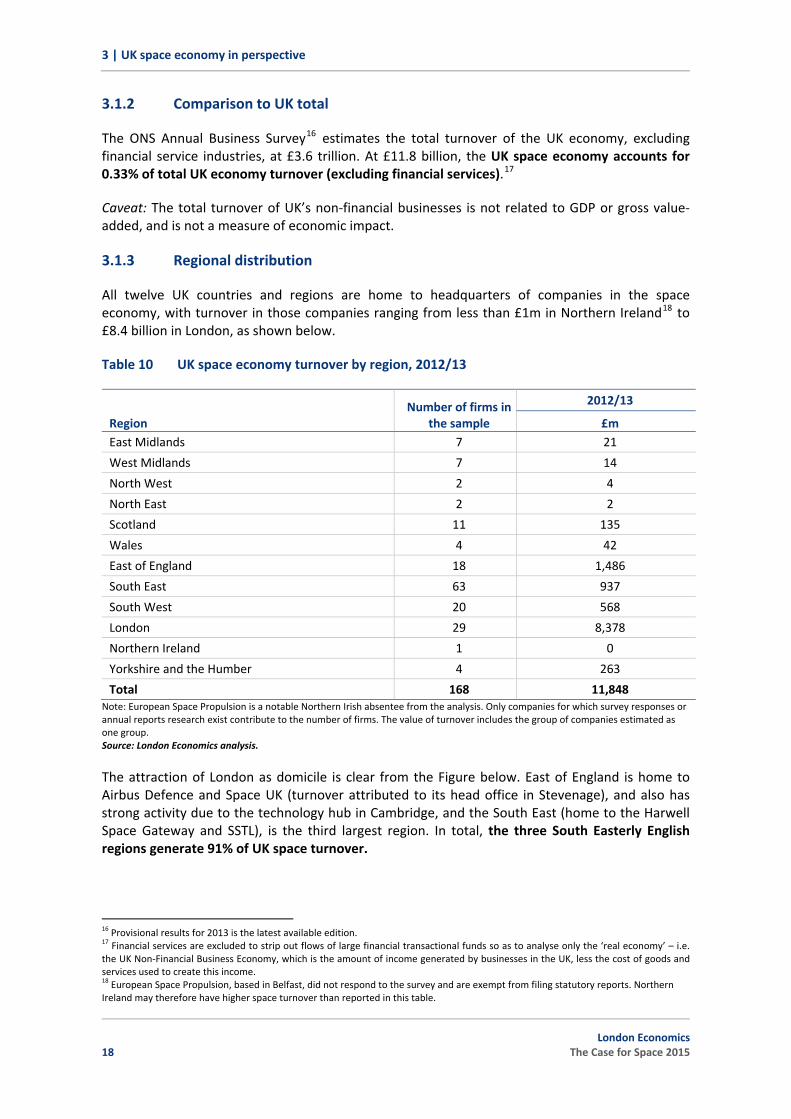
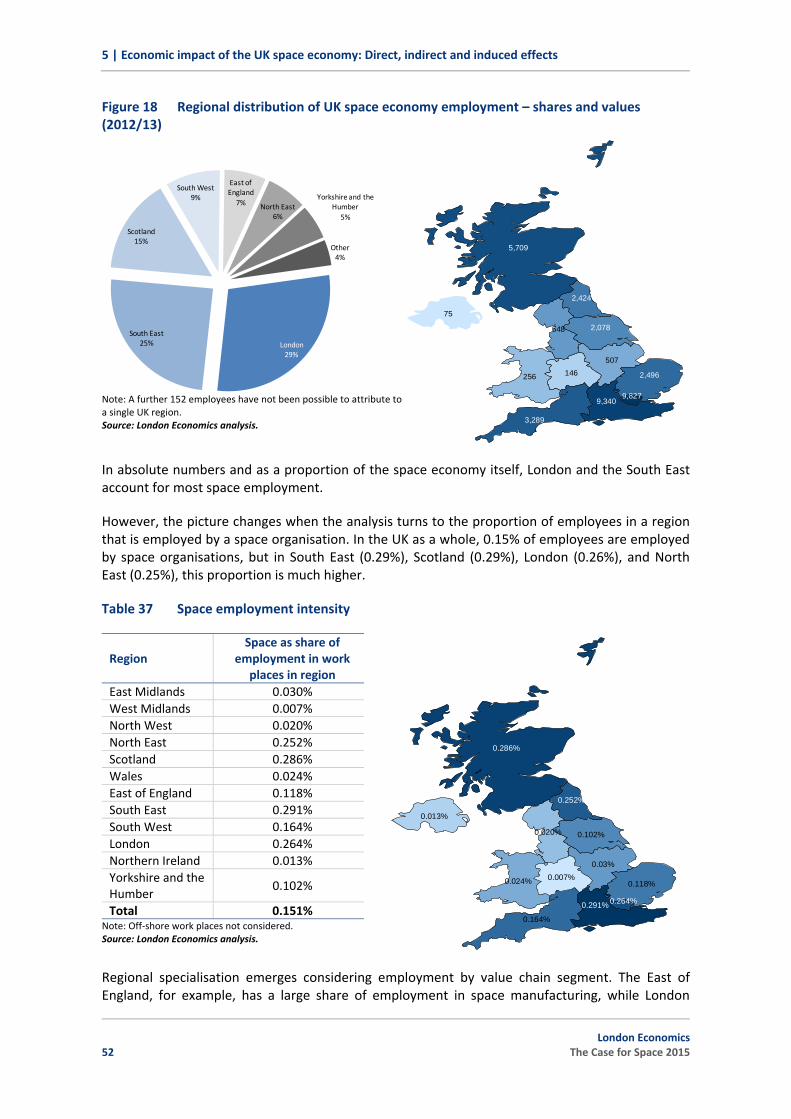
3.1.3 Regional distribution
All twelve UK countries and regions are home to headquarters of companies in the space economy, with turnover in those companies ranging from less than £1m in Northern Ireland18 to £8.4 billion in London, as shown below.
Table 10 UK space economy turnover by region, 2012/13
Region Number of firms in
the sample
2012/13
£m East Midlands 7 21
West Midlands 7 14
North West 2 4
North East 2 2
Scotland 11 135
Wales 4 42
East of England 18 1,486
South East 63 937
South West 20 568
London 29 8,378
Northern Ireland 1 0
Yorkshire and the Humber 4 263
Total 168 11,848 Note: European Space Propulsion is a notable Northern Irish absentee from the analysis. Only companies for which survey responses or annual reports research exist contribute to the number of firms. The value of turnover includes the group of companies estimated as one group. Source: London Economics analysis.
The attraction of London as domicile is clear from the Figure below. East of England is home to Airbus Defence and Space UK (turnover attributed to its head office in Stevenage), and also has strong activity due to the technology hub in Cambridge, and the South East (home to the Harwell Space Gateway and SSTL), is the third largest region. In total, the three South Easterly English regions generate 91% of UK space turnover.
16 Provisional results for 2013 is the latest available edition. 17 Financial services are excluded to strip out flows of large financial transactional funds so as to analyse only the ‘real economy’ – i.e. the UK Non‐Financial Business Economy, which is the amount of income generated by businesses in the UK, less the cost of goods and services used to create this income. 18 European Space Propulsion, based in Belfast, did not respond to the survey and are exempt from filing statutory reports. Northern Ireland may therefore have higher space turnover than reported in this table.
18 London Economics
The Case for Space 2015
3 | UK space economy in perspective
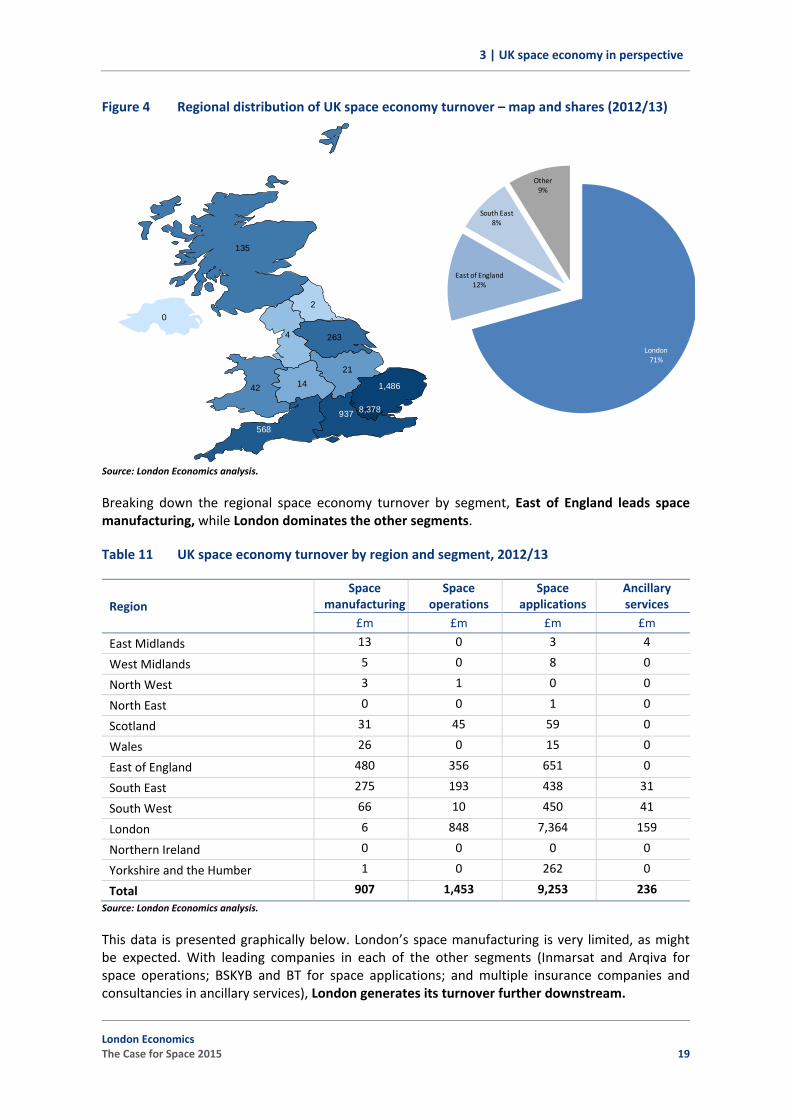
Figure 4 Regional distribution of UK space economy turnover – map and shares (2012/13)
Source: London Economics analysis.
2
4 263
2114 1,486
8,378937
568
42
135
0
London71%
East of England12%
South East8%
Other9%
Breaking down the regional space economy turnover by segment, East of England leads space manufacturing, while London dominates the other segments.
Table 11 UK space economy turnover by region and segment, 2012/13
Region Space
manufacturingSpace
operations Space
applications Ancillary services
£m £m £m £m
East Midlands 13 0 3 4
West Midlands 5 0 8 0
North West 3 1 0 0
North East 0 0 1 0
Scotland 31 45 59 0
Wales 26 0 15 0
East of England 480 356 651 0
South East 275 193 438 31
South West 66 10 450 41
London 6 848 7,364 159
Northern Ireland 0 0 0 0
Yorkshire and the Humber 1 0 262 0
Total 907 1,453 9,253 236Source: London Economics analysis.
This data is presented graphically below. London’s space manufacturing is very limited, as might be expected. With leading companies in each of the other segments (Inmarsat and Arqiva for space operations; BSKYB and BT for space applications; and multiple insurance companies and consultancies in ancillary services), London generates its turnover further downstream.
London Economics The Case for Space 2015 19
3 | UK space economy in perspective
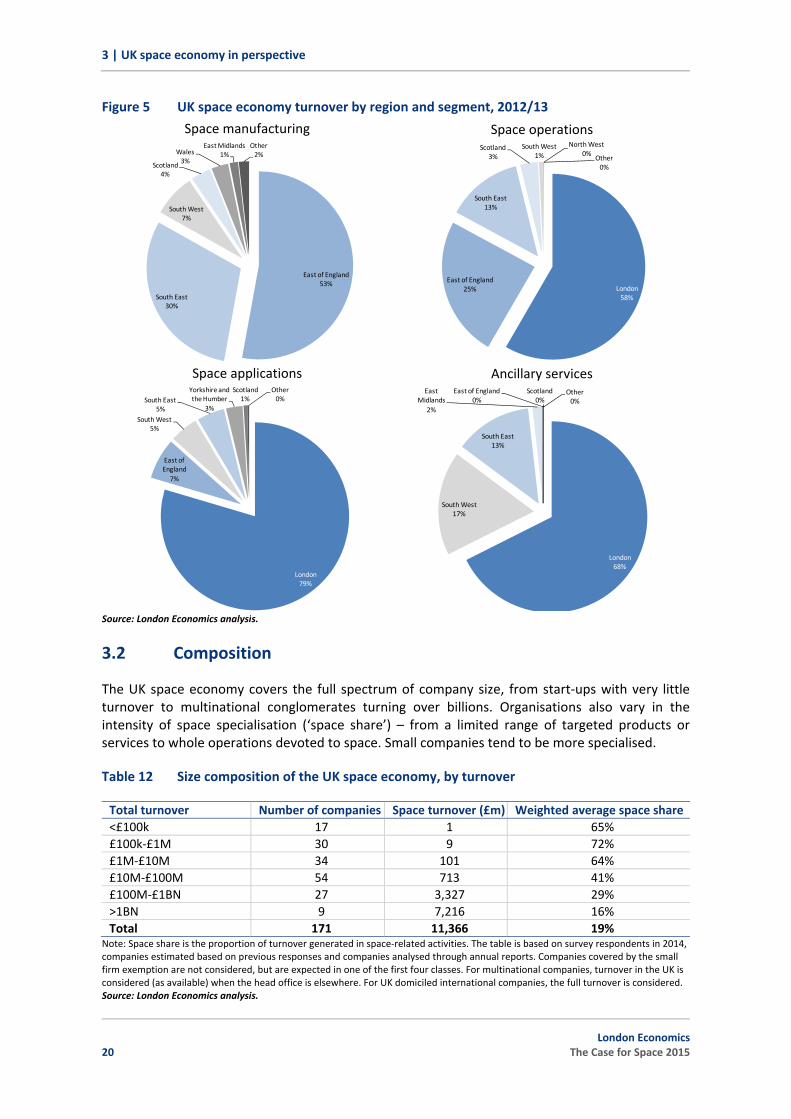
Figure 5 UK space economy turnover by region and segment, 2012/13
Space manufacturing Space operations
Space applications Ancillary services
Source: London Economics analysis.
East of England53%
South East30%
South West7%
Scotland4%
Wales3%
East Midlands1%
Other2%
London58%
East of England25%
South East13%
Scotland3%
South West1%
North West0%
Other0%
London79%
East of England7%
South West5%
South East5%
Yorkshire and the Humber
3%
Scotland1%
Other0%
London68%
South West17%
South East13%
East Midlands
2%
East of England0%
Scotland0%
Other0%
3.2 Composition
The UK space economy covers the full spectrum of company size, from start‐ups with very little turnover to multinational conglomerates turning over billions. Organisations also vary in the intensity of space specialisation (‘space share’) – from a limited range of targeted products or services to whole operations devoted to space. Small companies tend to be more specialised.
Table 12 Size composition of the UK space economy, by turnover
Total turnover Number of companies Space turnover (£m) Weighted average space share<£100k 17 1 65% £100k‐£1M 30 9 72% £1M‐£10M 34 101 64% £10M‐£100M 54 713 41% £100M‐£1BN 27 3,327 29% >1BN 9 7,216 16% Total 171 11,366 19%
Note: Space share is the proportion of turnover generated in space‐related activities. The table is based on survey respondents in 2014, companies estimated based on previous responses and companies analysed through annual reports. Companies covered by the small firm exemption are not considered, but are expected in one of the first four classes. For multinational companies, turnover in the UK is considered (as available) when the head office is elsewhere. For UK domiciled international companies, the full turnover is considered. Source: London Economics analysis.
20 London Economics
The Case for Space 2015
3 | UK space economy in perspective
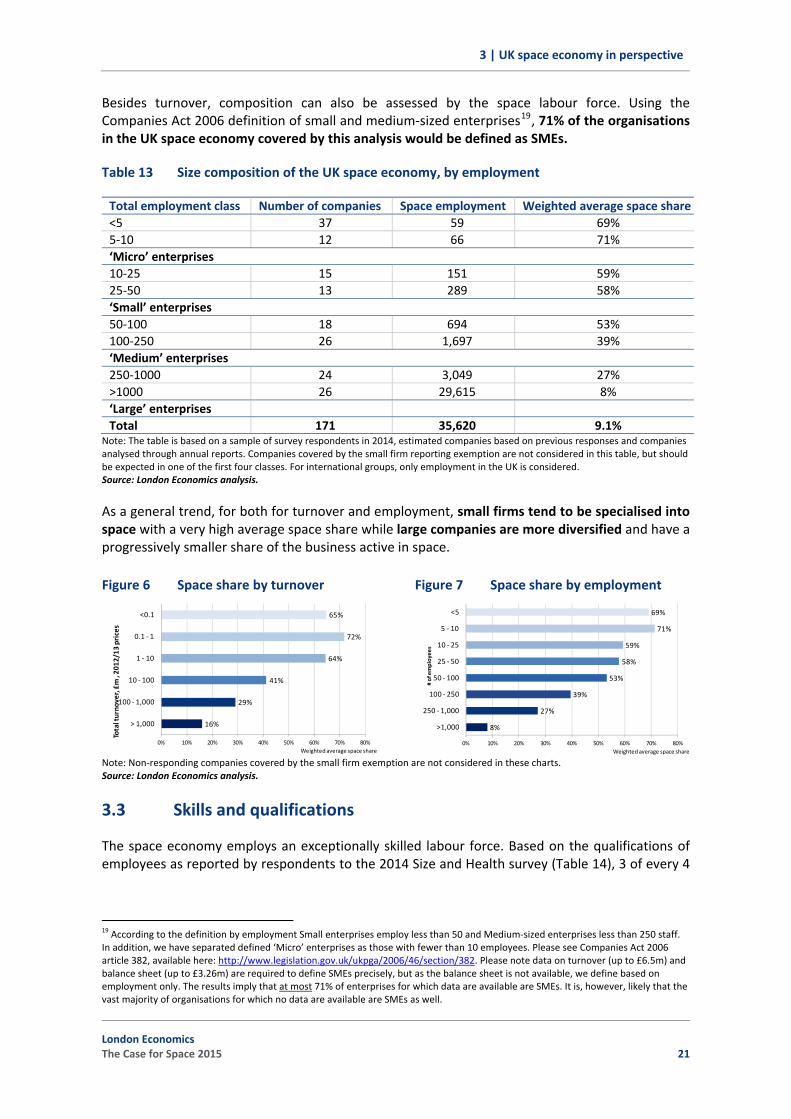
Besides turnover, composition can also be assessed by the space labour force. Using the Companies Act 2006 definition of small and medium‐sized enterprises19, 71% of the organisations in the UK space economy covered by this analysis would be defined as SMEs.
Table 13 Size composition of the UK space economy, by employment
Total employment class Number of companies Space employment Weighted average space share<5 37 59 69% 5‐10 12 66 71% ‘Micro’ enterprises 10‐25 15 151 59% 25‐50 13 289 58% ‘Small’ enterprises 50‐100 18 694 53% 100‐250 26 1,697 39% ‘Medium’ enterprises 250‐1000 24 3,049 27% >1000 26 29,615 8% ‘Large’ enterprises Total 171 35,620 9.1%
Note: The table is based on a sample of survey respondents in 2014, estimated companies based on previous responses and companies analysed through annual reports. Companies covered by the small firm reporting exemption are not considered in this table, but should be expected in one of the first four classes. For international groups, only employment in the UK is considered. Source: London Economics analysis.
As a general trend, for both for turnover and employment, small firms tend to be specialised into space with a very high average space share while large companies are more diversified and have a progressively smaller share of the business active in space.
Figure 6 Space share by turnover Figure 7 Space share by employment
Note: Non‐responding companies covered by the small firm exemption are not considered in these charts. Source: London Economics analysis.
65%
72%
64%
41%
29%
16%
0% 10% 20% 30% 40% 50% 60% 70% 80%
<0.1
0.1 ‐ 1
1 ‐ 10
10 ‐ 100
100 ‐ 1,000
> 1,000
Weighted average space share
Total turno
ver, £m , 20
12/13 prices
69%
71%
59%
58%
53%
39%
27%
8%
0% 10% 20% 30% 40% 50% 60% 70% 80%
<5
5 ‐ 10
10 ‐ 25
25 ‐ 50
50 ‐ 100
100 ‐ 250
250 ‐ 1,000
>1,000
Weighted average space share
# of employee
s
3.3 Skills and qualifications
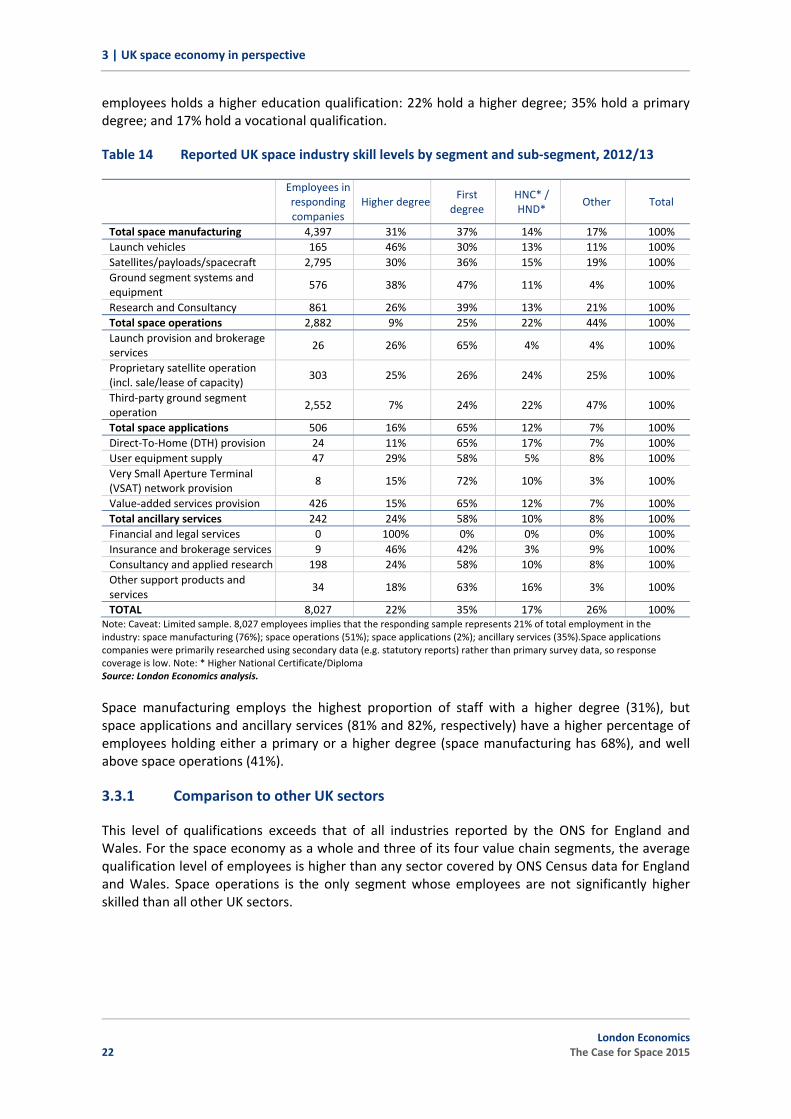
The space economy employs an exceptionally skilled labour force. Based on the qualifications of employees as reported by respondents to the 2014 Size and Health survey (Table 14), 3 of every 4
19 According to the definition by employment Small enterprises employ less than 50 and Medium‐sized enterprises less than 250 staff. In addition, we have separated defined ‘Micro’ enterprises as those with fewer than 10 employees. Please see Companies Act 2006 article 382, available here: http://www.legislation.gov.uk/ukpga/2006/46/section/382. Please note data on turnover (up to £6.5m) and balance sheet (up to £3.26m) are required to define SMEs precisely, but as the balance sheet is not available, we define based on employment only. The results imply that at most 71% of enterprises for which data are available are SMEs. It is, however, likely that the vast majority of organisations for which no data are available are SMEs as well.
employees holds a higher education qualification: 22% hold a higher degree; 35% hold a primary degree; and 17% hold a vocational qualification.
Table 14 Reported UK space industry skill levels by segment and sub‐segment, 2012/13
Employees in responding companies
Higher degreeFirst
degree HNC* / HND*
Other Total
Total space manufacturing 4,397 31% 37% 14% 17% 100% Launch vehicles 165 46% 30% 13% 11% 100% Satellites/payloads/spacecraft 2,795 30% 36% 15% 19% 100% Ground segment systems and equipment
576 38% 47% 11% 4% 100%
Research and Consultancy 861 26% 39% 13% 21% 100% Total space operations 2,882 9% 25% 22% 44% 100% Launch provision and brokerage services
26 26% 65% 4% 4% 100%
Proprietary satellite operation (incl. sale/lease of capacity)
303 25% 26% 24% 25% 100%
Third‐party ground segment operation
2,552 7% 24% 22% 47% 100%
Total space applications 506 16% 65% 12% 7% 100% Direct‐To‐Home (DTH) provision 24 11% 65% 17% 7% 100% User equipment supply 47 29% 58% 5% 8% 100% Very Small Aperture Terminal (VSAT) network provision
8 15% 72% 10% 3% 100%
Value‐added services provision 426 15% 65% 12% 7% 100% Total ancillary services 242 24% 58% 10% 8% 100% Financial and legal services 0 100% 0% 0% 0% 100% Insurance and brokerage services 9 46% 42% 3% 9% 100% Consultancy and applied research 198 24% 58% 10% 8% 100% Other support products and services
34 18% 63% 16% 3% 100%
TOTAL 8,027 22% 35% 17% 26% 100% Note: Caveat: Limited sample. 8,027 employees implies that the responding sample represents 21% of total employment in the industry: space manufacturing (76%); space operations (51%); space applications (2%); ancillary services (35%).Space applications companies were primarily researched using secondary data (e.g. statutory reports) rather than primary survey data, so response coverage is low. Note: * Higher National Certificate/Diploma Source: London Economics analysis.
Space manufacturing employs the highest proportion of staff with a higher degree (31%), but space applications and ancillary services (81% and 82%, respectively) have a higher percentage of employees holding either a primary or a higher degree (space manufacturing has 68%), and well above space operations (41%).
3.3.1 Comparison to other UK sectors
This level of qualifications exceeds that of all industries reported by the ONS for England and Wales. For the space economy as a whole and three of its four value chain segments, the average qualification level of employees is higher than any sector covered by ONS Census data for England and Wales. Space operations is the only segment whose employees are not significantly higher skilled than all other UK sectors.
22 London Economics
The Case for Space 2015
3 | UK space economy in perspective
Figure 8 Qualifications in the space economy compared with other sectors.
Note: Space economy and sub‐segments based on respondents to Size and Heath of the UK Space Industry 2014. For comparability, Higher Degree, First Degree and HNC/HND have been combined. Source: London Economics analysis of ONS Census data 2011.
93% 92%
83%
74%
64%61%
57% 56%
49% 47%42%
39%35%
33%
25% 24% 23%19% 17% 17% 16%
0%
10%
20%
30%
40%
50%
60%
70%
80%
90%
100%
Total space
app
lications
Total ancillary services
Total space
manufacturing
Space Econ
omy
M Professional, scientific and
technical activities
P Education
J Information and commun
ication
Total space
ope
ratio
ns
K Financial and
insurance activities
Q Hum
an health
and
social w
ork
activities
O Pub
lic adm
inistration and de
fence;
compu
lsory social security
L Re
al estate activities
England and Wales workforce
average
R, S, T, U
Other
A, B, D
, E Agriculture, ene
rgy and
water C Manufacturing
N Adm
inistrative and supp
ort service
activities
G W
holesale and
retail trade
; rep
air o
f motor veh
icles and
motor cycles
F Co
nstructio
n
H Transpo
rt and
storage
I Accom
mod
ation and food
service
activities
Share of employee
s ho
lding at highe
r de
gree
, first degree or HNC/HND and
eq
uivalent qualifications
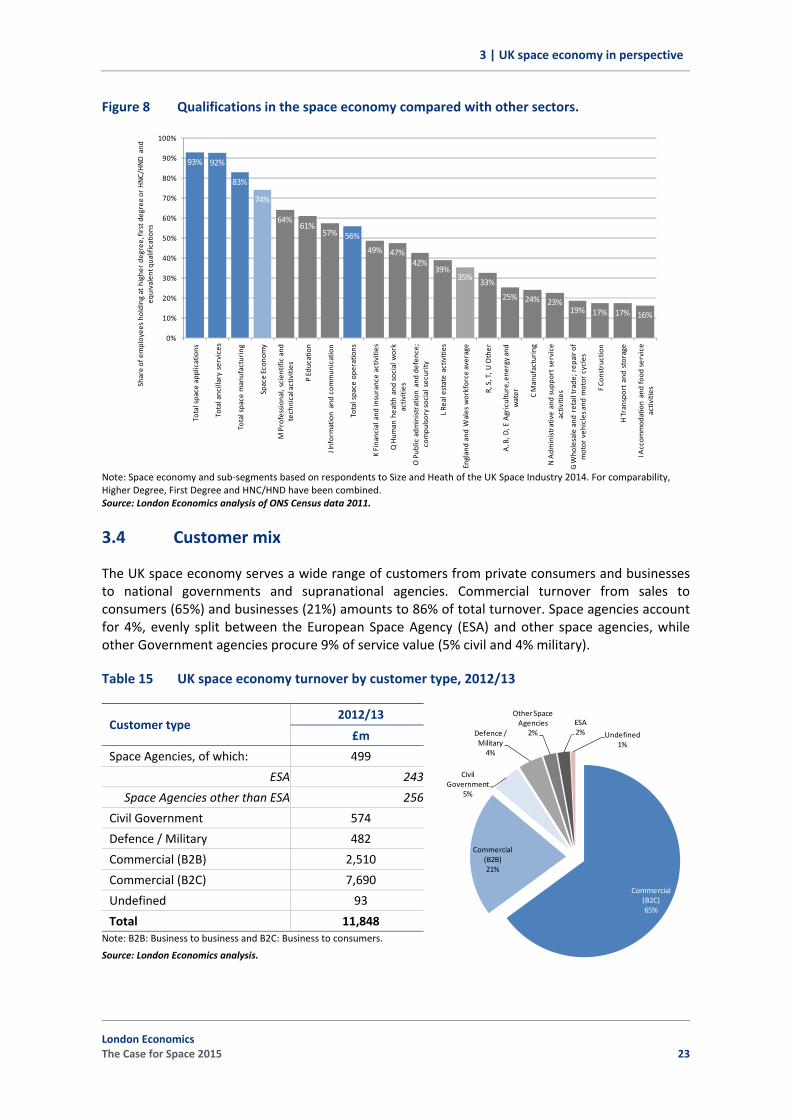
3.4 Customer mix
The UK space economy serves a wide range of customers from private consumers and businesses to national governments and supranational agencies. Commercial turnover from sales to consumers (65%) and businesses (21%) amounts to 86% of total turnover. Space agencies account for 4%, evenly split between the European Space Agency (ESA) and other space agencies, while other Government agencies procure 9% of service value (5% civil and 4% military).
Table 15 UK space economy turnover by customer type, 2012/13
Customer type 2012/13
£m
Space Agencies, of which: 499
ESA 243
Space Agencies other than ESA 256
Civil Government 574
Defence / Military 482
Commercial (B2B) 2,510
Commercial (B2C) 7,690
Undefined 93
Total 11,848 Note: B2B: Business to business and B2C: Business to consumers.
Source: London Economics analysis.
Commercial (B2C)65%
Commercial (B2B)21%
Civil Government
5%
Defence / Military4%
Other Space Agencies
2%ESA2% Undefined
1%
London Economics The Case for Space 2015 23
3 | UK space economy in perspective
3.4.1 Comparison to the global space economy
According to the Space Foundation (2014), global space activity is split between commercial and government activities with 76% and 24%, respectively. Combining all government customers (including space agencies), the UK space economy only generates 14% of its turnover from the public sector. However, as the US government is responsible for more than half of all public space activity in the world, UK companies appear to have taken a good slice of the government business.
3.5 Export intensity and markets
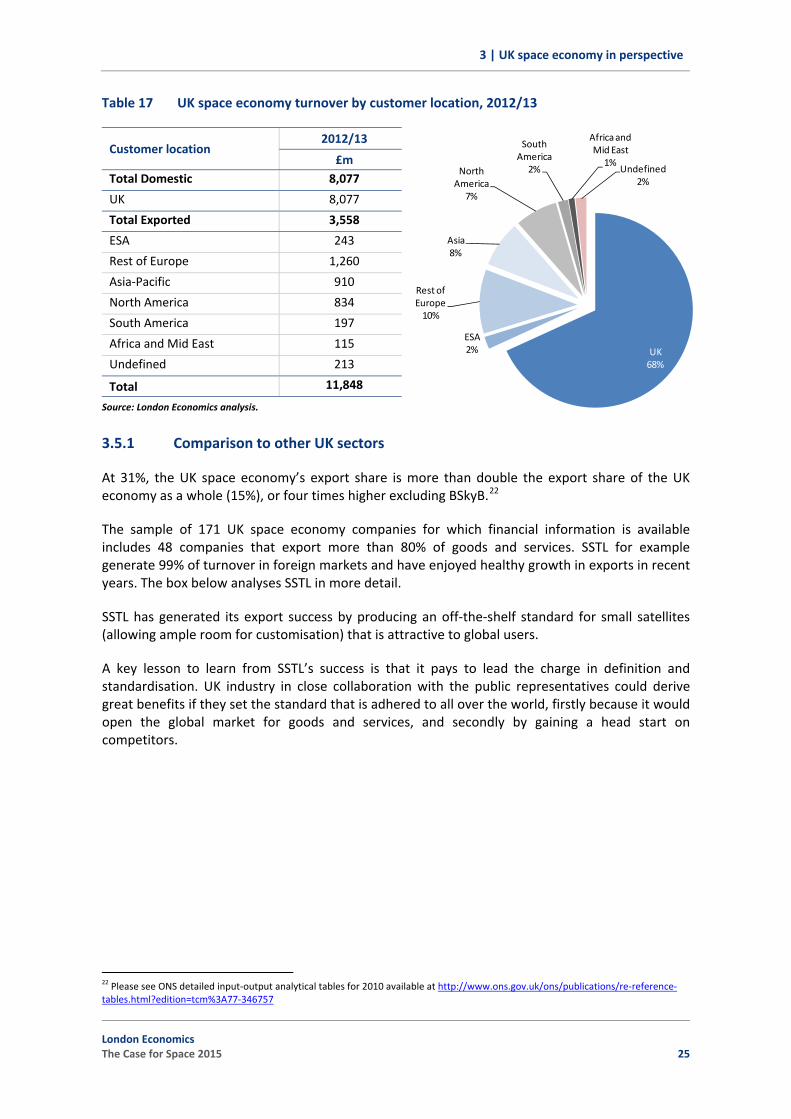
The UK space economy has enjoyed success in exports and now generates 31% of turnover abroad (£3.6bn).20
Table 16 UK space economy turnover by customer location, 2012/13
Export intensity 2012/13
£m
Turnover from export 3,558
As % of total 31% Note: Export value and intensity exclude the level of turnover for which a breakdown by location was not available ('undefined'). Source: London Economics.
Sales in the UK continue to dominate other regions with 68% of total turnover raised in the home market. BSKYB’s dominance of UK space turnover and the fact the BSKYB only have small exports to Ireland mean the aggregate space economy has a strong home market focus.21 Indeed, the UK space economy excluding BSKYB had an export share of 62.3% in 2012/13.
The main market outside the UK is the rest of Europe, valued at £1.5bn (12%). Asia‐Pacific and North America contribute just less than £1bn each (8% and 7%, respectively). South America and Africa and the Middle East are still of limited importance at this point in time. However, SSTL’s delivery of satellites to Nigeria shows the continent is ready to add to its space capacity and commission UK companies to do so.
20 By definition, goods and services sold to ESA are an export as the ownership of goods or intellectual property changes hands from a UK entity to an entity that is based in a foreign country and which is not majority‐controlled by UK interests. 21 Sky Italia and Sky Deutschland were separate entities in the financial years covered by this report although later acquired by BSKYB trading as SKY.
24 London Economics
The Case for Space 2015
3 | UK space economy in perspective
Table 17 UK space economy turnover by customer location, 2012/13
Customer location 2012/13
£m Total Domestic 8,077
UK 8,077
Total Exported 3,558
ESA 243
Rest of Europe 1,260
Asia‐Pacific 910
North America 834
South America 197
Africa and Mid East 115
Undefined 213
Total 11,848
Source: London Economics analysis.
UK 68%
ESA2%
Rest of Europe10%
Asia8%
North America
7%
South America
2%
Africa and Mid East
1%Undefined
2%
3.5.1 Comparison to other UK sectors
At 31%, the UK space economy’s export share is more than double the export share of the UK economy as a whole (15%), or four times higher excluding BSkyB.22
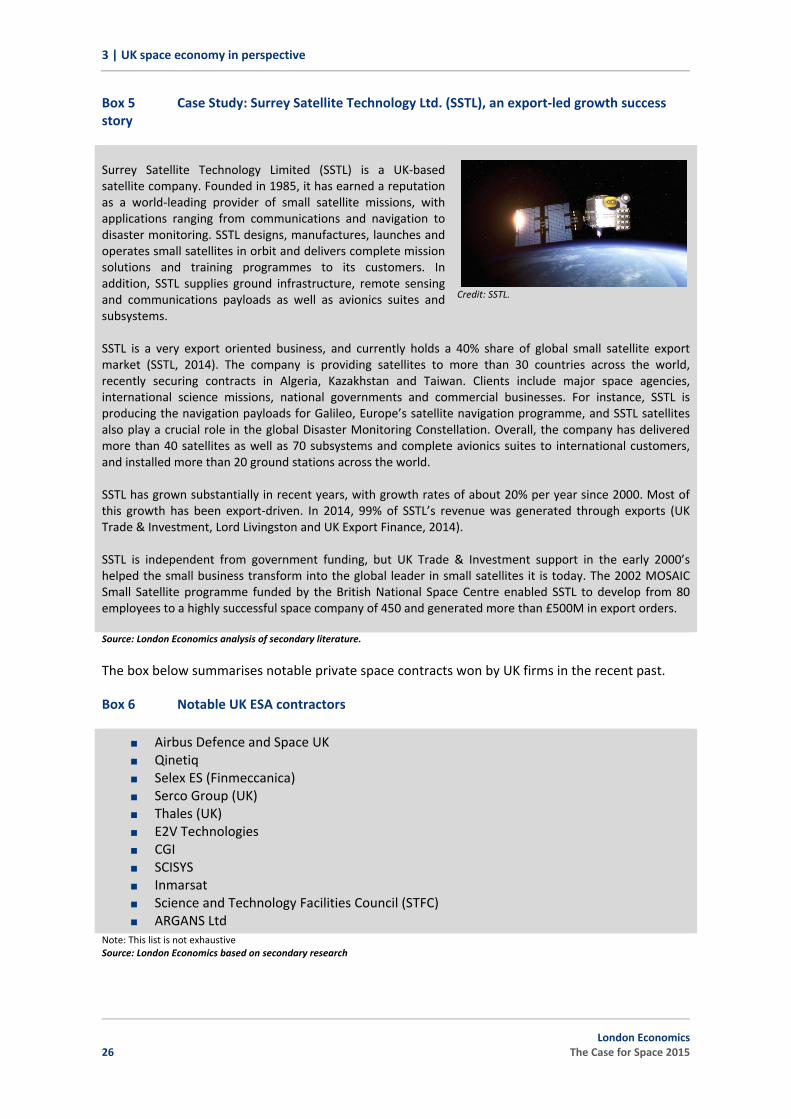
The sample of 171 UK space economy companies for which financial information is available includes 48 companies that export more than 80% of goods and services. SSTL for example generate 99% of turnover in foreign markets and have enjoyed healthy growth in exports in recent years. The box below analyses SSTL in more detail.
SSTL has generated its export success by producing an off‐the‐shelf standard for small satellites (allowing ample room for customisation) that is attractive to global users.
A key lesson to learn from SSTL’s success is that it pays to lead the charge in definition and standardisation. UK industry in close collaboration with the public representatives could derive great benefits if they set the standard that is adhered to all over the world, firstly because it would open the global market for goods and services, and secondly by gaining a head start on competitors.
22 Please see ONS detailed input‐output analytical tables for 2010 available at http://www.ons.gov.uk/ons/publications/re‐reference‐tables.html?edition=tcm%3A77‐346757
Box 5 Case Study: Surrey Satellite Technology Ltd. (SSTL), an export‐led growth success story
Surrey Satellite Technology Limited (SSTL) is a UK‐based satellite company. Founded in 1985, it has earned a reputation as a world‐leading provider of small satellite missions, with applications ranging from communications and navigation to disaster monitoring. SSTL designs, manufactures, launches and operates small satellites in orbit and delivers complete mission solutions and training programmes to its customers. In addition, SSTL supplies ground infrastructure, remote sensing and communications payloads as well as avionics suites and subsystems. SSTL is a very export oriented business, and currently holds a 40% share of global small satellite export market (SSTL, 2014). The company is providing satellites to more than 30 countries across the world, recently securing contracts in Algeria, Kazakhstan and Taiwan. Clients include major space agencies, international science missions, national governments and commercial businesses. For instance, SSTL is producing the navigation payloads for Galileo, Europe’s satellite navigation programme, and SSTL satellites also play a crucial role in the global Disaster Monitoring Constellation. Overall, the company has delivered more than 40 satellites as well as 70 subsystems and complete avionics suites to international customers, and installed more than 20 ground stations across the world. SSTL has grown substantially in recent years, with growth rates of about 20% per year since 2000. Most of this growth has been export‐driven. In 2014, 99% of SSTL’s revenue was generated through exports (UK Trade & Investment, Lord Livingston and UK Export Finance, 2014). SSTL is independent from government funding, but UK Trade & Investment support in the early 2000’s helped the small business transform into the global leader in small satellites it is today. The 2002 MOSAIC Small Satellite programme funded by the British National Space Centre enabled SSTL to develop from 80 employees to a highly successful space company of 450 and generated more than £500M in export orders.
Credit: SSTL.
Source: London Economics analysis of secondary literature.
The box below summarises notable private space contracts won by UK firms in the recent past.
Box 6 Notable UK ESA contractors
Airbus Defence and Space UK Qinetiq Selex ES (Finmeccanica) Serco Group (UK) Thales (UK) E2V Technologies CGI SCISYS Inmarsat Science and Technology Facilities Council (STFC) ARGANS Ltd
Note: This list is not exhaustive Source: London Economics based on secondary research
26 London Economics
The Case for Space 2015
3 | UK space economy in perspective
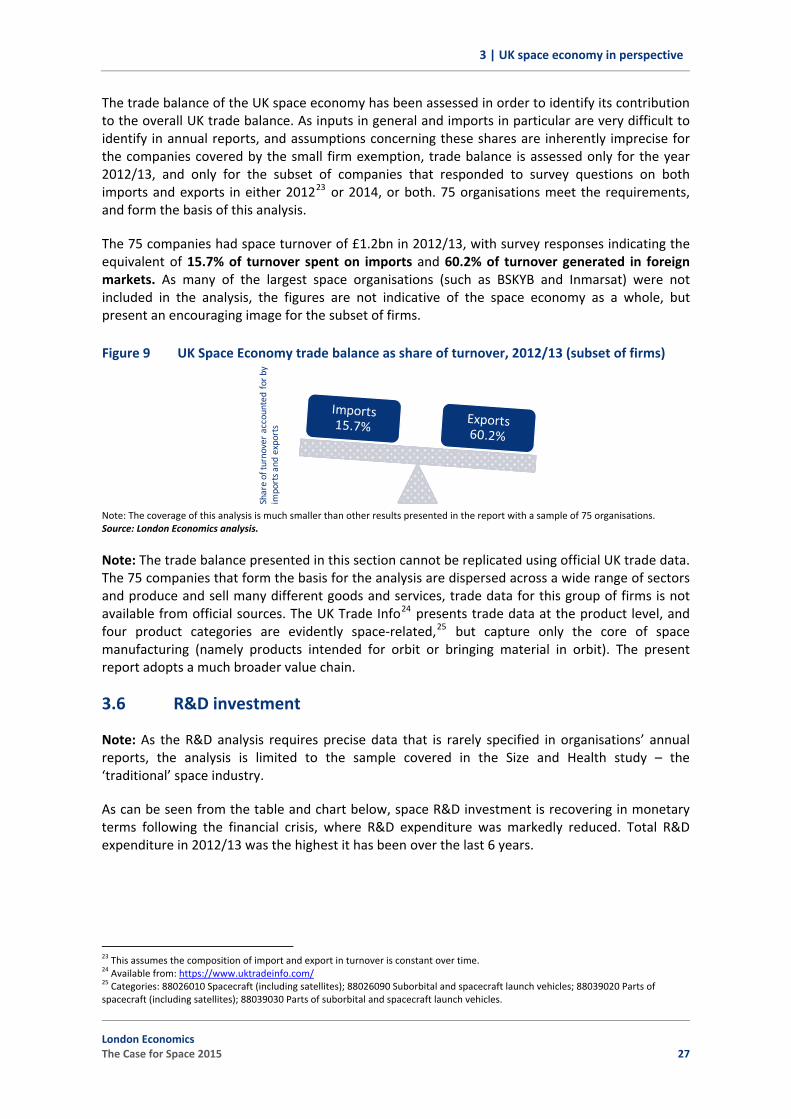
The trade balance of the UK space economy has been assessed in order to identify its contribution to the overall UK trade balance. As inputs in general and imports in particular are very difficult to identify in annual reports, and assumptions concerning these shares are inherently imprecise for the companies covered by the small firm exemption, trade balance is assessed only for the year 2012/13, and only for the subset of companies that responded to survey questions on both imports and exports in either 201223 or 2014, or both. 75 organisations meet the requirements, and form the basis of this analysis.
The 75 companies had space turnover of £1.2bn in 2012/13, with survey responses indicating the equivalent of 15.7% of turnover spent on imports and 60.2% of turnover generated in foreign markets. As many of the largest space organisations (such as BSKYB and Inmarsat) were not included in the analysis, the figures are not indicative of the space economy as a whole, but present an encouraging image for the subset of firms.
Figure 9 UK Space Economy trade balance as share of turnover, 2012/13 (subset of firms)
Note: The coverage of this analysis is much smaller than other results presented in the report with a sample of 75 organisations.Source: London Economics analysis.
Share of turnover accounted
for by
imports a
nd exports
Note: The trade balance presented in this section cannot be replicated using official UK trade data. The 75 companies that form the basis for the analysis are dispersed across a wide range of sectors and produce and sell many different goods and services, trade data for this group of firms is not available from official sources. The UK Trade Info24 presents trade data at the product level, and four product categories are evidently space‐related,25 but capture only the core of space manufacturing (namely products intended for orbit or bringing material in orbit). The present report adopts a much broader value chain.
3.6 R&D investment
Note: As the R&D analysis requires precise data that is rarely specified in organisations’ annual reports, the analysis is limited to the sample covered in the Size and Health study – the ‘traditional’ space industry.
As can be seen from the table and chart below, space R&D investment is recovering in monetary terms following the financial crisis, where R&D expenditure was markedly reduced. Total R&D expenditure in 2012/13 was the highest it has been over the last 6 years.
23 This assumes the composition of import and export in turnover is constant over time. 24 Available from: https://www.uktradeinfo.com/ 25 Categories: 88026010 Spacecraft (including satellites); 88026090 Suborbital and spacecraft launch vehicles; 88039020 Parts of spacecraft (including satellites); 88039030 Parts of suborbital and spacecraft launch vehicles.
Table 18 UK space economy expenditure on R&D, 2004/05 – 2012/13
Year £m, 2012/13 prices2004/05 351
2006/07 323
2008/09 129
2010/11 126
2011/12 407
2012/13 454
Note: The R&D analysis relates to the ‘traditional’ space industry. Source: London Economics analysis. 0
50
100
150
200
250
300
350
400
450
500
2004/05 2006/07 2008/09 2010/11 2011/12 2012/13
R&D expenditure differs by segment of the value chain. At 8.8% and 8.7% respectively, the proportion of turnover spent on R&D for the sample of space manufacturing and ancillary services firms covered by the analysis is about 9 times as great as that of space operations. Space applications spend about 4% of turnover on R&D, similar to the total space industry.
Table 19 UK space industry R&D expenditure as a % of space turnover by segment, 2012/13
Segment Internal External Total
Space manufacturing 2.9% 5.9% 8.8%
Space operations 0.4% 0.6% 1.0%
Space applications 2.7% 1.3% 4.0%
Ancillary services 5.8% 2.9% 8.7%
Total 2.5% 1.6% 4.1% Note: The R&D analysis relates to the ‘traditional’ space industry alone. Source: London Economics analysis.
The statistics suggest that space manufacturing companies are skilled at winning external R&D funding for their projects with the equivalent of 5.9% of turnover raised from external in R&D funding. The sample of space applications and ancillary services firms covered seem to be more reliant on internal R&D funding.
Figure 10 UK space industry R&D expenditure as a % of space turnover by segment, 2012/13
Source: London Economics analysis.
2.9%
0.4%
2.7%
5.8%
5.9%
0.6%
1.3%
2.9%
0.0%
1.0%
2.0%
3.0%
4.0%
5.0%
6.0%
7.0%
8.0%
9.0%
10.0%
Space manufacturing Space operations Space applications Ancillary services
% of spa
ce tu
rnov
er
Internal External
28 London Economics
The Case for Space 2015
3 | UK space economy in perspective
In order to enable comparisons of economic measures, it is often useful to normalise by GVA. R&D activities in space manufacturing are particularly high, as would be expected given the segment’s activities of building equipment that will operate in the toughest of environments, at 26.1% of GVA, compared to 9.8% for the full space economy.
Table 20 UK space industry R&D expenditure value and as a % of GVA by segment, 2012/13
Segment Internal External Total
£m % of GVA £m % of GVA £m % of GVA
Space manufacturing 27 8.7% 53 17.4% 80 26.1%
Space operations 6 0.8% 8 1.1% 14 1.9%
Space applications 229 6.7% 110 3.2% 339 10.0%
Ancillary services 14 7.2% 7 3.6% 21 10.8%
Total (weighted average) 275 6.0% 178 3.9% 453 9.8% Note: The R&D analysis relates to the ‘traditional’ space industry alone. Source: London Economics analysis.
In monetary terms, the space applications segment has the largest R&D activity at £339m, followed some way behind by space manufacturing at £80m.
3.6.1 Comparison to other UK sectors
The UK space industry is an R&D intensive industry and spends more on R&D than many high‐technology sectors such as telecommunications and computer programming services. It is, however still lagging behind motor vehicles and parts and the pharmaceutical sector, which is particularly known for high R&D budgets (supported by highly lucrative potential markets).
Table 21 UK space economy R&D expenditure compared to selected UK sectors, 2012/13
Industry
R&D expen‐diture
Total GVAR&D as % of GVA
£m Pharmaceuticals 4,206 6,930 60.7%
Motor vehicles & parts 1,732 10,678 16.2%
Space industry 453 4,608 9.8% Computer programming & info services
1,930 46,821 4.1%
Telecommunications 889 26,247 3.4%
UK economy 17,107 1,628,338 1.1%
60.7%
16.2%
9.8%4.1% 3.4%
0.0%
10.0%
20.0%
30.0%
40.0%
50.0%
60.0%
70.0%
Pharmaceuticals
Motor vehicles
& parts
UK space
industry
Computer
programming &
info se
rvices
Telecomms
R&D expen
diture as a % of G
VA, 2
012/13
Note: The analysis covers survey respondents and companies researched through annual accounts only. Source: London Economics analysis.
London Economics The Case for Space 2015 29
3 | UK space economy in perspective
3.6.2 Comparison to the global space economy
According to the OECD, the UK ranks 7th among OECD countries on the proportion of total civil government R&D expenditure devoted to space. As a member of the EU28, however, the country is able to derive further R&D funding from research programmes such as Horizon2020, and thus tap into the larger share of overall EU R&D that is devoted to space.
Figure 11 International comparison of civil government space R&D budget as proportion of total civil government R&D budget
Source: OECD, Space Economy at a Glance 2014.
10.4%
8.7%
7.9% 7.7%
6.5% 6.5%
4.9% 4.9%4.2% 4.1%
3.7% 3.5% 3.4% 3.2% 2.9%
0.0%
2.0%
4.0%
6.0%
8.0%
10.0%
12.0%
USA
EU28
Russia
Japan
France
Germany
Italy UK
Spain
Korea
Canada
Belgium
Argentina
Taiwan
NetherlandsCivil gov
ernm
ent R
&D bud
gets for space as a propo
rtion
of to
tal civil go
vernem
tn R&D bud
get, 2012
30 London Economics
The Case for Space 2015
4 | Government engagement in the space economy
4 Government engagement in the space economy
Like many governments, much of the UK Government’s involvement in the space economy is the procurement of services (e.g. remote sensing, weather forecasting, defence) or undertaking scientific research that requires or is more efficiently done from space. In this role, the government is a customer transacting with space companies. However, there is a broader role for government – to act to ensure that UK citizens and companies can access the benefits of space.
This section sets out the rationale for government intervention in the space sector, an overview of current and historical UK Government involvement, with international comparisons;
4.1 Rationale for government intervention in space
Simply illustrating the economic contribution of the space sector to the UK economy is not sufficient to alone merit support from government. Rather, a deviation of market performance away from the social optimum that can be effectively and efficiently corrected by government action must be shown.
Classical economic theory provides a rationale for government intervention in an otherwise free, or laissez‐faire, market where there is an identified imperfection in the efficient allocation of resources, known as ‘market failure’ – that is, the market left to its own devices fails to deliver the most efficient outcome.
Identification of a market imperfection is a necessary, but not sufficient, condition for intervention. An adequate definition and understanding of the problem is required to design an appropriate intervention, and to assess whether government action to re‐balance the market towards efficient operation is possible and appropriate.
Each market has its unique characteristics, and space is no different. As noted in the most recent BIS economics paper on the space economy26: “Space‐enabled systems display a combination of features that make space different from many other sectors and markets. Most of them result from the technical features of space as a physical environment – space provides a vantage point from which to observe and communicate, but access to space is costly and technically and financially risky. Other distinctive features are the special attributes of space‐enabled services as economic goods, and the historic role of Governments in driving and shaping this market.”
Below we present a brief explanation of the classical microeconomic arguments underpinning government intervention to influence supply and demand for space‐enabled applications to result in a better outcome for society:
Provide a link between R&D intensive upstream segment and commercially lucrative downstream segment, without Government intervention, the re‐investment loop between the two segments would only exist in vertically integrated companies, thus risking underinvestment.
26 Department for Business, Innovation and Skills, BIS (2010) The Space Economy in the UK: An economic analysis of the sector and the role of policy, BIS Economics Paper No. 3, February 2010, p.viii. Available at: http://webarchive.nationalarchives.gov.uk/20121212135622/http://bis.gov.uk/assets/biscore/economics‐and‐statistics/docs/10‐624‐bis‐economics‐paper‐03.pdf
Private capital market imperfections: The first argument is the inability of the private capital market to provide necessary financing. This has long been an issue for the commercial space industry – Rose (1986)27 notes the presence of three factors that may reduce or eliminate the availability of private financing: i) High uncertainty or risk; ii) Large fixed costs; iii) Long lead times for project development or long payback periods. Risk, driven by technological, market and economic uncertainty, is the dominant factor and is common to all space technologies, especially those in development. Being characterised by very substantial fixed costs, but low‐to‐negligible marginal costs (e.g. the cost of providing satellite broadband to an extra user, or taking an additional remote sensing image, is practically zero within the area of coverage) there is significant potential for large economies of scale in the downstream space‐enabled applications, meaning that economic viability depends on attraction of large user markets. Lastly, the development phase is long and costly, meaning that funds much be invested up‐front and may not begin to see a return for many years – the return, however, must be attractive enough to reflect the quantum, risk and time‐to‐maturity of the investment.
Science & Innovation market failures: The challenges of space as an operating environment mean that R&D and innovation are essential to progress, providing benefits in terms of private payoff (e.g. profit) and social return through knowledge, market and network spillovers for which the innovator is not recompensed. The socially optimal level of R&D will occur when the full cost of R&D is weighed against the combined private and social payoff. In the absence of intervention to re‐balance private incentives to conduct R&D (e.g. matched funding), commercial operators may be deterred from undertaking socially desirable R&D when the private payoff is not sufficiently certain and substantial to outweigh the costs.
Space applications as public goods: The defining characteristics of a public good are that it should be both non‐excludable (individuals cannot be effectively excluded from consumption) and non‐rivalrous (consumption by one individual does not actually or potentially reduce availability to others, nor increase costs of provision). Many space‐enabled data services possess attributes of public goods in that they can be used by many users simultaneously (e.g. broadcasting, weather forecast) without the ability to restrict use (e.g. satellite navigation open service signal), though in some cases specialist equipment (e.g. a BGAN28 terminal) or a subscription (e.g. mobile satellite services contract) is required and limited transponder capacity may mean that more users increases the cost of provision. Technological difficulties or social undesirability of charging users and preventing access for non‐payers may impede incentives to invest in the systems and result in undersupply of infrastructure and/or services.
Government prominence: Since its inception, government has always played a prominent role the space industry, as investor, owner, operator, regulator and customer for space infrastructure – a manifestation of the factors outlined above. Though the rise of commercial space enterprise, which it has encouraged, has diluted this role, governments (domestic and international) continue to feature prominently. Government intervention is not limited to the achievement of economic objectives. In fact, space policy is further influenced by adjacent objectives of national strategic interest, defence (dual use nature of space technologies), political prestige, technological leadership and international competitiveness. These parallel objectives can run contrary to purely economic ones and cause economic inefficiencies: for example, the dual use nature of space technologies (i.e.
27 Rose, N., L. (1986) “The Government’s Role in the Commercialization of New Technologies: Lessons For Space Policy”, Available at: http://economics.mit.edu/files/4342 28 Broadband Global Area Network
they can be used for both civil and military purposes) has both advantages (dual market is an incentive) and disadvantages (restrictions on export and international collaboration possibilities) for the development of civil and commercial applications. Government policies are seldom perfectly designed and implemented, such that intervention can introduce a new distortion into the market – a so‐called government failure. The effect of this failure can be exacerbated in cases where the government is the sole purchaser.
Space as a commons: Outer space is defined in international law (The Outer Space Treaty of 1967) as a ‘commons’, characterised by non‐appropriability (i.e. non ownership or individually held property rights), available for joint use by all States through their governmental and non‐governmental organisations. With increasing demand for use of scarce spectrum and orbit allocations, issues of efficient and fair use of this resource have arisen, which must be allocated by international convention to governments – the International Telecommunication Union designates the volume of orbit/spectrum resources to national administrations to assign frequencies and orbital positions to commercial organisations. One obstacle to efficient allocation here is that orbit/frequency resources are allocated on a first‐come, first‐served basis.
Externalities: Space also offers the potential for important externalities, both positive and negative, that must be accounted for. Space debris is an example of a negative externality – once a satellite becomes defunct and is decommissioned, it ceases to be of utility to the owner, but continues to be a risk to other space assets as space debris. Outer space is vast, and mitigation of debris is very costly, so zero debris is not a realistic objective. Rather, high priority debris (e.g. that in heavy traffic orbits) can be prioritised and enforced through economic incentives and penalties. On the positive side, the usage of space‐enabled technologies can provide a range of positive externalities (e.g. cleaner environment; avoided distress of casualties and fatalities; efficient traffic and people management in smart cities; etc.). There is therefore an important role for the government to restrict the negatives and promote activities yielding positive spillover effects.
Level playing field: In some instances, the government may intervene to establish a level playing field both in the domestic market, and for domestic companies competing with international competitors. Such intervention may be limited to seeking abolition of trade barriers, subsidies and/or duties.
4.1.1 Linkages between the upstream and downstream space industry
A key justification for government intervention arises from the linkages between the upstream industrial segment and the downstream applications segment of the UK space economy.
The downstream segment (equivalent to space applications and space operations segments) is nearly twelve times the size of the upstream segment (equivalent to space manufacturing), as measured by turnover. This ratio compares well with European countries such as France and Italy, showing the UK’s focus on and success at exploiting the downstream benefits of its space industry.
Though there are a number of vertically integrated space companies in the UK, most tend to be specialised within either segment, and the downstream segment contains some very large firms.
Without the R&D‐intensive, infrastructure‐forming upstream segment, there would be no lucrative commercial infrastructure‐exploiting downstream applications, yet except the case of vertically integrated companies, there is no feedback or re‐investment loop between them. This touches on elements of the public good argument above, but a subtle and important difference is that some
London Economics The Case for Space 2015 33
4 | Government engagement in the space economy
of the services are (at least partially) commercially operated. It follows from the same logic that there is a role for the government as anchor customer and promoter of applications in addition to the role of early phase investor.
As highlighted in the 2009 The Case for Space report, the UK’s upstream segment has stimulated market activity and end‐user benefits in the downstream applications segment that would not have materialised otherwise. The channels by which this extra activity and benefits flow to the downstream are:
Human capital: Labour market spillovers arise as new skills are developed in each segment and skilled employees move between the upstream and downstream segments, developing a critical mass of skills in the labour market that enable downstream activities to occur.
Knowledge‐sharing: Sharing of technical knowledge and expertise between the upstream and downstream segments to stimulate development and marketing of new services, reducing risks in development, and closing the investment knowledge gap to improve the City’s and public sector funders ability to assess projects, with increased appetite to invest in the space economy, both domestically and in export markets.
Economies of scale and scope: There are efficiencies to be gained (sharing of fixed costs and technical knowledge) from undertaking an increasing number of related and larger‐volume projects spanning the upstream and downstream divide.
Collaboration: Bringing together organisations from upstream and downstream segments to collaborate to realise projects that neither could develop individually, especially for projects that could be developed via collaboration between UK based downstream companies and non‐UK upstream companies (trust, culture, familiarity, key staff interaction, co‐location).
Early adoption: Upstream leadership allows the downstream segment to adopt new techniques, capabilities and services early, ahead of international competitors, which in turn enhances the productivity and competitive offering of UK companies.
Closeness: In terms of maximising return to, and spillovers from R&D expenditure, geographic proximity and consistency technological approach (both vertically in the supply chain and horizontally in terms of standards horizontally across the segment).
Competitive position of UK universities and higher education institutions: The R&D intensity of the upstream segment is well established, translating to cutting‐edge upstream activities, which serves to maintain the science base and the ability of university departments and research institutes to compete for staff, (international) students and research contracts.
Start ups: Innovative new start‐up companies create opportunities for new service and upstream providers, and this is a key impact of the ESA Business Innovation Centre and the Satellite Applications Catapult.
By limiting collaboration to between domestic companies, developing capabilities within the UK rather than importing, the UK ensures that the knowledge, technology, intellectual property and competitive advantage are retained within the UK space economy. This in turn should boost the export potential of the UK in areas of collaboration between the upstream and downstream segments.
34 London Economics
The Case for Space 2015
4 | Government engagement in the space economy
Many of the leading downstream companies have grown out of the upstream. This is because understanding of the upstream capability is necessary to exploit the downstream and appropriate the flow of human capital from the upstream.
A clear international example of the upstream creating value in the downstream is that of the Global Positioning Service (GPS): US leadership in navigation and GPS applications (the USA has an estimated 31% share of downstream market revenues29), was stimulated by the creation of the first satellite navigation system and by the knowledge‐sharing from the upstream to the downstream segment.
In the UK, previous examples include:
Avanti, a downstream service provider and supplier, identified the potential for developing their own space segment, and made a direct investment in the upstream (ESA and Airbus D&S are partners) to develop the HYLAS satellites to supply satellite broadband and screen media.
A UK Direct‐to‐Home broadcasting system was developed in 1982 by a UK upstream consortium (British Aerospace, Marconi Space Systems and British Telecommunications) in Unisat, which ultimately failed, but highlighted the potential of satellite broadcasting leading to the launch of Sky Channel in July 1988 that would later merge with British Satellite Broadcasting to become BSkyB.
Mobile satellite operator Inmarsat was formed in London largely due to the large shareholding of BT and the strong maritime links, with many of the founding staff coming from the BT Maritime division.
Defence satellite communications company Paradigm Secure Communication was created by Astrium (now both part of the Airbus Defence and Space group) entity to manage the Skynet 5 satellites and services, and was the customer for Astrium and the Ministry of Defence was the anchor customer for Paradigm.
Satellite manufacturer British Aerospace created BAe Communications, a forerunner of Arqiva, to exploit the downstream satellite communications market.
InfoTerra, now owned by Airbus DS, is a downstream company that is now directly linked to the upstream, having been first formed as the National Remote Sensing Centre (NRSC) to exploit the downstream market in EO data and services.
4.2 UK Government support to the space economy
Underpinned by the rationale outlined above, the UK recently celebrated 50 years in space, having been one of the first countries outside of the USA and former USSR to support the development of major space activity. The history and current levels of support are presented in this section.
4.2.1 Forms of UK Government support
The UK Government invests in space through an increasing variety of channels, but are primarily split between national and international programmes:
National programmes include the programmes run by the UK Space Agency in the fields of Earth Observation, Science/Microgravity, Telecommunications, Technology, and
29 The USA has the largest share of the downstream GNSS (Global Navigation Satellite System) market with 31%, followed by Japan and Europe (both 26%). Please see European GNSS Agency (2015) GNSS Market Report – Issue 4, p.11.
London Economics The Case for Space 2015 35
4 | Government engagement in the space economy
Transportation. In 2009/10, the latest year for which a breakdown exists, the national programmes were focused on the Science/Exploration programme with the majority of the expenditure.30 Recent programmes include UKube‐1 and TechDemoSat. R&D funding is also provided directly under the auspices of the Space Agency, such as the recently committed £60 million to Reaction Engines Ltd. for the continued development of the SABRE to be used on the Skylon spaceplane (the box on page 108 has more information on Skylon). InnovateUK and the Satellite Applications Catapult offer facilities, expertise, and incubator support to budding start‐ups and established companies on‐site of the company or at the Harwell Space Campus.
International programmes include the UK’s subscription to the European Space Agency (ESA) and the European Organisation for the Exploitation of Meteorological Satellites (EUMETSAT). In the financial year of 2013/14, the UK Space Agency established a bilateral collaboration agreement with the French Space Agency, CNES, to have UK companies support development of French weather satellites and contribute to CNES’ joint project with NASA to monitor Surface Water Ocean Topography (SWOT).
International programmes: The UK Government’s recent commitment to increase funding to the European Space Agency (ESA) resulted in awarding the UK with ECSAT (the European Centre for Space Applications and Telecommunications) which includes a Business Incubator Centre in ESA’s Integrated Applications Programme that seeks to commercialise ideas that rely on at least two different space services.
Other Government funding includes defence‐related contracts offered to UK companies in the fields of secure communication and navigation as well as Earth Observation for the purpose of monitoring combat zones and territorial sovereignty.
4.2.2 Level of UK Government support
The Government’s space expenditure in real terms is shown in the figure below for the period 1999/00 to 2013/14. Space funding has shifted focus from about a quarter for national programmes to about 10% in the latter years.
Figure 12 UK Government space investment 1999/00 to 2013/14 (2012/13 prices, £m)
Source: London Economics analysis of BNSC, UKSA, and EUMETSAT annual reports and ONS GDP data.
0.000%
0.005%
0.010%
0.015%
0.020%
0.025%
0
50
100
150
200
250
300
350
400
450
500
1999/00
2000/01
2001/02
2002/03
2003/04
2004/05
2005/06
2006/07
2007/08
2008/09
2009/10
2010/11
2011/12
2012/13
2013/14
Total as % of G
DP
£m, 201
2/13
prices
National Eumetsat International Total as % of GDP
30 British National Space Centre Annual Report 2010.
36 London Economics
The Case for Space 2015
4 | Government engagement in the space economy
Government space investment has remained in the narrow band between 0.015% and 0.02% of GDP throughout the period, with only the peak in 2009/10 and the trough in 2012/13 outside of this interval.
The UK’s funding of ESA’s optional programmes allows UK companies to bid for involvement in ESA’s missions and UK companies exploit this option. The latest annual report from ESA (2013) shows the UK’s return coefficient of 0.99 meaning UK companies win contracts worth 99p for each £1 that is paid to ESA. The remaining penny is expected to come back to the individual companies through the knowledge gained in the process and potential for further commercialisation.
In December 201431, it was announced that UK funding of ESA would increase by more than £200 million over the coming years with UK firms set to benefit from the investment through strong involvement in ESA’s Mars mission; access to the ISS programme; and increased activity in telecommunications. UKspace estimate that UK companies will have access to markets worth an additional £1.5 billion following the investment increase.
UK companies have been very successful at winning contracts with the European Space Agency since it joined the organisation in 1978. Below are examples as presented on the UK Space Agency’s website:
Box 7 UK involvement in ESA programmes
BepiColombo ESA mission to Mercury that will improve understanding of the inner planets of the Solar System. The mission is currently in development and expected to embark on its eight year journey to Mercury in July 2016. Much of the spacecraft will be built in the UK with Airbus Defence and Space UK appointed as the prime contractor. QinetiQ will supply the electric propulsion model and the SEA group will supply remote interface units for the electric and chemical propulsion units. Euclid Due to be launched in 2020, Euclid is a high‐precision survey mission to map the geometry of the Dark Universe. e2v are developing the CCD to be used for the survey and nine UK universities and research organisations are involved in the instrument development and data processing and analysis phases of the mission, namely Mullard Space Science Laboratory of the University College London; Durham University Institute for Astronomy, Edinburgh; UK ATC (Astronomy Technology Centre); University of Oxford; University of Portsmouth; University of Hertfordshire; Open University; University of Cambridge; and University College London. (continued overleaf)
Credit: UK Space Agency
Credit: ESA
31 Please see UK Space Agency: https://www.gov.uk/government/news/uk‐space‐industry‐set‐to‐rocket‐with‐over‐200‐million‐of‐new‐investment‐for‐europes‐space‐programme
ExoMars Two joint missions between ESA’s Aurora programme and Roscosmos, ExoMars will develop important science and technologies that will lay foundations for human exploration beyond low Earth orbit. A trace gas orbiter and entry descent and landing demonstrator module will be launched in 2016 and arrive on Mars in 2017. A rover will be launched in 2018 and land on Mars in 2019. Airbus Defence and Space is the lead builder of the rover and SCISYS UK support the development of on‐board software and autonomous operations. University College London’s Mullard Space Science Laboratory (MSSL); University of Aberystwyth; Birkbeck College and the University of Leicester will lead the development of the rover’s panoramic camera and University of Leicester, Bradford University and STFC Rutherford Appleton Laboratory will play key roles in the development of the CCD camera for the rover. The Open University is involved in the development of the trace gas orbiter. Gaia The Gaia spacecraft has been in development since 2007 and was launched in 2013 with the objective of studying the Milky Way in unprecedented 3D detail, mapping stars and their movements. Currently estimated at €80 million, Gaia is one of the most important current ESA project from a UK industry perspective. Airbus Defence and Space are responsible for the precision guidance and control system while e2v has made the camera with a resolution of nearly 1 billion pixels. SCISYS are responsible for the spacecraft’s operational simulator, Selex Systems UK provide system support, Aero Stanrew provided a test bench for avionics and ABSL made the battery. In addition, six UK universities and research laboratories played key roles in database management, extraction and calibration. Herschel Named after the man who discovered Uranus from his home in Bath, Herschel is the largest ever infrared space observatory and the UK lead developments of one of its three instruments. The telescope was launched in 2009 and remained in service until 2013 developing the understanding of how stars are formed. The Spectral and Photometric Imaging Receiver was developed by a team lead by the University of Cardiff and involving multiple research centres and industry players such as STFC Rutherford Appleton Laboratory; Imperial College London; University College London’s Mullard Space Science Laboratory; the UK Astronomy Technology Centre, Edinburgh; AEA Technology, Analyticon, BOC Edwards, Datasat, MT Satellite Products and System International. James Webb Space Telescope (JWST) The James Webb Space Telescope is a joint mission between ESA, NASA, and the Canadian Space Agency, which is due for launch in 2018. The objective of the mission is to examine the physical and chemical properties of solar systems and study the first stars and galaxies. The STFC UK Astronomy Technology Centre is leading the Mid Infrared Instrument European Consortium of more than 20 institutes including the STFC Rutherford Appleton Laboratory, Airbus Defence and Space, the University of Leicester and the University of Cardiff. University College London’s Mullard Space Science Laboratory is supplying Near Infrared Spectographs on board calibration system and ground calibration equipment for the same instrument. A Staffordshire‐based company, Tekdata Interconnect Systems, is manufacturing a ‘cryogenic harness’ for the telescope. This crucial component will link all the JWST’s major systems.
Credit: ESA
Credit: ESA
Credit: ESA
Credit: ESA
38 London Economics
The Case for Space 2015
4 | Government engagement in the space economy
Jupiter icy moon explorer (JUICE) JUICE is designed to make detailed observations of Jupiter and three of its largest moons, Ganymede, Callisto and Europa. All three moons may have liquid water under the crust, and JUICE will be on a mission to assess their habitability for life. The mission is due for launch in 2022 and will arrive at Jupiter in 2030 after which time it will spend 3.5 years in orbit around the planet and moons. Imperial College London have designed the magnetometer that was selected for the spacecraft amid competition from three other UK universities. UK companies will be involved in the mission, but have not yet been appointed. LISA Pathfinder Designed to test technologies that could be used for a future gravitational wave observatory mission, the LISA pathfinder is scheduled for launch in 2015 and is a joint mission between ESA and NASA. Airbus Defence and Space is the spacecraft’s main contractor with SCISYS UK developing the satellite’s on‐board software. University of Birmingham, University of Glasgow and Imperial College London are collaborating on the mission’s technology package. The mission is the first ESA science spacecraft to be led from the UK since Giotto was completed in 1992. Planck Between 2009 and 2013, the Planck mission helped scientist study the state of the Universe just after the time of the Big Bang. UK research institutes played key roles in the development of Planck, with the Jodrell Bank Observatory at The University of Manchester producing critical elements of the low frequency microwave (LFI) receiver modules and contributing to the LFI data processing activities. Cardiff University, STFC RAL and SEA were involved with hardware development for the high frequency microwave detector (HFI), while various UK research groups including Imperial College London and University of Cambridge form the London Planck Analysis Centre and Cambridge Planck Analysis Centre respectively. Solar Orbiter Due to be launched in 2017, ESA’s Solar Orbiter mission will travel closer to the sun than any previous mission. Airbus Defence and Space have been awarded a contract worth €300 million as prime contractor on the mission, and will lead a team of European and UK companies and research institutes. Four of the ten instruments on the orbiter have UK involvement with University College London, Imperial College London and Rutherford Appleton Laboratory playing key roles.
Credit: ESA
Credit: ESA
Credit: ESA
Credit: Airbus Defence and Space
Source: UK Space Agency website
The chart below shows public space investment as a proportion of UK space economy GVA over the period 2008/09 to 2012/13. In recent years, this share has been decreasing, as the growth of space economy GVA has been faster than the growth in space investment. However, it is not possible to infer any conclusions from this trend.
London Economics The Case for Space 2015 39
4 | Government engagement in the space economy
Figure 13 Space investment as share of space GVA 2008/09‐2012/13
Evaluation of the return on public investment in space requires detailed data that allows attribution of causal links between space investment and gross‐value added of the space economy. Such analysis would require a dedicated survey‐based approach that would ask respondents to identify the degree to which space investment has resulted in additional activity in the industry, driving GVA contribution. No such study has been undertaken for the
UK space economy, but BIS, 2010, discusses the activity of evaluations in the first decade of the 21st century starting in 2001. All studies have concluded that it would be appropriate for the UK to develop infrastructure for the global space economy and sponsor pioneering services. The UK Space Agency as an overarching coordinator of investment within a rational and strategic structure is a consequence of these studies.
Source: London Economics analysis of Size and Health data and further identified organisations (please see A2.2.1 for more details)
0.0%
1.0%
2.0%
3.0%
4.0%
5.0%
6.0%
7.0%
8.0%
£0
£1,000
£2,000
£3,000
£4,000
£5,000
£6,000
2008/09 2009/10 2010/11 2011/12 2012/13
Millions
Space investment Space GVA Investment as share of GVA
4.2.3 International comparisons of government space budgets
The chart below shows the space budget in millions of current US$ and as a proportion of national GDP for selected OECD countries and other space‐faring nations.
As may be expected, the US is leading the way on public funding of space activities within the OECD, with 76% of total public OECD space budget originating in the US. France, Germany and Italy account for 11% with Japan contributing 7% and UK and Canada less than 1% each.
The UK is in the bottom third in terms of space budget as a proportion of GDP at an estimated value 0.0145% in 2013. All else equal, the estimate of the space budget in 2014 as a share of GDP would elevate the UK by three places and out of the bottom third.
Figure 14 Space budget (US$m) and share (%) of GDP, OECD and selected countries, 2013
Source: OECD, The Space Economy at a Glance, 2014
0.25
0.23
0.10
0.07
0.07
0.06
0.06
0.05
0.05
0.03
0.03
0.03
0.03
0.03
0.03
0.03
0.03
0.02
0.02
0.02
0.02
0.02
0.02
0.01
0.01
0.01
0.01
0.01
0.01
0.01
0.01
0.01
0.01
0
0.05
0.1
0.15
0.2
0.25
0.3
0
5,000
10,000
15,000
20,000
25,000
30,000
35,000
40,000
45,000
Russia
USA
France
Japan
China
India
Italy
Begium
Germany
Israel
Luxembo
urg
Switzerland
Swed
en
Argen
tina
Norway
Canada
Finland
Korea, Sou
th
Spain
Austria
Estonia
Den
mark
Nethe
rlands UK
Ireland
Portugal
South Africa
Greece
Poland
Czech Re
public
Brazil
Turkey
Indo
nesia
Percen
tage
of GDP
Value
(US$
million)
Value (US$ million) Percentage of GDP (right axis)
40 London Economics
The Case for Space 2015
5 | Economic impact of the UK space economy: Direct, indirect and induced effects
5 Economic impact of the UK space economy: Direct, indirect and induced effects
“The UK space sector is an engine of growth for the UK, growing at over 7% per year with over 5,000 jobs created in the last two years. Space is increasingly playing a vital role in our everyday lives and through this new programme the Government will harness the potential of space and integrate it into its day to day business to help save money, innovate and make more effective decisions.”32
Former Minister for Universities, Science and Cities, Greg Clark
5.1 Typology of impacts
This report considers a wide array of impacts of the space economy in the UK. We consider three quantifiable parameters of economic impact, namely: value‐added, employment, and productivity.
The direct, indirect and induced effects of space manufacturing, space operations, space applications, and ancillary services (approximating what has previously been referred to as the ‘space industry’) are estimated in this section, whilst the catalytic effects of space technology and applications on users and non‐users is addressed in Sections 6 through 9.
Figure 15 Economic effects mapped to space economy value chain: Focus on direct, indirect and induced effects
Source: London Economics
Space manufacturing Space operations Space applications Users
Launch vehicles and systemsLaunch provision and brokerage
Financial and legal servicesInsurance and brokerage
servicesConsultancy and applied
researchR&D and knowledge spillovers
Externalities
Ancillary services
Other support products and services
More efficient public sector services
Catalytic effects Direct, indirect and induced effects
This chapter focuses on the impacts that have been quantified based on the database of UK space organisations that was created for The Size and Health of the UK Space Industry 2014, and expanded in the context of this report.
32 UK Space Agency (16/01/2015) ‘Boosting public services with satellites ‐ UK Space Agency brings satellite tools to Government departments.’ Available at: https://www.gov.uk/government/news/boosting‐public‐services‐with‐satellites (accessed 30 January 2015).
5 | Economic impact of the UK space economy: Direct, indirect and induced effects
Productivity follows straightforwardly from estimates of GVA and employment in the space economy, so this section will focus on the treatment and derivation of GVA and employment. Firstly, though, we distinguish between gross and net analysis. In summary: Though this report makes considerations to give perspective towards a net analysis, the impact analysis presented in this report is gross.33
5.2 Value‐Added
A key impact of any sector, region, or firm on a country’s economy is its contribution to the Gross Domestic Product (GDP) of the country. Gross Value‐Added (GVA) is the measure of GDP contribution at a micro level of analysis.
All results presented in these sections rely on the data gathered for the Size and Health of the UK Space Industry 2014 and additional space applications companies that have been identified in the during the preparation of this report; please see A2.2.1 for more details on the methodology.
5.2.1 Direct effect
In direct terms, the UK space economy contributes £5.1 billion to UK GDP, equivalent to 43.4% of turnover. The remaining turnover is spent on intermediate inputs and capital stock to enable manufacturing. GVA can be interpreted as a compound of profits, salaries paid and the taxes levied on both items.
Table 22 Direct Gross Value‐Added of the UK space economy, 2007/08 ‐ 2012/13
Year £m,
current prices
£m, 2012/13 prices
Real growth
2007/08 3,152 3,706 ‐
2008/09 3,637 4,121 11.2%
2009/10 3,789 4,199 1.9%
2010/11 4,130 4,422 5.3%
2011/12 4,705 4,829 9.2%
2012/13 5,147 5,147 6.6%
Note: 2011/12 and 2012/13 include additional space applications companies. Source: London Economics analysis.
3,70
6
4,12
1
4,19
9
4,42
2
4,82
9
5,14
7
0
1,000
2,000
3,000
4,000
5,000
6,000
2007/08
2008/09
2009/10
2010/11
2011/12
2012/13
Contribu
tion
to GDP, £m
As was the case for turnover, the majority of UK space GVA is generated in the space applications segment with 75%, just less than the 78% of turnover accounted for by the segment. At 15% space operations accounts for a larger share of GDP than turnover (12%). At 6%, space manufacturing accounts for a lower share of GVA than turnover (8%), this can be explained by the capital intensity of the segment and consequent higher expenditure to service the capital stock. GVA as a share of turnover in space manufacturing is 33.7%. Conversely, ancillary services contribute 80.9% of turnover to GVA and the segment contributes 4% of space economy GVA (compared to 2% of turnover).
33 Please see A2.3.1 for a discussion of ‘Gross’ versus ‘Net’ impacts in general and in the context of this report.
42 London Economics
The Case for Space 2015
5 | Economic impact of the UK space economy: Direct, indirect and induced effects
Table 23 Direct Gross Value‐Added of the UK space economy by segment, 2012/13
Segment
2012/13
£m Space manufacturing 306
Space operations 785 Space applications 3,866Ancillary services 191
Total 5,147 Source: London Economics analysis.
Space applications
75%
Space operations
15%
Space manufacturing
6%
Ancillary services
4%
Digging further into the constituent components of the space economy and assessing GVA at the sub‐segment level reveals that the majority of GVA in space manufacturing is generated in the manufacture of satellites/payload/spacecraft (57%). Research and consultancy contributes 24% of segment GVA, which compares favourably with the 18% of turnover that is raised in the sub‐segment. Research and consultancy differs from the other sub‐segments by being much more labour intense. The capital intense sub‐segments contribute a lower proportion of GVA than they did for turnover.
Table 24 Gross Value Added of UK space manufacturing by sub‐segment, 2012/13
Satellites/ payloads/ spacecraft
57%
Research and Consultancy
24%
Ground segment
systems and equipment
13%
Launch vehicles4%
Undefined2%
Sub‐segment
2012/13
£m Launch vehicles 13
Satellites/payloads/ spacecraft 175
Ground segment systems and equipment 38
Research and Consultancy 74 Undefined 6Total 306
Source: London Economics analysis.
Space operations is dominated by two large sub‐segments. Proprietary satellite operation is the largest sub‐segment at 68% of GVA, with third‐party ground segment operation accounting for 32% and launch provision and brokerage services making up the rest (~0.4%). The relative size of the two largest sub‐segments in terms of GVA contribution compared with turnover shows that ground segment operation contributes a greater share of turnover (61%) than satellite operation (51%).
London Economics The Case for Space 2015 43
5 | Economic impact of the UK space economy: Direct, indirect and induced effects
Table 25 Gross Value Added of UK space operations by sub‐segment, 2012/13
Sub‐segment
2012/13
£m Launch provision and brokerage services 3 Proprietary satellite operation (incl. sale/lease of capacity)
Space applications is the space economy’s key contributor to GDP and Direct‐To‐Home (DTH) provision of television services accounts for 57% of the segment’s GVA (and 43% of total space economy GVA). DTH provision in the UK is dominated by BSkyB whose key selling points are the content they provide. As a result, costs to provide content (Premier League prize money and programme production costs) means the space economy sub‐segment contributes 36.5% of turnover to GVA. At twice this rate, value‐added services provision has the highest GVA intensity in the sub‐segment (73.1%), and contributes 15%.
Table 26 Gross Value Added of UK space applications by sub‐segment, 2012/13
Sub‐segment
2012/13
£m Direct‐To‐Home (DTH) provision 2,220
User equipment supply 965 Very Small Aperture Terminal (VSAT) network provision
Very Small Aperture Terminal (VSAT) network provision
2%
Undefined1%
Ancillary services is the segment that register the highest GVA to turnover ratio of the space economy with Insurance and brokerage services approaching 100%. Consultancy and applied research also returns a large share of turnover as GVA. The two largest sub‐segments account for 88% of segment GVA (50% and 38%, respectively) with other support products and services accounting for 11% of GVA.
44 London Economics
The Case for Space 2015
5 | Economic impact of the UK space economy: Direct, indirect and induced effects
Table 27 Gross Value Added of UK ancillary services by sub‐segment, 2012/13
Insurance and brokerage services50%
Consultancy and applied research38%
Other support products and
services11%
Financial and legal services
0%
Undefined1%
Sub‐segment
2012/13
£mFinancial and legal services 0
Insurance and brokerage services 96
Consultancy and applied research 71
Other support products and services 21
Undefined 2
Total 191 Note: Financial and legal services is greater than 0, but too small to register units in millions. Source: London Economics analysis.
Comparison to UK total
Space economy GVA has increased at positive rates vastly superior to the growth in overall GDP at an average annual rate of 6.8% since the financial year 2007/08.
The UK space economy accounts for an increasingly larger share of UK GDP, estimated to be 0.311% in 2012/13. Since 2007/08, space has increased its share of UK GDP by 50%, suggesting strong performance in space.
Table 28 Direct Gross Value‐Added of the UK space economy as a share of UK GDP, 2007/08 – 2012/13
Year
Space GVA GDP
% 2012‐13 prices, £m
Current prices, £m
2012‐13 prices, £m
2007/08 3,706 1,480,956 1,741,219 0.213%
2008/09 4,121 1,518,675 1,720,756 0.239%
2009/10 4,199 1,482,144 1,642,663 0.256%
2010/11 4,422 1,558,365 1,668,642 0.265%
2011/12 4,829 1,617,677 1,660,477 0.291%
2012/13 5,147 1,655,384 1,655,384 0.311%
0.213%
0.239%
0.256%
0.265%
0.291%
0.311%
0.15%
0.20%
0.25%
0.30%
0.35%
2007/08 2008/09 2009/10 2010/11 2011/12 2012/13
Dire
ct GVA as % of G
DP
Note: GDP values based on calendar years and converted into constant prices using CPI as calculated per financial year. 2011/12 and 2012/13 include additional space applications companies. Source: London Economics analysis and ONS 'Key economic time series data. Gross Domestic Product (GDP).
When compared only to GVA of non‐financial services, the UK space economy accounts for 0.51% of total GDP, 53% more than its share of turnover. In the UK economy excluding financial services GVA contribution as a proportion of turnover is 28.5%, about two‐thirds of the space economy’s 43.4%.
Regional distribution
Attributing GVA contribution of each firm to its region of headquarters, we derive that 67% of space economy GVA is generated in London, with the East of England and the South East following at 12% and 10%, respectively. In comparison to turnover by region, where London accounted for
London Economics The Case for Space 2015 45
5 | Economic impact of the UK space economy: Direct, indirect and induced effects
72%, it follows that London as a region has a lower share of GVA to turnover than some other regions. The South West does not feature on the map for turnover (4.8% of total turnover), but accounts for 7% of GVA, indicating the South West is home to few, high‐value organisations.
5.2.2 Economic multiplier effects
The space economy’s contribution to GVA runs through indirect and induced channels as well as the direct effects that have been the focus of this chapter so far. The Type II GVA multiplier for the space economy has been computed based on ONS analytical input‐output tables for 2010, and estimated to be 2.2 at the national level. This implies that each £1’s worth of space economy GVA generates £1.20 worth of GVA in the supply chain and supporting sectors.34
The estimated total contribution of the UK space economy including indirect and induced effects is therefore estimated to be £11.3bn.
Figure 16 Total GVA contribution of the UK space economy, 2012/13
££££££££££££ Direct GVA: £5.1bn; Indirect + Induced GVA: £6.2bn; Total GVA: £11.3bn
Source: Source: London Economics analysis and ONS, UK I‐O Analytical Tables. More details on input‐output analysis can be found in A2.3.2.
In addition to the national level multiplier analysis it is possible to analyse indirect and induced impacts at the regional level. The resulting multiplier estimates differ from the national level analysis if the space economy has a different regional concentration than the average of its constituent sectors. It is found that space economy GVA is indeed more concentrated in London, where productivity is generally found to exceed productivity in the rest of the country. Using the regional level analysis, we find an induced effects multiplier of 3.0, which implies that the space economy has a more productive distribution than the national average of its constituent sectors.
Figure 17 Total GVA by region and channel of impact, 2012/13
Source: London Economics analysis and ONS, UK I‐O Analytical Tables. More details on input‐output analysis can be found in A2.3.2.
0
1,000
2,000
3,000
4,000
5,000
6,000
7,000
Lond
on
South East
East of England
South West
North W
est
Scotland
Yorkshire & th
e Hum
ber
West M
idland
s
East M
idland
s
Wales
North East
Northern Ireland
Direct Indirect Induced
The figure shows GVA by region and channel of impact, and shows that while London, South East, East of England and South West generate 96% of direct UK space economy GVA, less than 60% of the indirect and induced35 GVA are generated in those regions. This implies that all UK regions benefit from the flow of economic activity from the space economy to supplying and supporting sectors.
34 For more details on the theory and implementation of multiplier analysis in the context of the present report, please see A2.3.2. 35 For more details on the theory and implementation of multiplier analysis in the context of the present report, please see A2.3.2.
46 London Economics
The Case for Space 2015
5 | Economic impact of the UK space economy: Direct, indirect and induced effects
5.3 Employment
Employment is another key measure of impact on an economy and the number of people employed by a sector or industry gives an indication of the economic importance of the sector.
BSKYB is the largest single employer in the space economy, estimated to account for 47% of space economy employment and 69.9% of employment in the space applications segment.
5.3.1 Direct effect
The figure below presents space employment since the turn of the century. The UK space economy directly employed approximately 37,000 employees in 2012/13. Employment has grown strongly throughout the period at a compound annual growth rate of 7.4% (and 8.4% in the last five years).
Table 29 Direct employment supported by the UK space economy, 1999/00 – 2012/13
Year #employees % growth
1999/00 14,651 ‐
2000/01 15,256 4.1%
2001/02 15,466 1.4%
2002/03 15,575 0.7%
2003/04 15,397 ‐1.1%
2004/05 16,241 5.5%
2005/06 17,206 5.9%
2006/07 18,873 9.7%
2007/08 22,789 20.7%
2008/09 24,887 9.2%
2009/10 28,995 16.5%
2010/11 28,942 ‐0.2%
2011/12 35,490 22.6%
2012/13 37,316 5.1%
14,651
15,256
15,466
15,575
15,397
16,241
17,206
18,873 22
,789
24,887 28
,995
28,942
35,490
37,316
0
5,000
10,000
15,000
20,000
25,000
30,000
35,000
40,000
45,00019
99/00
2000
/01
2001
/02
2002
/03
2003
/04
2004
/05
2005
/06
2006
/07
2007
/08
2008
/09
2009
/10
2010
/11
2011
/12
2012
/13
# of employee
s
Note: 2011/12 and 2012/13 include additional space applications companies and companies for which only employment but no turnover figures are available. Source: London Economics analysis.
Except for small contractions in 2003/04 and 2010/11, space economy employment has increased every year since 1999/00 and continued during the financial crisis. In more recent years a step change in employment occurred.36
Unsurprisingly, the dominance of space applications in terms of space economy turnover is also found for employment, with the segment accounting for 69% of space employment. Space manufacturing employs a greater number of staff than space operations (16% and 13%, respectively), with ancillary services making up a small but important work force.
36 Due, in part, to larger coverage of companies active in the UK space economy.
London Economics The Case for Space 2015 47
5 | Economic impact of the UK space economy: Direct, indirect and induced effects
Table 30 UK space economy employment by segment, 2012/13
Segment
2012/13
# of employees
Space manufacturing 5,761
Space operations 4,792
Space applications 25,59937
Ancillary services 696
Total 36,848 Note: The analysis excludes companies for which no turnover data were available. Source: London Economics analysis.
Space applications
69%
Space manufacturing
16%
Space operations
13%
Ancillary services2%
Manufacturing of satellites, payloads, and spacecraft employs the largest number of space manufacturing staff (58%), with primary research and consultancy accounting for about one‐in‐five. Ground segment and launch vehicles employ 18% between them.
Table 31 Employment from UK space manufacturing by sub‐segment, 2012/13
Segment
2012/13
# of employeesLaunch vehicles 305
Satellites/payloads/ spacecraft 3,401
Ground segment systems and equipment 746
Research and Consultancy 1,201
Undefined 109
Total 5,761 Source: London Economics analysis.
Satellites/ payloads/ spacecraft
59%
Research and Consultancy
21%
Ground segment systems and equipment
13%
Launch vehicles5%
Undefined2%
Employment in the space operations sub‐segment is dominated by ground segment operation (78%), which accounts for 28% of turnover. Proprietary satellite operations employ 1,024 staff in the UK (21%) of segment employment generating 72% of segment turnover.
37 Even excluding BSKYB’s employment, Space Applications remains the largest segment.
48 London Economics
The Case for Space 2015
5 | Economic impact of the UK space economy: Direct, indirect and induced effects
Table 32 Employment from UK space operations by sub‐segment, 2012/13
Segment
2012/13
# of employeesLaunch provision and brokerage services 32 Proprietary satellite operation (incl. sale/lease of capacity)
1,024
Third‐party ground segment operation 3,736
Undefined 0
Total 4,792 Source: London Economics analysis
Third‐party ground segment
operation78%
Proprietary satellite
operation (incl. sale/lease of capacity)21%
Launch provision and brokerage
services1%
The largest sub‐segment is Direct‐To‐Home satellite television provision, which is also the largest single sub‐segment in the space economy accounting for 43.9% of total employment. The second largest sub‐segment in space applications, user equipment supply (21%), has the same position in the overall ranking of the space economy’s sub‐segments. Value‐added services provision employs 14% of segment staff.
Table 33 Employment from UK space applications by sub‐segment, 2012/13
Segment
2012/13
# of employeesDirect‐To‐Home (DTH) provision 16,184
User equipment supply 5,246 Very Small Aperture Terminal (VSAT) network provision
300
Value‐added services provision 3,695
Undefined 174
Total 25,599 Source: London Economics analysis.
Direct‐To‐Home (DTH) provision
63%
User equipment supply21%
Value‐added services provision
14%
Very Small Aperture
Terminal (VSAT) network provision
1%
Undefined1%
The largest employment figure in ancillary services is found in consultancy and applied research, which employs 73% of segment staff. The 42 employees (6%) in insurance and brokerage generate a large proportion of sub‐segment turnover (41%) and GVA (50%). Other support products and services such as IT systems employs136 of the segment’s staff (20%).
London Economics The Case for Space 2015 49
5 | Economic impact of the UK space economy: Direct, indirect and induced effects
Table 34 Employment from UK ancillary services by sub‐segment, 2012/13
Segment
2012/13
# of employeesFinancial and legal services 3 Insurance and brokerage services 42 Consultancy and applied research 508 Other support products and services 136 Undefined 8
Total 696 Source: London Economics analysis.
Consultancy and applied research
73%
Other support products and services20%
Insurance and brokerage services6%
Financial and legal services
0%
Undefined1%
Comparison to the global space economy
Comparisons of UK space employment with other countries and the global space employment are hampered by the difficulty surrounding the definition of the space economy. The OECD restricts estimates of space employment to the space manufacturing segment. This section therefore compares UK space employment in space manufacturing with international estimates of the same value chain segment.
OECD reports European space employment of 35,500 full time equivalents in 2013, increased from about 35,100 in 2011. The estimate of employment in the UK space manufacturing segment is 5,761 in 2012/13. As a proportion of European space employment, the UK therefore accounts for about 16.2%.
Worldwide, OECD estimates 240,500 employees in space manufacturing implying the UK space manufacturing segment accounts for 2.4% of known space manufacturing employment. Assuming Indian employment is in the order of 50,000 FTEs, the estimate is revised to 2.0%. As described on page 17, the UK space manufacturing segment accounts for 1.8% of world turnover.
Table 35 World employment in space manufacturing
Country/region Full‐time equivalents (2013 or latest year) Europe 35,500US 89,000China 100,000Japan 8,000Canada 8,000India Unknown – (50,000 assumed) Total 240,500 – (290,500)
Source: OECD, the Space Economy at a Glance 2014
The Space Report38 presents a different type of space employment, with US figures including many more activities than space manufacturing such as satellite communications and ‘Search, Detection, and Navigation Instruments’, which clearly includes space applications firms, but also firms outside the space economy. The total estimated US space employment is 261,433 including NASA.
38 Space Foundation (2014) The Space Report
50 London Economics
The Case for Space 2015
5 | Economic impact of the UK space economy: Direct, indirect and induced effects
The Space Report estimates an employment figure in the order of 303,252 (covering US core employment, Europe space manufacturing, Japan and 21 space agencies). Based on the difference between core US employment and space manufacturing provided by OECD, we estimate a total worldwide space employment across the value chain of 890,797 FTEs.
The total UK space employment accounts for 4.1% of this estimated space employment. The estimate is inherently uncertain given the limited coverage of countries and activities.
Comparison to UK total
The proportion of UK workforce employed by space companies has increased steadily since 2009/10, when just less than 0.1% of UK employees worked in the space economy. In 2012/13, the space economy employed 0.125% of the UK workforce.
Table 36 Direct employment supported by the UK space economy as a share of the total UK workforce, 2009/10 – 2012/13
Year UK space economy UK economy
% # of employees # of employees
2009/10 28,995 29,070,629 0.0997%
2010/11 28,942 29,325,072 0.0987%
2011/12 35,490 29,362,864 0.1209%
2012/13 37,316 29,779,198 0.1253% Note: 2011/12 and 2012/13 include additional space applications companies. Source: Source: London Economics analysis and ONS Labour market statistics summary data tables, 18th February 2015.
5.3.2 Regional distribution
Compared with turnover, the regional distribution of space employment is much more even.39 London and the South East employ the most staff and account for more than half of all employees combined. However, 80% of turnover is generated by companies in those two regions, and the results show that large UK space organisations have subsidiaries in multiple regions.
Scotland in particular stands out as having a much larger share of employment (15%) than its share of turnover (1%), showing that many UK companies that are headquartered elsewhere have strong presence in Scotland and other regions.
39 The survey for the 2014 Size and Health of the UK Space Industry included a question that asked respondents to split their space employment by UK region in order to allow a more accurate picture to be painted.
London Economics The Case for Space 2015 51
5 | Economic impact of the UK space economy: Direct, indirect and induced effects
Figure 18 Regional distribution of UK space economy employment – shares and values (2012/13)
Note: A further 152 employees have not been possible to attribute to a single UK region. Source: London Economics analysis.
London29%
South East25%
Scotland15%
South West9%
East of England7% North East
6%
Yorkshire and the Humber
5%
Other4%
2,424
548 2,078
507146 2,496
9,8279,340
3,289
256
5,709
75
In absolute numbers and as a proportion of the space economy itself, London and the South East account for most space employment.
However, the picture changes when the analysis turns to the proportion of employees in a region that is employed by a space organisation. In the UK as a whole, 0.15% of employees are employed by space organisations, but in South East (0.29%), Scotland (0.29%), London (0.26%), and North East (0.25%), this proportion is much higher.
Table 37 Space employment intensity
Region Space as share of
employment in work places in region
East Midlands 0.030% West Midlands 0.007% North West 0.020% North East 0.252% Scotland 0.286% Wales 0.024% East of England 0.118% South East 0.291% South West 0.164% London 0.264% Northern Ireland 0.013% Yorkshire and the Humber
0.102%
Total 0.151% Note: Off‐shore work places not considered. Source: London Economics analysis.
0.252%
0.020% 0.102%
0.03%0.007%
0.118%
0.264%0.291%
0.164%
0.024%
0.286%
0.013%
Regional specialisation emerges considering employment by value chain segment. The East of England, for example, has a large share of employment in space manufacturing, while London
52 London Economics
The Case for Space 2015
5 | Economic impact of the UK space economy: Direct, indirect and induced effects
accounts for a large share of space operations. BSKYB’s call centre in Scotland is a contributing factor to Scotland’s strong concentration of regional employment in space applications.
Table 38 UK space economy employment by region and segment, 2012/13
Region Space
manufacturingSpace
operations Space
applications Ancillary services
Total
# of employees # of employees # of employees # of employees # of employeesEast Midlands 151 4 265 87 507West Midlands 86 3 50 7 146North West 111 103 333 0 548North East 46 15 2,363 0 2,424Scotland 217 179 5,313 1 5,709Wales 163 0 93 0 256East of England 1,219 196 1,080 1 2,496South East 3,464 2,866 2,782 228 9,340South West 253 178 2,759 99 3,289London 35 1,248 8,272 272 9,827Northern Ireland 0 0 74 0 75Yorkshire and the Humber 15 0 2,063 0 2,078Total 5,761 4,792 25,447 696 36,696
Note: A further 152 employees have not been possible to attribute to a single UK region. Source: London Economics analysis.
The South East has a large proportion of employment in space manufacturing, operations and ancillary services, but 11% of applications. London’s employment is concentrated outside space manufacturing and is the largest region for employment of applications and ancillary services.
Figure 19 UK space economy employment by region and segment, 2012/13
Source: London Economics analysis.
South East60%
East of England21%
South West4% Scotland
4%
Wales3% East
Midlands3%
Other5%
South East60%
London26%
East of England4%
Scotland4%
South West4%
North West2%
Other0%
London33%
Scotland21%
South East11%
South West11%
North East9%
Yorkshire and the Humber
8%
Other7%
London39%
South East33%
South West14%
East Midlands13%
West Midlands1%
East of England0%
Scotland0%
Space op
erations
Space manufacturing
Ancillary services
Space applications
London Economics The Case for Space 2015 53
5 | Economic impact of the UK space economy: Direct, indirect and induced effects
5.3.3 Economic multiplier effects
The space economy’s contribution to employment runs through indirect and induced channels as well as the direct effects that have been the focus of this chapter so far. The Type II employment multiplier for the space economy has been computed based on ONS input‐output analytical tables for 2010, and estimated to be 3.1.40 This implies that each employee in space economy demands inputs that support 2.1 employees in the supply chain and supporting sectors.
The estimated total employment supported by the UK space economy including indirect and induced effects is therefore estimated to be more than 115,000 jobs.
This section has demonstrated that the location of a company’s headquarters is not always the most appropriate region to consider for economic impacts. Instead, the regional distribution of direct employment presents a markedly different image of the reach of the space economy than turnover or GVA alone.
Figure 19 Total employment supported by the UK space economy, 2012/13
Source: London Economics analysis and ONS UK I‐O analytical tables.
37,31678,364
To understand the interactions between regions and supply chain and supporting sectors, regional input‐output analysis was undertaken as presented in the figure below.
Figure 20 Total employment supported by the UK space economy by region, 2012/13
Source: Source: London Economics analysis and ONS UK I‐O analytical tables
0
Lond
on
South East
Scotland
South West
East of England
Yorkshire & th
e Hum
ber
North W
est
East M
idland
s
West M
idland
s
North East
Wales
Northern Ireland
5,000
10,000
15,000
20,000
25,000
30,000
Direct Indirect Induced
The figure shows high levels of space‐related employees in all regions, and importantly shows large differences in the composition of space‐related employment. Approximately 40% of space‐related employment in Scotland, South East, North East, and London are directly employed in the space economy while the same is true of less than 3% in West Midlands and Northern Ireland. Similar to the regional breakdown of GVA, we find that indirect and induced channels ensure the space economy impacts all regions of the UK.
40 For more details on the theory and implementation of multiplier analysis in the context of the present report, please see A2.3.2.
54 London Economics
The Case for Space 2015
5 | Economic impact of the UK space economy: Direct, indirect and induced effects
5.4 Productivity
The direct GVA of the UK space economy is £5,147bn, roughly equivalent to 0.51% of UK GDP from the non‐financial sectors covered by the ONS annual business survey (see section 5.2.1). The space economy generates 0.33% of turnover (see section 3.1) among the same sectors indicating space contributes about 50% more of its turnover to GDP than the average in the economy.
One explanation for the higher GVA to output ratio in the space economy could be that its productivity level, defined as GVA per employee, is higher than the rest of the economy. On the face of it, the presentation of the skills in the space economy compared with other sectors (section 3.3) suggests a much higher level of educational attainment in space compared with the rest of the economy, which may explain the difference. This section investigates productivity in more detail and identifies key sub‐segments of the space economy that are particularly productive.
The table below shows the labour productivity in the space economy and shows ancillary services generating the greatest GVA per employee followed by space operations and space applications. Space manufacturing differs from the other segments insofar as propensity to import intermediate goods is higher than for the segments further downstream. Higher import shares imply lower value added in the segment and thus lower labour productivity.
Table 39 Labour productivity (GVA/employee) by segment and subsector, 2012/13
Segment / Sub‐segment £000, 2012/13 prices
Space manufacturing 53
Launch vehicles 42
Satellites/payloads/spacecraft 51
Ground segment systems and equipment 51
Research and Consultancy 62
Space operations 164
Launch provision and brokerage services 101
Proprietary satellite operation (incl. sale/lease of capacity) 520
Third‐party ground segment operation 67
Space applications 151
Direct‐To‐Home (DTH) provision 137
User equipment supply 184
Very Small Aperture Terminal (VSAT) network provision 312
Value‐added services provision 154
Ancillary services 274
Financial and legal services 6
Insurance and brokerage services 2,298
Consultancy and applied research 141
Other support products and services 156
Space Economy weighted average 140 Note: Some companies have not been possible to classify into precise sub‐segments. Source: London Economics analysis.
London Economics The Case for Space 2015 55
5 | Economic impact of the UK space economy: Direct, indirect and induced effects
5.4.1 Comparison to the global space economy
International publications of the space economy do not present gross value‐added of the sector, which prohibits a detailed comparison of labour productivity. However, OECD, Space Foundation and Eurospace all offer estimates of employment and turnover, so for this comparison, we derive the turnover per employee in the UK space economy to create a level comparison.
Average turnover per employee in the UK space economy is estimated to be £317,518 with the global figure calculated based on the Space Foundation’s estimate of turnover divided by employment (please see sections 3.1.1 and 5.3.1) at £213,292 and Eurospace’s European number derived to be £141,912. The OECD has much lower coverage of its estimate of employment than turnover and estimate £534,488 turnover per employee.
Given the vastly different coverage and confidence in the numbers across the different comparators and the present report, the result should be interpreted with caution, but does suggest that UK space employees are more productive than the average.
5.4.2 Comparison to other UK sectors
Based on the ONS Annual Business Survey, which covers all UK sectors except financial services, the figure below shows the labour productivity of the space economy and its four segments compared with 17 standard industries in the UK and the UK average. All space segments have a higher labour productivity than the UK average. The space economy average is more than three times higher than the UK average, and ancillary services has the second highest labour productivity behind only the very capital intensive mining and quarrying sector.
Bearing in mind the comparison of skills and qualification (please see Figure 8 for the details), space operations has the largest discrepancy between its place in the skills ranking and productivity (although the difference in sample is likely to explain some of the difference).
Figure 21 Labour productivity by sector
Note: Financial services are not covered by the Annual Business Survey. Non‐space sectors estimated as approximate GVA divided by average annual employment. Source: London Economics analysis and ONS Annual Business Survey 2013.
380
274
192
164
151
140
102
89
68 63 63 61 59 53 46 44 42 34 32 28 19 18 14
0
50
100
150
200
250
300
350
400
Mining and qu
arrying
Space ancillary services
Electricity, gas, steam
and
air
cond
ition
ing supp
ly
Space op
erations
Space applications
Space econ
omy
Water su
pply, sew
erage, waste
managem
ent
Inform
ation and commun
ication
Real estate activities
Manufacturin
g
Profession
al, scien
tific and
technical
activities
Constructio
n
Transport and
storage
Space manufacturin
g
UK Total (exclud
ing fin
ancial services)
Agriculture, forestry and fishing
Adm
inistrative and supp
ort service
activities
Arts, entertainmen
t and
recreatio
n
Who
lesale and
retail trade; repair of
motor veh
icles
Other se
rvice activities
Accom
mod
ation and food
service
activities
Hum
an health
and
social w
ork activities
Education
Labo
ur produ
ctivity (£00
0) per employee
56 London Economics
The Case for Space 2015
5 | Economic impact of the UK space economy: Direct, indirect and induced effects
BIS, 2010 argues that higher labour productivity in the space economy is related to the skills level of employees, a long development process which requires high returns to offset the opportunity costs of the investment and a fierce business environment, which means companies that make it go on to obtain strong market positions that allow them to charge prices above marginal costs.
5.5 Foreign Direct Investment (FDI)
The OECD defines FDI as “cross‐border investment by a resident entity in one economy with the objective of obtaining a lasting interest in an enterprise resident in another economy”.41
There are two main forms of FDI: greenfield incorporation of a (subsidiary) company in a foreign country and brownfield takeover of a foreign firm through Mergers and Acquisitions (M&A).
Theoretical impacts of FDI42
Inward FDI affects overall productivity, employment and wages in the UK space economy in the short run. Beneficial productivity spillovers to indigenous firms can occur, but the likelihood thereof depends crucially on the nature of the inward investment and on the linkages made with domestic firms. Linkages depend on the capabilities of indigenous firms to absorb beneficial knowledge or technology spillovers. Inward FDI is associated with greater employment among skilled and has a positive impact on workers in domestically‐owned establishments. Nonetheless, wage spillovers are largely confined to skilled workers, rather than unskilled workers, implying that the benefits of FDI are unevenly distributed.
The effect of brownfield FDI on labour productivity, as used in this report, a positive effect of M&A activity is found. However, when using the more comprehensive (and data intensive) total factor productivity‐definition, there appears to be no effect. In combination, the two results suggest that acquired companies tend to shift their modus of production away from labour and into capital or input intense systems (e.g. purchasing intermediate inputs from the foreign parent).
The net effect of FDI in the long run is more ambiguous than the short term effects as competition between the foreign‐ and domestic‐owned entities may displace indigenous organisations. The links that are formed between the foreign‐owned firm and the UK industry affect the net effect as FDI firms that integrate with the UK supply chain and demand local goods will improve the local situation while FDI firms that import intermediate inputs from the home country of the parent could help make foreign firms more competitive and ultimately drive UK companies out of business. Finally, entrants into the UK space economy would increase competition of funding options, which could improve the offerings of the space economy as a whole, but may also be detrimental for indigenous firms.
Current situation
Analysis of the companies in the UK space economy (details can be found in A2.4.2) shows that 96 firms in the UK space economy are foreign‐owned. North American and European firms hold the majority of entities with North American‐owned firms having the largest amount of assets, but European firms generating the majority of turnover and employment. The main company owned by entities in Asia‐Pacific is Arqiva, a large telecoms operator, with an Australian parent company.
41 OECD Factbook 2013: Economic, Environmental and Social Statistics, available here: http://www.oecd‐ilibrary.org/sites/factbook‐2013‐en/04/02/01/index.html?itemId=/content/chapter/factbook‐2013‐34‐en 42 Please see a full list of references underlying this section in A2.4.1.
5 | Economic impact of the UK space economy: Direct, indirect and induced effects
What attracts FDI to the UK?
The quote on the right shows an example of industry’s perception of the UK government’s initiatives designed to attract and retain foreign investment.
“In the UK, we continue to benefit from the initiatives of the British government to increase
investment in space. Their proactive approach to creating international partner‐ships with the
intention of increasing exports related to earth observation, remote sensing, and small
satellites, will help ensure that the UK grows into a space industry leader.”
Michael Pley, CEO COM DEV International, Annual Report 2013
The financial support environment in the UK is strong and available funding perceived to be plentiful. UK investment in ESA also attracts foreign companies as they are able to benefit from the optional programme funding made available. Harwell’s incubator and ESA centres also attract foreign firms by creating an environment in which foreign firms choose to set up subsidiaries.
The strength of the existing UK space economy attracts international players as they see a potential for knowledge spillovers.
Historical developments of FDI
The 2014 Size and Health of the UK Space Industry invited 96 foreign‐owned companies deemed to be active in the core space economy to participate in the survey. Based on official accounts, it was found that UK activities of foreign‐held space firms43 employed a total of 28,366 people in 2012/13 and turned over a total of £7.0 billion. As a point of comparison, the same official accounts show total turnover of £75.5 billion and 399,506 employees in the space firms.44
The figures below show the developments over time in terms of FDI events (defined as greenfield incorporation of subsidiaries or M&A activity) for all the foreign firms present in the analysis. In addition, recent events are broken down by type.
Figure 22 FDI events by decade Figure 23 FDI events by type
Note: The Zephyr database of M&A deals only started in 2000, so the split between types of M&A is not available for earlier years. Please also note that the database of space companies was compiled in Spring of 2014 and therefore has limited coverage of companies formed in 2014‐15. Please also keep in mind that FDI activity reported in the charts is based on companies that are currently active in the space economy and therefore likely underestimates FDI activity in earlier years (i.e. if the company has ceased to trade in the space economy). In addition to the deals displayed on the right hand side panel below, we are aware of five M&A deals involving UK targets. Source: London Economics analysis and Bureau van Dijk’s Orbis and Zephyr databases.
43 Defined as companies deemed to active in the space economy and for which one foreign owner possesses at least 50.01% of the firm either directly or through indirect chains of ownership. 44 These figures differ from those presented in Section 3.1 because not all turnover is derived from space activities.
58 London Economics
The Case for Space 2015
5 | Economic impact of the UK space economy: Direct, indirect and induced effects
The figures clearly show that FDI activity in the UK space economy has risen in recent decades, even though the data does not yet reflect the effects of UK Government’s recent investment in space and consequent improved standing as FDI destination. In terms of FDI, there is reason to expect the UK will continue to be an attractive destination for foreign investment and is on the way to becoming the best place to do business in space.
The box below presents a wide range of foreign owned companies in the UK.
Box 8 Examples of FDI attracted to the UK space economy
Airbus Defence & Space The European Aerospace giant, Airbus, has a strong space presence in the UK with a substantial share of the UK space industry held by Airbus. Registered in the Netherlands, Airbus Group employed 144,000 staff and turned over €59 billion in the year to 31st December 2013. Airbus Defence and Space holds the space activity of the group is headquartered in Stevenage and has twelve locations in the UK, employing 2,200 staff and turning over £500 million in the year to 31st December 2013.
COM DEV Intl. Ltd. Canadian company COM DEV International Ltd. is a global designer and manufacturer of space and ground based hardware and systems. It employs over 1,200 employees at facilities across Canada, the United Kingdom and the United States. The company has been supplying the space industry since 1974, and has been active in the UK through a subsidiary since 1984, adding the acquisition of MESL Microwave in December 2014. In 2013, Com Dev’s two UK subsidiaries generated turnover of £26 million in the UK, employing 177 staff.
Deimos Space UK Ltd. Spanish Elecnor Deimos specialises in engineering solutions in the aerospace, information systems and telecommunications sectors. Its main business areas are remote sensing, aerospace and defence systems, air and maritime navigation, satellite systems. Deimos Space UK is a wholly owned subsidiary of Elecnor Deimos that was created in 2013 in order to address the UK market and located in Harwell, Oxford to be close to the UK Space Agency, ESA, RAL‐Space and the Satellite Applications Catapult and other space companies. After acquisition of Magellium UK (itself a subsidiary of a French firm), Deimos Space UK has 15 employees.
Eutelsat French satellite operator, Eutelsat, is active in the UK through its London‐based subsidiary. The most recent official information on the company refers to October 2014, and indicates that two employees are based in the UK.
Laser Light Global Limited UK On the 11th of November 2013 it was announced that Pegasus Holding (US) would set up a UK entity intended to become the parent company of its subsidiaries Laser Light Communication LLC and The Halo Center LLC, both Delaware registered US companies. The company is in the process of launching its All Optical Hybrid Satellite‐Terrestrial Network that will use laser in the optical spectrum to provide satellite communications capabilities rather than the traditional radiofrequencies. The service will become available in 2017.
Lockheed Martin On the 15th of July 2014, American space giant Lockheed Martin announced the intention to open a space technology office in Harwell. The declared objective of the new office is to be closer to the company’s UK supply chain, and accelerate growth and innovation in space in support of the UK Space Agency’s identified targets. Lockheed Martin Corporation already had strong UK presence, with headquarters in London, and more than 3,000 employees in 20 locations. The new office will focus purely on space, while the remit of the existing activity was much broader and included security and wider aerospace.
(continued overleaf)
London Economics The Case for Space 2015 59
5 | Economic impact of the UK space economy: Direct, indirect and induced effects
Rhea Group UK Ltd Opened in Harwell, Oxford in 2013, Belgium‐based space engineering consulting and software company Rhea’s UK subsidiary was established in order to build a strong presence in the UK and work with UK national programmes (such as the Satellite Applications Catapult), ESA and commercial customers and partners in the space hub in Harwell. As a recent start‐up, financial and employment information is not yet available.
Telespazio‐Vega The UK subsidiary of Telespazio SpA (Finmeccanica/Thales joint‐venture) Telespazio Vega has been active in the fields of consulting, software and space‐enabled service business for 35 years. Based in Luton, Bedfordshire the company employs around 100 staff with annual turnover in the region of £15 million.
Thales UK Thales UK has been in existence for over 40 years. The company employs 7,820 people across all business areas and multiple locations across the country. Through French parent company Thales’ joint‐venture with Italian Finmeccanica (Thales Alenia Space ‐ 67%/33%), acquisition of British Systems Engineering & Assessment Limited was completed in 2014 and added to the Thales’ UK activities.
Viasat UK Viasat is a leading global satellite, wireless and other digital communications provider (3,000 employees, $1.35bn turnover 2014), headquartered in the USA. The company has been active in the UK since 2010, following the acquisition of the data security engineering company Stonewood Group as a wholly‐owned subsidiary. Based in Wareham (65 employees, £10m revenue), it provides data security and communications systems to the Ministry of Defence, central and local government, and commercial organisations in the UK and other European regions. A second office is planned for Farnborough in the near future.
Source: London Economics based on secondary research and stakeholder interviews
5.6 Harwell Oxford campus
The space campus in Harwell, Oxfordshire, has quickly become established as a key agglomeration of space companies. R&D in science and technology started at Harwell in 1947, and the Rutherford Laboratory45 followed 10 years later. Fast‐forward to 2013, when we also have at Harwell the Satellite Applications Catapult, and the European Space Agency (ESA) Business Incubation Centre adding to the existing high technology research in the fields of nuclear energy, the Diamond Synchrotron and medical facilities. In May 2015 there were nearly 60 space companies in Harwell.
Box 9 Case Study: G2way, a successfully incubated commercial spin‐out
G2way Ltd is a Geospatial technology development company founded in 2009 to develop “Global Two Way Communications and Navigation” systems. As part of a TSB funded project under the “Collaboration Nation” Space call, G2way led a project entitled; Establishment & Testing of “Area2D” a precision agriculture network, for the South East of England during May to July 2011.
During the Area2D research project, the issue of cloud cover preventing the timely acquisition of Earth Observation images lead to the initiation of Low Level Earth Observation (LLEO), which in 2011 became one of the first projects to be funded by the European Space Agency’s Business Incubation Centre (ESABIC) at the Harwell Science & Innovation Campus, in Oxfordshire.
In 2012, LLEO became the first alumni of the UK ESABIC and relocated back to Nottingham. The project has now reached a commercialised stage with 2 staff, serving 4 clients and recently updated its UAVs to continually provide more advanced services.
Credit: ESA‐BIC Note: For more information of the application of LLEO, please see the accompanying ‘CASE STUDIES’ report. Source: London Economics based on secondary research and stakeholder interviews
45 Now Rutherford Appleton Laboratory with a significant space business, namely RAL Space.
60 London Economics
The Case for Space 2015
5 | Economic impact of the UK space economy: Direct, indirect and induced effects
The following box summarises the support ecosystem at Harwell.
Box 10 Support ecosystem of the Harwell campus
Harwell is a world‐renowned science, innovation, technology and business campus south of Oxford, owned by a joint venture between Harwell Oxford Developments Ltd, the Science and Technology Facilities Council (STFC) and the UK Atomic Energy Authority. Harwell offers its occupants access to scientific infrastructure and research as well as networking opportunities. The site hosts over 5000 people from around 180 organisations focussing on a range of commercial applications, including a thriving space cluster.
European Space Agency’s Business Incubation Centre (ESA‐BIC) Harwell, set up by the European Space Agency (ESA) and managed by the STFC, supports selected space application start‐ups with comprehensive commercial and technical assistance to transfer an idea into a viable business. So far, 16 companies have graduated from ESA‐BIC Harwell, and 9 are currently incubated.
The European Centre for Space Applications and Telecommunications (ECSAT) is ESA’s first technical centre in the UK and supports activities related to telecommunications, integrated applications, earth observation, exploration, climate change, technology and science.
Satellite Applications Catapult is a not‐for‐profit research, innovation and technology company with the vision to accelerate growth in the UK economic through the exploitation of space applications in the UK. Focussing on areas where they believe significant economic impact of space applications is possible, they are currently offering programmes on Maritime, Transport, Technology Exploration, and Market Exploration. Within each programme Satellite Applications Catapult identifies ideas that can potentially be exploited, hosts workshops to bring together multidisciplinary teams comprising potential customers and suppliers, offers state‐of‐the‐art facilities, e.g. the Earth Observation facility CEMS or the SATComms Lab, data, expertise and business support.
Subsidiaries of many established space companies are located on Harwell campus, among them Planet Labs, SATcase Ltd, Thales Alenia Space, Tranquility Aerospace Ltd, Zero Gravity, AVS, Deimos, GMV, Lockheed Martin Corp, MDA Space & Robotics Ltd, Neptec UK Ltd, Oxford Space Systems, Pelamis, Oxensis, Rheatech Ltd, Sterling GEO, Telespazio Vega UK Ltd (from 26/3/12), Terma UK, Tranquility Aerospace Ltd, Rutherford Appleton Laboratory.
Harwell Campus. Credit: Harwell Oxford.
Source: London Economics based on secondary research and stakeholder interviews
Agglomeration effects play a key role in influencing productivity (see London Economics’ 2012 report for the Department for Business, Innovation & Skills on the impact of investment in intangible assets on productivity spillovers); for example, knowledge spillover effects through interactions between employees are facilitated by geographical proximity, inducing spillovers between workers within the same region, city, or firm. The UK’s space industry cluster in Harwell, Oxfordshire, provides a key example of such agglomeration effects.
The box below summarises relocation or expansion of companies into the space cluster at Harwell Oxford.
London Economics The Case for Space 2015 61
5 | Economic impact of the UK space economy: Direct, indirect and induced effects
Box 11 Companies with applications interest now relocated to UK/Harwell
ACRI/ARGANS (from France) An EO service company from Sophia‐Antipolis, established a subsidiary ARGANS in UK, based in the south‐west of England and are active in ARTES applications
Added Value Solutions (from Spain) Conceive mechanisms, covering design, manufacturing, integration, test and delivery
Cyth systems (from USA) Engineering and systems integration company that designs and builds embedded control systems, automated test systems, machine vision systems and robotic systems for use in the aerospace and defence industry.
Elecnor Deimos (from Spain) Wide‐ranging technology and aerospace company, active in ARTES applications
Exact Earth (from Canada/Spain) Major EO service provider
GMV (from Spain) In the process, not yet official, but reflecting the general move of GMV activities to its operations in other countries (e.g. Poland and Portugal)
MDA (from Canada) At this stage mostly just a business development presence
Neptec (from Canada) Mostly upstream but some downstream‐relevant technologies, with an office now opened at Harwell
PlanetLabs (from USA) Also based at the Catapult, they support an EO constellation (“Dove”) of nano‐satellites, for evaluation purposes
Rhea Group (expansion of UK activities) Wide‐ranging interests, presence in UK partly aimed at increasing their downstream activities
SENER (from Spain) UK office registered but has not yet chosen a location (could be Harwell, Bristol, Stevenage)
Starlab (from Spain) Working in space and neuroscience and active in ARTES applications
Thales Alenia Space (expansion of UK activities) TAS office in Harwell set up in 2014, focused on applications and other UK‐oriented ARTES opportunities. Separate to rest of TAS operation but draws on resources from R&D arm in Reading
Terma UK (from Denmark) Space prime working across all phases of space mission lifecycle.
Terradue (expansion of UK activities) Focused on e‐infrastructures and earth sciences. Interested in the UK’s growing high‐tech and space applications potential
Telespazio‐Vega (expansion of UK activities) Building up downstream and applications‐oriented operations, liaising with ESA on ARTES applications and linking with other Telespazio‐Vega operations in Germany, Italy and Romania
Zero Gravity (from USA) ISS‐based technologies for plant stem cell research, new UK company located since February 2014 at the Satellite Applications Catapult Source: ESA (2014) Socio‐Economic Analysis ARTES Applications & IAP (presentation)
The first alumnus from ESA’s Business Incubator Centre was G2Way, which graduated in 2012. The box below presents the successful spin‐out from the ESA programme.
62 London Economics
The Case for Space 2015
6 | Economic impact of the UK space economy: Catalytic effects
6 Economic impact of the UK space economy: Catalytic effects
Space technologies are everywhere, and their applications stretch far and wide. This chapter summarises applications of space ranging from the universally recognised applications in meteorological forecasting, navigation and broadcast of live television to the less well‐known applications in agriculture and a whole host of professional transport applications through to innovative uses of space services for track maintenance, oil & gas extraction and synchronisation of utility networks.
Additional applications in the realm of policy‐making, and disaster monitoring and relief are discussed alongside insurance and finance applications where space services serve as vital inputs, and military applications of space services.
Caveat on the role of the UK
As noted by the OECD SEaaG (2014), there has been a trend towards the globalisation of value chains in the space economy, resulting in increasing international interdependence for the provision of space‐enabled services. As with other nations, the UK makes an important contribution to global space service provision, but in many cases depends on international partners to ensure service provision.
All effects considered in this section rely on a usually long and complex international value chain, within which UK government investment (e.g. to ESA) and UK organisations play an important role. However, in most/all cases, the UK does not cover every link in the value chain, and thus the provision of service is dependent on international organisations and/or governments. This is also true in reverse. It can reasonably be assumed that the proportion of costs that is paid by the UK will equate to the proportion of benefits enjoyed by the UK.
In this respect, isolating the additional role of UK space investment and activity is not possible within the scope of this study. Rather, the following analysis is limited to cases where UK government investment or commercial organisations play a role in service provision. All cases focus on UK users and present the impact of space in gross terms.
6.1 Space applications as ‘General Purpose Technologies’
First, moving away from the simple perspective of space as a vertical industry, it is important to conceptualise the role of space‐enabled applications across and throughout the UK economy – to acknowledge space applications as General Purpose Technologies.
General Purpose Technologies (GPTs) are defined as technologies that have wide applications, scope for ongoing improvements, and become adopted on the supply side of markets in various sectors. GPTs generate the majority of wealth, attributable to them, when they are diffused across other sectors – not at the time of their invention. GPTs promote externalities such as (BIS, 2010):
Application across multiple sectors – spillover effects;
Possibility for step changes in more efficient production processes;
Structural changes in industry and new business processes and organisational learning;
New applications, some of which cannot be foreseen at the time of the GPT invention;
London Economics The Case for Space 2015 63
6 | Economic impact of the UK space economy: Catalytic effects
Impacts in terms of inducing new methods of working;
Social impacts arising from the public acting in new ways because of available new technology; and
GPTs show improvements as they age.
Space technologies can be strongly argued to qualify as a GPT, but to a varying extent:
Global Navigation Satellite Systems, or GNSS, is a free space service, where the user only needs a cheap piece of equipment (prices start around $1 for hardware) that can decode the signal, and thus apply the service in a wide array of sectors. The proliferation of smartphones with GNSS means that a large proportion of the population (it is estimated that 38% of the total UK population own a smartphone) are exposed to satellite navigation on daily basis. The original mass‐market application of GNSS was for road navigation, where personal navigation devices replaced traditional maps at a very high rate. Currently, there is hardly an industry that does not use GNSS to some degree. Oil & Gas exploration requires the services to log precise data on hydrologic surveys that can later be analysed; agriculture uses GNSS to improve farm efficiency through precision agriculture; the transport sector (road, air, maritime and rail) all use GNSS to varying degree and finance and utilities rely on the precise clock in navigation satellites to synchronise networks and improve efficiency. More information is provided in Section 7.
Satellite communications are a paid service, which means the take‐up of the service is inherently lower than GNSS. However, about 40% of UK households subscribe to BSKYB’s broadcasting service and all major TV content generators rely on satellite communications to be able to broadcast live. Satellite communications offer access to the internet for users that are not on the telephone grid, either in rural areas, at sea or in the air, and allow Oil & Gas companies to share results from exploration with head office in real time. Access to communication facilities in cases of emergency makes satellite communication a key technology for disaster relief.
Earth Observation is used as a key input to precision agriculture and gives public sector agencies access to much better data that can affect policies. Using Earth Observation for weather forecasting has greatly improved the accuracy of forecasts, benefiting multiple sectors that depend on weather.
The span of influence of the space economy in the UK is extensive – and this is shown more thoroughly in Section 7. The services enabled by space‐derived capabilities are used by a wide and diverse range of commercial, consumer, government and science users across the economy.
6.2 Span of influence of space‐enabled applications
Space applications are used by an increasingly wide and diverse range of users throughout the UK economy. The following diagram shows the UK’s nine national critical infrastructures, and shows sub‐categories of each in which space enables, enhances, or is an alternative to current operations. Enabled activities are defined as activities where loss of access to satellite services would significantly impair operations in the short term.
Space applications are used by an increasingly wide and diverse
range of users throughout the UK economy.
64 London Economics
The Case for Space 2015
6 | Economic impact of the UK space economy: Catalytic effects
Figure 24 Influence of space‐enabled applications across the UK’s critical national infrastructures
Note: ‘Alternative solution’ refers to applications where satellite services provide a means to undertake a task that could be achieved without satellite services (e.g. fixed broadband), but may be chosen based on cost or performance grounds. ‘Enhancing solution’ also refers also to applications (e.g. navigation) that could be achieved with alternative terrestrial (non‐satellite) solutions, but where satellite services offer a clear cost efficiency and/or performance improvement. ‘Enabling solution’ refers to the most space‐dependent applications for which satellite services offer an enabling solution (e.g. live broadcast), defined on the basis of current operating procedures where serious disruptions would be encountered if the satellite services became unavailable. High‐level categories follow the definition of National Critical Infrastructures (https://www.gov.uk/government/uploads/system/uploads/attachment_data/file/62504/strategic‐framework.pdf) and sub categories are either sub sectors of the national critical infrastructures, Space IGS applications or 2‐digit SIC sectors. *: Space is an alternative solution for critical broadcasting, but enables live broadcasting. †: Location‐Based Services. ‡: Unmanned Aerial Systems. Source: London Economics analysis of space applications.
Satellite services
Enabling solution
Enhancing solution
Alternative solution
Based on the specific applications above, the table overleaf takes an extended view of the application of space in the UK economy listing all sections of the Standard Industry Classification and covered by the ONS Annual Business Survey or other sources, and reporting turnover, approximate GVA and employment in 2013. The column labelled ‘Use of Satellites’ provides a guideline to the degree of space influencing the section.
6 | Economic impact of the UK space economy: Catalytic effects
The highest use of satellites is found in Transport and storage and set to . Please note this does not imply that 4/5 or 80% of economic activity is directly attributable to space, but merely that space plays a strong central role and that it is used extensively in the section.
The use of satellites in sections for which space plays an indirect role is shown as . Retail trade is an example of such a section, where space contributes to ensuring availability of products (through transport), and helps consumers find the shop through location‐based services or in‐vehicle navigation. Each sector has been assigned a usage factor using subjective judgement based on industry knowledge.
Table 40 Valuation of sectors supported by space‐enabled services (2013)
SIC section Sector
Turnover (£m)
Approx GVA (£m)
Employment ('000)
Use of satellites
A Agriculture, forestry and fishing 4,443 1,804 41
B Mining and quarrying 51,623 25,064 66
C Manufacturing 522,106 156,975 2,483
D Electricity, gas, steam and air conditioning supply 111,254 24,731 129
E Water supply, sewerage, waste management, and remediation activities
33,713 16,808 165
F Construction 204,282 79,900 1,301
G Wholesale and retail trade; repair of motor vehicles and motorcycles
1,487,353 153,384 4,803
H Transport and storage 156,850 70,728 1,205
I Accommodation and food service activities 76,412 38,096 1,973
J Information and communication 198,895 99,656 1,118
K Finance* ‐ 124,500 ‐
L Real estate activities 54,250 36,789 540
M Professional, scientific and technical activities 228,944 129,404 2,055
N Administrative and support service activities 188,084 95,356 2,272
O Public Administration and Defence; Compulsory Social Security**
‐ 87,094 ‐
P Education 34,899 15,777 1,106
Q Human health and social work activities 47,629 30,152 1,686
R Arts, entertainment and recreation 120,222 22,518 661
S Other service activities 31,192 15,437 547
T Activities of households ‐ ‐ ‐
Total 3,552,151 1,224,173 22,151 ‐ Note: Legend: : The whole sector is fully enabled by space; : space plays a strong, central role (it cannot be inferred that space generates 4/5=80% of activity); : space plays a support role; : space plays a minor, but not negligible role;
: space influences the sector in indirect fashion (e.g. supporting supplies, generating footfall); : space plays no role. Values quoted do not infer a valuation of the utility of space services, but rather the total value of sectors supported. *: data from House of Commons Library, Financial Services: contribution to the UK economy, 2015; **: data from Public Administration, Defence and Compulsory Social Security Industry Review – 2014. Source: London Economics analysis of ONS data
66 London Economics
The Case for Space 2015
6 | Economic impact of the UK space economy: Catalytic effects
6.3 Typology of catalytic effects
The direct, indirect and induced effects of space manufacturing, space operations, space applications, and ancillary services (approximating what has previously been referred to as the ‘space industry’) are estimated in Section 5, whilst the catalytic effects of space technology and applications on users and non‐users is addressed in Sections 6 through 9.
Figure 25 Economic effects mapped to space economy value chain: Focus on catalytic effects
Source: London Economics
Space manufacturing Space operations Space applications Users
Launch vehicles and systemsLaunch provision and brokerage
Financial and legal servicesInsurance and brokerage
servicesConsultancy and applied
researchR&D and knowledge spillovers
Externalities
Ancillary services
Other support products and services
More efficient public sector services
Catalytic effectsDirect, indirect and induced effects
In simple terms, catalytic effects may be categorised into two main groups (and these groupings are reflected in the structure of the subsequent two Sections):
End‐user benefits: The value, defined in a wide sense (efficiency gain, cost avoidance/reduction, new activities, products or services, etc.), that an end‐user gains directly from using the product or service, and ideally measured above and beyond the price or cost of use.
R&D and knowledge spillovers: Research and Development (R&D) activities and the resulting technological and scientific innovations in the space industry generate widespread benefits that go beyond the returns made by the party undertaking the research. These indirect benefits that accrue to parties other than the innovating party are referred to as ‘spillovers’.
In more technical economic terms, both the above categories are defined in terms of spillovers. The economic literature distinguishes between three mechanisms by which R&D creates such spillovers, which differ in terms of drivers and diffusion channels: knowledge, market and network spillovers (Jaffe, 1996). Discussion and definition of each follows, with a summary of the available evidence on each presented in Sections 7 and 8.
6.3.1 Market spillovers
Market spillovers accrue to the users of space‐enabled services. If a user buys equipment and/or a subscription, the price paid is a simple transfer from the consumer to the producer. This market interaction is captured in the market effect, through the price, sales volume and sales revenues. But this is not the end of the economic effects ‐ there is further benefit that is additional to the price paid (known as Consumer Surplus = total value to the consumer, less the price paid) that can be counted as an economic impact. As this extra value is not captured by the producer in the market in the price, it is referred to as a ‘spillover’ from the market.
London Economics The Case for Space 2015 67
6 | Economic impact of the UK space economy: Catalytic effects
Spillovers occur after the commercialisation of a new technology as market forces pass on some of the benefits to other market participants. This occurs when innovative products, or higher‐quality versions of existing products, are sold at a price that is lower than the willingness to pay of its customer, or when lower production costs through improved processes are passed on to the customers through lower prices. Here, benefits are transferred to third parties through market forces rather than the actual knowledge flow.46 The extent of market spillovers will critically depend on the degree of competition in the marketplace (BIS, 2010; Jaffe, 1996).
The types of market spillovers considered include:
Benefits to consumer end‐users;
Consumer surplus (the total lifetime benefit deriving from the use of space services by consumer end‐users, less the cost of availing from the service)
Benefits to commercial users;
Producer surplus (difference between the total lifetime benefit deriving from the use of space services by commercial users (value‐added application profit, price premia, productivity boost, cost efficiency), less the cost of availing from the service)
Benefits to society of public and institutional use.
Improved policy‐making.
6.3.2 Knowledge spillovers
Knowledge spillovers accrue to users of space‐derived knowledge, skills and technologies, but who are not users of space‐enabled services. Spillovers occur because the knowledge created by a firm or government agency can typically not be contained within that entity. This is in part due to formal knowledge sharing through articles, news releases, colloquia, patents and licenses, but also because of unwarranted knowledge flows. While intellectual property laws enable firms to protect the results of their R&D investments to a certain extent, the economic exploitation of new technologies through incorporation into novel products or production processes is likely to reveal some aspects of the new knowledge to other agents. Spillover beneficiaries can use this leaked knowledge to imitate the products or processes by ‘reverse engineering’ of products, or they might use the knowledge as an input into own research processes. Inversely, the termination of a particular R&D stream by one company can signal to other firms that the research is unproductive. Employment mobility and companies’ mergers and acquisitions are further vehicles for the transmission of technical knowledge (BIS, 2010; Jaffe, 1996).
The existence of knowledge spillovers is the main justification for public investments in R&D. As the innovating party is unable to extract the full returns on investment, it follows that societal returns to R&D exceed the private returns, which means private R&D expenditure is less than the social optimum. Haskel et al. (2014)47 find that the return to public R&D expenditure is 20% as measured by the total factor productivity of the sector, all else equal. Their results also suggest there appears to be a crowding‐in effect of public R&D (i.e. that private R&D expenditure increases) as a result of the public R&D. As a result of the crowding‐in effect, they argue, the 20% returns figure should be interpreted as a lower bound for the overall returns.
46 It is worth noting that even in the case of knowledge spillovers, the benefits are generated through the commercial use of a new product or process; however, in the case of knowledge spillovers the commercial benefits are not created in the market for the new product or process that is the direct output of the research effort, but indirectly through the creation of new or improved products or processes in other markets (BIS, 2010; Jaffe, 1996). 47 Haskel, J., A. Hughes, E. Bascavusoglu‐Moreau (2014) The Economics Significance of the UK Science Base.
68 London Economics
The Case for Space 2015
6 | Economic impact of the UK space economy: Catalytic effects
6.3.3 Network spillovers
Network spillovers refer to a situation of interacting research projects, where the value of a new technology depends on the development of a set of related technologies. The successful completion of one of the related research projects creates a positive externality because it increases the probability that the ‘critical mass’ of related innovations will be achieved (Jaffe, 1996). Similarly, the take‐up and further development of an innovation by additional users increases the value of the innovation to existing users.
6.3.4 Externalities
Externalities are benefits that accrue to non‐uses of space services, but derive from users’ change of behaviour. For example traffic‐redistributing satnavs will reduce congestion for non‐users when its users are directed to alternative routes. Another example is that more efficient air traffic control results in shorter flight times and less time spent in holding patterns, which benefits families of air passengers.
In summary, the figure below presents benefits across categories of beneficiaries.
Game‐changing servicesLow‐cost access to spacePersistent surveillancePower from space
Climate and environmental servicesInsurance and financeAgriculture and food securityEnvironmental servicesWeather forecastingTransport managementSmart cities/urban services for local governmentEnergy (and other critical) infrastructure services
e‐connectivityDirect‐To‐Home TVFixed satellite broadbandBroadband to shipsBroadband to aircraftUbiquitous M2MLocation based servicesManaging unmanned vehicles (RPVs) and hosted payloadsSeamless personal communications
STEM, exploration and scienceSTEM education and careersSpace exploration beyond earth orbitSpace science
OtherDriverless vehiclesSpace for Smarter Government
Indirect beneficiary (e.g. externality)Legend:Potential for knowledge spillover
Direct end‐user (e.g. subscriber, equipment user)
London Economics The Case for Space 2015 69
7 | Catalytic effects: End‐user benefits
7 Catalytic effects: End‐user benefits
7.1 Introduction
This Section presents a discussion of the wider, or catalytic, effects of space‐enabled technologies, services and applications for consumer, commercial and institutional end‐users, termed end‐user benefits.48
An end‐user is an individual or organisation at the end of the provision value‐chain that actually uses the product or service. An end‐user benefit is the value (or utility) that an end‐user gains directly from using the product or service, and ideally (from an economic perspective) additional to the cost of use (known as consumer surplus).
The range of applications of space‐enabled services is wide and diverse, with each application used by an even more diverse range of users. To limit and organise the discussion, this Section is structured by categorising users according to the Space Action Growth Plan markets (Figure 27).
Figure 27 Space Action Growth Plan high growth markets
Note: Priority markets identified in red. Source: Space Innovation and Growth Strategy 2014‐2030 – Space Action Growth Plan
User categories
48 No particular negative externalities have been identified.
70 London Economics
The Case for Space 2015
7 | Catalytic effects: End‐user benefits
Given that these markets have been selected for their future potential, we also supplement this list with applications already exhibiting their current potential (e.g. satellite broadcasting). In light of recent developments, we have also added ‘driverless vehicles’ under ‘game‐changing services’.
Caveat: This analysis is intended to be illustrative, and does not aim, nor claim, to be exhaustive. A comprehensive assessment of the value of space‐enabled services to the UK is beyond the scope of the current study – and is a recommendation for future research. Considerable further study is required to identify the full range of applications, the importance of the contribution of space‐enabled services to the application, and what the economic benefits are. This section does not list, explain or quantify all applications, nor value all impacts. Rather, a selection of pertinent examples of applications and users has been chosen to illustrate the role and impact of space.
Where previous research has been conducted to value end‐user benefits and is available, this information is included with sources clearly referenced.
The summary examples presented here draw on the a range of Case Studies presented in the accompanying ‘CASE STUDIES’ report, and interested readers are encouraged to read the full detailed Case Studies. The Case Studies themselves were researched using a mix of desk‐based research of existing literature and information sources, supplemented by a short programme of qualitative research involving semi‐structured interviews with selected key stakeholders. The sources for this summary discussion are fully referenced in the ‘CASE STUDIES’ report.
7.2 Security, safety & resilience
Please note that the primary users of such applications are public sector agencies, for the benefit of society (either via reduced public sector costs, public safety and security, or environmental sustainability), valuation of benefits is difficult and available research is limited. However, illustrative examples are presented and discussed.
Maritime Geospatial Services
Satellite‐enabled solutions are ideal for maritime geospatial applications such as Maritime surveillance and Maritime environmental management (sub‐markets) as Earth Observation satellites have the ability to monitor large swathes of the ocean at a low marginal cost. Sophisticated algorithms can identify anomalies in imagery data to identify areas that require targeted surface investigation, reducing the burden on enforcement and management services.
NovaSAR is a constellation of four state‐of‐the‐art Synthetic Aperture Radar (SAR) satellites specifically designed for low cost missions. Once fully developed, it will operate in all weather conditions, day and night, with a revisit rate as often as twice a week, making NovaSAR a preferred data source in a number of Maritime Wide Area Search (MWAS) applications, including:
maritime surveillance of drug trafficking;
illegal, unreported and unregulated (IUU) fishing and piracy (see more below);
oil spills management;
deforestation detection;
flood monitoring; and
glacial melts.
The Government has allocated £21 million to assist the development and launch of the first satellite of the constellation, to be built in the UK by SSTL. Economic benefits from NovaSAR to the
London Economics The Case for Space 2015 71
7 | Catalytic effects: End‐user benefits
UK go beyond industry employment to build the space infrastructure, but also from the creation of business opportunities across the wider economy. More affordable SAR would position the UK at the forefront of a new and exploitable global market in a range of Earth Observation services and applications. The UK Space Agency expects that the success of the system will attract over £150 million of investment into the UK.49
Within Maritime surveillance, one issue of particular social concern is illegal, unreported and unregulated fishing (IUU). Since the rewards are high and the risk is low due to enforcement inefficiencies, IUU is widely practiced. For instance in 2007 alone, 500,000 tonnes of IUU fish products worth £800 million were imported in the EU.50 With an estimated 1 in 5 fish taken illegally from the world’s oceans, IUU fishing is a worldwide problem which depletes fish stocks and costs the global economy an estimated £15.2 billion every year.51 UK fish consumption by adults in 2012 was estimated at approximately 0.5% of world’s fish consumption.52 Though the latter concerns demand and not supply, it suggests a ballpark UK equivalent cost could be in the range £50‐100 million per annum, plus depletion of fish stocks in UK waters.
Satellite imagery and AIS data can be used to monitor the whereabouts of fishing vessels and identify illegal activity that can be acted upon by coastguards and other surface vessels. The Satellite Applications Catapult have developed a prototype of the Information Analysis Platform (AIP) designed to use freely available satellite data in combination with cross‐country vessel datasets, to automate the fisheries surveillance process, detect IUU in real time and alert nearby authorities and regulators. Such control of IUU would reduce the cost to the UK economy and fisheries industry and preserve the sustainability of UK fish stocks.
A study53 of French authorities’ use of Earth Observation satellite data to monitor its exclusive economic zones in the South Indian Ocean found that within one year, illegal fishing in that area was reduced by 90%, with none reported two years later.
At the European level, a study54 of the EMSA Clean Sea Net Initiative (2007‐2011), the near real time European satellite based oil spill monitoring and vessel detection service, found that Earth Observation satellite data enabled EMSA to monitor over 1 billion km² at an operational cost of €2.7 million per year, rather than 50.000 flight hours of aircraft collecting data at a cost of approximately €30 million – a cost saving in excess of €25 million per year. The UK accounts for 19% of Exclusive Economic Zone of the European Union,55 so an indicative estimate of the savings to the UK may be €5m, or about £3.5m.
Secure satellite communications
Secure communications are crucial for the success of military operations, as civilian networks are not sufficiently secure. Communications satellites are used to provide encrypted connectivity between troops, forward operating bases and command & control centre. UK companies provide important equipment and secure communications functionality to the UK military, which employs 145,000 personnel in addition to a large fleet of vehicles, amongst others:
49 UK Space Agency (2014), Case Study: NovaSAR, available at: https://www.gov.uk/government/case‐studies/novasar 50 Seafish (2012) The Seafish Guide to Illegal, Unreported and Unregulated Fishing, available at: http://www.seafish.org/media/742176/seafishguidetoiuu_201211.pdf 51 Satellite Applications Catapult (2014) Case Study: Ending Illegal Fishing, available at: https://sa.catapult.org.uk/documents/10625/53165/Case+Study+‐+IUU+‐+July+2014Final.pdf/fd32b1e8‐f441‐4cf1‐a1b6‐95764300b142 52 Food and Agriculture Organization, Fisheries and Aquaculture Department, available at: http://www.fao.org/fishery/en 53 OECD, Space technology and climate change, 2008 54 EMSA (2011) CleanSeaNet first generation, 16April 2007‐31January 2011 report. 55 Please see http://www.seaaroundus.org/ for more information.
Airbus Defence and Space UK is a market leader in military communications who build and operate secure satellite communications through military X‐band services from the Skynet constellations on behalf of the Ministry of Defence. In addition to supplying the UK armed forces, Airbus Defence and Space UK is the largest supplier of secure communications to NATO and supply to the US Department of Defense, French armed forces, Netherlands, Slovenia among others. Airbus Defence and Space UK are fully vertically integrated and build and operate space and ground infrastructure in addition to leasing bandwidth for specific missions and providing user equipment.
Vislink Company is headquartered in the UK and is a manufacturer of rugged user equipment for use in combat zones.
Galileo PRS
Satellite navigation applications (e.g. GPS) are already widely used in the UK in mass market applications (e.g. location‐enabled apps on Smartphones – see ‘Location based services’ in section 7.6). However, the publicly available open service is not sufficiently robust to (potentially malicious) interference (explained below) to be used to manage critical national infrastructures (i.e. communications, emergency services, energy, financial services, food, government, health, transport, water) or for military operations).
Galileo is Europe’s global navigation satellite system (GNSS), and PRS is the system’s Public Regulated Service. PRS is an encrypted service and access to decryption is decided by competent authorities in each EU Member State, which is selected by government. PRS remedies two key threats to satellite navigation, namely spoofing (transmission of counterfeit signals similar to GNSS) intended to confuse the user and lead them to unintended locations. Spoofing could also be used by governments in case of security threats. The other threat is jamming (where radio noise is used to block navigation signals), which would disable GNSS in a local area near the jammer. Galileo PRS will be available for public safety and security services such as fire brigades, ambulances, military and police along with humanitarian aid services and enable continued use of GNSS in adverse conditions.
The UK is a contributor of funding to the Galileo programme, through the EU and ESA memberships. UK companies have been involved in Galileo PRS from the beginning. SSTL built the first Galileo satellites and continue to supply payloads for OHB; Airbus Defence and Space designed and delivered the first four IOV (in‐orbit validation) satellites and the ground control segment and CGI (formerly Logica) developed, delivered and support the security systems for Galileo. Further downstream, Airbus Defence and Space won the 2014 European Satellite Navigation Competition for its low‐cost receiver of Galileo PRS signals and the UK Government is currently developing a receiver programme to exploit the service.
At the user level, the national competent authority (yet to be established) will have the right to grant access to PRS, but users could include approximately: 1,700 ambulances,56 3,500 fire engines,57 and about 25,000 police vehicles.58 The armed forces have 145,000 combat personnel and while it is unlikely each of those will be equipped with a PRS receiver, this and any military
56 Ambulancezorg Nederland (2010) Ambulance Care in Europe, available here: http://www.eena.org/uploads/gallery/files/pdf/report‐ambulancecare‐in‐europe‐jan‐2010%20(1).pdf 57 John Dennis Coachbuilders FAQ, accessed 19 June 2015, available at: http://www.johndennisfire.co.uk/faq 58 Based on Car Magazine (2010) reporting annual purchase of 5,600 police vehicles per year and assumed average service life of 4 years. Please see: http://www.carmagazine.co.uk/car‐news/industry‐news/volvo/choice‐of‐uk‐police‐cars‐massively‐slimmed‐down/
vehicles (land, sea or airborne) are likely users of PRS. Additional potential users include critical infrastructures such as energy distribution, telecoms and finance.
Polar infrastructure for shipping & exploration
The UK has a significant Oil & Gas industry, with 1,100 companies achieving combined revenues of £27 billion in 2011 and estimated 93,000 employees.59 The industry is a heavy user of space‐enabled services and technologies throughout the process from exploration to extraction and beyond, in order to maximise the economic production of the UK’s offshore Oil & Gas resources.
At the early stage of exploration, Earth Observation satellites are used to identify areas of natural oil seeps, which indicate that the ground contains oil reserves. Next, Earth Observation satellites are used to improve the understanding of the seabed before surface survey vessels carrying precision GNSS devices are sent to the area for more detailed analysis. GNSS is key to ensuring the desired area is surveyed, and that all the information gathered can be accurately referenced to the precise location.
Using the knowledge of the seabed and precise coordinates retrieved by satellites and survey vessels, the initial drilling phase begins. During this phase, satellite communications play a key role in allowing operations support groups on‐shore a real‐time data feed from the sensors on the drill, ensuring timely considerations are given to any problems. This real‐time data feed is necessary for the drilling process as it is impossible to physically accommodate the entire team onsite. Following successful conclusion of exploratory drilling, the oil rig is constructed and the real‐time data feed via satellite is next used for well‐drilling.
Operational oil rigs use satellites to gain access to accurate and recent weather forecasts and to allow the crew access to internet and broadcasting services that can keep them in touch with family and friends and keep up‐to‐date with sports and current events. In addition, the tankers that transport the oil from rigs use maritime broadband, as described later.
Oil & Gas companies are obliged to leave the area unaltered, which includes considerations for land subsistence. To ensure compliance with this requirement, Oil & Gas companies employ GIS specialists whose inputs are remote sensing images or data from GNSS‐based sensors that can monitor the smallest of changes in geological properties.
The number of UK companies involved in the supply of space service to Oil & Gas is very large. Key companies include the manufacturers of satellites (Airbus Defence and Space UK, Earth Observation and communications; SSTL, Earth Observation and Navigation) along with multiple component and subsystem suppliers such as Com Dev and Qioptiq. Inmarsat, DMCii, Harris CapRock, and Veripos provide the services used for the operation of the system while user equipment manufacturers (Veripos, Cobham etc.) and value‐added retailers complete the picture.
The UK’s strong industry and the improving satellite coverage put it in a good position to play a role in the expected increase of Oil & Gas exploration activities in the Polar Regions.
Access to off‐shore oilfields contribute to keeping the oil price at a level that allows the multitude of companies relying on oil for fuel or production inputs to continue operating profitably and keep consumers able to heat their homes or refuel their cars.
59 Ernst & Young (2013) Review of the UK oilfield Services Industry 2012. Available at: http://www.oilandgasuk.co.uk/templates/asset‐relay.cfm?frmAssetFileID=3027
In the realm of disaster management and response, meteorology data is often used to warn and monitor potential hazards, while Earth Observation images are frequently used in the context of natural disasters such as the Boxing Day tsunami in Asia and earthquake in Haiti to rapidly map the area and assess damage. Earth Observation images can be scrutinised to identify pockets of potential survivors that can then be rescued. The Malaysian Airlines MH370 was also sought on satellite images when multitudes of volunteers scoured the pictures in the hope of spotting the plane.
A the European level, a study for the European Commission suggests an indicative estimate of economic damage to Europe of €4.7 billion per annum due to floods and €4.1 billion due to storms (at 2010 prices), but concludes that “the causality link between satellite data and the ultimate impact is difficult (if not impossible) to establish because the final output is affected by a multitude of factors”.60 However, a forward‐looking analysis of Europe’s Earth Observation satellite system (e.g. Copernicus, then known as ‘GMES’) suggested an indicative estimate of the incremental benefit of the use of satellite data to be 1%.61 Even at such a level, the use of satellite data could offer Europe a potential saving of €88 million per annum from reduced damage of floods and storms alone. Floods and storms cause £1.1bn worth of damage in the UK per year on average.62 Assuming the same impact of Earth Observation as for the EU as a whole, the average annual savings in the UK is in the order of £11m.
In a bid to pre‐empt disasters, Earth Observation is used to classify land cover and identify areas at risk of flooding due to insufficient water absorption by the ground. Earth Observation is also used for spatial disease prediction, surveillance, and control where the physical properties of an environment have been identified as a key contributory factor in disease spread.
Earth Observation is extremely useful because it delivers timely mapping of areas affected by disasters and provides emergency response units with the opportunity to see the overall picture. Synthetic Aperture Radar (SAR) data is especially helpful in case of flooding because it can deliver images through cloud, which often occurs in flood risk areas.
The International Charter on Space and Major Disaster provides a unified system of space data delivery to national civil protection authorities in areas at risk. When the Charter is activated, the member space agencies around the world use their resources to supply satellite data with a range of resolutions and swath widths to those affected by natural or man‐made disasters. The UK Space Agency is a key player within the international Charter and board representative of the UK Disaster Monitoring Constellation (UK‐DMC), the UK space resource used for global disaster monitoring within the International Charter.
A Case Study (see accompanying report) considers the benefits of Earth Observation in the context of the severe flooding of the South West of England in 2014. Overall in this one instance, more than 8,300 households and 4,800 commercial properties were flooded, with a further 7,000 properties losing access to essential services or being cut off by flood water. The Environment Agency (EA) issued over 160,000 warnings to homes and businesses for the December floods and
60 Booz & Company (2014) Evaluation of socio‐economic impacts from space activities in the EU, prepared for: the European Commission Enterprise and Industry Directorate‐General, p.58. 61 Booz&Co (2011) Cost‐Benefit Analysis for GMES. 62 The International Disaster Database, EM‐DAT, available at http://www.emdat.be/database, average over 2000‐14 deflated using GDP deflator from World Bank and converted from USD to GBP using end‐of‐year exchange rates from http://www.xe.com.
a further 200 flood alerts as of 06 January, and relied on satellite imagery to target recovery measures on flooded areas.
The 2013/14 winter floods in the UK activated the International Charter three times. The satellite data was used by the Environment Agency and Cobra, the UK government’s emergency committee, for information on the extent of the flooding, creation of flood maps for future mitigation and damage calculations.
Search and Rescue of distressed individuals is operated by the International Satellite System for Search and Rescue (COSPAS‐SARSAT), which operates a network of satellites and ground stations, and of which the UK is a participating country. Individuals in distress can activate a beacon, which will alert the COSPAS‐SARSAT operator to the emergency situation, and trigger emergency response. The beacons communicate via satellite, and an increasing proportion of them incorporate GNSS to ensure the most accurate information possible is provided to response teams. Personal Locator Beacons (PLBs) are used by vessel crew, hikers, pilots flying under VFR and certain helicopter passengers, while larger aircraft are required to carry Emergency Locator Transmitters (ELT) and IMO requires vessels under the SOLAS regulation to carry Emergency Position Indicating Radio Beacon (EPIRBs).63 In 2012, it was reported that 47,000 emergency beacons were registered in the UK,64 representing about 11% of the total population of registered beacons.65
Every year, COSPAS‐SARSAT contributes to about 700 people rescue and in 2013; about 4% of rescue events took place in the UK. McMurdo and Kannad (both part of the French Orolia Group) lead the manufacture of emergency beacons, and both are located on the South Coast of England.
Space Robustness Services
The modern world relies on satellites to a very significant degree and despite low probability, loss of satellite services would be damning on society as we know it. Space Robustness Services (including: removing space debris; space weather; and Space Situational Awareness) seek to provide early warnings and thus allow evasive actions to be taken. Space weather refers to the activity of the sun and the amount of mass ejected by the sun. A severe situation such as The Carrington Event in 1859 would most likely result in loss of power and most satellites in an instant. The National Grid, for example, has emergency procedures in place that would see them switch on all infrastructure in a bid to absorb as much solar energy as possible.66
Given the increasing international reliance on space systems for communications, navigation, timing and surveillance; and the increasing threats to spacecraft in the form of natural hazards and man‐made threats, an international approach to Space Traffic Control (STC) will soon be necessary. Space Situational Awareness refers to the ability to avoid collisions between man‐made and natural satellites of the Earth, again preserving continuity of space‐enabled services and applications. Space Debris refers to the remnants of man‐made satellites that currently orbit Earth, which pose a threat to active space assets.
63 European GNSS Agency (2015) GNSS Market Report Issue 4, available at: http://www.gsa.europa.eu/market/market‐report 64 COSPAS‐SARSAT (2012) Information Bulletin Issue 24, available at: https://www.cospas‐sarsat.int/images/stories/SystemDocs/Current/Bul24_Eng_small.pdf 65 COSPAS‐SARSAT, not published. 66 National Grid (2014) Storm in a teacup? available at: http://www.nationalgridconnecting.com/storm‐in‐a‐teacup/
Game‐changing technologies and infrastructure include: space plane technologies, indoor navigation, ultra low‐cost platforms, high resolution remote sensing from GEO, large integrated constellations in LEO, miniaturised antennas for consumer/M2M devices, fractionated satellites, high altitude atmospheric platforms (HAP/HALE), in‐orbit power generation and transmission. These technologies and infrastructure can enable the game‐changing services and users discussed below.
Low‐cost access to space
This end‐user benefit is more speculative than other markets, so is only briefly discussed here. The potential future end‐user benefits are discussed in more detail in the ‘Future prospects of the UK space economy’ Section, with case studies on spaceport UK and the SABRE engine designed by Reaction Engines for the SKYLON space plane. They can both be found in Section 10.4.
Currently the capacity and range of satellite‐enabled services is limited by the high cost of access to space (launch and transfer to on‐orbit position) – UK satellite owners/operators must negotiate a launch deal (as a primary or a secondary ‘piggy‐back’ payload on board a single‐use launch vehicle) with an international launch service provider, package and transfer the satellite to the launch site accompanied by technician to oversee integration and coupling with the launch vehicle. Whilst SpaceX has introduced the mass manufacturing efficiency of the assembly line to reduce the cost of launch somewhat, and has shown progress towards achievability of the first (main engine) stage of the Falcon F9, the cost of access to space is still prohibitively high for many potential customers, ultimately imposing a constraint on the capacity, performance and variety of space‐based services to end‐users.
If the cost of access to space could be dramatically reduced (e.g. by successful development of a low‐cost LEO launch vehicle, a reusable space plane such as SKYLON, or a reusable vertical launcher) – by a factor of up to a hundred according to some knowledgeable sources67 – it could change the economics of space; activating latent demand for new satellites (especially small satellites) and spacecraft to be built and launched to provide a range of new innovative services and applications to UK users.
A related but separate point is space tourism and small payload launch, where further developments on smaller reusable launch vehicles (e.g. Virgin Galactic, XCOR Aerospace) look set to soon commence commercial sub‐orbital spaceflight operations, for both paying space tourists and small payloads.
Persistent surveillance
Persistent surveillance refers to the use of satellites to monitor Earth constantly. For example, Google Maps or a competitor product could become a live service that would allow the user to view – in real time – the precise properties of an area. In a military context, persistent surveillance would be a very useful piece of intelligence on troop and vehicle movements and therefore allow military operators to make strategic decisions.
67 Musk, E. (2015) Reusability: the key to making human life multi‐planetary. Available at: http://www.spacex.com/news/2013/03/31/reusability‐key‐making‐human‐life‐multi‐planetary.
An application of satellites that is still in its infancy (at best) is the idea of harnessing solar power in satellites, and beaming the energy back to Earth. NASA and the US Navy are currently experimenting with the idea, and recent news suggests that several concepts are in motion. However, the costs prohibit any commercial entity from developing power from space. The Sun Tower, for example, is estimated to cost $12bn to build and launch, before the first power is generated.68
Power from space is an interesting idea, and could solve the planet’s need for clean energy. At this stage, however, it is not clear that the technology can be developed that will allow commercial operators return on investment in a reasonable time.
Driverless vehicles
Another application that could offer significant end‐user benefits in the future, and not technically a Growth Action Plan market, but the potential and the strong position that the government has asserted make driverless vehicles an interesting case to consider.
The development of the driverless car and other automated vehicles is already a reality. This cutting‐edge technology is expected to offer major benefits and to profoundly change people’s day‐to‐day lives.69 Though several systems work in conjunction with each other (e.g. radar, lidar, ultrasound, video, etc.) to provide the self‐drive capability, accurate and continuously available satellite navigation and satellite broadband connectivity are important enablers.
Eurostat estimates that light vehicles in the UK drove 66 billion kilometres in 2012 which at an average of 80 km/h would imply more than 800 million driver hours spent on British roads.70 If driverless cars become a reality and reaches full penetration, UK drivers would be able to spend their transport time working on other tasks, and labour supply could increase by half a million FTEs or more than 1.7% of the workforce.
Driverless cars have been forecasted to create a £900 billion industry by 202571 and directly benefit scientific research, developers, the automotive manufacturing sector as well as car users. Positive spill‐over effects on both turnover and employment in other sectors are likely as service and repair businesses will need to meet the higher skills demands of this new technology. Moreover, driverless car technology is expected not only to increase the comfort of current drivers, with cellular and/or satellite connectivity enabling vehicles to become infotainment hubs, but also to include people who are otherwise unable to drive. Driverless vehicles would also create a positive externality by decreasing CO2 emissions and traffic congestion, and improving road safety by minimising the risk of accidents.
68 Inhabitat, 6 Out of This World Space‐Based Solar Power Designs, 2012, available at: http://inhabitat.com/6‐out‐of‐this‐world‐space‐based‐solar‐power‐designs/sun‐tower/ 69 Department for Transport (2015). ‘The Pathway to Driverless Cars. Summary report and action plan’. 70 The assumed average speed of 80kn/h~50mph is deliberately high to ensure the estimate forms a lower bound. 71 http://www.theguardian.com/technology/2015/feb/11/driverless‐cars‐roll‐out‐trials‐uk‐roads
Insurance companies aim to derive the most accurate risk assessment of its policy holders in order to set the most appropriate insurance premium. Satellite imagery and navigation data can provide additional data through innovative applications to increase the accuracy of assessed risk. The result of this improvement is fairer premia (lower for lower‐risk consumers) and reduced losses for the insurance industry through better management of risk exposure – offering a rare win‐win relationship between insurer and policyholder.
Home insurance premia can be informed by satellite imagery to allow more accurate calculation of the risk of flooding or sedimentation that could result in insurance claims. Whereas, sophisticated finance institutions can use satellite images to monitor production activity and thus gain an edge on competitors in investment finance.
Through expert analysis and interpretation of satellite imagery and data, other geospatial information and government and client data, companies such as Geospatial Insight (please see the Case Study ‘Investment and Insurance risk assessment using satellite data’ in the accompanying report) deliver timely and evidence‐based intelligence to inform a variety of commercial decision‐making processes, ranging from investment evaluations to the impact of catastrophic events on business continuity. For the financial services sector, they provide assessments of revenue potential and investment risks from real‐world observations of infrastructure, progress and output (e.g. satellite imagery captures the extraction and processing infrastructure, transport access and tailings of a remote mine). Event impact assessments delivered during and immediately after catastrophic events, allow insurance companies to identify their liability arising from an event and to verify claims.
Motor insurance premia can be more fairly based on actual driving behaviour measured by a telematics device using inter alia navigation satellite data to determine position and speed, rather than generalised actuarial risk profiles based on broad personal and vehicle characteristics. Such systems are known as ‘Pay‐As‐You‐Drive’ and ‘Pay‐How‐You‐Drive’, with the latter being the more sophisticated variety.
The global insurance telematics market is currently in the nascent stage, estimated at 4.5 million (December 2013) products and an US$4 billion in terms of gross written premium72 – but the UK is one of the early adopters of insurance telematics products. Private motor insurance gross written premium in the UK was valued at £10.8bn in 2013.73 A recent survey (uSwitch.com Consumer Opinion Panel, March 2015) of 1,146 British adults found that 3.2 percent of drivers in the United Kingdom are currently using a black box telematics insurance, and a further 45% of drivers would consider installing one. However, consumers expressed an expectation of an incentive (one half of the ‘win‐win’) to do so – savings of at least £98 a year on their insurance premium, on average. The savings sought varies according age (the 18‐34 cohort would seek savings of £173, whereas the over 65 group would be happy with just £72 of savings). Demand for insurance telematics is forecasted to grow strongly to a global subscriber base of 85.5 million 2018, driven by increased adoption of telematics products in the UK, the US, and Italy.74
72 Timetric (2014) Insight Report: Technology in Action – A Roadmap for Insurance Telematics. 73 Datamonitor (2014) UK Private Motor Insurance: Market Dynamics and Opportunities. 74 Timetric (2014) Insight Report: Technology in Action – A Roadmap for Insurance Telematics.
London Economics The Case for Space 2015 79
7 | Catalytic effects: End‐user benefits
Agriculture and food security
Agriculture science and technology (agri‐tech), enabled by a range of satellite services, is one of the world’s fastest growing sectors. Along with satellites, agri‐tech has been strategically identified by the government as one of the Eight Great Technologies in which the UK is set to be a global leader.
As an island nation, food security in the UK is an important matter and it is necessary to understand the size of production in order to ensure sufficient provisions are imported. The UK is currently a net importer of food products, with home grown food only able to satisfy 70% of the market. 47% of food consumed in the UK is imported.75
Space services can increase yield on UK farms by improving farming efficiency through precision agriculture. Agri‐tech driven by a range of satellite‐enabled services assist in geo‐positioning and generating geo‐reference information (also known as precision farming). The global precision farming market is estimated to be growing at 13% per annum, and is expected to be worth US$3.7 billion by 2018.76
There are four main types of agri‐tech applications – yield monitors, variable‐rate technology (VRT), guidance systems, and GNSS positioning. In the UK, auto‐steering or guidance and soil mapping are used by 22% and 20% of farms, respectively and VRT is used by 16% of farms. The top three reasons cited for using precision farming are improved accuracy (76%), reduced input costs (63%) and improved soil conditions (48%).77 More specifically:
Controlled Traffic Farming (CTF), confining machinery loads to the least possible area in permanent ‘traffic lanes’, is the most successful example of precision farming on arable land and is able to reduce machinery and input costs up to 75% in some cases.
In the UK, GNSS guidance systems offer net economic benefits of at least £2/ha on a 500ha farm, and the net benefit from the whole system of GNSS guidance and variable‐rate fertiliser application is around £19/ha for a 750ha farm.78
Variable‐rate application of Nitrogen fertilisers resulted in a yield benefit of around £5,000 per year and quality benefit of £5,000 per year for a 440ha farm.79 For a 300ha farm, yield monitoring and variable‐rate application of fertilisers resulted in financial benefits of around £6,000 per year.80
Input costs can also be reduced as less fertiliser needs to be applied, with net savings of £14.22/ha.81 On another UK farm, auto‐steer improved accuracy and saved time and cultivation
75 Department for Environment Food and Rural Affairs (2013) Food Statistics Pocketbook 76 PR Newswire (2014). ‘Precision Farming Market Review on Technology and Components with Forecasts & Global Analysis for 2013 – 2018’Available at: http://www.appy‐geek.com/Web/ArticleWeb.aspx?regionid=4&articleid=29013738&m=d 77 Department for Environment Food and Rural Affairs (DEFRA), (2013), Farm Practices Survey Autumn 2012 – England. Available at: https://www.gov.uk/government/uploads/system/uploads/attachment_data/file/181719%20/defra‐stats‐foodfarm‐environ‐fps‐statsrelease‐autumn2012edition‐130328.pdf 78 Knight, S.; Miller, P.; Orson, J., (2009), An up‐to‐date cost/benefit analysis of precision farming techniques to guide growers of cereals and oilseeds. HGCA Research Review 2009 No. 71, pp. 115. Available at: http://www.hgca.com/publications/2009/may/20/an‐up‐to‐date‐costbenefit‐analysis‐of‐precision‐farming‐techniques‐to‐guide‐growers‐of‐cereals‐and‐oilseeds.aspx 79 HGCA (2009), ‘Case study 9: Precision Farming Solution: N‐Sensor to Vary Nitrogen Rate’. Available at: http://www.hgca.com/media/183400/pf_cs9‐be_precise_case_study_9_‐_james_price.pdf 80 HGCA (2009), ‘Case study 4: Precision Farming Solution: Yield mapping’. Available at: http://www.hgca.com/media/183365/pf_cs4‐be_precise_case_study_4_‐_j_and_t_clark.pdf 81 HGCA (2009), ‘Case study 2: Precision Farming Solution: Variable Rate Application’. Available at: http://www.hgca.com/media/183359/pf_cs2‐be_precise_case_study_2_‐_tony_reynolds.pdf
passes, resulting in benefits of around £15/ha per year82 or about 2‐5% additional savings on farmers’ chemical costs.83
In addition to these economic benefits to farm businesses, precision farming can also generate positive environmental benefits. Variable‐rate fertiliser application can reduce excess chemicals from entering rivers.
Environmental services
The market includes users of climate applications; carbon monitoring & modelling; and environmental policy‐makers. Earth Observation in particular is extensively used in environmental services with the data used as key inputs in the monitoring of flood risks, carbon emission, and the polar icecaps. Earth Observation has also improved the accuracy with which deforestation of the rainforest can be monitored and is used to gain crucial understanding of how forest fires spread.
An example of how the application of space services can enhance environmental services is flood modelling. Over 5 million properties in England (almost one in six) are currently at risk of flooding,84 and with climate change and local trends such as urbanisation and deforestation the frequency and severity of flooding events are likely to increase in the future. Societal and economic impacts of floods are considerable, as are the effects on the insurance industry:
The summer 2007 floods affected 55,000 properties, threatened around 7,000 people, and cost the UK insurance industry £3bn in claims.85
In winter 2013/14, 6,000 homes were flooded, and the UK insurance companies paid £1.1 bn to those affected by the floods.86
Flood models are used by government agencies to better support and protect communities from flood risks. In the UK, the Department for Environment, Food & Rural Affairs has overall responsibility for flood emergency planning at the national level, while the Environment Agency is responsible for forecasting flooding and operating flood defence infrastructure. In the aftermath of the 2007 floods, the Association of British Insurers requested that the Environment Agency increase the robustness and extent of pluvial flood modelling. And for this, Earth Observation becomes an essential tool, providing the required hydrological and topographic input data.
Weather forecasting
Satellites generate substantial value to the UK economy through their application in weather forecasting. The Met Office, the UK’s National Weather Service, is recognised internationally as delivering world‐class weather and climate research, and considers satellites to be an integral part of their current forecast provision that directly impacts on the quality of the forecasts they produce.
82 HGCA (2009d), ‘Case study 5: Precision Farming Solution: Autosteer’. Available at: http://www.hgca.com/media/183368/pf_cs5‐be_precise_case_study_5_‐_w_bradshaw_and_son.pdf 83 Allen‐Stevens, Tom (2011), ‘Reaping benefits of auto guidance’. Farmers Weekly (14 March 2011), Available at: http://www.fwi.co.uk/machinery/reaping‐benefits‐of‐auto‐guidance.htm 84 Environment Agency (2009) Flooding in England: A National Assessment of Flood Risk, available at: https://www.gov.uk/government/uploads/system/uploads/attachment_data/file/292928/geho0609bqds‐e‐e.pdf 85 Pitt, Sir Michael (2008) Learning lessons from the 2007 floods, available at: http://webarchive.nationalarchives.gov.uk/20100807034701/http:/archive.cabinetoffice.gov.uk/pittreview/thepittreview/final_report.html 86 NERC (2014). ‘Impact Report 2014. The Business of the Environment’
Recent (unpublished) analysis undertaken by London Economics suggests that the direct benefits of the Met Office’s weather services alone exceed £2.5bn per year.
However, weather forecasts result from multiple inputs, including satellite image data observations, aerial observations, surface‐based observations, scientific staff expertise and modelling on supercomputers. A conservative estimate of the share of all observations in all inputs is considered to lie in the range 30% to 50% (the upper range was used in a recent EUMETSAT study87). Further, a Met Office analysis of observation impacts on forecast accuracy showed that satellite data account for 64% of short‐range global forecast error reduction (out of all observations).
Combining the above data and shares suggests that the total annual average Present Value of benefits from satellite‐based meteorological observations to be in the range £600 million to £850 million per annum in the UK.
The breakdown of this total benefit by value stream is presented in the pie chart that follows (Figure 28).
Figure 28 Share of benefits from satellite‐based meteorological observations
Source: Internal (unpublished) London Economics analysis
All other business sectors (market based)
28%
Aviation (market based) 27%
Value to the public (willingness to pay)
13%
Climate change information benefits
(avoided cost) 10%
Met Office Revenue (market based)
7%
Defence and security (avoided cost)
5%
Winter Transport
(avoided cost) 4%
Flood damage prevention
(avoided cost) 2%
Storm damage prevention (avoided
cost) 2%
Other2%
A more specific use of weather forecasting data is DemandMetTM, a tailored forecasting tool for retailers developed by the Met Office, which helps UK retailers predict end‐consumer demand created and affected by weather conditions. The application describes the weather in context instead of providing mere temperature forecasts (includes 14 day regional and national forecasts), accounting for the fact that warm temperature impacts differently on consumer demand on sunny days compared to rainy days, or weekends compared to weekdays.
The benefits to retailers of incorporating weather forecasts into business decision making are substantial. Sainsbury’s quoted that the Met Office helped it record its ‘best‐ever week of seasonal barbecue sales, with a ‘600% increase year‐on‐year’. The Met Office estimated that by
87 Turner, S., Truscott, B., Mundy, P. and Barber, A. (2014). ‘EUMETSAT Polar System‐Second Generation. Full Business Case’, internal report. Provided by Met Office.
82 London Economics
The Case for Space 2015
7 | Catalytic effects: End‐user benefits
increasing retailers’ product availability from currently 92‐95% to 100%, the retail industry would grow by £1.1bn a year.
An externality is a reduction in food waste. In the UK, around £4.2bn of food is wasted every year,88 entailing severe environmental consequences. It is estimated that food waste is associated with 4% of the UK’s total water footprint.89 With accurate demand forecasting, retailers can not only avoid the direct costs of wasting food but also improve resource efficiency and reduce the carbon and wider environmental impact of the grocery sector.
7.5 More efficient public sector services
Established in 2014 under the auspices of the UK Space Agency and delivered in collaboration with the Satellite Applications Catapult, the Space for Smarter Government programme (SSGP) seeks to enable the public sector to save money, innovate and make more effective policy decisions by exploiting space products, data and services in everyday operational activities to deliver routine Government services efficiently. The SSGP is launching 14 projects to initiate the process (detailed in the accompanying ‘CASE STUDIES’ report).
Transport management
Space services play an important role in transport management across all modes (including the markets of Rail transport; Air traffic; and Road transport). Though not identified as a high growth market in the Growth Action Plan, maritime transport is managed using AIS beacons on all vessels regulated by the International Maritime Organization, and port approaches require satellite navigation to operate as efficiently as they do. Road transport uses satellite services for navigation purposes, and fleet management, but for transport management, the application is not yet fully developed. According to a study90 of vessel routing, route optimisation using ocean current forecasts models can save approximately 4%‐8% of fuel costs on average, depending on local conditions.
Air traffic management relies on satellite services to operate efficiently and effectively. Satellite communications, for example play a key role as a backup voice communication platform when the aircraft is out of VHF radio range thus enabling continuous communication between aircraft and ground. In addition, both general types of aviation, instrument flight rules (IFR) and visual flight rules (VFR) use satellite navigation. IFR requires avionics equipment to be certified and the pilot relies on instruments to fly and land the aircraft. VFR requires the pilot to be able to use visual clues to operate the aircraft, but GNSS navigation is used to assist the pilot’s planning and help plot the best course. The European GNSS Agency estimates 90% GNSS penetration worldwide in 2015 across both types of devices.
The European Geostationary Navigation Overlay Service (EGNOS), which provides an additional layer of functionality of GNSS by improving accuracy and adding an integrity signal, was originally devised for aviation use. Compared with traditional GPS‐based approached, EGNOS adds an important vertical element, which enables the pilot to position the aircraft more accurately and therefore improved efficiency in the landing. In 2011, Alderney Airport became the first airfield in Europe to use EGNOS to support landing of scheduled passenger services without any costly
88 Met Office (2014). ‘Businesses Can Harness the Weather and Boost Profits’ Says Met Office. Available at: http://www.metoffice.gov.uk/news/releases/archive/2014/Business‐Weather 89 Love Food Hate Waste (2015). ‘The Facts About Food Waste’. Available at: http://england.lovefoodhatewaste.com/node/2472 90 CNES, CLS (2011) AvisoOceano, Routing ships with the currents.
infrastructure for traditional instrument approaches, meaning, aircraft can now operate to serve the island in adverse weather conditions.
Another application in aviation concerns live flight tracking. The disappearance of Malaysia Airlines MH370 in March 2014 led the International Civil Aviation Organization (ICAO) to recommend adoption of a new 15‐minute aircraft tracking. London‐based satellite communications giant, Inmarsat, has already offered its support and expertise for the design of the tracking system, which would use GNSS to determine the lateral position of the aircraft (potentially also EGNOS for vertical height), communicated via Inmarsat’s satellites. Both systems would have reduced the search cost associated (expected to ultimately cost hundreds of millions of dollars)91 with the disappearance of MH370.
The use of satellite services in transport can go beyond traffic management. The UK’s railway operator, Network Rail, use a GNSS geo‐tagged Plain Line Pattern Recognition system to improve efficiency of track maintenance operations. With the railway operating close to capacity, timely resolution of track issues is crucial for the operation of the UK’s railway. Train operating companies rely on Network Rail to be able to provide the service passengers demand and pay for, and are at the front line in case of disruptions. The benefits of geo‐tagged PLPR affect multiple groups:
Network Rail reduce costs associated with traditional systems (the budget for track management in 2014/15 is £384.2m) and its 17,000 employees in the Route element of the Asset Management function are relieved of many trackside duties, reducing the risk of accidents.
Train operating companies that rely on Network Rail to maintain the track benefit through reduced reputational damage from cancellations and delayed services.
With 1.5 billion passengers every year, any avoided delay carries a huge social benefit. Assuming for example that PLPR can save each passenger a minute on average (i.e. savings from avoided cancellations), average hourly wage of £12 and value of leisure time relative to working time of 1:3, we derive aggregate benefits to passengers of £100 million per annum.
Benefits not only accrue to users of railways as improved performance of the system is likely to increase demand for passenger transport and motivate mode‐switching from private cars, leading other road users to enjoy reduced congestion and reduced environmental impact as emissions per passenger km travelled is about 3 times higher for private cars than trains.
Smart cities/urban services for local government
Space services have an important application in the realm of smart cities and urban planning. Earth Observation data can be used for multiple purposes such as land cover classification, where it is possible to assess the ground’s ability to absorb surface water and therefore assess flooding risks. The data is also useful to estimate urban heat islands and identify areas that need to be cooled down by planting more grass or shrubs. In recent years, the practise of planting grass on flat roofs to increase heat absorption and reduce urban heat has become more and more common. Access to GNSS navigation tracking data from smartphones would allow intelligent re‐routing of busses like IBM UK have successfully implemented in the Ivorian capital of Abidjan.
91 Wardell, J. (8 Apr 2014) “Search for MH370 to be most expensive in aviation history”, Reuters, http://www.reuters.com/article/2014/04/08/us‐malaysia‐airlines‐costs‐idUSBREA3709520140408
The idea of Smart Cities is in its infancy, so few benefits have been realised so far, but an example of the potential benefits is Cities Unlocked, a project being developed by the Future Cities Catapult in partnership with Microsoft, The Guide Dogs for the Blind Association, and The Bartlett Centre for Advanced Spatial Analysis at UCL. It is designed to ease the most vulnerable citizens in their movement through cities. So far the project has developed a prototype device which provides visually impaired people with a 3D soundscape to enrich their information of their surrounding environment. Satellite positioning improves the accuracy of positioning, and adds a vertical aspect that could be difficult to cover through terrestrial beacons alone.
The research group has conducted real‐world trials that have shown that visually impaired users feel more confident in their urban surroundings. If the network expands sufficiently, it has the potential to change the day‐to‐day lives of the over 2 million people who live with sight loss, especially the over 200,000 living with severe sight loss or blindness.
Additionally, the information on people’s behaviours in urban surroundings can help decrease public costs of local government management and can create spillover opportunities for scientific research based on the data available, and for innovative businesses to provide further efficiency‐improving applications.
Energy (and other critical) infrastructure services
Critical infrastructures such as energy, telecommunications and finance rely on space services in two distinct ways namely through timing and synchronisation and demand management using weather forecasting services relying on Earth Observation.
The Office for National Statistics (2014) Annual Business Survey (2012) reports approximate gross value added for the 76 enterprises in ‘distribution of electricity’ (SIC 35.13) was £10.5 billion in 2011. Using the same source, 49 enterprises in ‘distribution of gaseous fuels through mains’ (SIC 35.22) generated approximate gross value added of £3.5 billion in 2008.
Energy companies use the precise clocks on GNSS satellites to monitor and time stamp observations regarding power system voltage and current phasor rates at a rate of thousands of samples per second. The benefit to operators is that they are able to identify spikes and anomalies in the power supply in real‐time and therefore introduce countermeasures before the problems spread beyond control. Tracing the problem back through time stamped observations increases the likelihood of identifying the source of the problem and solving it.
Telecommunications companies use GNSS timing to synchronise calls such that multiple digital data packages can be sent on the same network and each conversation uses only a fraction of the bandwidth required for analogue communication. For land‐lines the application is relevant because the same copper wire is used for both internet and voice calls. For cellular communications, the application of satellite‐based timing ensures smooth handover between different mobile telephone masts.
The finance sector uses GNSS time stamping to ensure that instructions to purchase assets are processed at the price that prevailed at the time of instruction and not the prevailing price at the point of processing. Over time, it is conceivable that UK ATMs will adopt GNSS‐based time for logging transactions as is currently commonplace in the US. Banks also rely on highly secure encryption where precise time references are a requirement. Access to GNSS time rather than expensive atomic clocks reduces capital costs for banks and improves security of communication.
London Economics The Case for Space 2015 85
7 | Catalytic effects: End‐user benefits
Demand management using weather forecasts is primarily of relevance to gas and electricity providers who manage supply based on the Met Office’s weather forecasts. Changes in temperature naturally affect the consumption of power and energy as consumers decide to turn on (or up) the heat based on the prevailing weather conditions. Reducing excess capacity on the network reduces waste as a more accurate volume of utilities are generated and less strain is placed on the infrastructure.
The UK’s involvement in the Galileo programme means that over time, more and more timing and synchronisation of critical infrastructure will have a UK fingerprint. The Galileo constellation’s Commercial Service or Public Regulated Service may be of particular interest to operators of critical infrastructure due to the increased robustness and resilience offered.
7.6 e‐connectivity
Direct‐To‐Home TV
The largest UK space company and the largest provider of Direct to Home TV, BSKYB, is a prime example of application of satellite services for the mass market. In 2014, BSKYB had 11.5 million customers turning over £6.3 billion from retail subscribers and employing 25,000 employees. In 2012,92 Freesat had 2.1 million subscribers.93
Consumer end‐users of satellite broadcasting benefit from a live and scheduled TV service that can be provided all over the country with no geographical restrictions or requirements on population density for the service to be provided. Consumers choose BSKYB as their provider to gain access to specific sports or movies packages that are difficult to access on other platforms.
The economic benefit is difficult to estimate without further research, as it would be measured as the difference between consumers’ willingness‐to‐pay and the subscription price paid (consumer surplus).
An additional effect of satellite broadcasting and BSKYB in particular is the increased value of contracts for screening the Premier League football matches. With the latest contract amounting to £5.1 billion, the Premier League football clubs have access to unprecedented broadcasting funds enabling them to be competitive in the market for star players and therefore able to compete with Europe’s best improving the mood of (at least some) supporters.
92 BSKYB (2014) Annual Report 2014, available at: https://corporate.sky.com/documents/publications‐and‐reports/2012/annual‐report‐2012.pdf and London Economics Analysis thereof. 93 Ofcom / BARB (2014) Establishment survey, available at http://stakeholders.ofcom.org.uk/binaries/research/cmr/cmr14/UK_2.pdf
Fixed satellite broadband, covering backhaul (mobile, fixed, broadcast), telemedicine and assisted living, offers users in wired broadband not‐spots the opportunity of accessing fast internet services and enables modern living and working conditions.
There are currently three Ka‐band satellite operators offering their services in the UK, Avanti Communications (UK), Eutelsat (France) and SES Astra (Luxembourg). Satellite broadband is able to provide up to 22 Mbps download and 6Mbps upload speeds everywhere in the UK, with end users not experiencing any difference between terrestrial/mobile broadband and satellite broadband.
Left: The percentage of geographic area over which all operators have 3Gcoverage. Green: 90‐100&; Blue: 70%‐89.9%; Orange: 50% ‐ 69.9%; Purple: 25% ‐49.9%; Pink: less than 25%. Credit: 2015 GeoBasis‐DE/BKG (Ofcom website); Right: Avonline broadband Ka satellite coverage. Credit: Avonline Broadband.
Fixed satellite broadband can be the only option for some areas of the UK. Rural areas with low population density and a rugged countryside are often not considered to be a commercially viable target by terrestrial network operators. The coverage of Fibre and ADSL networks is therefore often limited to urban regions, with broadband in remote locations unavailable or lacking reliability. In such cases, satellite broadband can offer a valid alternative, allowing for rapid deployment of communications services to any location within the satellite fleet’s footprint. Avonline Broadband, the largest satellite broadband distributor in the UK, so far connected 11,000 UK customers to Ka services.
Access to fast internet could enable key services that would improve the quality of life through social services. For example, under a scheme of the Northern Ireland Broadband Fund, created in 2008, Avanti proposed and later implemented solutions for Ballintoy and Ballinamallard, two communities in Northern Ireland without internet coverage. In particular, Avanti provided rural businesses in these areas with reliable broadband coverage through satellite backhaul and small cell solutions. For example, Avanti provided a hotel in Ballintoy with larger femtocell alongside a base station, allowing the hotel to start ordering goods via the internet for the first time, and take reliable email bookings.
Satellite backhaul services enables communication between users over long distances. Backhaul is used by mobile and fixed communications providers, and is the backbone of broadcasting, particularly when reporters are in the field and need to send information home, but also from studio to terrestrial masts and cable TV providers.
Another application of access satellite broadband is the opportunity to provide telemedicine services to rural residents or off‐shore sailors that would otherwise have to travel far and long to seek medical help. 1.7 million people in the UK have been reported to currently use ‘Telecare’ or ‘Telemedicine’ by the Telecare Services Association. An assessed total of 3 million people with
London Economics The Case for Space 2015 87
7 | Catalytic effects: End‐user benefits
long‐term conditions and/or in need of social care can be monitored and treated remotely. Users will benefit from a lower cost of service at the point of use, and will avoid potentially unnecessary medical expenses. The application also provides increase coverage by serving patients who would not have otherwise received it. A trial study in 2012 has shown that successful delivery of the ‘Telehealth’ application can lead to a 20% reduction in emergency admissions, and a 45% decrease in mortality. ‘Telehealth’ can therefore significantly alleviate the cost and capacity pressures on the NHS and the public purse.
Broadband to ships
Unlike fixed satellite broadband, which requires a satellite dish that is pointed at the satellite and not moved, mobile satellite broadband uses equipment that can send and receive signals to and from satellites when the user is moving.
The maritime sector uses satellite broadband extensively. The UK has more than 1,200 merchant vessels, an important user group of satellite communications – e.g. Inmarsat reported that 57% of mobile satellite service revenue came from maritime users in 2013.94 Satellites enable communication between the captain of a ship and the ship owner or operator and in the event of emergencies (technical or medical), specialists are able to guide the crew or take over IT systems to ensure fast resolution and reduced time in port. Improving the efficiency of merchant shipping naturally benefits the ship owner and operators, but reducing the time at ports and giving accurate ETAs to port operators enables a higher throughput using the same facilities thus reducing the need for extensions.
In terms of monetised value, the lower bound on the worldwide utility benefit to ship operators is 57% of Inmarsat’s MSS revenues (market leader but not the sole provider), about $216 million. As the UK owns 3.2% of the world’s fleet, a lower bound estimate of the benefit to UK owners and operators of maritime fleet broadband is $7 million per annum. Additional benefits derived by port operators and through crew satisfaction and leisure maritime are not possible to quantify. Improving the efficiency of shipping could ensure that more products are shipped (i.e. containers that cannot be shipped profitably without satellite communications, being shipped anyway). The reduced costs of shipping could also be passed on to consumers. Finally, responsible for 4% of the EU total greenhouse gas emissions, any efficiency gains that can be made to the shipping industry will have a lasting effect on the environment.
In addition to merchant shipping, the UK’s more than 300,000 sailboats and inboard motor boats are a potential user group for maritime broadband. As with merchant vessels, access to accurate weather data and keeping in touch with friends and family are key selling points to the boating population.
Broadband to aircraft
Currently, British Airways offer wireless internet on its business class‐only service from London City Airport to JFK (via Ireland), and Norwegian Air Shuttle (UK‐based in Gatwick) have offered passenger access to Wi‐Fi of limited bandwidth for email and IP texting since 2012.
As an additional service offering to its passengers, British Airways announced in June 2014 that they have joined forces with Inmarsat to offer high‐speed broadband to passengers and thus
94 Inmarsat Group Limited (2014) Annual Financial Information Disclosure for the year ended 31 December 2013, available at: http://www.inmarsat.com/wp‐content/uploads/2014/04/2013‐Inmarsat‐Group‐Limited‐Bank‐Reporting‐document‐FINAL.pdf
becoming the launch customer of Inmarsat’s GX Aviation service. British Airways is the flagship airline of the UK. It carries 40 million passengers each year on its fleet of more than 280 passenger aircraft. The company employs 40,000 staff of which 15,000 are cabin crew and 3,600 are pilots. In 2013 the company turned over £11.4 billion.95 British Airways will roll‐out the service starting with domestic UK flights. The service is expected to offer bandwidth of 50Mbps to the aircraft, which can benefits airline and passengers in the following ways:
Airline crew can receive faster and more detailed information and communications than can be transmitted via radio. It is also conceivable that broadband to aircraft could assist in treatment of medical emergencies thus provided appropriate and timely health care to passengers in distress without needing to perform emergency landings. In 1999 British Airways had 1 incident per 11,000 passengers with the vast majority handled by crew and medical professionals on board.
Benefits to passengers derive from the ability to access to all the services of the internet. For leisure travellers, it offers the ability to watch a favourite TV show or movie, browse the internet, social media and email, bringing increased customer satisfaction. On the other hand, business passengers aiming to work on the aircraft will be able to communicate with colleagues and clients, receive materials and improve productivity by accessing more information whilst working remotely.
Ubiquitous M2M
Machine‐to‐machine (M2M), with sub‐markets of energy use monitoring & management, Transport, is one of the technological developments that are most highly anticipated. M2M is a sub‐segment of the wider Internet‐of‐Things. The ability of a ‘thing’ or ‘machine’ to communicate via the internet does not necessarily require space services, but space services could improve the user experience – such as positioning from GNSS, broadcasting or the always‐on connectivity of satellite communication.
A domestic example of energy use monitoring & management is remote and proximity‐controlled thermostats (e.g. NEST). Many people operate their boilers on a timer to save heating costs, however, the boiler switches on whether or not the occupant is actually going to be home as planned. Connecting the boiler to the occupants’ GNSS‐enabled smartphones could enable the boiler to switch on precisely when the occupants are within 15 minutes of home and thus maximise comfort and energy savings.
Milton Keynes’ Internet of Things is the UK’s first city‐wide, open‐access Internet of Things (IoT) network, developed by the Future Cities Catapult in collaboration with Milton Keynes Council, BT, Open University and the Connected Digital Economy Catapult. The system uses analogue TV whitespace which is no longer in use, to connect devices ‐ citizens’ smartphones and household hardware, parking spaces and recycling bins – e.g. embedded sensors to inform the Council of bin collection needs, which is already in place. This example is in an urban network, but as IoT and M2M expand, the importance and enhancement of satellite services will rise.
95 British Airways Plc (2014) Annual Report and Accounts Year ended 31 December 2013, available at: http://phx.corporate‐ir.net/External.File?item=UGFyZW50SUQ9NTYzNTg2fENoaWxkSUQ9MjYzNjgxfFR5cGU9MQ==&t=1; fleet information from: http://www.britishairways.com/en‐gb/information/about‐ba/fleet‐facts; staff information from: http://www.britishairways.com/en‐gb/bamediacentre/newsarticles?articleID=20140901111046&articleType=FactSheets#.VYQ46_lVikp
Location based services (Gaming/synthetic environment)
Location‐based services (LBS) is the largest application of satellite navigation with more than 38 million smartphone users in the UK alone. Access to constant navigation information has become a necessity for many modern people, and the availability of assisted‐GNSS via smartphones is one the most visibly successful applications of space services in the consumer market.
Applications of location‐based services include geo‐tagging, where gamers seek and find specific locations before moving on to the next and augmented reality applications that enable education providers or city tourism boards to construct specific journeys around an area and providing only the information that is relevant to the location of the user.
Based on the installed base presented in the European GNSS Agency’s (GSA) GNSS Market Report Issue 4 and assuming the UK’s share of European devices is proportional to the UK’s share of EU GDP, we derive an estimated total of 93 million GNSS devices in the UK in 2015, across personal LBS, road, aviation, maritime, rail, surveying, agriculture and timing and synchronisation, but primarily smartphones and road navigation devices.
The benefits from improved navigation accrue to both users and non‐users. Users benefit through ability to navigate more efficiently (on foot or in a car) thus avoiding getting lost and reducing travel time and consumables (e.g. fuel). Non‐users primarily benefit through reduced congestion from the more efficient in‐car navigation of users, which reduces their travel time and enables more efficient use of roads. Navigation apps like Google Maps or CityMapper also offer the user the ability to identify relevant public transport options for the journey and reduce road congestion through this channel. Reduced exhaust fumes and noise pollution improves the health of dwellers and environmental impacts on climate change from fuel consumption are reduced.
Benefits from Galileo (Europe’s GNSS) in addition to the benefits derived from US (GPS), Russian (GLONASS) or Chinese (BeiDou) systems are difficult to measure. The European Commission have previously communicated benefits for the EU in the range of €60bn‐€90bn over 20 years of Galileo service.96 Assuming the UK’s share of EU GDP accurately reflects benefits in the UK and converting to pound sterling, this would imply £6.2bn‐£9.3bn over 20 years – an average of £310m‐£470m annually – resulting from the UK government’s investment in Galileo.
Managing unmanned vehicles (RPVs) and hosted payloads
Remotely piloted vehicles (RPVs) require precise information on their location to enable any degree of autonomous or remote operation. Satellite navigation services are an ideal candidate to provide this navigation information and allow remote operators to prioritise interventions. RPVs are used by emergency services to assess the situation and target operations. In burning buildings, for example, the ability to fly over and check whether there are people in windows on the opposite side could be the difference between life and death.
RPVs are also used to assess environmental problems such as volcanic ash clouds without endangering pilots and for surveys of civil engineering works. In the agriculture sector, RPVs improve precision agriculture as they can complement Earth Observation satellites when it is cloudy and provide much higher resolution imagery.
96 European GNSS Agency (2012) Tajani hails Galileo opportunities at London space conference, available at: http://www.gsa.europa.eu/news/tajani‐hails‐galileo‐opportunities‐london‐space‐conference‐0
Though a complete solution in itself, satellite communication has the capacity to fill any existing gaps in mobile and Wi‐Fi coverage in the UK and abroad. Seamless personal communication is an application of space services that allows critical communication to take place no matter the environment. An example of this capability in practice is Avanti’s project HYDRA, which is used by emergency services to ensure they do not encounter a dead signal. Other applications include satellite telephony in remote regions of the World, where foreign correspondents rely on the technology to be able to communicate with head office and the studio, and submit reports in real time.
Project HYDRA is a high speed (60Mbps download and 20Mbps upload), secure 4G LTE mobile network backhauled through satellites for UK’s emergency services. It provides a private overlay cell network over a radius of 2 km, or an area of 12.5 square kilometres, anywhere in the UK, and can operate in both private (completely separate from the general public telecommunications network) or interconnected (roaming) modes. The portable platform enables 4G networks to be deployed immediately where they are needed (when terrestrial networks are overloaded or non‐existent), and can also be installed permanently (e.g. as a network extension) for areas where additional capacity is frequently required.
Emergency services critically require access to high speed communication tools to deal with emergency situations. Project HYDRA enables 4G devices used in the field by operational teams to access the full capability of 4G through addressing the challenges posed by coverage and capacity limitations of 4G networks. Operational benefits for emergency services and disaster victims include the opportunity for emergency services to securely transmit data, to make calls without interference and to locate injured people using the signal from their mobile phones.
London Economics The Case for Space 2015 91
8 | Catalytic effects: R&D and knowledge spillovers
8 Catalytic effects: R&D and knowledge spillovers
8.1 R&D and knowledge spillovers
Knowledge spillovers are highly relevant for the space industry in two important ways. On the one hand, space activities import basic technologies that have previously been developed in other sectors such as defence or aeronautics. For example, national programmes in the defence and aeronautic sectors paved the way for the development of the first national launchers and satellites. On the other hand, space applications and space‐born technologies spill‐over to other sectors. The Bureau d’Economie Theorique et Appliquee (BETA) carried out a series of studies about the spillovers generated by the European space programs, which confirmed both the dependency of the space industry on existing applications and technologies and the benefits of spillovers from the space industry to other sectors and the society at large (Bach et al., 2002). The following analysis focuses on the knowledge spillovers generated by the space industry.
Spacecraft and on‐board appliances have to operate under the unique and often extreme conditions prevailing in space. They need to endure tremendous acceleration, temperature and radiation, while being highly reliable and as small and lightweight as possible. Scientific and technological solutions developed in response to the challenges posed by the space environment often find applications in other sectors (ESA, 2014, p. 268), including defence, transport, energy, consumer goods and healthcare. Space‐born technologies cover areas such as materials, miniaturisation of electric components, software technology, automation, robotics, electronic, sensors, optics, communications, power and energy devices, and knowledge spillovers in these areas can be identified for industrial components, products and production technologies (STC, 2007, p. 8597).
Table 41 Knowledge spillovers from the US space industry
Health & Medicine Transport Public Safety Consumer Goods
Programmable & implantable medication systems (e.g. insulin pump)
Advanced screening and medical imaging
Remote robotic surgery
Liquid‐cooled garments
Tumour treatment (LED)
Infrared ear thermometer
Invisible braces
Vehicle design
Anti‐Icing systems
Safety Grooving
Engine energy savings
Protective coating of bridges & roadways
Ergonomic car seats
Power converters
Radial tires
Lightweight fire‐fighting equipment
Detectors
High‐pressure fire suppression systems
Low‐cost, ballistic parachute system
Memory foam (mattresses, safety equipment)
Enriched baby food
Freeze drying
Thermal protection
Permanent roofing material (Teflon‐covered fibreglass)
Water purification
Durable wind turbines
Environ‐mental sensor products
Cleanup solutions to (underground) pollution
Structural analysis software
Remote control & monitoring
High‐reliability manufacturing
Lubricant coating (scratch‐resistance)
Miniaturisation of electronic components
ource: London Economics based on NASA’s Spinoff Database98S .
97 House of Commons Science and Technology Committee (2007). ‘2007: A Space Policy’, seventh report of Session 2006–07. Available at: http://www.publications.parliament.uk/pa/cm200607/cmselect/cmsctech/66/66i.pdf [Accessed 06 March 2015]. 98 Available at: http://spinoff.nasa.gov/spinoff/database/ [Accessed 06 March 2015].
8 | Catalytic effects: R&D and knowledge spillovers
The US has a particularly long history of space endeavours leading to novel technology solutions, with NASA being explicitly mandated to facilitate technology transfers to other sectors by the National Aeronautics and Space Act of 1958. nearly knowledge spill s s n d rl publ NASA’s Technol Program. Table 41 contains a non‐exhaustive compilation of the advances generated ed
In analogy to NASA, ESA has a dedicated Technology Transtry to othe
sfer Prograr sectors to wider
mme tasked with facilitatrevenues for botknowledge spill
technology donovers from theors and rece
150 t
space induivers and genesfers duri
rate benefits The Programme has estimated that th
the cumulativeoverseen morrevenue genera
e than ranted by those tran
all member
ng the last two to a figu
decades, andre 15‐20 times hisfers amounts
states.99 ESA contributions of
Table 42 Knowledge spillo rs the European
He lth & aMedicine
Transport Publicsume
Non‐invasive
system
Air‐Cooling / air‐
systems
Protective
materials
Remote‐control s
Insulating construction materials
Product lifecycle manageme
Colour validation
Specialised electronic devices
monitoring conditioning ferment system
MRI processing software for detection of diseases
Baby‐monitoring systems
Air‐bag security systems
Protective vehicle shielding
Braking systems Tunnel drilling machines
Cool‐gas fire extinguisher
Fire detector
Anti‐personnel mine detection
Improved waste management
Optimization of wind turbine location
nt interface
Animations in movies / games
Spotting of defective items
Magnetic sensors
Laser scans for rooting out counterfeit foods
Potato crisp packaging
Source: London Economics based on ESA’s Technology Transfer Programme100.
Case study evidence shows that ESA contracts, along with support provided by the UKSA, other government agencies and national research councils, also provide a platform for the development and diffusion of space‐born technologies in the UK (BIS, 2010, p. xiv), with selected examples described below.
A spin out from
Credit: Thruvision Systems Ltd
the STFC, ThruVision Systems Limited (TSL) exploits terahertz imaging for security applications. The company’s security scanners can detect explosives, liquids, narcotics, weapons, plastics and ceramics hidden under clothing. The technology was originally derived from work pioneered for space imaging and earth monitoring applications within the UK at the Rutherford Appleton Laboratory, supported by an ESA programme (BIS, 2010; STFC, undated).
299 Available at: http://www.esa.int/Our_Activities/Space_Engineering_Technology/TTP [Accessed 06 March 2015].
100 Available at: http://www.esa.int/Our_Activities/Space_Engineering_Technology/TTP2 [Accessed 06 March 2015].
8 | Catalytic effects: R&D and knowledge spillovers
Anson Medical Ltd is a spin‐off company
Credit: Anson Medical.
tension
of Brunel University that applies Shape Memory Alloys (SMAs) to medical services. It was created in 1994 afte cher runel University for Bioengineering xperime SMAs for use pean space programme. The alloys, which return to a p if
asks,
Anson Med e dy, for example e
of teet ing n also be ing toget
son Medical is the developm medical C,
2007).
um.
s College London (KCL) in cooperation
loading system that simulates the effects of the Earth's gravity in space.
help for
to enable plane
y Reaction
h e l
tpresented in this chapterwider applications of the s gy of rethat while knowledge spi societal benefits is smaller d to spillovers into direct space applications such as broadcasting or telecommunications (Technopolis, 2007 as cited in BIS, 2010).
r resear had e
s at Bnted with
’s Institute in the Euroarticular shape
heated to the and have be
right temperature,en considered for
are able use in spa
ical Ltd appli
to carry ouce for vari
es SMA’s to gdontic spri
t repetitive tous micro‐actuationood effect in thapplications.
uman bodisplacementh through ortho
h or to open up blockedngs controlling theries. SMA spr art
n across a ensure co
Medic
elements ca placed under tensioher broken bones to was sold to Lombardent of SMA
fracture, with therect bone draw
In 2001, Ancontinuing
r reunion.al. The company
devices (BIS, 2010; ST
A ‘skinsuit’ developed by King’with the Massachusetts Institute of Technology (MIT) helps overcome degradation of bone and muscle mass as well as spine decompression in astronauts exposed to microgravity (see also Box 15). The suit utilises horizontal strips of a lightweight elastic material to create a pressure
Credit: Dr Simon Evett, UK Space Biomedicine Consorti
The researchers from KCL believe that the suit could be used toreduce bone and muscle loss due to old age, and the material usedthe suit might be suitable for support clothing for cerebral palsysufferers (Evetts & Whiteley, 2012).
SABRE, the Synergetic Air‐Breathing Rocket Engine intended the creation of a fully reusable and single stage to orbit space(SKYLON), is a highly innovative technology developed b
Credit: Reaction Engines.
It is inherently difficult
Engines (see Box 17). The engine extracts the oxygen it needs to fly (at lower altitudes) from the air itself, using a combination of a pre‐cooler heat exchanger and a compressor to raise t e air pressur (Hempse l et al., forthcoming, p. 1). The same technology might be used within the atmosphere to shorten flight times for long‐distance flights: it is estimated that SABRE would allow an airplane carrying 300 passengers to fly from Europe to Australia in about four hours. In addition, the engine’s innovative heat exchanging technology could be used for desalination plants.
o track and quantify knowledge spillovers, and the set of examples is far from being exhaustive. Technopolis (2007) found that out of all UK space industry, knowledge spillovers constitute the most significant levance to other economic sectors. However, the same study concluded llovers are occurring more frequently, their value in terms of overall
compare
ource of technolo
94 London Economics
The Case for Space 2015
9 | Catalytic effects: Education, exploration and space science
9 Catalytic
9.1 Science,and care
the UK space economyPlan and add 100,000pool of qualified workers
eff n
Teer
If add
e Science,r s to stimulate interest in STEM.
103), the design of the mission patch and even a
nts Pi’ pocket sized
computer, and deployed on‐board the ISS by Major Peake.
The UK Space Agency has also partnered with the Royal Horticultural Society (RHS), the UK’s leading gardening charity, for ‘Rocket Science’, an educational programme sending 2kg of rocket (the salad variety) seeds to the ISS with Major Peake. On his return, the seeds will be distributed to thousands of UK schools, giving around half a million children the chance to learn how human space exploration contributes to our knowledge of life on Earth.
ects: Education, exploratio and space science
chnology, Engineering and Maths (STEM) education s
is to grow to successfully fulfil the ambitious Space IGS Growth Action itional high‐skilled jobs, a key requirement is that there is a sufficient to select from. The importance of space in young people’s decision to
Technology, Engineering and Maths (STEM) is often stipulated, but ection discusses three initiatives intended
ducate themselves inarely documented. This
Major Timothy Peake is the first British member of the European Space Agency’s astronaut corps, and will become the first Briton to visit the ISS under the Union Flag101 when his Principia mission launches at the end of November 2015. As well as delivering invaluable scientific research, cutting edge technology, and firsts in British manned spaceflight; it has been hoped since mission conception that the programme will boost participation and interest in STEM subjects among school children.102 Public involvement has been evident in the naming of the mission (Principia was chosen in a competition, reflecting Isaac Newton’s most famous workcompetition amongst school children to produce a meal for Major Peake to eat in space104.
The UK Space Agency in cooperation with the Raspberry Pi Foundation and the UK space industry have launched a competition amongst Primary and Secondary UK students to devise and programme their own experime and applications coded on a new ‘Astro
101 Several British nationals have been to ISS either privately or through NASA (dual citizenship). 102 There is an ongoing piece of research seeking to assess whether human spaceflight inspires school students to study science, technology, engineering and maths (STEM) subjects – for more information, please see: https://www.gov.uk/government/news/does‐human‐space‐flight‐influence‐the‐uptake‐of‐stem‐subjects 103 “Mission Principia: Time Peake picks name for his 6‐month mission to ISS” – UK Space Agency: https://www.gov.uk/government/news/mission‐principia‐tim‐peake‐picks‐name‐for‐his‐6‐month‐mission‐to‐iss 104 “Children of Great Britain entered into a competition to design a meal…” – European Space Education Resource Office ‐ http://www.esero.org.uk/news/tim‐peake‐great‐british‐space‐dinner‐and‐mission‐patches
Principia mission patch
London Economics The Case for Space 2015 95
9 | Catalytic effects: Education, exploration and space science
These outreach programmes used by the Principia mission may already be having an effect in inspiring participation in space; a 2015 YouGov poll found that over 1 in 4 people say they would like to become an astronaut.105 The gender difference in attraction to STEM is striking however,
n to STEM nt statistic to address if the 100,000 additional space jobs are to be filled.
with men 22% more likely than women to want to be an astronaut (as a proxy for attractio careers) – an importa
Figure 29 The most desirable jobs to have in Britain today – overall and by gender
In addition to these concrete exampthe space economy that could attract
9.2 Space exploration b
So far, this report has focussed on the elements of space that have terrestrial applications, through exploitation of satellite services. spaceastronomers attemgreat public. exploration
les, exploration of deep space is another fascinating aspect of young people into STEM careers.
eyond earth orbit
However, the aspect of exploration of deep space pting to answer the fundamental questions in science has
The box below discusses the most recent high‐profile space and cosmologists
appeal to the general mission, Rosetta.
105 The most desired jobs in Britain – Astronaut (27%) ‐ https://yougov.co.uk/news/2015/02/15/bookish‐britain‐academic‐jobs‐are‐most‐desired/
9 | Catalytic effects: Education, exploration and space science
Box 12 Prominent role for UK technology in ESA’s successful Rosetta mission
The ground‐breaking Rosetta mission succeeded, with the Rosetta orbiter landing its cometary lander module, Philae, on comet 67P/Churyumov–Gerasimenko on 12th November 2014. This first in planetary science was achieved after a transit period of more than 10 e rs with the launch taking place in March 2004. y a , As a project (ESA), of which the UK is of the European Space Agencya constituent ion was already secured member, British participatthrough the mission. However, increased funding of a portion of the involvement ring and design process of was present in the manufactuthis project. ractors (9 for the Rosetta orbiter106 and 3 for the Philae lander107) In fact, at least 12 British contwere involved from batteries for the orbiter, antenna for communicating with in building items ranging Earth, landing eel on Philae. gear, and the momentum wh Significant ac so present, with UK scientists and institutions involved in 10 of ademic contributions were alRosetta’s 21 from Oxford University, Queen Mary University of London and experiments108; with scientiststhe University analysing data from the VIRTIS, CONSERT and OSIRIS experiments of Kent working on and respectively. In addition, es of ovens on the Philae lander that would analyse the comet’s the Ptolemy experiment, a serimaterial to arguably one of the most important on‐board payloads, was investigate it’s surface, and completely the Open University in collaboration with STFC RAL Space of designed, built and led by
109 Oxfordshire. This combinati ing work on Rosetta ensured that British experts were always at on of academic and engineerthe centre of the mission, with trickle down effects from knowledge and experience gained on the project seeming likely. ESA also produced a high budget, English language short film called Ambition, to act as an evocative and awe‐inspiring promotion and companion to the mission. Ambition premiered at the British Film Institute, 2014.110
Rosetta and Philae, artists impression
o rc : London Economics based on secondary research
the same sphere of activity, one of the highly anticipated exploration missions is the ESA
S u e
In mission to Mars, ExoMars, which is presented in the box below.
106 Industrial involvement in the Rosetta Mission ‐ ESA ‐ http://sci.esa.int/rosetta/54180‐industrial‐involvement‐in‐the‐rosetta‐mission/ 107 Industrial involvement in the Philae lander ‐ ESA ‐ http://sci.esa.int/rosetta/54181‐industrial‐involvement‐in‐the‐philae‐lander/ 108 UK Involvement in Rosetta ‐ https://www.gov.uk/government/case‐studies/rosetta 109 Lander Instruments ‐ Ptolemy ‐ ESA ‐ http://sci.esa.int/rosetta/31445‐instruments/?fbodylongid=896 110 http://www.esa.int/spaceinvideos/Videos/2014/10/Ambition_the_film
9 | Catalytic effects: Education, exploration and space science
Box 13 ExoMars programme 2018, with the UK taking overall leadership of the rover module
The ExoMars programme, announced in its original form by the European Space Agency in 2005, is a two part mission with the ultimate goal of searching for evidence that points towards the past or present existence of Martian life. ExoMars will be collaboratively operated by ESA and member nations, as well as Roscosmos, the Russian Federal Space Agency. The first half of the mission consists of a Trace Gas Orbiter, due for launch in the January of 2016, and contains NOMAD, an instrument which “identifies components of the Martian atmosphere” with UK support in the form of research collaboration.111 However, it is the second half of the mission, the ExoMars Rover due to be launched in 2018, that the UK is securing a lead role in developing. The minister formerly responsible for the UK Space Agency, Greg Clarke MP, announced on the 12th December 2014 that an extra £47.7m of government money will be poured into ExoMars to “retain leadership of the Mars rover development”. This investment, on top of ESA payments already derived from the UK’s contribution to the organisation, also ensure that the UK will “play a leading role” in the ExoMars programme as a whole.112 This enables the development, building and testing of the rover, as well as some of the on‐board instruments, to be entirely undertaken in the UK by Airbus Defence and Space, and makes the first non‐American Martian rover a very British affair. Benefits accrued from this extensive involvement in the ExoMars programme will come in the form of both permanent and transitory highly skilled jobs (from research and operating positions to physical development of the rover), capital investment and the development of a space infrastructure (a world‐leading Mars Yard to simulate the Martian surface environment and an “advanced clean room” have been created in Stevenage, Hertfordshire, in order to enable rover production113), the utilisation of any R&D multipliers that arise through the duration of the programme and an active inspiration for the British public.
ExoMars rover prototype, ‘Mars Yard’, Stevenage
Source: London Economics based on secondary research
Lunar Missions ltd. is a crowd‐funded mission to the Moon, whose success in obtaining the
necessary funding and heavy UK slant on backers shows a large following for space in the UK. The box below has more information.
111 Trace Gas Orbiter instrument list ‐ ESA ‐ http://exploration.esa.int/mars/48523‐trace‐gas‐orbiter‐instruments/ 112 £47.7 million to play a leading role in Europe’s Mars mission and retain leadership of Mars rover development – for more information, please see: https://www.gov.uk/government/news/uk‐space‐industry‐set‐to‐rocket‐with‐over‐200‐million‐of‐new‐investment‐for‐europes‐space‐programme 113 Airbus Defence and Space opens state‐of‐the‐art Mars Yard ‐ https://www.gov.uk/government/news/airbus‐defence‐and‐space‐opens‐state‐of‐the‐art‐mars‐yard
9 | Catalytic effects: Education, exploration and space science
Box 14 Lunar Mission One – a successfully crowd‐funded UK‐led mission planned to thmoon's South
e Pole
Aimed at being both a successful scientific study of the Moon’s South Pole, as well as an educational outreach programme inspiring children and young people to become excited by STEM, and specifically Space114, subjects, Lunar Mission One was announced at the 2014 Re‐inventing Space Conference, held in London by the British Interplanetary Society. After being unveiled by Lunar Missions Ltd, a clear community engagement strategy was immediately apparent with the creation of a Kickstarter115 campaign, proceeds from which would be used to fund the first development phase of the project.
Lunar Mission One
This fundraising campaign proved popular; over 7,000 people pledged money to the project, ranging from £3 to £5,000, and exceeding the project’s initial goal of £600,000 to secure just under £675,000 (over USD$1m) in funding.116 This level of support has proven that a project of such potential magnitude can capture the public’s imagination and garner the support of a community willing to fund its development. With a timeline that consists of instrument and engineering development in the late 2010s, and spacecraft assembly in the early 2020s, a launch is already forecast for 2024117. As well as the scientific instruments that will fly to the moon, Lunar Missions Ltd plan to deposit a billion year time capsule of life on Earth, and adding private messages (so contributors can place MP3 messages or even their own DNA) , in an attempt to maximise the level of public interest, involvement and funding. In working with British educational establishments on this project (UCL, The Open University and many others) and having a constituent team of scientists based in the UK, the collection of scientific data has a large potential for knock on effects across the educational and scientific establishment. Further, to build upon the public involvement aspect already seen, the Lunar Missions Trust has been set up as a not‐for‐profit organisation to oversee the project for public good, including the creation of a long term funding legacy; full educational resources along with a public archive will be created.118 As a global project, most of the project’s implementation (engineering, science, revenues, education) will be overseas. But the UK’s origin and influence is reflected by the heavy initial Kickstarter backing from the UK – 70% by number of backers and 80% by value. Source: London Economics based on secondary research
9.3 Space science
The International Space Station is an important test bed for scientific experiments, and one the UK has recently committed to funding in order to gain access to. Experiments in space offer conditions that help scientists understand the behaviour of matter, by removing gravity. The box below discusses biomedicine as an example of an area aided by space.
114 Lunar Mission One has three main aims… ‐ http://launch.lunarmissionone.com/index.php/lunar‐mission‐one/introduction
115 Kickstarter.com is a crowd‐funding website where interested parties can pledge a one‐off payment to a developreturn for perks. The sum of monies is only transferred to the project developers if their funding target is exceeded. 116 LUNAR MISSION ONE: A new lunar mission for everyone. ‐ Kickstarter ‐https://www.kickstarter.com/projects/lunarm117 Lunar Mission One press pack ‐ Media Area ‐ http://launch.lunarmissionone.com/index.php/component/rsfiles/files 118 Global engagement timings – Lu
9 | Catalytic effects: Education, exploration and space science
Box 15 Biomedicine – using space as a vehicle for biomedical research to benefit terrestrhealthcare
ial
With commercial spaceflight likely to become operational in the coming years, advances in space biomedicine to improve human’s health and ability to live and work in space are crucial. Many physiological problems faced by humans during spaceflight are still not fully understood, examples of which are muscle wasting, bone loss, cardiovascular de‐conditioning and loss of neuromuscular control (Evetts & Whiteley, 2012). As a spin‐off effect, research concerned with resolving space‐related biomedical conditions can result in Earth‐based healthcare gains. The space and healthcare sectors both face biomedical challenges that are closely aligned, as the physiological conditions caused by weightlessness in space resemble those of ageing on earth (Everts, 2015; Robinson, 2012). The examination of numerous biological and physical systems in the space environment, under the associated unique and unusual circumstances, can drive terrestrial research and particular healthcare innovation (Evetts & Whiteley, 2012; Robinson, 2012). For example, the technology used for a ‘skinsuit’ currently being developed by researchers at King’s College London, Massachusetts Institute of Technology (MIT) and the European Space Agency (ESA), mimicking the gravitational pull experienced on earth to avoid spinal lengthening and associated lower back pain occurring in space, might be suitable for support clothing for cerebral palsy sufferers (Evetts & Whiteley, 2012). In the absence of gravity, body‐fluids shift head‐ward, leading to heightened intracranial pressure that can result in visual impairment. In response to this, the University Hospital Southampton developed a non‐invasive means to measure changes in pressure within the brain to enable better monitoring of astronauts. This non‐invasive measuring system provides a valuable tool to hospitals for the treatment of patients with head injuries (Evetts & Whiteley, 2012). In the UK, the Space Life and Biomedical Sciences Association (UK Space LABS) provides a unified, national space biomedicine strategy and facilitates liaison in the field. The organisation aims to improve communication, cooperation and collaboration between UK based academic, industrial and government organisations involved in research, healthcare, outreach and educational activities related to space life and biomedical sciences and the human element of human spaceflight (Ward, 2015).
Credit: UK Space LABS
Source: London Economics based on secondary research
100 London Economics
The Case for Space 2015
10 | Future prospects of the UK space economy
10 Future prospects of the UK space economy
e industry to be chieved by 2030. Published three years later, the
th path required to
0.2 Strengths of the UK space economy
ace activities. Satellite ommunications, for example, is a key area of UK expertise, with UK companies leading the
, and Direct‐to‐Home satellite broadcasting enjoying a large proportion of the market for television provision in the country. The UK also plays a strong role in Earth Observation with leading manufacturers of cubesats and small satellites located here. Key manufacturers of user equipment for satellite navigation have bases in the country, and the industry is well placed to develop further applications in the future. In addition, UK companies have performed well in terms of the European Galileo programme, of which many contracts have been won. Furthermore, the EU’s R&D support programmes (the Framework Programmes and Horizon 2020) have given UK companies access to international collaboration and large funding opportunities.
In terms of the research base, a diverse range of UK universities contribute to ESA programmes (please see Box 7 for more information) contributing hardware, software and science to the missions.
orld’s space economy
Action Plan also sets an interim target of
10.1 Introduction
The Space Innovation and Growth Strategy 2010 (Space IGS) identified and benchmarked the UK space industry’s abilities and opportunities, and established a strategic approach to realise several overall targets for the size of thaSpace Growth Action Plan refined the Space IGS targets and approaches for the years 2014 to 2030, and defined more specific objectives to be reached over the period.
The study further analysed the current position and considered the future grow
from 6.5% to 10% by 2030. By today’s estimates this would lead to a UK sector with £40 billion per annum of space‐enabled turnover and the creation of 100,000 new jobs. This Space Growth
achieve the government’s objectives, as set out in the Space Innovation and Growth Strategy 2014‐30 and the Space Growth Action Plan, in the context of actual historical growth rates.
8% of the world’s space economy by 2020 that will secure a space‐enabled turnover of £19 billion in today’s terms.”
This section considers again the prospects for future growth and how this can translate to future economic impact, to the extent that either may be predicted.
Space Innovation and Growth Strategy 2014‐2030 Space Growth Action Plan
1
10.2.1 Space economy capabilities
Organisations in the UK space economy cover a diverse array of spc
“This report re‐affirms our ambition to grow; and identifies the new actions that are needed to deliver further growth. These actions underpin the target set in 2010: to grow the UK’s share of the w
manufacture and operations of satellites
London Economics The Case for Space 2015 101
10 | Future prospects of the UK space economy
10.2.2 National space activities
it further through national missions such as TechDemoSat‐1, UKube‐1, and NovaSAR‐S designed to strengthen the
creased the support that is available for space ator Har see Cou
bina
e dyhown throughout this report
national environment for space excellence is strong.
onal Eu
A strong national environment is conducive to internatio exp an ropean Union (GMES, EGNSS). Furthermore, a
panies continue to field competitive tenders for ESA contracts and retain the country’s high geo‐return coefficient. The UK’s
international funding and able to affect standardisation and regulations that may play to the advantage of the existing UK industry. The
n to ESA already resulted in the European Centre for and Telecommunications (ECSAT) in Harwell, as well as Major Tim Peake’s
The space economy is large and growing. The global space economy is valued between US$ 256
wed in the most recent year, but still registered strong growth of 4%.
The UK Space Agency has recognised this expertise, and seeks to develop
knowledge base even further.
As shown in Section 4.2.2 the UK Government has inactivities in recent years. In addition, the incubApplications Catapult and ESA Business Incubator inthat would otherwise come at a high cost (pleasefunding include the Science and Technology Facilities
These strengths of the UK space economy in combuilding a spaceport to ensure access to space (by 2018)strategy (in the IGS), which has a strong focus on thchain (which has been s
environment, particularly the Satellite well, gives small firms access to expertise Section 5.6). Other national sources of ncil (STFC) and InnovateUK.
tion with the country’s commitment to and the clearly defined long term space namic applications segment of the value to dominate in size) all ensure that the
companies to set up subsidiaries or take rope.
It is this strength that has convinced large internatiover UK companies, and use the UK as the gateway to
10.2.3 International space activities
nal excellence, and the UK has shown for loit contributions made to the Europemany years that its industry is very well placed to
Space Agency and space missions related to the Eulikely by‐product of the national space missions is that UK com
membership of these institutions means it is able to access
UK’s membership and increased contributioSpace Applicationsmission to become the first astronaut under the British flag aboard the International Space Station.
In addition to existing programmes, the UK space economy is well placed to supply hardware and services to a potential EU defence force that would rely on EU navigation and communications infrastructure.
10.3 Potential growth path
10.3.1 Growth of the global space economy
billion119 and US$ 314 billion in 2013, and has been growing consistently at a compound annual growth rate of 7.3% over the past 8 years.120 Reflecting the challenging macroeconomic climate growth slo
119 OECD (2014) The Space Economy at a Glance 2014. 120 Space Foundation (2014) The Space Report 2014.
102 London Economics
The Case for Space 2015
10 | Future prospects of the UK space economy
10.3.2 UK industry
As presented in Section 3.1, with a compound annual rate of 8.8% since the turn of the century, the UK space economy has outperformed the global space economy and increased its share of the market.121 Growth in the global space economy stimulates growth in the UK through the large share of UK space economy turnover that is generated in foreign markets through exports.
Figure 30 Space Growth Action Plan targets
mpound 20 enes, in line with the base year used in the Space Growth Action Plan.
Source: London Economics analysis and Space Innovation and Growth Strategy Steering Board (2013).
idering the composition of the space economy and its slant towards the DTH segment of space applications, in other words, there is a limited scope for increasing turnover in
bscribe to the service. Given this caveat, the markets of high growth potential that have been identified in the Space IGS will need to materialise for the UK
From a starting point of £9.1bn and 6.5% of the global market in 2010, the growth strategy set out in the Space IGS targets 8% of the global market by 2020 and 10% by 2030. Based on the IGS Group’s projections of the global market size, this was found to equate to £19bn and £40bn, respectively.
As the figure below shows, this ambitious growth profile can be achieved if the space economy is able to return to the prevailing long‐term growth rate since 1999/00 following the relative slow‐down in recent years. The figure also shows the short‐term objective in 2019 requires stronger growth than the long‐term objective in 2030.
Note: Arrows indicate compound annual growth rates of UK space industry. Figure presents values required to achieve the target of £19 billion by 2019/20 (based on a co annual growth rate of 8.0% between 12/13 and 2019/20). All values are pres ted in 2010/11 pric
It should be noted, however, that a real increase of £8bn over seven years will be challenging, especially cons
DTH when 40% of households already su
space economy to reach the target.
The Space IGS targets an export share of 60% by 2030 from a starting point of 22% in 2010. As this report shows, the export share already increased to 31% in 2012/13, and based on that growth, it should be possible to reach the target.
ollar and the pound sterling (ranging from 1.36 $/£ to 2.11 $/£) comparisons of
l figures should be interpreted with caution.
121 Due to exchange rate fluctuations between the US dthe size of the space economy between UK and globa
3.7
4.3
4.7
5.0
5.5
5.7
6.0
6.5 7.4 7.9 8.6 9.2
10.6
11.1
12.0
12.9
14.0
15.1 16.3 17.6 19.0 20.5 22.1 23.8 25.6 27.6 29.7
0.0
10.0
20.0
1999/00
2000/01
2001/02
2002/03
2003/04
2004/05
2005/06
2006/07
2007/08
2008/09
2009/10
2010/11
2011/12
2012/13
2013/14
2014/15
2015/16
2016/17
2017/18
2018/19
2019/20
2020/21
2021/22
2022/23
2023/24
2024/25
2025/26
2026/27
2027/28
2028/29
2029/30
£billion, 2010/11
pr
£19 billion by 2020
32.0 34
.5 37.1 40
.0
30.0ice
40.0£40 billion by 2030
s
7.7%
8.0%
7.9%
8.8%
London Economics The Case for Space 2015 103
10 | Future prospects of the UK space economy
10.3.3 Comparison with UK GDP growth forecasts
The figure below shows the UK space economy’s growth rate since the turn of the century compared with GDP growth. The pale colours indicate forecasts.
Figure 31 UK GDP compared with space turnover
Source: London Economics analysis of Size and Health data and OBR (March 2015), Economic and fiscal outlook.
As the figure shows, the UK space economy has consistently grown faster than UK GDP, and fluctuates around the value that would be required to achieve the long‐term target defined in the Space IGS. The forecasts of space economy growth simply assumes the average difference between space economy turnover and UK GDP growth will continue into the future, and thus adds this value to OBR’s forecasted GDP profile.
10.4 Game‐changers/catalysts/wild cards
So far this forward‐looking chapter has considered growth in the space economy from a ‘status quo’ perspective assuming the existing space economy will remain largely unchanged. However, so much is changing in the UK and global space economy that it is almost impossible to predict how this will impact on the UK organisations, but what is informative is to identify the factors that are likely to influence the achievable growth rate.
of investment in R&D, exploration and infrastructure development, we are entering a ‘New Space Age’ – the age of applications. The
lications sector (accounting for 78% of the UK space economy) and dedicated focus on applications in the business incubator programmes and public funding opportunities, the UK is well positioned to grow its application business and capture a larger share of a growing world market.
New services and events could change the complexion of the space economy, and revolutionise the path towards the IGS targets.
New Space Age
Thanks to decades
relationship of the average UK citizen or company with space has changed more in the last decade than in the previous four.
With a strong space app
7.85%
1999/
2000/
2001/
2002/
2003/
2004/
2005/
2006/
2007/
2008/
2009/10
2010/11
2011/12
2012/13
2013/14
2014/15
2015/16
2016/17
2017/18
2018/19
th
10.0%
15.0%
20.0%
p.a.
Space IGS 2029/30 target growth
‐5.0%
0.0%
5.0%
Real % grow
‐10.0%
00 01 02 03 04 05 06 07 08 09
UK real GDP growth (% year) Space industry turnover, real CAGR (% year)
104 London Economics
The Case for Space 2015
10 | Future prospects of the UK space economy
Rising commercial dominance
and commercial sector activities. The Space Report, for example reports that government accounted for 33% of global space activ
The rising applications segment also makes its mark on the split between government
ity is 2009, which had dropped to 24% in 2013.
and UK
–
larger (e.g.
$19
connectivity, and satellite communications remain a unique technological option. The
companies will benefit from the observable trend in for example 85 nanosatellites were
atellites launched per year over 2008‐11.123
‘NewSpace’ is a term coined to refer to a nascent, but rapidly growing, global
a number of the following characteristics:124
Reliance on private finance (sometimes supported by government contracts) approach to yield a competitive price
Internationalisation of space value chains
Like other economic sectors, the space economy needs to adapt to globalisation ensure its success in the face of competition from the rest of the World. companies have been successful in winning contracts from ESA and NASA, and showntheir ability deliver missions in many other countries (e.g. Nigeria and KazakhstanSSTL). Internationalisation is an opportunity for UK companies to cater to a market, but also a challenge as it means foreign suppliers offer products as well Inmarsat buying satellites from Boeing rather than domestic suppliers).
In recent years, the UK space economy has enjoyed strong growth rates in exports,suggesting companies are starting to better exploit this opportunity.
Internet of everything and everywhere
In the future, the Internet‐of‐Things will become the Internet‐of‐Everything. Variousproviders have forecasted the market, but as the scope is unclear at present,forecasts vary. Cisco122 forecast that Internet‐of‐Everything will create value of trillion over the next decade. In order to create value, the ‘things’ need constant
value added will also be boosted if the ‘thing’ knows where it is, so it is reasonable to expect many devices to be equipped with GNSS‐capability.
Trend towards smaller satellites
SSTL and Clyde Space are prime examples of UK market leaders in small satellites and cubesats, respectively, and thesmall satellite launches in recent times. In 2013,launched, a substantial increase on the 10‐20 s
Smaller satellites are becoming especially relevant with the clusters/constellations envisaged for Low Earth Orbit (or lower) that can provide remote sensing, satellite broadband and many innovative new services in the future.
Radical and new business models
community of entrepreneurs, private companies and organisations active in the space economy, possessing
Low cost Clean sheet design and innovation driven technological development
approaches differ significantly from mainstream space industry Incremental development funded by commercialising limited capability models
see 122 Please https://agenda.weforum.org/2014/01/are‐you‐ready‐for‐the‐internet‐of‐everything/ Works (2014) Nano/Microsatellite Market Assessment, available at: 123 Space
http://www.sei.aero/eng/papers/uploads/archive/SpaceWorks_Nano_Microsatellite_Market_Assessment_January_2014.pdf 124 Sources consulted: Space Frontier Foundation http://spacefrontier.org/what‐is‐newspace/. Lindsey, Clark S. "Defining NewSpace", Hobby Space http://www.hobbyspace.com/NewSpace/index.html#Define.
London Economics The Case for Space 2015 105
10 | Future prospects of the UK space economy
Target commercial markets ‐ clients, high net worth individuals and mass market
space
of spacecraft and satellites into orbit, and to
as the main
2m) for Ariane 6 for the SpaceX Falcon 9.
€37.5m (£12m‐£28m) and cessful completion could revolutionise access to space,
consumers Lucrative payoff potential from demand volume and economies of scale Aim to increase human presence in space an original feature, since widened
Low‐cost access to
Access to space refers to the delivery payload accommodation support once on orbit. Currently, low‐cost and timely access to space, particularly for small payloads, is problematic – requiring ride‐sharing as a secondary or ‘piggy‐back’ payload, often resulting in delays or being ‘bumped’ for priority payloads. If low‐cost access to space became a reality, not only commercial operators would be able to implement innovative applications faster and at lower risk, but research institutes would also be able to add to the human knowledge base. UK manufacturers of small satellites would derive additional sales obstacle would be reduced.
Benchmark launch prices in the current and near future are €70m (£5125(when completed) and $61m (£40m)
The UK does not possess conventional rocket launchers but the expertise and knowledge required is still present from heritage projects and vehicles.
The UK Government’s commitment to building a spaceport by 2018 is an important initial step on the way to low cost access and the SKYLON space plane currently under development by Reaction Engines Limited could exploit such infrastructure and generate substantial economic activity.
SKYLON is expected to command launch costs of €16.2m to its and the UK Spaceport’s sucoffer a low‐cost alternative, and ensure a large number of commercial space launches from UK territory.126
125 London Economics (2014). “Feasibility Study of the Business Plan for a SKYLON‐based European Launch Service Operator”, a
and Sadlier, G. (forthcoming). “A presented at IAC 2014 in Toronto IAC‐14.E6.3.8)
ator”, a
ready presented at IAC 2014 in Toronto IAC‐14.E6.3.8)
confidential report for ESA, but main findings published in: Hempsell, M., Aprea, J., Gallagher, B.Business Analysis of a SKYLON‐based European Launch Service Operator” (already126 London Economics (2014). “Feasibility Study of the Business Plan for a SKYLON‐based European Launch Service Operconfidential report for ESA, but main findings published in: Hempsell, M., Aprea, J., Gallagher, B. and Sadlier, G. (forthcoming). “ABusiness Analysis of a SKYLON‐based European Launch Service Operator” (al
106 London Economics
The Case for Space 2015
10 | Future prospects of the UK space economy
Box ture: 2018) 16 Spaceport UK (fu
The G overnment’s Space Innovation and Growth Strategy 2014‐2030 and Space Growth Action Plan both include the Government’s ambition to establish a spaceport in the UK by 2018.127 On the basis of an 18‐months review of the operational requirements of the commercial spaceplane and spaceport industry, carried out by the UK Civil Aviation Authority (CAA), ministers revealed 8 potential airfields that could host a spaceport in July 2014. After further consultations, a number of options have been excluded, and the government issued an updated shortlist in March 2015 including: Campbeltown, Glasgow Prestwick, and Stornowa land and y in Scotland; Newquay in EngLlanbedr in Wales. RAF Leuchars is also included as a
Credit: Department for Business, Innovation & Skills, Department for Transport, UK Space Agency, Civil Aviation Authority
potential temporary facility.
One important consideration was location, with airfields required to be easily accessible for both employees and rmal air traffic visitors, but located at a coastal location away from densely populated areas and noroutes for safety reasons. Further criteria were favourable meteorological conditions and the ability to comply with standard environmental regulations on noise, air quality and storage of hazardous materials. Finally, candidate airfields had to be established large sites with a runway that is, or is capable of being extended to, 3000 meters in length.
Currently, an overwhelming majority of space launches take place from the US, Russia or China. Centre Spatial Guyanais (CSG) Spaceport in French Guyana, is the European facility.128 A UK spaceport would
the UK as a European centre for space launch and a leader in the space market.129 Moreover, it establishwould make the UK an attractive location for space plane operators and manufacturers, attract regional and international the way for commercial spaceflight.130 investment, and pave
The economic case for a UK spaceport is supported by two economic studies. The first study, completed by London Economics131 proved the financial and economic viability of a UK spaceport, with positive cumulative net revenues from year 9 onwards and totalling in excess of £550m over 25 years. The study also completed a social cost‐benefit analysis of costs and benefits accruing to society as a whole, not just the spaceport operator, finding a Net Present Value of £540‐590m. The second study by the Satellite Applications Catapult132 found that the spaceport has the potential to create about 2,000 new jobs and generate £320m of additional economic activity from suborbital human spaceflight, satellite launch, regional tourism and microgravity research by 2028.
Sources: London Economics based on secondary research.
127 Space IGS (2010). ‘Government’s Space Innovation and Growth Strategy 2014‐2030’. Available at: http://www.nottingham.ac.uk/grace/documents/resources/marketreports/spaceigsexecsumandrec.pdf and Space IGS (2014). ‘Space Growth Action Plan’. Available at: https://www.gov.uk/government/uploads/system/uploads/attachment_data/file/298362/igs‐action‐plan.pdf 128 The only operating spaceport in Europe, Spaceport Sweden located within the Arctic Circle, is exclusively used for sounding rockets. 129 Civil Aviation Authority (2014). ‘UK Government Review of Commercial Spaceplane Certification and Operations. Summary and Conclusions’. Available at: https://www.gov.uk/government/uploads/system/uploads/attachment_data/file/329756/spaceplanes‐summary.pdf 130 Civil Aviation Authority (2014). ‘UK Government Review of Commercial Spaceplane Certification and Operations. Summary and Conclusions’. Available at: https://www.gov.uk/government/uploads/system/uploads/attachment_data/file/329756/spaceplanes‐summary.pdf 131 London Economics (2013). ‘Towards a UK launch infrastructure, Economic analysis work package’. Unpublished study, part of the Space Collaborative Innovation Team Initiative (Space CITI) programme within the UK Space Agency’s National Space Technology Programme (NSTP) 132 Satellite Applications Catapult, University of Oxford, SAID Business School and UK Space Agency (2014). ‘SpaceportUK ‐ Forging Ahead With Commercial Confidence’
London Economics The Case for Space 2015 107
10 | Future prospects of the UK space economy
Box 17 SKYLON (future 2025+)
SKYLON is an unmanned, fully reusable spaceplane of 84m length that can take off from a conventional runway, fly directly to low earth orbit with cargo of up to 15 tonnes and return to earth for a runway landing, just like normal aircraft. It ais currently under development by Reaction Engines, based in the UK, and planned to become operational in the mid 2020s.
In a 2011 report, the European Space Agency concluded that SKYLON can be realised given existing technologies and the successful development of the Synergetic Air‐Breathing Rocket Engine (SABRE), which will be used by SKYLON in the early part of the flight before switching to full rocket mode. SABRE extracts the oxygen it needs for low atmosphere flight from the air itself, using combination of a pre‐cooler heat exchaa nger to cool the hot atmospheric air entering it at high speeds and a compressor to raise the air pressure high enough to used as the oxidiser.133 SKYLON is belight at take‐off because the fuel required to achieve speed of up to Mach 5 (five times the speed of sound) can be extracted from the air rather than stored on‐board. This enables the spaceplane to make a single leap to orbit, instead of using and dumping propellant stages on the ascent as current non‐reusable rockets do.
SKYLON can be used to launch satellites and carry cargo to the International Space Station (ISS) at about one‐fifth of the cost of non‐reusable launch vehicles, enabling frequent launches with little downtime. London Economics estimated that launch prices for SKYLON would range between €16.2m‐€37.5m, compared to current launch prices of €49m per launch for US launcher Falcon 9 (SpaceX) and the expected €70m for Ariane 6. This would revolutionise the economics of satellite launch, opening up cheaper access 134
to space and enabling the space launch supply market to be turned into a fully commercial activity. At a later stage, SKYLON might even be able to bring astronauts to the ISS or carry spacefligh experience participants. t
The SKYLON project is primarily funded by private investors, but a significant contribution has been made through the ESA technology development programme, and the UK Space Agency’s 2013 investment of £60m in the construction of a prototype SABRE. From a UK perspective, SABRE could potentially create 21,000 high value engineering and manufacturing jobs and maximise the UK’s access to a conservatively estimated £13.8bn launcher market over the next thirty years as well as provide economic benefits from spillovers. London Economics estimated the socio‐economic impacts for Europe of a SKYLON‐based European Launch Service Operator at €20‐24bn in Net Present Value terms (2014 prices, nominally 30 years). SABRE might also be used within the atmosphere to shorten journey times for long‐distance flights. It is estimated that Brussels to Sydney could be done in four and a half hours by a Sabre‐equipped airliner.
Credit: Reaction Engines Ltd.
Foreign direct investment
The impact of mergers and acquisitions on the UK space economy runs through two channels, namely events where UK companies acquire foreign companies and vice
Source: London Economics based on primary and secondary research
versa.
BSkyB’s recent acquisition of SKY Italia and SKY Deutschland, for example, means that more turnover and corporation tax will be routed to the UK, and the space economywill increase. It is, however, not likely that employment in the UK space economy will be affected.
(2013). ‘Towards a UK launch infrastructure, Economic analysis work package’. Unpublished study, part of the
133 Hempsell, M., Aprea, J., Gallagher, B. and Sadlier, G. (forthcoming). ‘A Business Analysis of a Skylon Based European Launch Service Operator’ (already presented at IAC 2014 in Toronto IAC‐14.E6.3.8) 134 London EconomicsSpace Collaborative Innovation Team Initiative (Space CITI) programme within the UK Space Agency’s National Space Technology Programme (NSTP)
108 London Economics
The Case for Space 2015
10 | Future prospects of the UK space economy
In the opposite direction, foreign companies acquiring UK operations could affect the space economy in different ways depending on how the new foreign owner chooses
ply chain, and use the new UK operations as main
n (ESA, Satellite Appl
to operate. If they retain a UK supsupplier to activities elsewhere, exconverse may also occur.
Greenfield incorporation of subsidias the knowledge base of the foreand diversify the space economy’s
Business incubatio
port and economic activity could increase, but the
aries in the UK will contribute to economic activityign parent company will be transferred to the UKoffering.
ications Catapult)
ng them grow, the business Adding companies to the UK spacincubators play an important role for the future.
Based on the sparse survey coverage of companies in the OX11 post district, where Harwell is located, we observe a very optimistic future outlook, with the three responding companies projecting growth of 56% between 2012/13 and 2013/14. Survey respondents in general expect to contract by 3%. The limited sample of firms makes the result indicative at best, but it does suggest positive impact from business incubation.
e economy, and helpi
10.5 Applications and end‐users: Space IGS high growth markets
The Space IGS identified 15 high‐growth markets that would each generate £1bn of turnover to UK companies by 2030. It is informative to consider the progress that has been made in each market, and assess the remaining effort required in order to achieve the target. The data in this report do not go into the detail required for quantitative assessment, so what follows is in qualitative terms.
Table 43 Space IGS ‐ progress
High‐growth market Progress Main players
Maritime surveillance* NovaSAR, a demonstrator project under development, andincubation under the auspices of Satellite Applications Catapult to develop applications of data
SSTL; Satellite Applications Catapult
Galileo PRS The UK Space Agency sought early test users for a PRSdevelopment programme in 2014. Due to the secrecysurrounding the service little detail is publicly available.
Airbus
Low‐cost access to Government is committed to
building a spaceport by 2018 and supports Reaction Engines inuilding the SKYLON spaceplane
Reaction Engines
As discussed above, the UK
space its quest to b
Persistent surveillance*GO3S, a demonstrator project of near‐persistent surveillance could generate large benefits to armed forces.
Airbus
Climate and ice cap cover. Flood modelling is used to estimate severe Ambiental applications Earth Observation satellites are used to monitor deforestation
weather effects of climate change. Carbonmodelling
monitoring &
NASA lead the upstream generation of carbon monitoringdata (launch in 2014). UK companies do not play a strong role.
Rail transport he use of satellites in safety critical rail applications is developing slowly. Satellites for asset monitoring andpassenger information services highly proliferated.
NSL; Thales UK; Omnicom Engineering
T
Air traffic* EGNOS landing procedures are available in few UK airports, NATS, Inmarsat, but the regulatory environment is conducive to growth. Garmin
Smart cities/urban The UK Space Agency is runninservices for local Government*
Smarter Government and the Future Cities Catapult usesspace services in its programmes.
Future Cities Catapult
g a project to develop Space for
London Economics The Case for Space 2015 109
10 | Future prospects of the UK space economy
Fixed satellite and*
Many companies offer fixed satellite broadband to rural areasin the UK and abroad. The application is currently deliveringbenefits to users.
Avanti, Avonline,Apogee Internet,and others
broadb
Broadband to ships* The application is already quite mature and delivering benefits to users.
Inmarsat
Broadband to aircraft* Adoption is on the increase, but has already beenimplemented by some airlines, delivering benefits to users.
Inmarsat, BritishAirways
Ubiquitoy space operations firms.
Airbus, Inmarsatus M2M* A large potential market that is already being addressed by UKapplication developers supported b
Location based The largest single application of GNSS with millions of daily Google; Hailo;
services* users in the UK, advanced applications are already availablefrom UK‐based developers
CityPlanner; and others
Mana
payloa
ace plays a key role. Cobham; ging unmanned UAS are a growing application in which spvehicles and hosted
ds* There are currently 29 UK UAS manufacturers135 ranging from military grade to consumer grade.
Cranfield Aerospace; BAE
Note:
As generateyet.
t
r system. The European Union’s space activities have returned
contracts to UK companies and given them access to R&D support schemes and encouraged c wle ing with international partners.
T ace economy, but it is likely to achieve ls. The government space inves e bottom third c other OECD nding to ESA by more than £200 ent as a proportion of U GVA nomy growth.
A e nd their successful exploitation w by the country. W to b ce, a step change for the spa experienced in the future, but it also r re
Half of the high‐growt d and will c v its current level of suppor to her development funding to
*: advanced stage of development.
the table shows, most high‐growth markets have UK operators, and turnover is being d, however, none of the high‐growth markets have fulfilled their £1bn turnover target
10.6 Summary
The UK space economy is strong and continues to grow thanks to highly developed space organisations that offer innovative services to professional and private users. The UK Governmensupports the space economy through national space missions, incubator support, and funding opportunities, and membership of ESA, which ensures UK companies have access internationalspace missions and ESA’s incubatolargeollaboration and kno dge shar
he ambitious growth targets set out in the Space IGS appear feasible for athat further Government support is necessary
growing sp the goa
tment is just 0.015% of GDP (2013), putting the UK in th countries, and even with the recently announced increamillion over the coming years, public space investm
ompared to se in fu
K space economy is decreasing, as public investment has not kept pace with space eco
host of game‐chang rs will affect the UK space economy over the coming years, aill be essential to obtain the share of the market desireduilding a spaceport and a leading developer of low‐cost acce economy as a whole could be
ith a commitment cess to spa
equires a benevolent gulatory environment to succeed and extract full value.
h markets identified in the Space IGS are at an advaontinue to generate substantial turnover if the Go ernmt, while the remaining high‐growth markets appear
nced stage ofent retainsrequire furt
evelopment,
achieve the ambition of £1bn turnover in 2030.
al.com/list‐of‐manufacturers/1 www.uavglob35 Please see http:// (accessed 28th April 2015)
110 London Economics
The Case for Space 2015
10 | Future prospects of the UK space economy
1 ture rese
In prove und operation and impact of the space econ UK, t h ac
U o e
A n 6.2 e space services, and it is ce l d eater or t ocietal value h a rta n (e.g. t rvice place a e it would stems), and the value of
resent space economists are hampered by available knowledge and limited to providing heavily caveated valuations based on generic ‘science and innovation’ impact parameters. As a
R&D is conventionally expected to generate large spillovers, and NASA and ESA spin‐off publications suggest that many products or processes have been invented in the
ll‐scale assessment of the public return on investment in space would be a comprehensive study (or a range of specific programme‐
0.6.1 Fu
order to im
arch
erstanding of the omy in thehe following researc tivities are recommended:
nderstanding the role f space in th UK
s shown in Sectio , the UK economy and most of its infrastructures are d true of most sectors that denied access to space serv
eply reliant oni
lesser extent. To gauge the proliferation of space servicesof space to the UK, it would be necessary to identify t
s would entaiand to measuree full range of
isruptions to grhe true spplications, the impohe role of space send the tim
nce of the contribution of space‐enabled services to each s, the severity of the impact of any disruption, back‐up stake to revert to alternative sy
applicatioystems in the economic
benefits to the end‐users.
Space‐specific spillovers
At p
high‐tech industry, space
field of space exploration. The study would investigate the extent to which space R&D generates returns to the innovating company and society as a whole as this result would be informative from the perspective of public support to the space economy.
Return on investment
Following on from the previously outlined recommendations, a fu
level studies) that could assess the full range of spillovers and monetise the actual return on investment. Researchers would interview companies that have received public support and ask questions related to counterfactual, spin‐off products and productivity gains. The study would also seek to estimate the productivity improvements enjoyed by professional and consumer users of space services, and estimate the contribution to the exchequer. The main finding of the study would be the answer to the question “how much does the UK get in return for a £1 investment in space?”
London Economics The Case for Space 2015 111
Glossary
Glossary
BeiDou Chinese Global Navigation Satellite SystemBGAN Broadband Global Area Network BIC Business Incubation Centre BIS Department for Business Innovation and SkillsBNSC British National Space Centre (predecessor of UK Space Agency)
ion ECSAT European Centre for Space Applications and Telecommunications
y Navigation Overlay Servicen
ESA European Space Agency
GPT General Purpose Technology bal navigation Satellite systems AgencyAdded
Organisation for Economic Cooperation and DevelopmentONS Office for National Statistics
RAF Royal Air Force Roscosmos Russian Federal Space Agency SABRE Synergetic Air‐Breathing Rocket Engine SEaaG Space Economy at a Glance SIC Standard Industrial Classification of Economic ActivitiesSME Small or Medium‐sized EnterpriseSpace IGS Space Innovation and Growth StrategySTEM Science, Technology, Engineering & MathematicsSTFC Science and Technology Facilities CouncilSWOT Surface Water Ocean TopographyUAV Unmanned Aerial Vehicle UAS Unmanned Aerial Systems UKSA UK Space Agency VAR Value‐Added Resale VAS Value‐Added Services VRT Variable Rate Technnology VSAT Very Small Aperture Terminal
CAA Civil Aviation Authority CAGR Compound Annual Growth Rate CCD Charge‐Coupled Device CNES French Space Agency (French: Centre National d'Études Spatiales)DECC Department for Energy and Climate ChangeDEFRA Department for Environment, Food & Rural AffairsDG Directorate‐General DMC Disaster Monitoring ConstellationDTH Direct‐To‐Home EA Environment Agency EC European Commiss
EGNOS European GeostationarEO Earth Observatio
EU European Union FDI Foreign Direct Investment FOC Full Operational Capability FTE Full‐Time Equivalent GAP Growth Action Plan GDP Gross Domestic Product GEO Geostationary Earth Orbit GLONASS GLObal NAvigation Satellite System (Russian GNSS)GNSS Global Navigation Satellite System (generic term)GPS Global Positioning System (American GNSS)
GSA European GloGVA Gross Value‐HD High Definition HNC Higher National Certificate HND Higher National Degree IoT Internet of Things ISS International Space Station IUU Illegal, Unreported and UnregulatedLBS Location‐Based Services LEO Low Earth Orbit M&A Mergers & Acquisitions M2M Machine‐to‐Machine NASA National Aeronautics and Space AdministrationNATO North Atlantic Treaty OrganizationOECD
PRS Public Regulated Service R&D Research & Development
112 London Economics
The Case for Space 2015
References
References
n, J.* (2 er for Socio‐economic Impacts Evaluation?”, Yearbook on Space cy 2011/20 pp. 183‐191. * DG’s Office for EU Relations, European Agency.
au van Dij tabase
u van Dij
MISSION of Commission Recommendation of 6 003 conc medium‐sized enterprises SEC(2009) 1350, for more
Brusto 014) “Space: the Last FrontiPoli 12 ‐ Space in Times of Financial Crisis,Space
Bure k, ORBIS financial da
Burea k, Zephyr database
COM STAFF WORKING DOCUMENT on the implementation May 2 erning the definition of micro, small and info vailable at: http: pa.eu/enterprise/policies/sm
DEV Inter 2013
panies Ho
ment fo ) The Space Economy in the UK: An economic lysis of the of policy, BIS Economics Paper No. 3, February 2010, p.vii. Available at: ://webarc .gov.uk/20121212135622/http://bis.gov.uk/assets/biscore/economics‐
COM national, Annual Report
Com use
Depart r Business, Innovation and Skills, BIS (2010ana sector and the rolehttp hive.nationalarchivesand‐statistics/ ‐paper‐03.pdfdocs/10‐624‐bis‐economics
(2014) Soc TES Applications & IAP (presentation)
el, J., A. H soglu‐Moreau (2014) The Economics Significance of the UK Science Base.
Grow ‐2030
am (1 overs. Implications for the Advanced Technology am” Econ Technology Program, National Institutes of Standards Technolog
on Econo ace Industry 2014
(2012)H suring the Space Economy
(2014) T Glance 2014.
e for Natio UK Non‐financial Business Economy (Annual Business Survey), 2012.
ice for Natio ual Business Survey Provisional results for 2013
ce for Natio ta 2011
e for Natio ONS detailed input‐output analytical tables for 2010 available at /www.on ations/re‐reference‐tables.html?edition=tcm%3A77‐346757
ESA io‐Economic Analysis AR
Hask ughes, E. Bascavu
IGS Space th Action Plan 2014
Jaffe, Ad 996), “Economic Analysis of Research SpillProgr omic Assessment Office, The Advanced and y, U.S. Department of Commerce.
Lond mics (2014) The Size and Health of the UK Sp
OECD andbook on Mea
OECD he Space Economy at a
Offic nal Statistics, ONS,
Off nal Statistics, ONS Ann
Offi nal Statistics, ONS Census da
Offic nal Statistics,http:/ s.gov.uk/ons/public
for Natio Research and Development, 2012
for Natio
, N., L. (19 Role in the Commercialization of New Technologies: Lessons For Policy”, conomics.mit.edu/files/4342
Office nal Statistics, ONS, Business Enterprise
Office nal Statistics, ONS GDP data
Rose 86) “The Government’sSpace Available at: http://e
Agen c services with satellites ‐ UK Space Agency brings satellite to Gover //www.gov.uk/government/news/boosting‐public‐
UK Space cy (16/01/2015) ‘Boosting publitools nment departments.’ Available at: https:services‐with‐satellites
London Economics The Case for Space 2015 113
Index of Tables, Figures and Boxes
Index of Tables, Figures and Boxes
Tables
Space economy turnover and consolidated turnover, 2008/09 –
nomy turnover by segment, 2012/13 11
over from UK space operations by sub‐segment, 2012/13 12
14
illary services by sub‐segment, 2012/13 15
UK space economy turnover by capability, 2012/13 16
region and segment, 2012/13 19
over 20
21
er by customer type, 2012/13 23
2012/13 24
stomer location, 2012/13 25
ture on R&D, 2004/05 – 2012/13 28
28
nditure value and as a % of GVA by 29
rs,
dded of the UK space economy, 2007/08 ‐
economy by segment,
sub‐segment,
t, 2012/13 44
4
oss Value Added of UK ancillary services by sub‐segment, 2012/13 45
nomy as a share of UK GDP, 2007/08 – 2012/13 45
Table 29 Direct employment supported by the UK space economy, 1999/00 – 2012/13 47
Table 1 Delineation of commercial applications and commercial use 9
Table 2 2012/13 10
Table 3 UK space eco
Table 4 Turnover from UK space manufacturing by sub‐segment, 2012/13 11
Table 5 Turn
Table 6 Turnover from UK space applications by sub‐segment, 2012/13
Table 7 Turnover from UK anc
Table 8
Table 9 Global comparison of UK space economy 17
Table 10 UK space economy turnover by region, 2012/13 18
Table 11 UK space economy turnover by
Table 12 Size composition of the UK space economy, by turn
Table 13 Size composition of the UK space economy, by employment
Table 14 Reported UK space industry skill levels by segment and sub‐segment, 2012/13 22
Table 15 UK space economy turnov
Table 16 UK space economy turnover by customer location,
Table 17 UK space economy turnover by cu
Table 18 UK space economy expendi
Table 19 UK space industry R&D expenditure as a % of space turnover by segment, 2012/13
Table 20 UK space industry R&D expesegment, 2012/13
Table 21 UK space economy R&D expenditure compared to selected UK secto2012/13 29
Table 22 Direct Gross Value‐A2012/13 42
Table 23 Direct Gross Value‐Added of the UK space2012/13 43
Table 24 Gross Value Added of UK space manufacturing by2012/13 43
Table 25 Gross Value Added of UK space operations by sub‐segmen
Table 26 Gross Value Added of UK space applications by sub‐segment, 2012/13 4
Table 27 Gr
Table 28 Direct Gross Value‐Added of the UK space eco
114 London Economics
The Case for Space 2015
Index of Tables, Figures and Boxes
Table 30 UK space economy employment by segment, 2012/13 48
Table 31 Employment from UK space manufacturing by sub‐segment, 2012/13 48
le 32 Employment from UK space operations by sub‐segment, 2012/13 49
Table 33 Employment from UK space applications by sub‐segment, 2012/13 49
/13 5
50
ct employment supported by the UK space economy as a share of UK w
13
vices (2013)
dustry
dustry
1
1
1
121
adcasting 121
1
1
1
1
126
Figu
ce economy value chain 9
10
ce economy turnover by capability, 2004/05 – 2012/13 16
ares
20
ce share by turnover 21
firm 27
dustry R&D expenditure as a % of space turnover by 2012 28
Tab
Table 34 Employment from UK ancillary services by sub‐segment, 2012 0
Table 35 World employment in space manufacturing
Table 36 Direthe total orkforce, 2009/10 – 2012/13 51
Table 37 Space employment intensity 52
Table 38 UK space economy employment by region and segment, 2012/ 53
Table 39 Labour productivity (GVA/employee) by segment and subsector,2012/13 55
Table 40 Valuation of sectors supported by space‐enabled ser 66
Table 41 Knowledge spillovers from the US space in 92
Table 42 Knowledge spillovers form the European space in 93
Table 43 Space IGS ‐ progress 09
Table 44 List of Steering Committee members 19
Table 45 Alternative segmentations of the space economy value chain 20
Table 46 Value chains mapped
Table 47 Bro
Table 48 Fixed and mobile communications 22
Table 49 Military communications 23
Table 50 Earth Observation 24
Table 51 Navigation 25
Table 52 Ancillary service providers
res
Figure 1 Spa
Figure 2 Space economy turnover, 1999/00 – 2012/13
Figure 3 Spa
Figure 4 Regional distribution of UK space economy turnover – map and sh(2012/13) 19
Figure 5 UK space economy turnover by region and segment, 2012/13
Figure 6 Spa
Figure 7 Space share by employment 21
Figure 8 Qualifications in the space economy compared with other sectors. 23
Figure 9 UK Space Economy trade balance as share of turnover, 2012/13 (subset of s)
Figure 10 UK space insegment, /13
London Economics The Case for Space 2015 115
Index of Tables, Figures and Boxes
Figure 11 International comparison of civil government space R&D budget as n of
)
and selected 2013
and 52
2012/13
by region,
ace‐enabled applications across the UK’s critical s
to space economy value chain: Focus on ffec
igh growth markets
Figure 28 Share of benefits from satellite‐based meteorological observations 82
Figure 29 The most desirable jobs to have in Britain today – overall and by er 96
gets 10
1
le) 1
135
Boxe
space manufacturing
14
ected UK global leaders in ancillary services
y
Box 6 Notable UK ESA contractors 26
proportio total civil government R&D budget 30
Figure 12 UK Government space investment 1999/00 to 2013/14 (2012/13 prices, £m 36
Figure 13 Space investment as share of space GVA 2008/09‐2012/13 40
Figure 14 Space budget (US$m) and share (%) of GDP, OECDcountries, 40
Figure 15 Economic effects mapped to space economy value chain: Focus on direct, indirect and induced effects 41
Figure 16 Total GVA contribution of the UK space economy, 2012/13 46
Figure 17 Total GVA by region and channel of impact, 2012/13 46
Figure 18 Regional distribution of UK space economy employment – sharesvalues (2012/13)
Figure 19 UK space economy employment by region and segment, 2012/13 53
Figure 19 Total employment supported by the UK space economy, 54
Figure 20 Total employment supported by the UK space economy 2012/13 54
Figure 21 Labour productivity by sector 56
Figure 22 FDI events by decade 58
Figure 23 FDI events by type 58
Figure 24 Influence of spnational infra tructures 65
Figure 25 Economic effects mappedcatalytic e ts 67
Figure 26 Benefits of space 69
Figure 27 Space Action Growth Plan h 70
gend
Figure 30 Space Growth Action Plan tar 3
Figure 31 UK GDP compared with space turnover 04
Figure 32 Turnover by space capability 2010/11 – 2012/13 (2012 samp 27
Figure 33 Foreign ownership of space economy firms
s
Box 1 Selected UK global leaders in 12
Box 2 Selected UK global leaders in space operations 13
Box 3 Selected UK global leaders in space applications
Box 4 Sel 15
Box 5 Case Study: Surrey Satellite Technology Ltd. (SSTL), an export‐ledgrowth success stor 26
116 London Economics
The Case for Space 2015
Index of Tables, Figures and Boxes
Box 7 UK involvement in ESA programmes
Box 8 Examples of FDI attracted to the UK 59
37
space economy
60
port ecosystem of the Harwell campus 61
arwell
sion
the
research to 100
ceport UK (future: 2018) 1
1
Box 9 Case Study: G2way, a successfully incubated commercial spin‐out
Box 10 Sup
Box 11 Companies with applications interest now relocated to UK/H 62
Box 12 Prominent role for UK technology in ESA’s successful Rosetta mis 97
Box 13 ExoMars programme 2018, with the UK taking overall leadership ofthe rover module 98
Box 14 Lunar Mission One – a successfully crowd‐funded UK‐led missionplanned to moon's South Pole 99
Box 15 Biomedicine – using space as a vehicle for biomedicalbenefit terrestrial healthcare
Box 16 Spa 07
Box 17 SKYLON (future 2025+) 08
London Economics The Case for Space 2015 117
Index of Tables, Figures and Boxes
ANNEXES
118 London Economics
The Case for Space 2015
Annex 1 | Steering Committee
Annex 1 Steering Committee
A1.1 Steering Committee membership
Table 44 List of Steering Committee members
Organisation IndividualUKspace Richard PeckhamUKspace Richard BrookUKspace Paul FlanaganUK Space Agency George PritchardUK Space Agency Will LeckyInnovateUK Andy GermanSatellite Applications Catapult Sam Adlen
Source: London Economics
Annex 2 Methodology
A2.1 Defining the space economy
A2.1.1 Segmentation of the space economy
Table 45 below lists three of the most notable classifications.
These three are chosen for the following reasons: the Size and Health segmentstructure of the most recent data on the UK space economy; The Space Econsegmentation is the result of the OECD’s pioneering work towards universal coverage, standardised data collection and international comparability; and The Space Report estimates were used as the basis for the Space IGS Growth Action Plan market size forecasts and targets.
ation governs the omy at a Glance
London Economics The Case for Space 2015 119
Annex 2 | Methodology
Table 45 Alternative segmentations of the space economy value chain
Size and Health Space Economy at a Glance The Space Report
Space Transportation
Subsystem supplier /material supplier
gment system integrator tem supplier nent/material supplier
Services and products for consumers using satellite capacity
Direct‐to‐home providers Very Small Aperture Terminal (VSAT) network providers
Location‐based signals services providers
Commercial Infrastructure and support industries
Launch industry Satellite manufacturing Space Stations Ground stations and equipment Commercial human spaceflight (suborbital and orbital)
Independent Research & Development Infrastructure support activities (incl. Insurance premiums)
Commercial space products and services Direct‐to‐Home television / Broadcasting
Satellite communications Satellite radio Earth Observation Geo‐location and navigation
U.S. government space budgets Department of Defense (DoD) National Aeronautics and Space Administration (NASA)
National Oceanic and Atmospheric Administration (NOAA)
National Science Foundation (NSF) United States Geological Survey (USGS) Department of Energy (DOE) Federal Aviation Administration (FAA)
Individual countries and national agencies
Upstream Space manufacturing (incl. launch
Launch Service Provider Prime/system integrator
systems supplier) Complete satellites /
Component
Ground se Prime/ Subsys Compo
Satellite/payload ma Prime/system intSubsystem suppli
Componen Spacecraft (non‐satellite)
ses) ground stations gner and equipment and
nt and software forstems te platform structurebsystem tion and
manufacturing
private)
Downstream
Co ProOther
provider User equipment supplier Value‐added service provider
Tiers Three and Four Scientific and en
Financial Services Insurers (and re‐insurers) of
Engineering services) Material and component
Investors Others
Services from satellite operators Space and ground systems operators
Support products and services Consultancy – applied research
Wider space economy Broadcasting Communications Earth Observation
Satellite operations, including lease orsale of satellite capacity
Provision of control centres services tothird parties
Consumer services (Downstream) Devices and equipment supporting the
Federal Communications Commission (FCC)
Non‐U.S. government budgets Non‐U.S. military space European Space Agency (ESA) European Union EUMETSAT
Sources: London Economics (2014) The Size and Health of the UK Space Industry 2014; OECD (2014) The Space Economy at a Glance; The Space Foundation (2014) The Space Report
A2.1.2 Mapping of UK value chains
Whilst the segmentation provides a useful framework for the analysis, it is abstract. To root the segmentation to the reality of the UK space economy, it is instructive to map UK organisations into the segmentation for a select range of space value chains.
Though integrated applications (i.e. solutions combining usage of different types of satellites) is an important area of development, it is perhaps easiest to explain space value chains in the UK by type of satellite.
120 London Economics
The Case for Space 2015
Annex 2 | Methodology
Table 46 Value chains mapped
Satellite communications n igation Earth observatio Satellite navBroadcasting
Earth observation
Global Navigation Satellite Systems
Fixed and mobile communications Military communications
Integrated Applications
The f llo owing lists of applications
de ite market. d manufactu
n
e of f the B portant UK
s shown
oadcasti
of space services are non‐exhaustive, but have a specific focuson applications with UK actors.
The UK is a global leatelecoms satell
r in satellite communications, with an esti136 UK companies design an
mated 20% share of the globalre communications satellites,
and develop applications for high capacity broadband, broadcast a d fixed satellites.
Direct‐to‐home broadcasting accounts for a major shar the turnover and employment o UK space economy and is doorganisations, a
minated by BSKYB – but BSKY relies on a chain of other imbelow.
Table 47 Br ng
Segment Activity Main UK players*
Space
manufacturing
subsystems) Satellite manufacture (in
Airbus; Qioptiq; Comcl.
Dev
Launch (incl. brokerage) CST
Ground segment (tel p rts) e oiSat
manufacture Ground segment components
iDirect; CGI
manufacturer
Space op
eration
operator
s Ground segment (t Media ited; WRN eleports) Arqiva; Satellite
port Services; Talia LimBroadcast; SIS Live
Satellite uplinkadcast)
(outside SIS Live; BT
bro; BSKYB; ITV; BBC
Satellite operator (includi g city)
Intelsat n
lease of capa
s
Direct‐to‐Homprovision
e service BSKYB; Freesat
application
Space
Value added service provider Rohde & Schwarz UK
User equipment manufacture Pace Microsystems; Invacom; Triax UK; Icecrypt
Users
BSKYB; BBC; ITV; BT; Virgin Media; ITN; Discovery Channel; on Demand; Carillion Communications; Audi TV; Red
Bull
Commercial users Media
Private users Consumers; Members clubs; Pubs; Offices; Retail and other commercial premises; Premier League clubs
Note: *: Companies with UK headquarters or offices. Source: London Economics
136 UK Trade & Investment, Space technology in the UK: investment opportunities 2014, available at:https://www.gov.uk/government/publications/space‐technology‐in‐the‐uk‐investment‐opportunities/space‐technology‐in‐the‐uk‐investment‐opportunities
London Economics The Case for Space 2015 121
Annex 2 | Methodology
The UK is home to some of the leading global providers of fixed and mobile satellite data communication services, supported by a strong value chain. The UK also has some world‐reno t rely on ivity for core ll as enhancem mer offering, as listed below.
Table communications
Segment Activity Main UK players*
wned organisations tha satellite connect operations as weents of custo
NGO users Disaster response; Aid relief (e.g. British Red Cross); Deforestation charities (WWF, Greenpeace); Agriculture and Horticulture Development Board
Note: *: Companies with UK headquarters or offices. Source: London Economics
The UK contributes to the Europe’s Global Navigation Satellite Systems (GNSS) EGNOS and Galileo – whose payloads are made by SSTL, with a large population of equipment manufacturers, developers and users. Location‐based services will continue to be a growth area into the future.
Note: *: Companies with UK headquarters or offices. Source: London Economics
The space industry consists of highly technical engineering, scientific, and advanced manufacturing organisations operating in an evolving market with very particular needs for ancillary support. To meet this need, a tier of specialised providers of support services to the space industry has developed, covering a range of services from consultancy to specialised IT services. The leading UK‐based providers of these support services are listed below.
London Economics The Case for Space 2015 125
Annex 2 | Methodology
Table 52 Ancillary service providers
layMain UK p ers* Atrium Space C Saturn SMS Insurance Consortium (ASIC) GISpire omm L cs HE Space Operations nt C unications plc ondon EconomiSa Con Tpienza sulting echnopolis
Note panies with UK headquarters or offices. Sour on Ec
A2.2 U e
Thi rt sets of the the UK Space Industry 2014, which wa d on of of companies that fall below e th statutory requireme reports. A total of 303 organisations were analysed for the Size an
The and upstream, downstream and wider space eclassification of the space economy as discu ational financials covered by the Size and Health st
Tabl abov twe , and the resulting hybrid segmentation is p for this study.
A2.2.1 Extension of sample in the c
In order to refine the picture of the UK spa list of survey invitees and Health onal to the coverage in th were identi er companies were identified in the process o is of the applications segment covering specialist re tions were ntified and based on annual report e organisations were attributed space activity it should be noted that many of these compa
A2.2.2 Sample coverage,
The analysis underlying this report seeks certain challe d. The main inpu study, which is
and Health study.
The survey for the Size and Health study was sent to 1,129 organisations and received strong promotion through various websites (e.g. UK Space Agency, UKspace, InnovateUK, and Satellite
: *: Comce: Lond onomics
K space economy in p rspective
s repos base
th
out from the analysis Size and Health of survey responses, researchreshold for the
annual reports and estimationnt to submit annual
d Health study.
isations into three categories of space activity, namely conomy. As this report operates with a more granular ssed above, it was necessary to redefine organis
Size
e 45
Health study classified organ
udy into the new classes.
en the Size and Health study and the thought leadersresented in Figure 1, which is the chosen classification
e summarises the map be
ontext of The Case for Space 2015
ce economy for presentation in this report, the full study was revisited, and companies additified as active in the space economy. In addition, furthf refining the value chains, and further analystailers and service providers. In total 135 organisas and the activity indicated on respective websites, th in accordance with the new classification. However,
from the Sizee Size and Health
ide
nies are covered by the small firm exemption.
and uncertainty selection,
to cover the entirety of the UK space economy, butt is the survey for the Size and Healthnges are face
supplemented by:
Large firms that are listed on the stock exchange and, as a group, tend to decline the opportunity to participate in financial surveys. These firms have been added to the sample through analysis of respective annual reports and websites
Small firms that did declined the option to participate in the survey and whose size makes them exempt from filing detailed statutory reports. These firms have been estimated as a group using the same approach as the Size
126 London Economics
The Case for Space 2015
Annex 2 | Methodology
Applications Catapult) and social media. It is therefore reasonable to conclude that any organisation that would be relevant for the analysis had had a chance to be included.
H o that all financial inform blished on the w rmation is no erefore ne e desk‐b companies that have ed through desk‐based research of financial
otal turnover.
between 2010/11 and 2011/12 is partly ally those added through annual reports
n deve a new application and growing
of space companies would
nover by space capability 2010/11 – 2012/13 (2012 sample)
there is some
owever, many companies have the p licy ation is puebsite, and additional info t available. It is th cessary to undertakased research. The been includ
reports account for more than 80% of t
The large increase in turnover that can be observed explained by the inclusion of additional firms – especiresearch. It is possible to analyse recent developments for the sample included in the 2012 Size and Health study, but due to confidentiality issues of the old survey responses, only a subset of firms can be analysed. Analysing this balanced panel of firms over time is interesting and does provide information, but the results should be treated with cautio as much of the lopment in the space economy comes from new companies developingrapidly.137
Firms that were not covered in the 2012 study account for total turnover of £1,354m in 2012/13 and if they were excluded for comparability reasons, the growth rate of the space economy would drop to 2.4% in 2011/12 and 4.1% in 2012/13. The balanced paneltherefore still have exhibited growth, but at a much lower rate than when new firms are included.
Figure 32 Tur
0
2,000
12,000
14,000
4,000
6,000
8,000
10,000
£m, 2012/13
prices
Space Transportation
Other
Space Science
Earth Observation
Navigation
Telecomms
Broadcasting
2010/11 2011/12 2012/13
Note: Sample is restricted to companies analysed in 2012 Size and Health study.
Source: London Economics analysis of Size and Health data
This report has striven to present a complete picture of the space economy, but acknowledges that some of the decisions and data availability may have affected the result. Survey respondents have indicated the relevant financial information and are therefore considered to be accurately represented. However, due to the intervals that could be ticked in the survey,uncertainty in the data (e.g. proportion of turnover derived from space is available in 10‐25 percentage point intervals).
137 This phenomenon is not particular to space – consider, for example, an analysis of the global mobile phone market’s development from 2006‐2010. The Apple iPhone was released during that time, and disrupted the market considerably. An analysis only of the balanced panel of firms present over the entire period would present a very different result to the “truth”.
London Economics The Case for Space 2015 127
Annex 2 | Methodology
All identified space organisations for which annual reports have been accessible are included in the analysis. However, while the identification of space organisations was a long and rigorous process, there is bound to be companies that slipped through the identification. The company lists
tory accounts are the most uncertain group as – by construction – there is no data available, and an assumption on the proportion of the total
‘Gross’ versus ‘Net’ impacts
counterfactual or net terms, but the
data be the
In
in
It is to
not
The
discussion (section 4.1), many activities that are enabled by government support are worthwhile due to the generation of positive
onomy that are sourced from abroad, however, leak from the UK provided by the UK space economy firms in the survey, so the degree
were validated by the Steering Committee, so we do not believe large companies are missing from the analysis, but some smaller companies are inevitable.
The non‐respondents that are exempt from filing statu
space economy that is accounted for by these firms had to be imposed. As no data is available, it is assumed that activity of these companies follows the known distribution among the companies for which data exists.
A2.3 Economic impact of the UK space economy: Direct, indirect and induced effects
A2.3.1
When conducting an assessment or appraisal, it is important to specify whether the analysis is in ‘Gross’ or ‘Net’ terms. Gross terms are the most readily available as no detailed measurement of counterfactual is needed, but are likely to present a skewed picture of the truth. The difference between gross and net depends on the degree of additionality generated. Additionality is definedas the difference between the realised outcome and the outcome in thereference case of no intervention. Ideally, everything should be assessed in
requirements for that type of evaluation can be prohibitively high. Additionality can referred to as a ‘supply side’ or ‘structural impact’ that alters the productive capability of workforce.138
order to assess the degree of additionality, a causal link between investment and outcomeneeds to be established along the lines of “XX% of turnover or GVA could not have been achievedthe absence of the investment”. In that case, the additionality is XX%.
may also be that the private space economy would have otherwise made the investment thatprovided by the Government. If that is the case, and the private investment is instead converted dividends, the project would have been realised nonetheless, and the benefits derived are additional to the reference case. This is known as deadweight.
size of space projects and the fact that they require such long development processes means be able to undertake the activity.that only a very small subset of firms (large enterprises) would
interventionAs explained in the rationale for government
externalities and spillover benefits that it would be difficult, if not impossible, for private companies to monetise. For these reasons, we do not see significant deadweight in space activity.
It is also important to assess where funding goes. UK employees that get paid in the UK for doing their work are likely to spend the majority of salaries in the UK and thus stimulate the economy. Any inputs in the space ececonomy. Import shares are
138 HM Treasury, The Green Book, 2011.
128 London Economics
The Case for Space 2015
Annex 2 | Methodology
of leakage from the economy is known and taken into account in the analysis of Gross Value Added. We do not believe there is any further unknown leakage.
Additional effects to be considered are those of substitution and displacement. UK investment in space could have otherwise been used for other purposes. Lowering the deficit and debt is one possibility; another is that the money would be used for different investments, which would most
me, we are only able to discuss the degree of additionality in qualitative terms at an aggregate level.
Substit fects are likely to be present. The UK Government’s investment in space where, and the benefits from that investment are likely not zero.
nt that goes through ESA, and the support system in at benefits are likely greater than alternatives could
s based on published analytical tables for the
tput that is supplied as
my, and therefore offers a way of
activity.
likely yield a return. The return on the space investment would therefore have to be considered, not in its gross terms, but in net terms where the other project’s returns were subtracted. Bearing in mind that no dedicated survey has been targeted at organisations in receipt of public investment, and that a survey at this stage is likely to bias the result due to the likely time lag from investment to outco
ution and displacement ef could have been used else
However, the large proportion of investmeplace through that organisation means thoffer.
A2.3.2 Economic multiplier effects
As is customary in economic impact assessments, The Case for Space 2015 incorporates a multiplier analysis of the further economic activity (GVA and employment) that results from activity in the space economy.
The analysi is
A multiplier measures the further economic activity, (whether output or jobs), resulting from the creation of additional local economic
supply and use as published by ONS and covering the year 2010.
For each sector, the analytical table presents the amount of total ou
HM Treasury, The Green Book
intermediate input in each of the sectors, exported to other economies or consumed as final demand by households and government bodies. Simultaneously, the tables present the amount of inputs from each sector used in each sector to produce total output, compensation of employees, taxes and subsidies and imports. In combination, the Supply‐and‐Use table provides an image of the inter‐linkages that exist between the sectors in the econounderstanding the relative importance of all sectors to each other. The economics discipline that is concerned with analysis of supply and use tables is known as input‐output analysis.
Fundamental assumptions
A key assumption of input‐output analysis is that inputs are complements and that there is constant returns to scale in the production function, i.e. there are no economies of scale. Theinterpretation of these assumptions is that the prevailing breakdown of inputs from all sectors (employees and imports) in 2010 is a good approximation of the breakdown that would prevail if total demand (and therefore output) were marginally different. The implication is that the multipliers resulting from input‐output analysis should be interpreted with caution, especially if the change in demand that is modelled differs greatly from the data.
London Economics The Case for Space 2015 129
Annex 2 | Methodology
Methodology for implementation
It can be shown that normalising the supply and use table by sectoral output (column total),
Two types of multipliers are considered in this report, namely Type I multipliers, the result of
at least as great as the Type I multiplier.
turing the additional economic activity resulting in the supply of the sector that experiences an increase in final demand while Type II multipliers
ply chain such as retail, accommodation
eter ating economic impact, so on GVA. As the data from the Size and
e UK Space Industry 2014 and the additional a port estimates GVA by company, we choose to estimate the GVA multiplier such that we can
Employment multipliers
Similar to GVA, it is desirable to produce a multiplier that can be readily applied to the estimated
anularity in two dimensions, namely sector and geography.
subtracting the resulting matrix from the identity matrix and inverting the whole expression produces a matrix where each cell can be interpreted as the amount with which each supplying sector (row) would increase its output if the using sector (column) increased by 1. This resulting matrix is known as the Leontief Inverse. The column sum of this matrix is therefore equal to the total economic output arising in all sectors from one additional unit of final demand in one sector. The resulting column sum is known as the output multiplier.
Type I and Type II multipliers
which is known as indirect effects and Type II multipliers (induced effects). Type I multiplier analysis only considers the market sectors in the economy while Type II multipliers also consider compensation of employees and household consumption. As additional output will result in additional compensation of employees and (assumed) household spending, the Type II multiplier is always
Type I multipliers can be considered as capchain
also considers economic activity in sectors outside the supand restaurants.
Gross Value‐Added (GVA) multipliers
While output is interesting in itself, it is not a useful paramthis report focuses on the effects of additional demand Health of th
for estim
nalysis undertaken for this re
immediately apply it to estimated GVA.
We therefore need to transform the Leontief Inverse by the ratio of GVA to output in each supplying sector relative to the sector that experiences an increase in GVA. The interpretation of each cell therefore becomes the amount of additional GVA generated in each supplying sector (row) for each additional unit of GVA generated in the sector experiencing a unit increase in GVA. Again, the column sum equates to the economy wide impact.
employment in the sector, and it is therefore necessary to transform the Leontief Inverse once again by the ratio of employment to output in each supplying sector relative to the sector that experiences an increase in employment.
A2.3.3 Granularity
This report estimates two sets of multipliers at varying levels of gr
130 London Economics
The Case for Space 2015
Annex 2 | Methodology
Sectoral analysis
The sectorally granular analysis is based on ONS UK I‐O Analytical Tables 2010 covering 127 economic sectors for the UK as a whole. Each firm in the space economy has been classified into one of these sectors by Companies House, and the overall multiplier can be interpreted as a weighted average multiplier of all the sectors that constitute the space economy.
Input‐Output analysis based on 127 sectors allows more detailed understanding of the supply chain in each company and therefore produces more accurate estimates of the impact of additional economic activity. However, geographic specifics such as concentrated industry in
nalysis.
high, and the data is not available at the regional level for all 127 sectors in the detailed analytical tables, which explains the reduced sectoral
in shipments from one region to another, which we proxy by the distance between the two regions. It is also assumed that cross‐regional trade can be explained by the
regions.
ge multiplier.
se any effect on price resulting from change in demand is outside the scope of the analysis. It is also important to note that raw indirect
gross terms only. In the consideration of net effects, it is necessary to assess the counterfactual situation where employees would not be employed in the space
rest of the labour market at 4%. It is therefore likely that the space economy employees would have been able to find alternative employment, generate
tribute to value‐added through these jobs.
analysis and resulting values are at risk of being upwardly biased. Conceptually, the space economy captures all companies that supply to space missions or exploitation of space infrastructure. As a specific example, consider large international space missions managed by the European Space Agency, where the database of space companies include
certain regions are lost in the a
Geographic analysis
Based on ONS UK Input‐Output Analytical tables for ten top‐level sectors, the analysis was performed at a more geographically granular level. London Economics developed a multi‐regional input‐output (MRIO) model to understand better how economic activity in certain regions impacts other regions. The data requirement on MRIO is
granularity.
The fundamental idea of MRIO is that region i’s demand for region j’s output is related to the friction involved
relative value‐added of the sector in all
The estimated multipliers at national and regional level differ as the distribution of companies in the space economy does not follow the distribution of companies at the national level. The larger sectoral classes at the regional level also imply that companies in sectors with particularly high GVA ratios at the national level may be grouped with more average sectors, and dilute especially strong contributors to the weighted avera
A cautionary note on usage of multipliers
Indirect and induced effects multipliers present an indicative amount of GVA and employment supported in the supply chain of the space economy, but results should be treated with caution. The results can only be expected hold in marginal sense becau
and induced effects are in
economy. If they would have otherwise been unemployed the result still holds, but in the case of high‐skilled space economy employees, it is not reasonable to assume so. ONS, Full report – graduates in the UK labour market, 2013, for example reports that the unemployment level among graduates was lower in 2013 than for the
economic activity and con
Given the lack of industrial classification of a dedicated space economy consistent with definitions used in this report, the multiplier
London Economics The Case for Space 2015 131
Annex 2 | Methodology
both the prime contractor (e.g. Airbus), and the subcontractors (e.g. CGI in the case of Galileo). If Airbus and CGI were the only companies in their respective industries (30.3, and 62), and only
(FDI)
es for theoretical FDI section
Bellak, C., Pfaffermayr, M. and Wild, M. (2006). ‘Firm performance after ownership change: a
(2009). ‘Foreign ownership and firm performance: emerging‐market acquisitions in the United States’. NBER Working Paper No. 14786.
wage spillovers: Plant Level Evidence from the UK Electronics Industry*', Oxford Bulletin of Economics and Statistics, 65(4),
derived turnover from the ESA contract in the year, the indirect effect on suppliers in sector 62 from economic activity in sector 30.3 would be zero because it would already be included as a direct effect. In general, the space economy companies form a very small proportion of turnover in their respective sectors and the results are therefore expected to carry little bias.
The limitations of the regional multipliers mean that the national level multipliers remain the headline result while the regional multipliers can be used as indicative of the geographic effects.
A2.4 Foreign Direct Investment
A2.4.1 Referenc
Almeida, R. (2007). ‘The labour market effects of foreign owned firms’. Journal of International Economics, 72, p.75–96.
Bailey, D. & Driffield, N. (2002). 'Hymer and uneven development revisited: foreign direct investment and regional inequalities', Contributions to Political Economy, 21(1), p.55–68.
BIS (2011). 'International Trade and Investment ‐ the Economic Rationale for Government Support', BIS Economic Papers 13, 2011.
Buckley, P.J. & Casson, M.C. (1998). 'Analyzing foreign market entry strategies: extending the internalization approach', Journal of International Business Studies, 29(3), p.539–561.
Caves, R. E. (1996). ‘Multinational enterprise and economic analysis’, 2nd edition, Cambridge, MA: Cambridge University Press.
Chari, A., Chen, W. and Dominguez, K.
Conyon, M.J. et al. (2002). 'The impact of mergers and acquisitions on company employment in the United Kingdom', European Economic Review, 46(1), p.31–49.
Driffield, N., Munday, M. & Roberts, A. (2002). 'Foreign direct investment, transactions linkages, and the performance of the domestic sector', International Journal of the Economics of Business, 9(3), p.335–351.
Driffield, N., Love, J.H. & Taylor, K. (2009). 'Productivity and labour demand effects of inward and outward foreign direct investment on UK industry’, The Manchester School, 77(2), p.171–203.
Driffield, N. & Girma, S. (2003). 'Regional foreign direct investment and
p.453–474.
Driffield, N. & Taylor, K. (2006). 'Wage spillovers, inter‐regional effects and the impact of inward investment', Spatial Economic Analysis, 1(2), p.187–205.
132 London Economics
The Case for Space 2015
Annex 2 | Methodology
Fukao, K., Ito, K., Kwon, H. (2005). ‘Do out‐in M&As bring higher TFP to Japan? An empirical analysis based on micro‐data on Japanese manufacturing firms’. Journal of the Japanese and International Economies, 19, p.272‐301.
Girma, S., Görg, H. & Pisu, M. (2008). 'Exportation, effets d’entraînement, et effets externes de productivité en provenance de l’investissement direct de l’étranger.', Canadian Journal of Economics/Revue canadienne d’économique, 41(1), p.320–340.
Girma, S. & Görg, H. (2007). 'Evaluating the foreign ownership wage premium using a difference‐in‐differences matching approach', Journal of International Economics, 72(1), p.97–112.
Girma, S. and Wakelin, K,. 2000. ‘Are there regional Research
spillovers from FDI in the U.K.?’ Centre for on Globalisation and Labour Markets Research Paper no. 2000/16. Nottingham, U.K.:
stment?', Journal of Development Economics, 85(1–2),
Konings, J. (2001). 'The effects of foreign direct investment on domestic firms', Economics of
Latreille, P.L. & Manning, N. (2000). 'Inter‐industry and inter‐occupational wage spillovers in UK
A2.4.2 FDI analysis of space firms
identification of the ownership status of the companies in the UK space economy. For this, we have used data provided by Bureau
re for space economy companies identified as part of the analysis for The Size and Health of the UK Space Industry 2014 and further analyses in the context of the this research.
Three ‘locations’ of ownership groups stand out from the remaining groups, namely where the
does not provide information on location (147 companies). 96 remaining companies have an identifiable, foreign global ultimate owner.
University of Nottingham.
Görg, H. & Greenaway, D. (2004). 'Much ado about nothing? Do domestic firms really benefit from foreign direct investment?', The World Bank Research Observer, 19(2), p.171–197.
Harris (2009). ‘The effect of foreign mergers and acquisitions on UK productivity and employment’, UKTI
Heyman, F., Sjoholm, F. and Tingvall, P. (2007). ‘Is there really a foreign ownership wage premium? evidence from matched employer‐employee data’. Journal of International Economics, 73, p.355‐376.
Javorcik, B.S. & Spatareanu, M. (2008). 'To share or not to share: Does local participation matter for spillovers from foreign direct invep.194–217.
Transition, 9(3), p.619–633.
manufacturing', Oxford Bulletin of Economics and Statistics, 62(1), p.83–99.
The analysis of FDI requires a definition of ownership, as well as an
van Dijk’s Orbis database, the largest (130 million private companies globally) worldwide database providing comprehensive organisational information, to retrieve company‐level information on ownership structu
This has resulted in a total of 511 companies taken forward for further research.
company has no single identifiable owner (164 companies), companies with a UK‐based global ultimate owner (116 companies), and companies owned by individuals or individual families for which Orbis
London Economics The Case for Space 2015 133
Annex 2 | Methodology
Companies owned by individuals can reasonably be assumed to have at least the same concentration of UK owners as the overall average with founders of UK companies expected to be based in the UK. In the following, the analysis focuses on identified foreign owned companies.
ir holdings also combine to the greatest number of employees and turnover. North America‐owned firms have the highest level of
uch larger than for the simple number of firms.
or in an ownership chain of firms. The ultimate owner may have no shareholders or all shareholders may have unknown percentages.
y the limitation on data availability often caused by companies being exempt from submitting detailed accounts
The following figures show descriptive statistics of the firms identified as having foreign owners. The US is the single country with the highest level of FDI in the UK and is leading in all metrics. European companies own the largest number of UK firms and the
assets. One Australian‐owned company, Arqiva limited, is a key player in the UK space economy, and its size is reflected in assets, employees and turnover, where Australia’s column is m
This figure and table presents companies with any foreign owner in possession of at least 50.01% of the company directly
The fact that some countries do not appear in the table of employees is caused b
under the Total Exemption Small rules.
134 London Economics
The Case for Space 2015
London Economics The Case for Space 2015 135
Annex 2 | Methodology
Figure 33 Foreign ownership of space economy firms
Note: Only companies with a foreign owner in possession of at least 50.01% of the company either directly or through ownership of other companies are considered. Total company financials are reported. Due to limitations in data there is no interaction between the extent of foreign ownership and financials. London Economics analysis based on Bureau van Dijk Orbis database
TOTAL 84 TOTAL 12,037 TOTAL 6,155 TOTAL 26,4United Arab Emirates 1 United Arab Emirates 4.6 United Arab Emirates 3.8 United Arab EmiratesMiddle East 1 Middle East 5 Middle East 4 Middle EastSingapore 3 Australia 1,407.0 Australia 524.3 Australia 1,8Hong Kong 3 Hong Kong 76.7 Hong Kong 76.3 Hong Kong 7Japan 2 Singapore 24.5 Singapore 44.6 Singapore 1Australia 1 Japan 18.8 Japan 43.4 JapanAsia‐Pacific 9 Asia‐Pacific 1,527.0 Asia‐Pacific 688.7 Asia‐Pacific 2,7US 26 US 5,110.4 US 1,878.9 US 7,1Canada 5 Canada 715.7 Canada 26.8 Canada 2Bermuda 2 Bermuda 308.7Cayman Islands 1North America 34 North America 6,134.8 North America 1,905.7 North America 7,3Netherlands 11 France 1,687.6 France 1,425.7 France 6,5France 10 Italy 1,256.8 Italy 925.4 Italy 4,6Germany 4 Netherlands 847.2 Netherlands 870.5 Netherlands 3,4Sweden 4 Sweden 342.9 Luxembourg 86.4 Germany 5Italy 3 Luxembourg 68.9 Germany 64.7 Luxembourg 4Luxembourg 2 Germany 67.6 Sweden 61.7 Denmark 1Denmark 2 Denmark 43.3 Norway 50.6 Sweden 1Norway 1 Norway 31.5 Denmark 40.5 Spain 1Switzerland 1 Spain 15.6 Spain 19.7 Switzerland 1Finland 1 Switzerland 7.4 Switzerland 12.0 Norway 1Spain 1 Finland 1.8Europe 40 Europe 4,370.7 Europe 3,557.2 Europe 16,4
Europe20
30
North America
Asia‐Pacific
60
70
80
Middle East
0
10
Number of firms, #
40
50
90
Europe
North America
0.0
2.5
5.0
Total Assets, £m
Asia‐Pacific
7.5
10.0
12.5
Billion
s
Europe
10
North America
Asia‐Pacific
20
25
Thou
s
0
5
Employees, #
an
15
30
ds
Europe
America
0
1
4
Turnover, £m
lio
North
Asia‐Pacific
5
6
Bil
2
3
7
ns
Somerset House, New Wing, Strand, London, WC2R 1LA, United Kingdom [email protected] londoneconomics.co.uk @LE_Aerospace