1 THE CAUSES OF SEVERE CONVECTIVE OUTBREAKS IN ALBERTA By stephan Bryan smith A disst!rtation. subrnitted to the Faculty of Graduate Studies and Research in partial fulfillment of the requirements for the degree of Doctor of Philosophy Departrnent of Meteorology McGill University Montreal, Canada October, 1990 @ stephan Bryan smith
Transcript
1
THE CAUSES OF SEVERE CONVECTIVE OUTBREAKS IN ALBERTA
By
stephan Bryan smith
A disst!rtation. subrnitted to the Faculty of Graduate Studies
and Research in partial fulfillment of the requirements
for the degree of Doctor of Philosophy
Departrnent of Meteorology
McGill University
Montreal, Canada
October, 1990
@ stephan Bryan smith
(2)
ABSTRACT
Analysis of high resolution observational data gathered
during a mesoscale field experiment in central Alberta
(LIMEX-S5) has led to a conceptual model of severe
convecti ve outbreaks in Alberta. It is proposed that most
severe convective events result when upper-level cooling,
associated with an advancing, synoptic-scale trough, oceurs
in phase with strong surface heating over the Alberta
foothills. The deep destabilization over the elevated
topography acts to amplify the mountain-plain circulation
and to generate mesoscale upslope moisture transport.
Concurrently, the surface synoptic pressure gradient gi ves
rise to east-northeasterly winds which advect the moisture
rich air of the eastern plains into the lower-branch of the
mountain-plain circulation. In this manner, the plains
moisture is permitted to reaeh the convectively active
foothills through underrunning of the eapping lido The end
product of the synoptic-mesoscale interacti ons is the
initiation of well-organized, severe convective storms which
move eastward with the westerly component of the mid
tropospheric winds. A statistical analysis based on
archived hail data provides additional evidence for the key
synoptic-scale features of the conceptual model.
\
•
(3 )
RÉSUMt
Les analyses des observations provenant d'une experience sur
le terrain (LIMEX-S5) nous ont mené à concevoir un modèle de
la convection violente en Alberta. On suggère que les
orages les plus violents se déclenchent lorsqu'un
refroidissement en altitude, associé à un creux à l'échelle
synoptique, s'éffectue pendant la période de réchauffement
maximal au sol sur des contreforts des montagnes Roch~uses.
Une telle déstabilisation permet l'amplification de la
circulation montagne-plaine. En même temps, le gradient de
pression à l'échelle synoptique produit des vents de surface
qui déplacent de , 'air humide des plaines vers la
circulation montagne-plaine. Ce processus a pour
consequence le transport de l'air humide vers les
contreforts ou les orages se développent. Trainés par les
vents d'ouest en altitude, les orages se déplacent vers
l'est.
chutes
Un analyse statistique, basée sur les donnees des
de grêlons, démontre que les caractér ist iques
synoptiques de notre modèle sont aussi présentes dans les
observations à long terme.
1
(4)
ACKNOWLEDGEMENTS
l offer my sincerest thanks to my superviser, Dr. Peter
Yau, whose high scientific standards never failed to bring
out the best in me and my research. l am very grateful to
Dr. Geoff strong for his dogged persistence in making LIME X-
85 a reality. The Alberta Research Council (ARC) supplied
the LIMEX-85 dataset at no cost. Members of ARC pa st and
present who assisted this study in various ways include F.
Bergwall, B. Kochtubajda, Dr. M. English, and Dr. B.
Humphries. The Atmospheric Environment Service of Canada
(AES) also supplied data at no ~·ost. Employees of AES who
got things done in a neat, timely manner include R. Honch
(radar PPI's and satellite images), E. Coatta (B.C.
barograph traces), W. Prusak (Alberta barograph traces), and
M. Webb (AES surface observations). l would like to
acknowledge the aid of Alan Schwartz in sol ving numerous
software and hardware problems over the years. The fine
work of Ursula Seidenfuss in preparing the figures is most
appreciated. l thank Mark Hedley for sorne stimulating
discussions and hearty commiseration. A special thanks is
offered to Professors Rogers and Derome for granting me the
opportunity to teach throughout my time at McGill. The
financial support of the Oepartrnent of Meteorology at McGill
is gratefully acknowledged. Lastly l thank my wife Oillma
and rny daughter Pamina for their patience, support, and love
( without which the complet ion of this dissertation would not
have been possible.
1 STATEMENT OF ORIGINALITY
The original work contained in this study includes:
(1) A combined mesoscale and synoptic scale analysis of the pre-storm environment in central Alberta for several case days.
(2) A conceptual model of severe convective outbreaks in Alberta taking into account the interaction bet-ween the mountain-plain and synoptic circulations.
(3) A statistical analysis of the relationship between the synoptic setting and the severity of convectio.l. The analysis made use of 12 summers of hailfall data, surface analyses, and upper-air analyses.
l
(5 )
TABLE OF CONTENTS
Abstract
Résumé
Acknowledgements
Table of Contents
List of Figures
List of Tables
1. INTRODUCTION
1 . 1 Background
1.2 The Alberta problem
1.3 statement of the problem
1.4 Outline of dissertation
Page
2
3
4
5
10
16
17
17
22
25
26
1
l
1
(6)
2. OBSERVATIONAL DATA AND METHODS OF ANALYSIS 28
2.1 The LIrnestone Mountain EXperirnent (LIMEX-B5) 28 and data analysis
3. A CASE STUDY OF A SEVERE CONVECTIVE OUTBREAK 34 - 11 JULY 1985
3.1 Introduction 34
3.2 Operational, 500 rnb analysis 34
3.3 Mesoscale analysis 35
3.3.1 Removal of capping lid by surface heating 35 during a period of upper-level cooling (8-12 LDT)
3.3.2 Underrunning and low-Ievel moisture 40 convergence - the formation of deep convection (12-16 LOT)
3.4 Vertical cross sections of time anomalies
3.5 synoptic-scale surface analysis
3.6 vertical profiles of the horizontal wind
3.7 Summary
4. TWO CASE STUDIES OF NON-SEVERE CONVECTION - 09 AND 17 JULY 1985
4.1 Introduction
42
44
48
50
52
52
,( 5.
(7)
4.2 The 09 July case day - weak, localized convection
4.2.1 Opera~~onal, 500 rnb analysis
4.2.2 Mesoscale analysis
4.2.3 synoptic-scale surface analysis
4.2.4 vertical profiles of horizontal wind
4.3 The 17 July case day - widespread, rnoderate convection
4.3.1 Operational, 500 rnb analysis
4.3.2 Mesoscale analysis
4.3.3 synoptic-scale surface analysis
4.3.4 Vertical profiles of horizontal wind
4.4 Discussion
A COMPARISON OF LIMEX-85 CASE DAYS
5.1 l ntroduct ion
5.2 Cornparison of LIMEX-85 days
5.2.1 July 08, 1985
5.2.2 July 09, 1985 (see Chapter 4)
5.2.3 July 10, 1985
53
54
54
56
58
59
59
60
61
62
62
65
65
65
65
66
66
r !
(8)
5.2.4 July 11, 1985 (see Chapter 3)
5.2.5 July 12, 1985
5.2.6 July 15, 1985
5.2.7 July 16, 1985
5.2.8 July 17, 1985 (see Chapter ... )
5.2.9 July 18, 1985
5.2.10 July 22 and 23, 1985
5.3 Summary
6. A CONCEPTUAL MODEL OF SEVERE CONVECTIVE OUTBREAKS IN ALBERTA
67
67
68
68
69
70
70
'Il
76
6.1 Stage 1 - Upper-level warming, strong surface 76 heating, a westerly component of the surface synoptic fIow, weak to moderate shear -weak, Iocalized convection
6.2 Stage 2 - Upper-level cooling, strong surface 77 heating, an easterly component of the surface synoptic flow, strong shear - severe convective out break
6.3 Discussion
7. STATISTICAL ANALYSIS
7.1 Introduction
7.2 Dataset and method of analysis
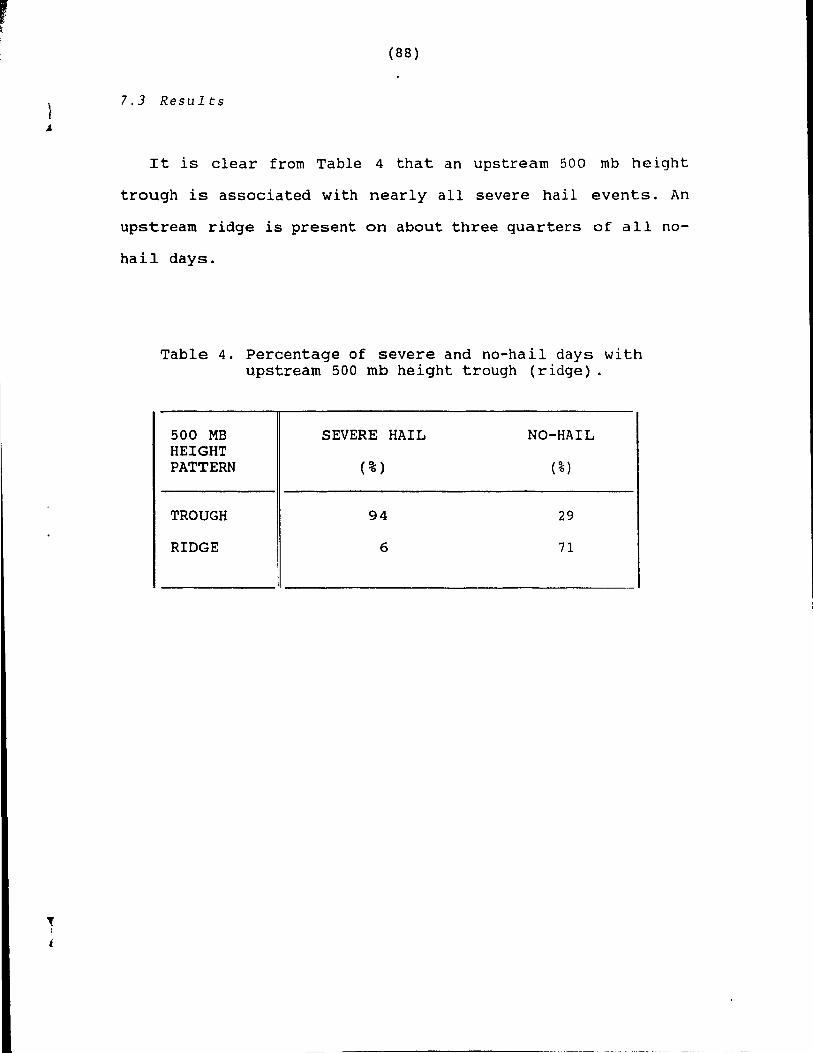
7.3 Results
8. CONCLUSIONS
8.1 Summary and conclusions
8.2 Suggestions for future research
79
82
82
82
88
99
99
102
(9)
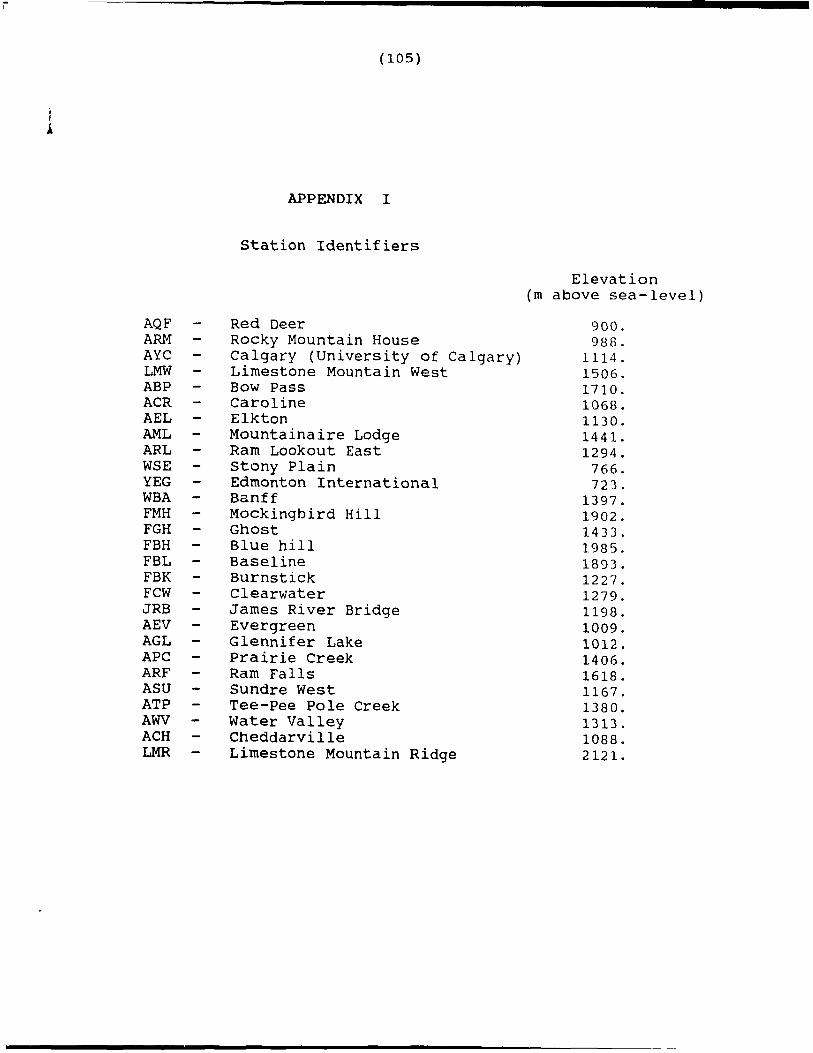
APPENDIX l 105 1
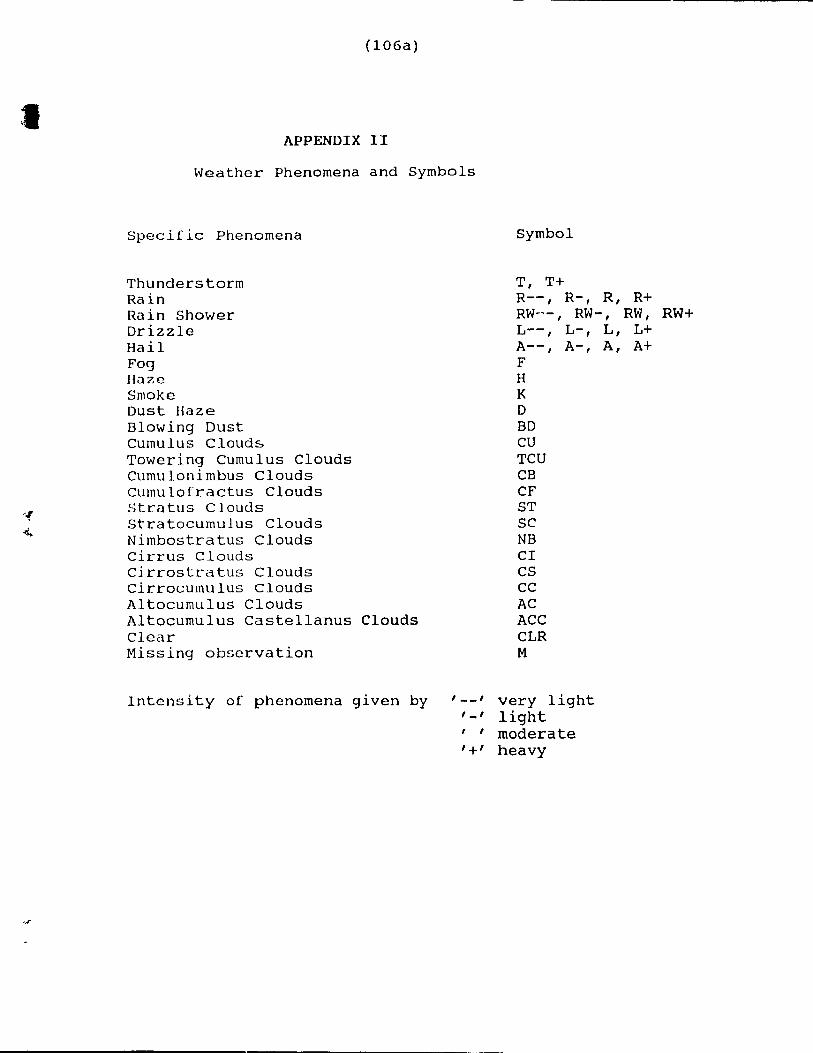
APPENDIX II and III 106
REFERENCES .t07
FIGURES 111
• j
1
( 10)
LIST OF FIGURES
Figure
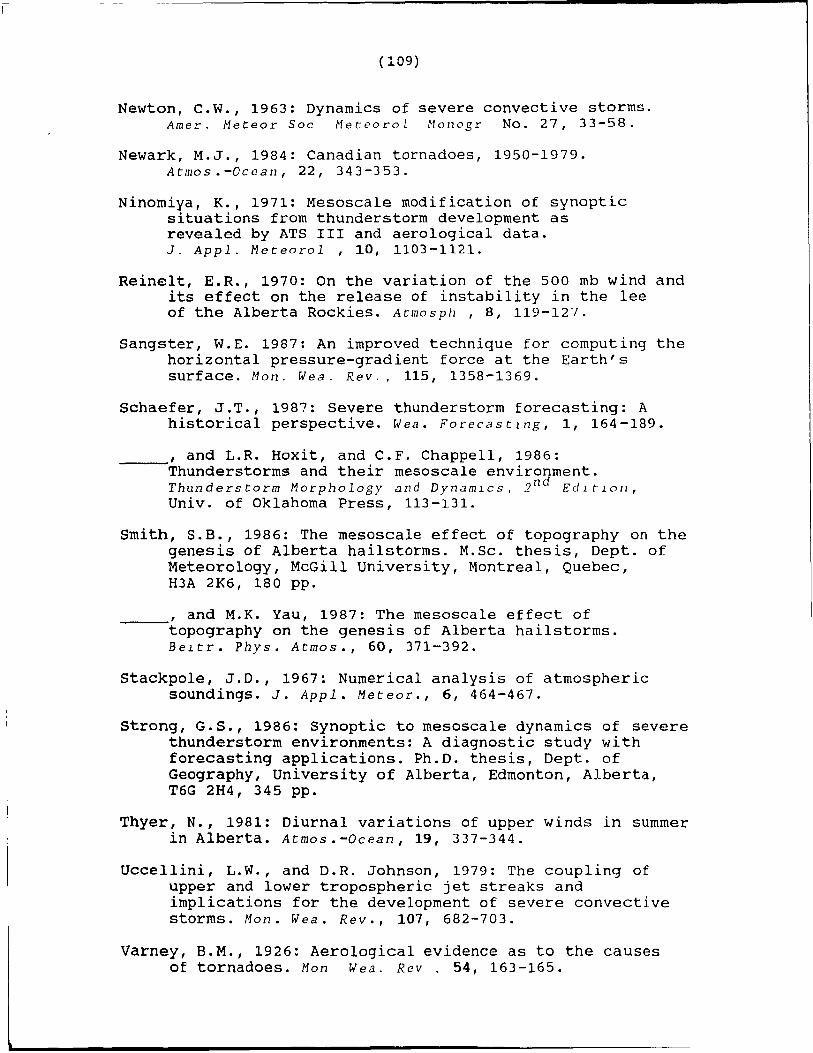
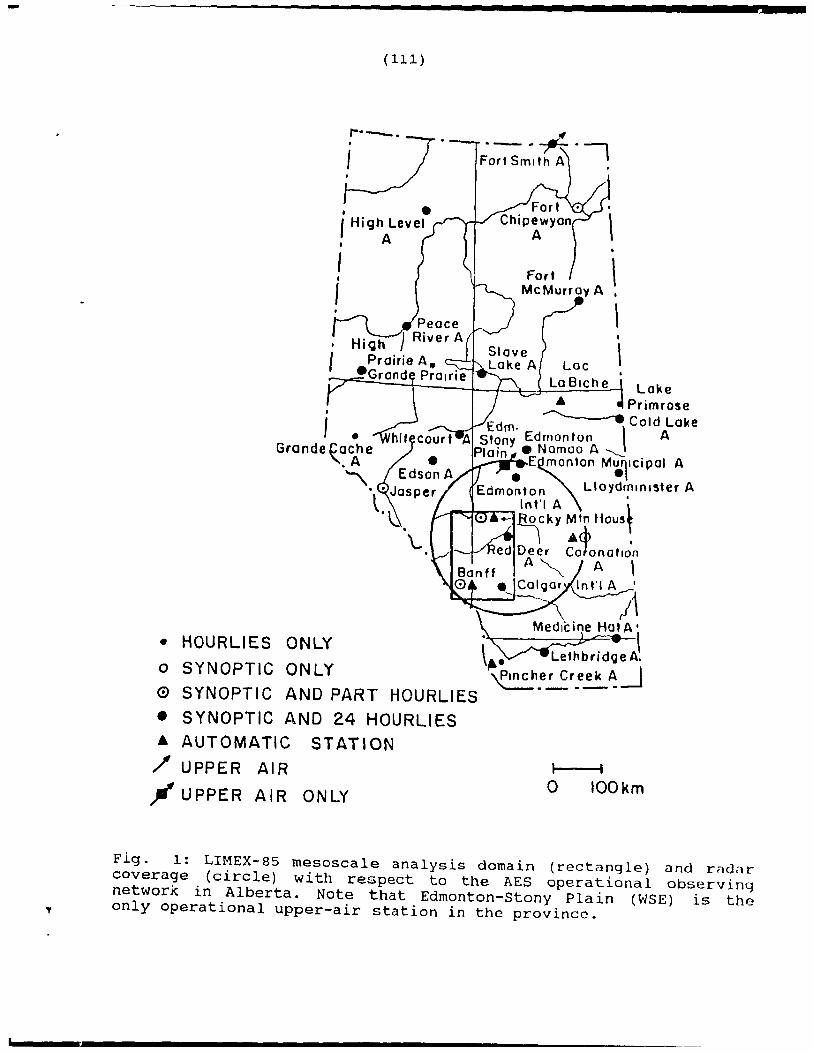
1 LIMEX-85 mesoscale analysis domain (rectangle) 1Ll and radar coverage (circle) with respect to the AES operational observing network in Alberta. Note that Edmonton-stony Plain (WSE) is the only operational upper-air station in the province.
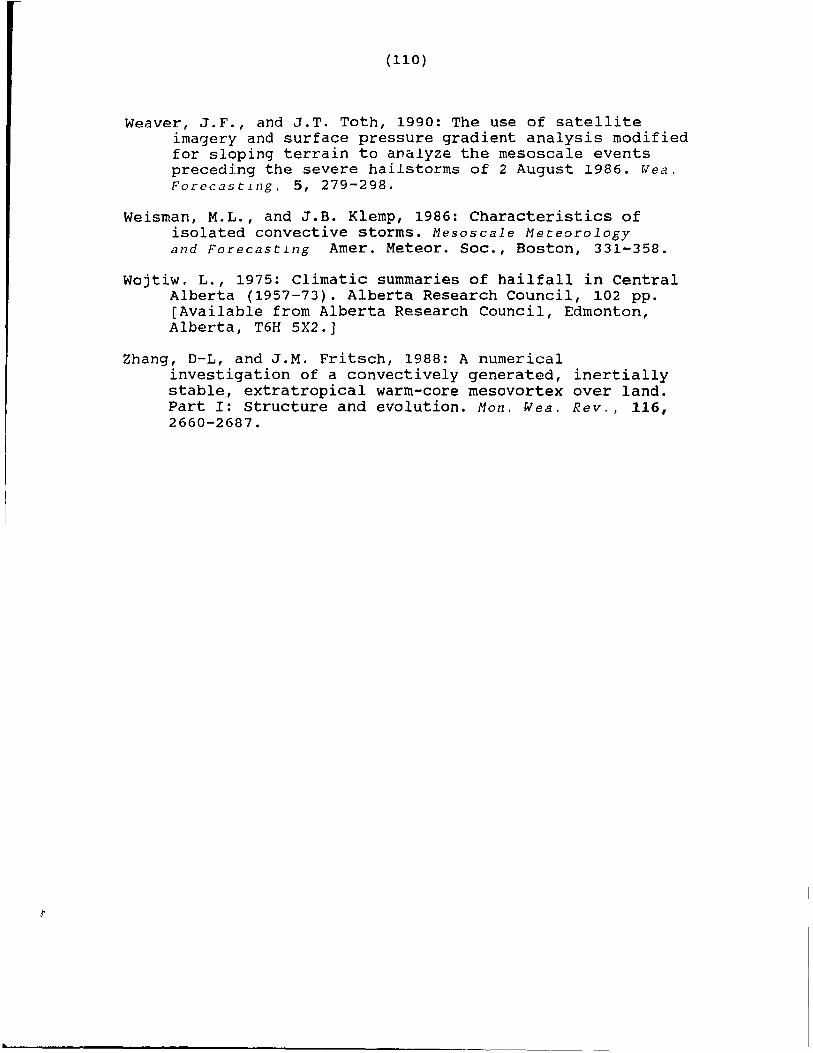
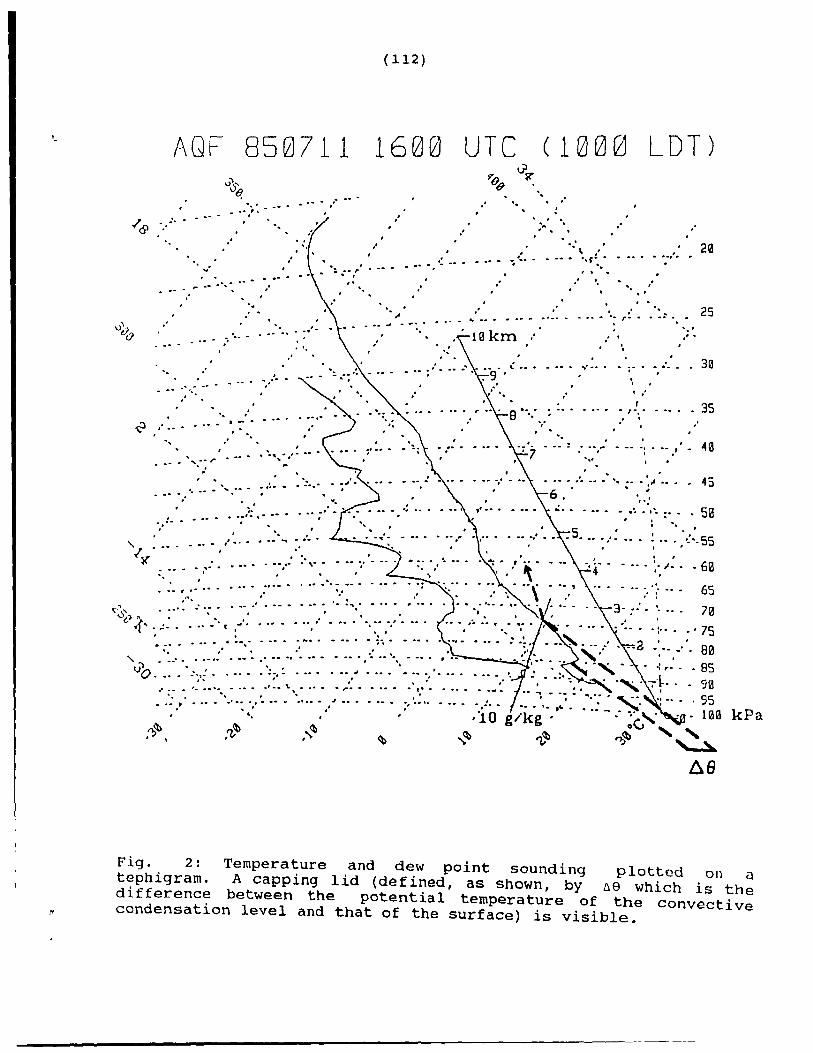
2 Temperature and dew pOi!'lt sounding plotted on a 112 tephigram. A capping lid (defined, as shown, by 69 whicll is the difference between the pot.ênt laI temperature of the convective condensation level and that of the surface) is visible.
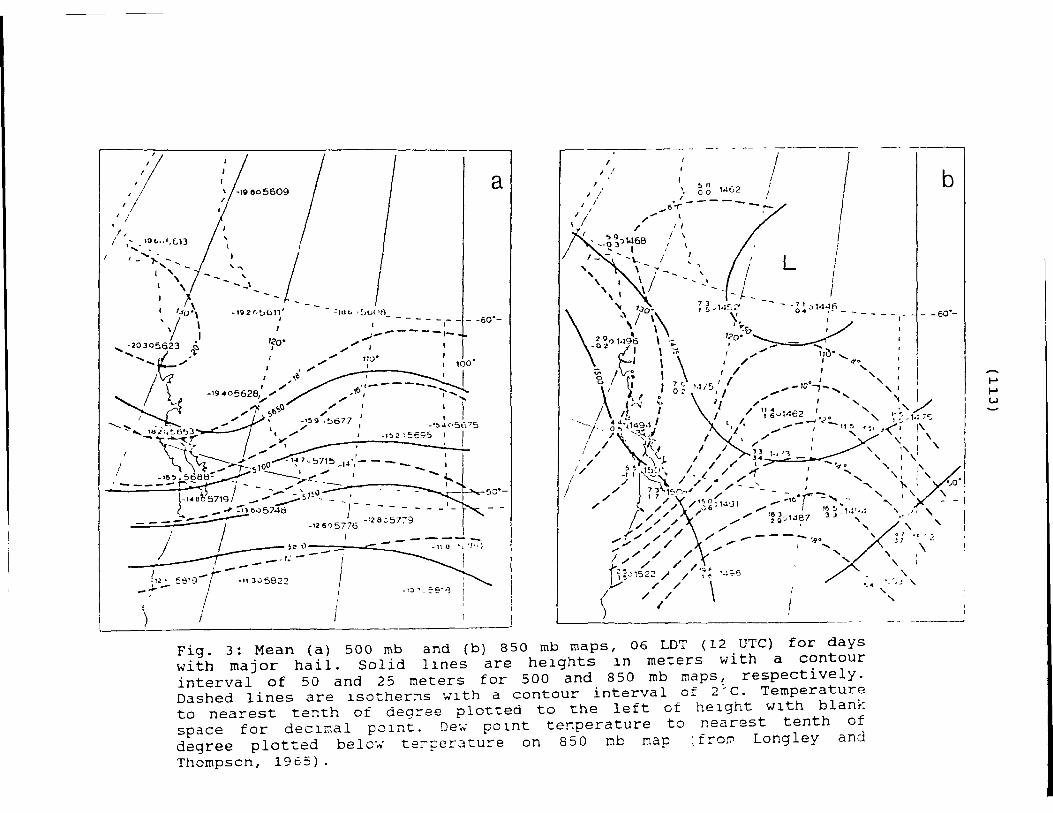
3 Mean (a) 500 mb and (b) 850 mb maps, 06 LOT 113 for days with major hail. Solid lines are heights in meters with a contour interval of 50 ~nd 25 meters for 500 and 850 mb maps, respectively. Dashed lines are isotherms with a contour interval of 2°e. Temperature to nearest tenth of degree plotted to the left of height with blank spuce for decimal point. Dew pojnt temperature to nearest tenth of degree plotted below temperature on 850 mb map (froro Langley and Thompson, 1965).
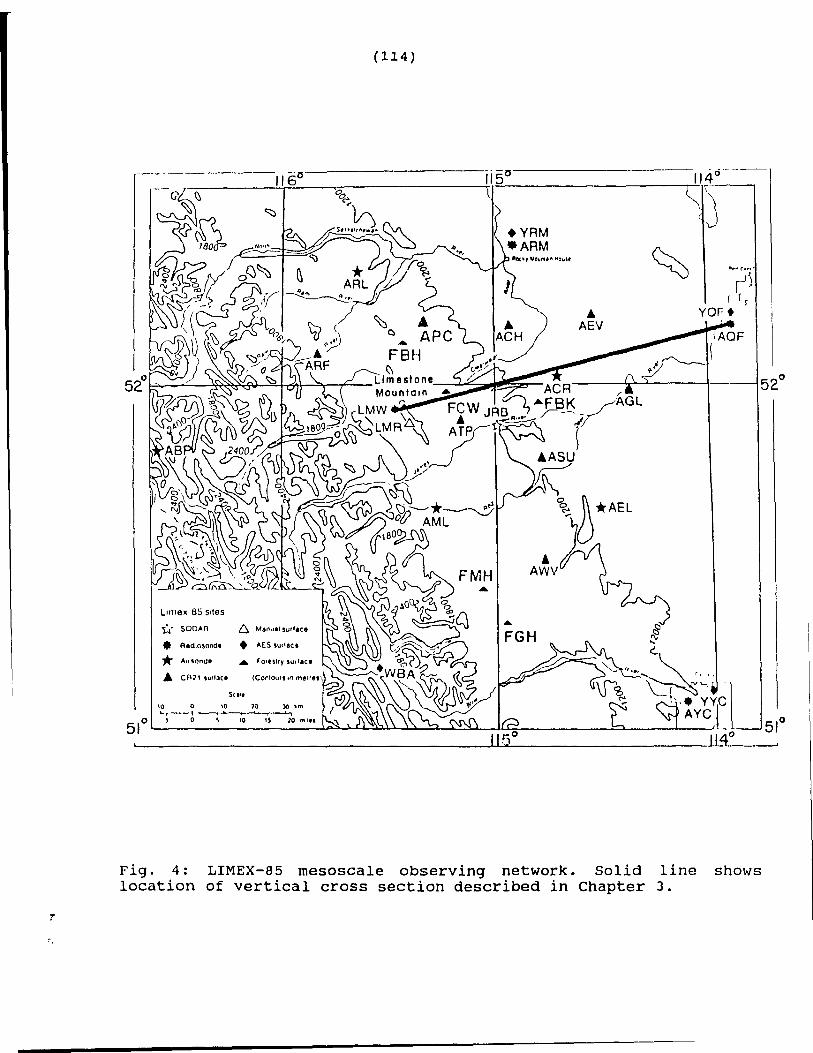
4 LIMEX-85 mesoscale observing network. Solid 114 line shows location of vertical cross section described in Chapter 3.
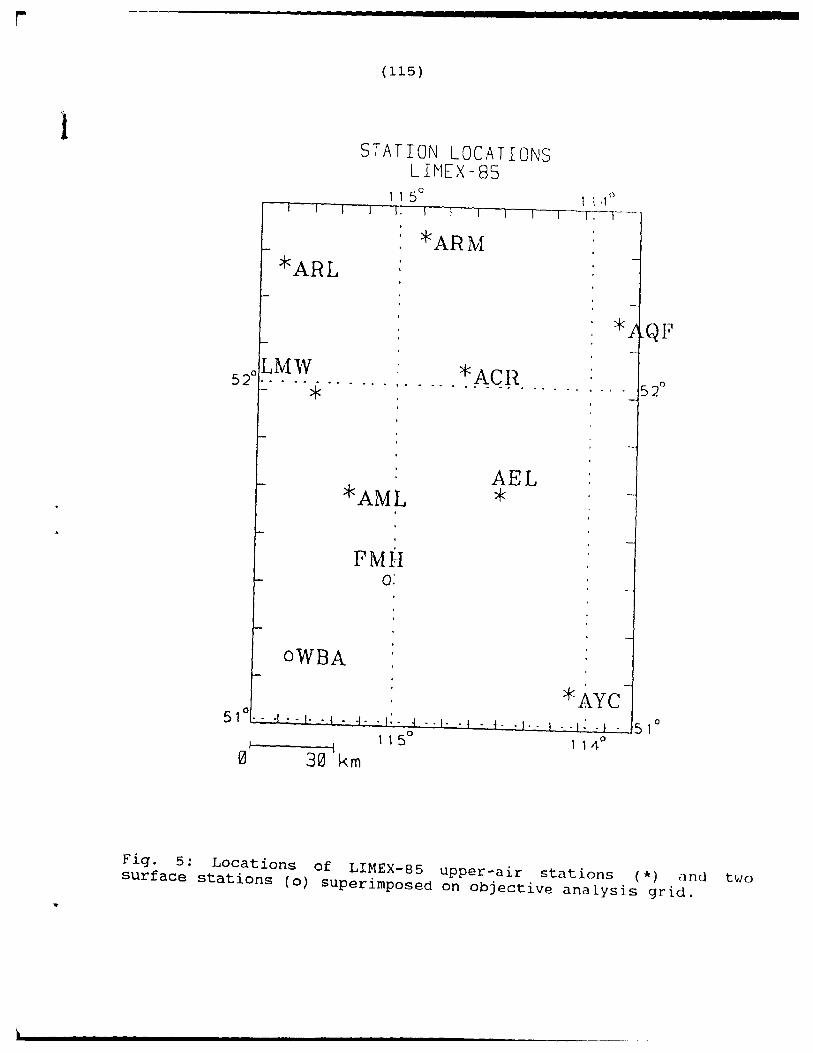
5 Locations of LIMEX-85 upper-air stations (*) 115 and two surface stations (0) superimposed on obiective analysis grid.
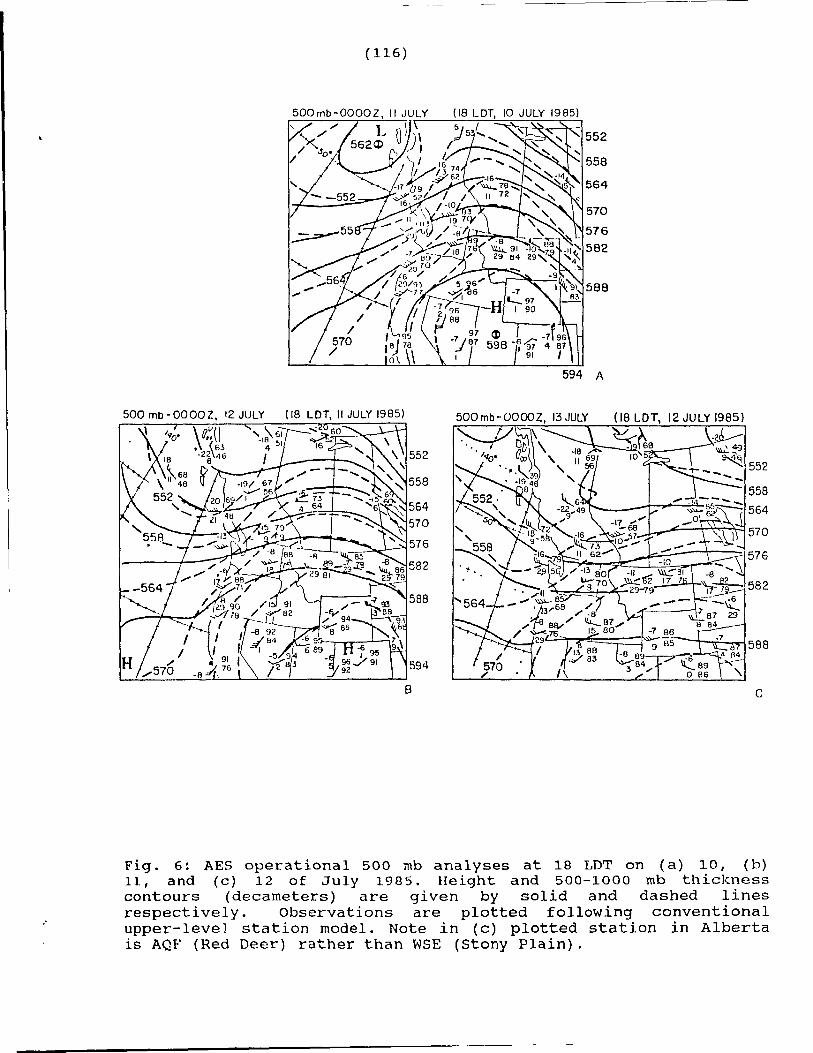
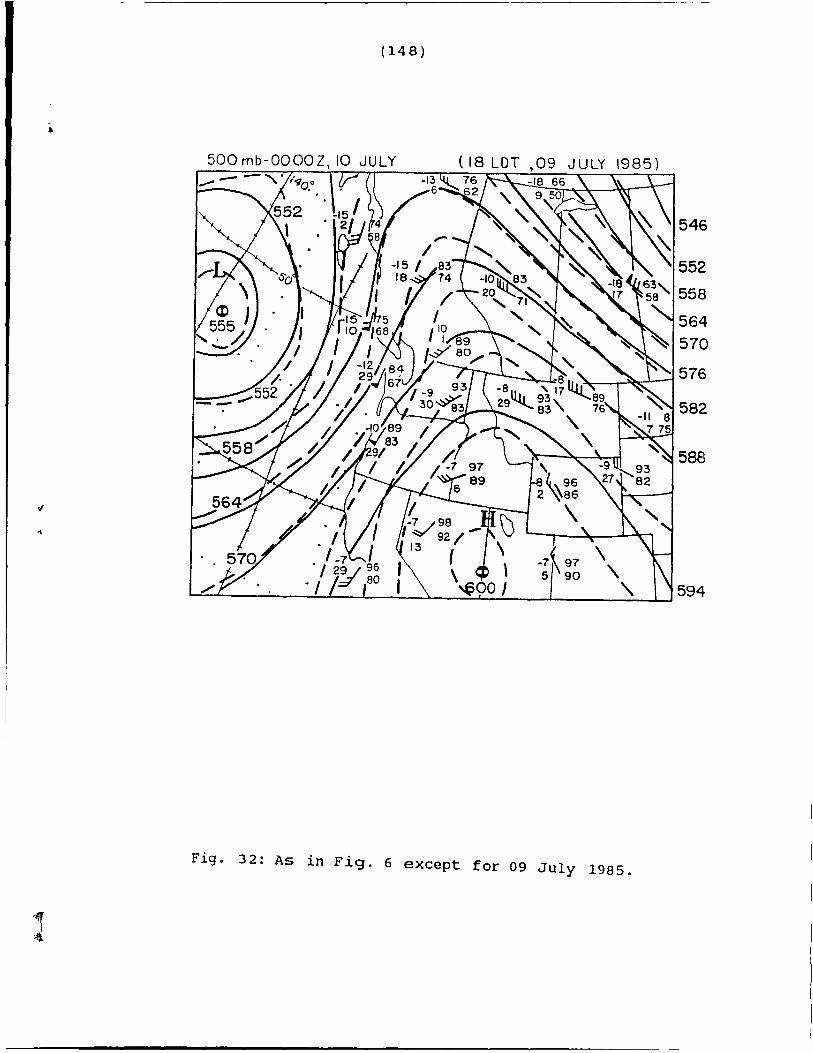
6 AES operational 500 mb analyses at 18 LOT 116 on (a) 10, (b) 11, and (c) 12 of July 1985.
7
8
Height and 500-1000 mb thickness contours (decameters) are given by solid and dashed lines resp'9ctiveIy. Observations are plotted foilowing C!onventional upper-levei stat.ion model.
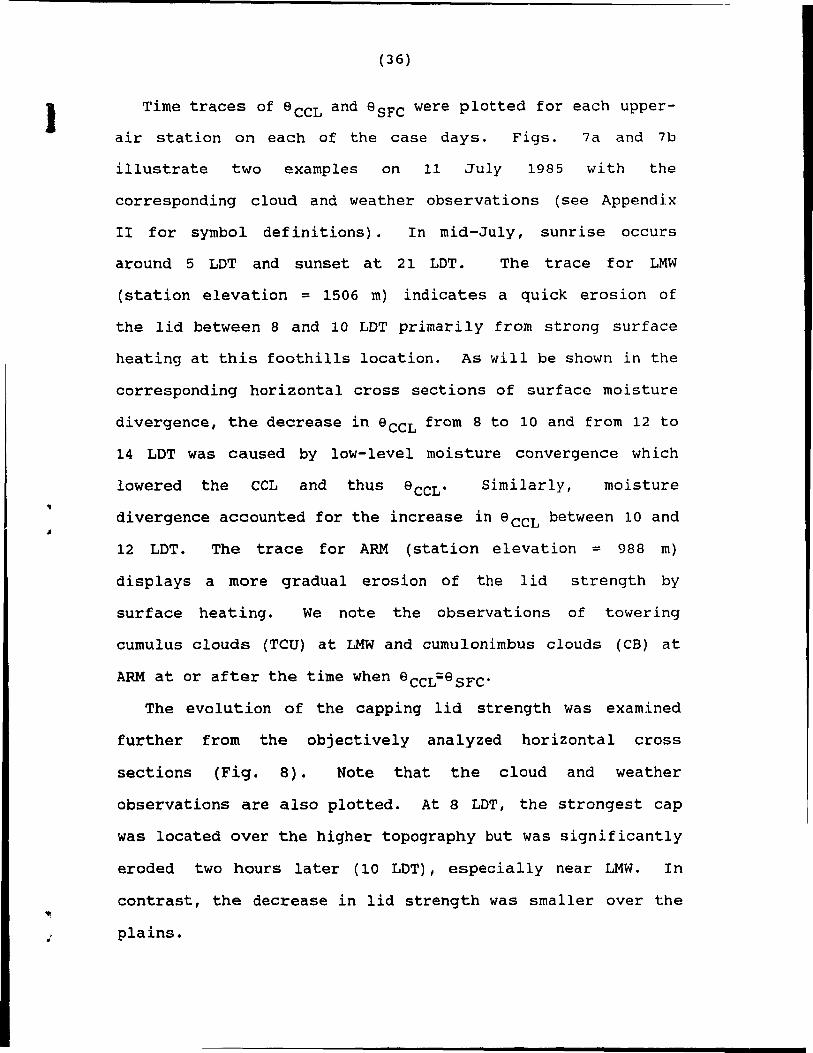
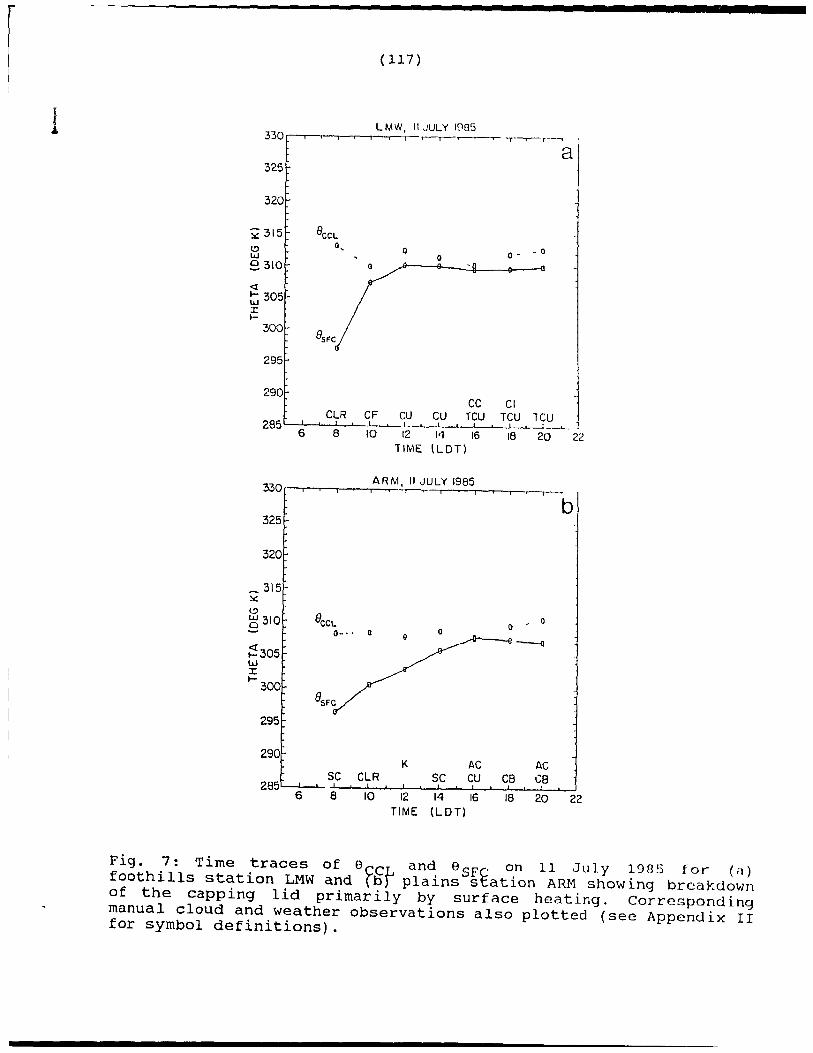
Time traces of 9 CCL and 9 sFe on 11 July 1985 for (a) foothills station LMW and (b) plains station ARM showing breakdown of the capping lid primarily by surface heating. eorresponding manual cloud and weather observations aiso plotted (see Appendix II for syrnboi definitions) •
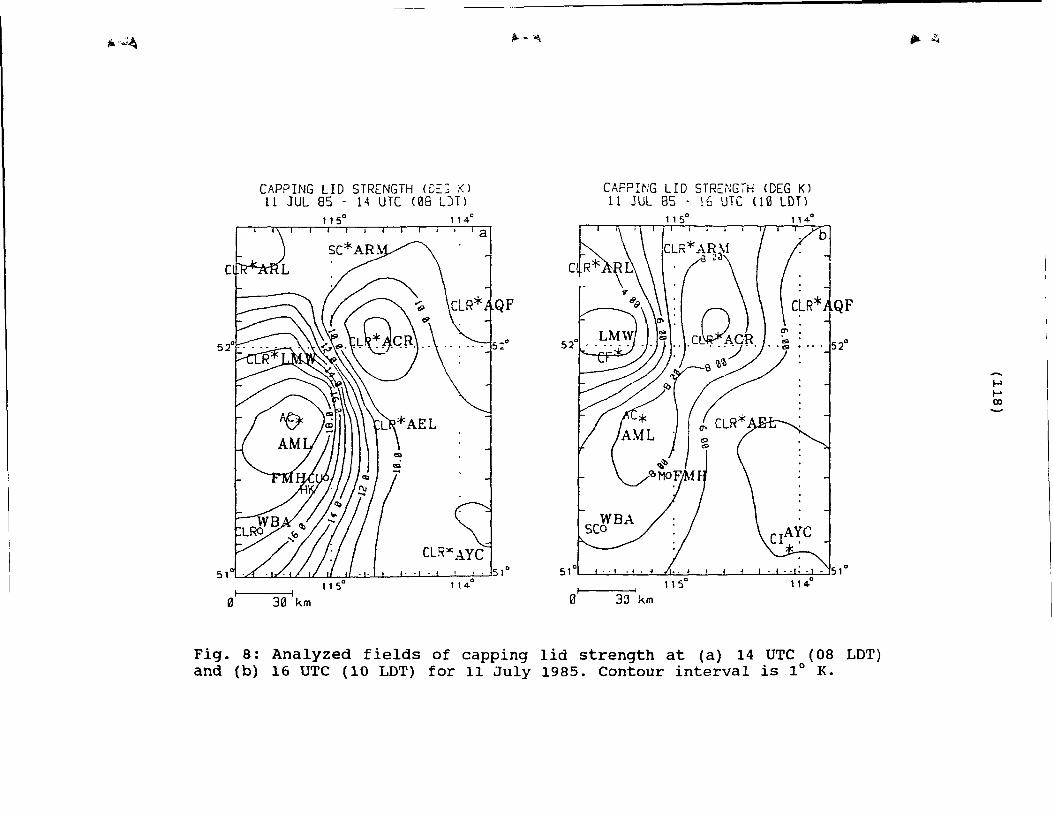
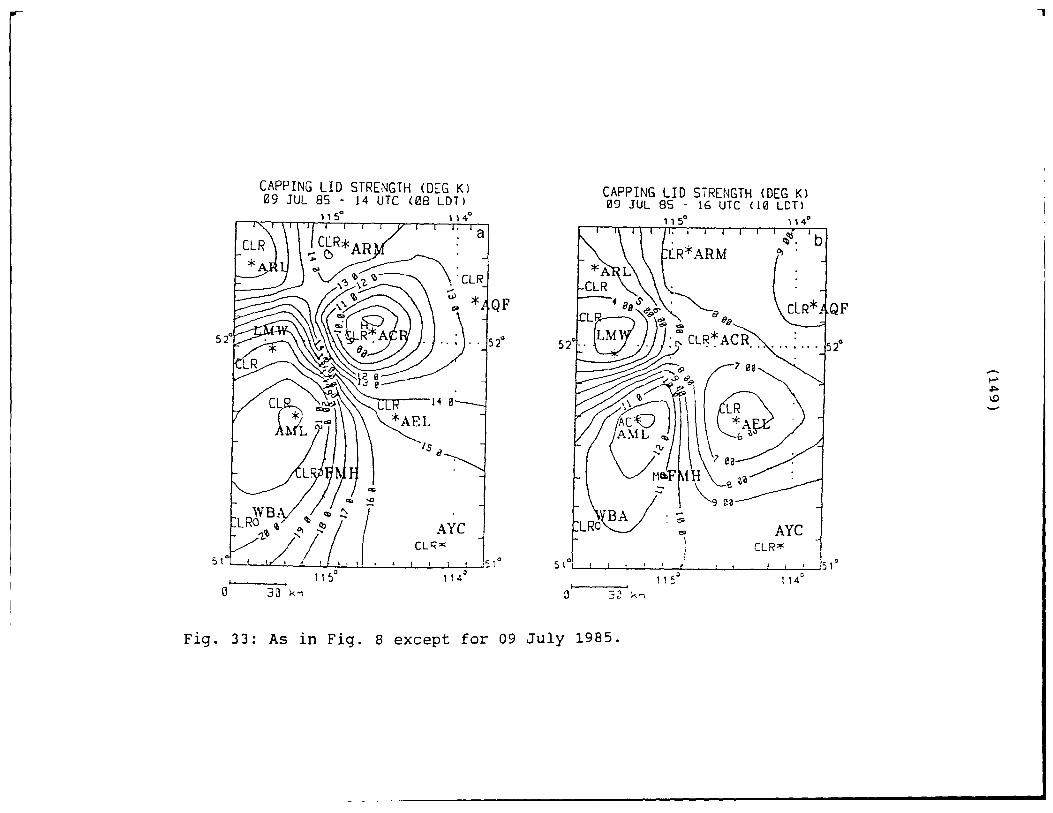
AnaIyzed fields of capping lid strength at (a) 14 UTe (08 LOT) and (b) 16 UTe (10 LOT) for 11 July 1985. Contour intervai is 1° K.
117
118
«
,
9
10
11
12
(11)
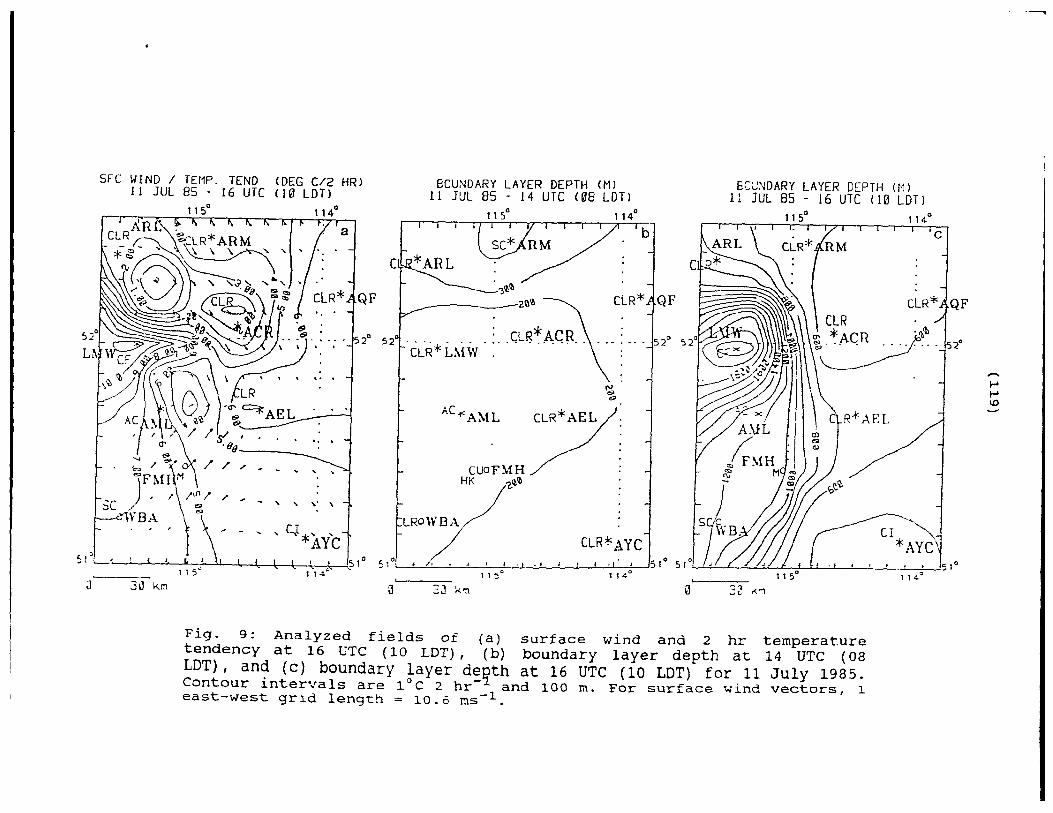
Analyzed fields of (a) surface wind and 2 hr 119 temperature tendency at 16 UTC (10 LOT), (b) boundary layer depth at 14 UTC (08 LOT), and (c) boundary layer depth at 16 UTC (10 LOT) fOI 11 July 1985. Contour intervals are 1°C 2 hr- and 100 m. For surface win~ vectors, 1 east-west grid length = 10.6 ms- .
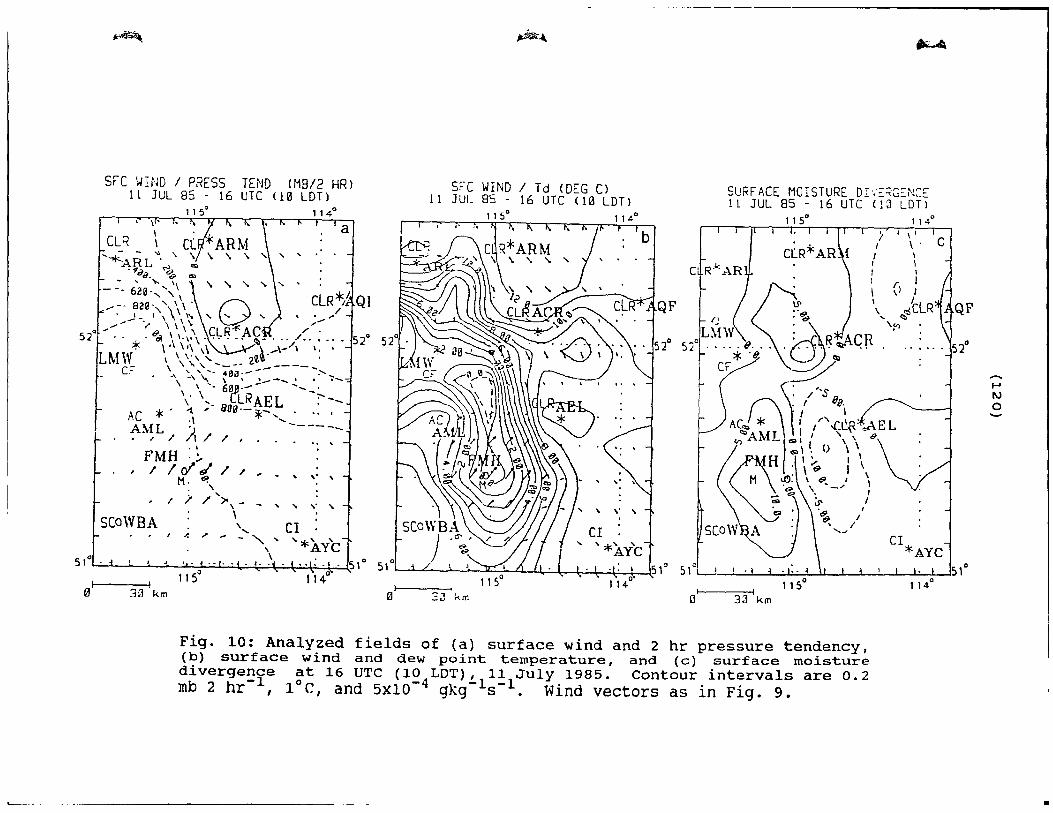
Analyzed fields of (a) surface wind and 2 hr pressure tendency, (b) surface wind and dew point temperature, and (c) surface moisture divergence at 16 UTC (10 LOT) , 11 July 19851 Contour intervals ari 1 0.2 mb 2 hr- ,1°C, and 5X10⁻⁴ gkg- s-. Wind vectors as in Fig. 9.
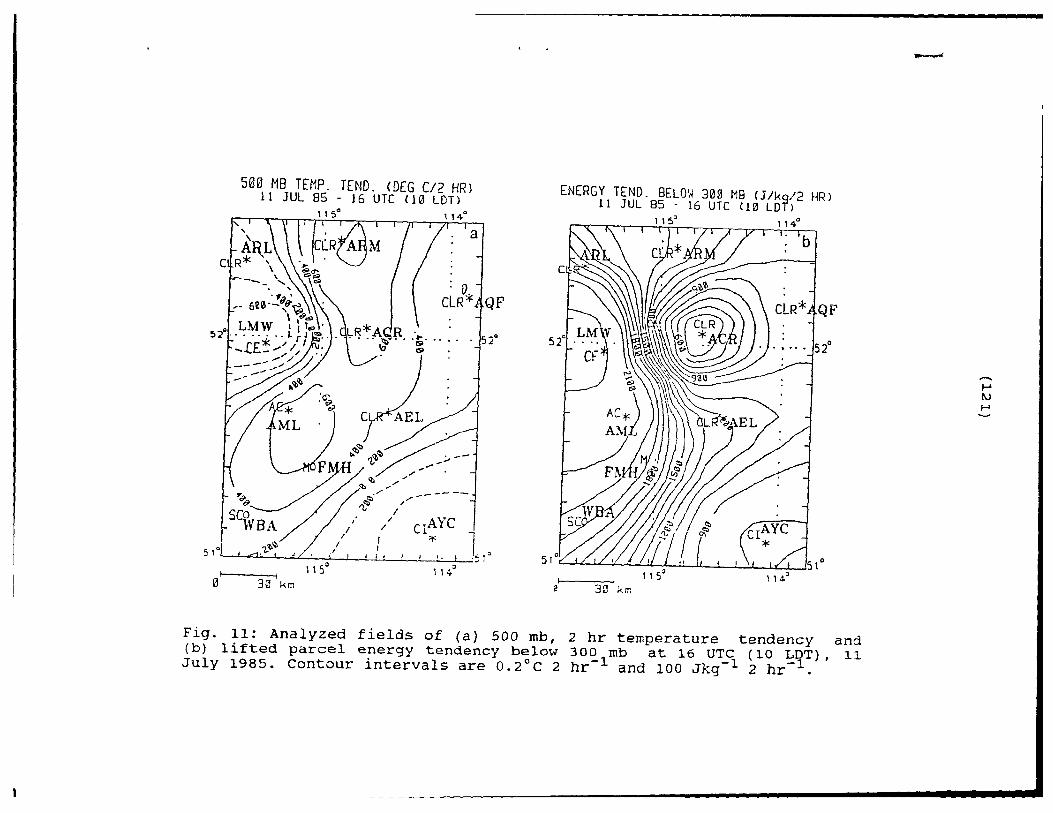
Analyzed fields of (a) 500 mb, 2 hr temperature tendency and (b) lifted parcel energy tendency below 300 mb at 16 UTC (10 LOT), 11 July 1985. contour_interv~ls are 0.2°C 2 hr-1 and 100 Jkg 2 hr •
120
121
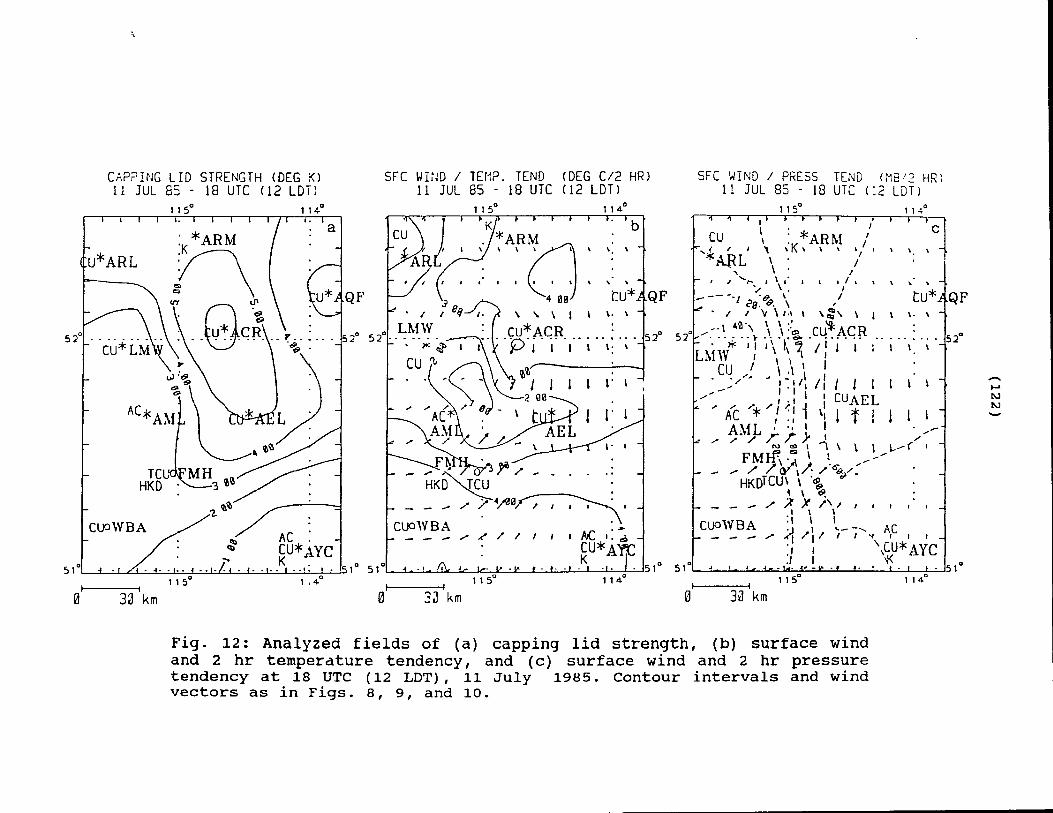
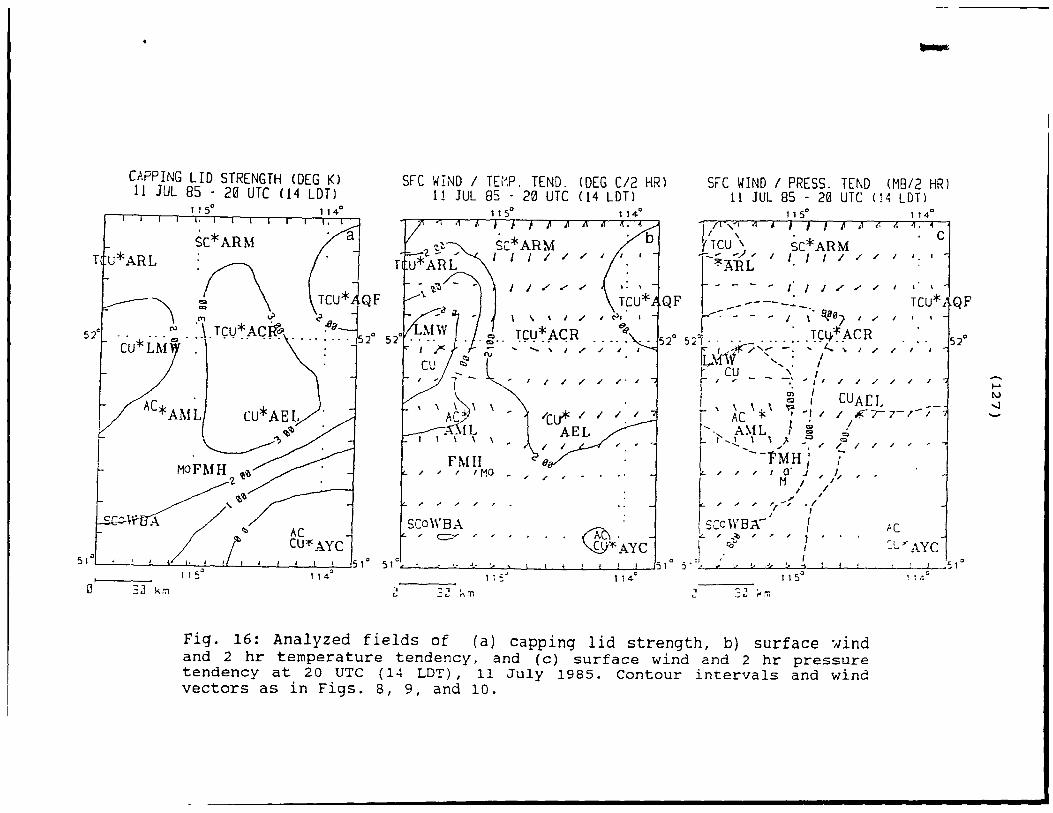
Analyzed fields of (a) capping lid strength, 122 (b) surface wind and 2 hr temperature tendency, and (c) surface wind and 2 hr pressure tendency at 18 UTC (12 LOT), 11 July 1985. contour intervals and wind vectors as in Figs. 8, 9, and 10.
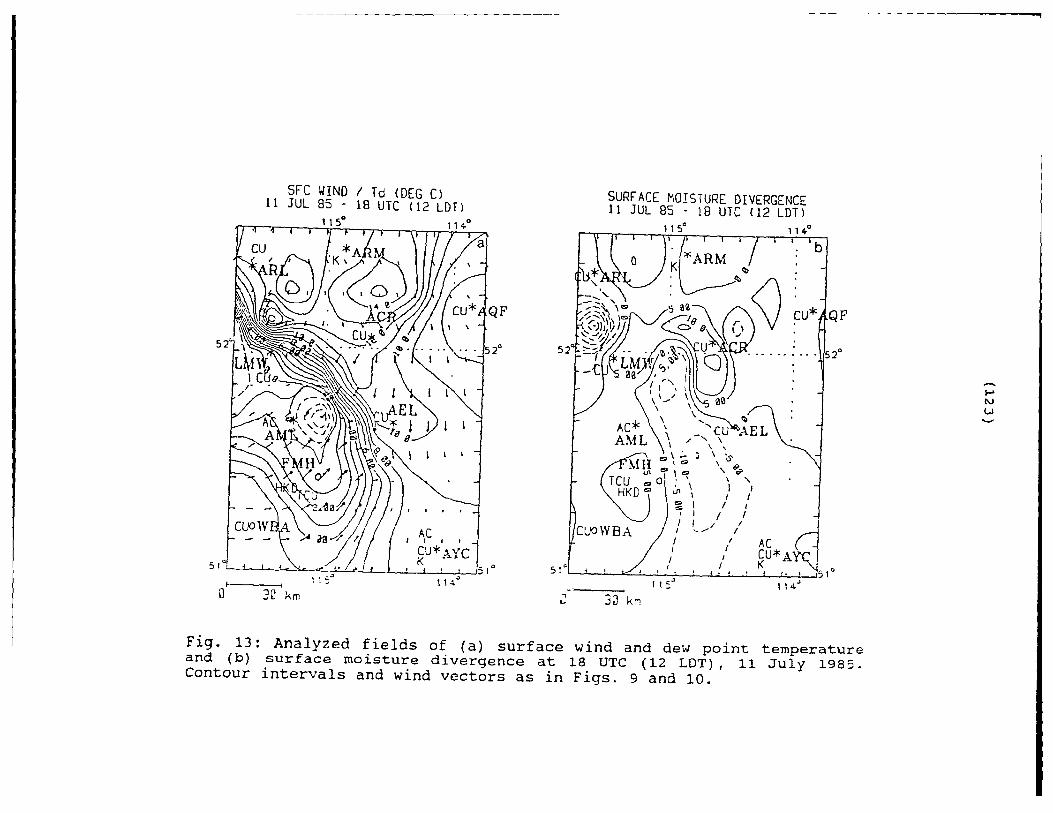
13 Analyzed fields of (a) surface wind and dew 123 point temperature and (b) surface moisture divergence at 18 UTC (12 LOT), 11 July 1985. Contour intervals and wind vectors as in Figs. 9 and 10.
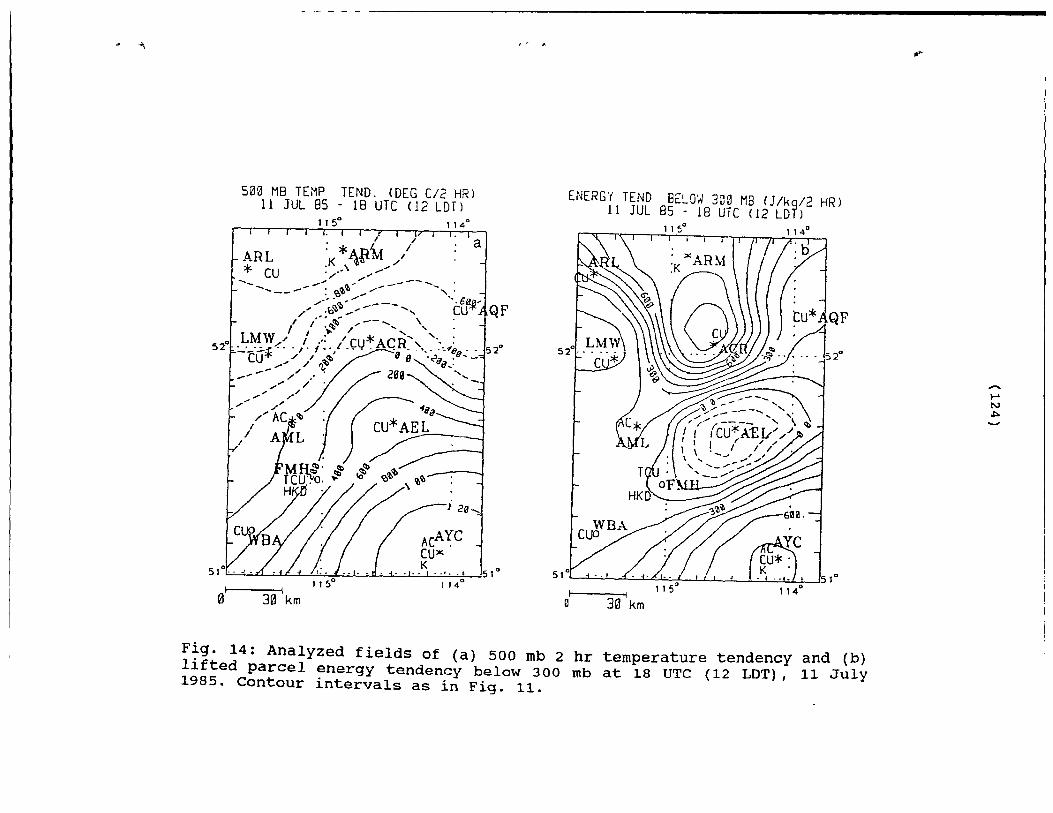
14 Analyzed fields of (a) 500 mb 2 hr temperature 124 tendency and (b) lifted parcel energy tendency
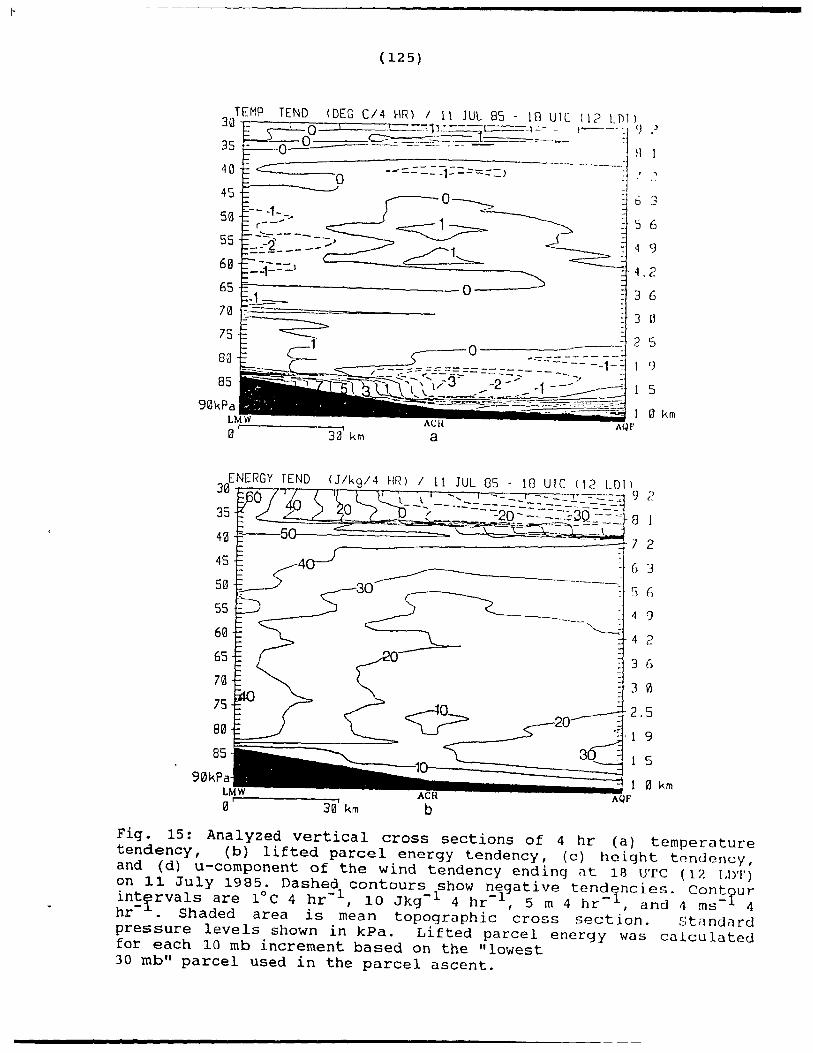
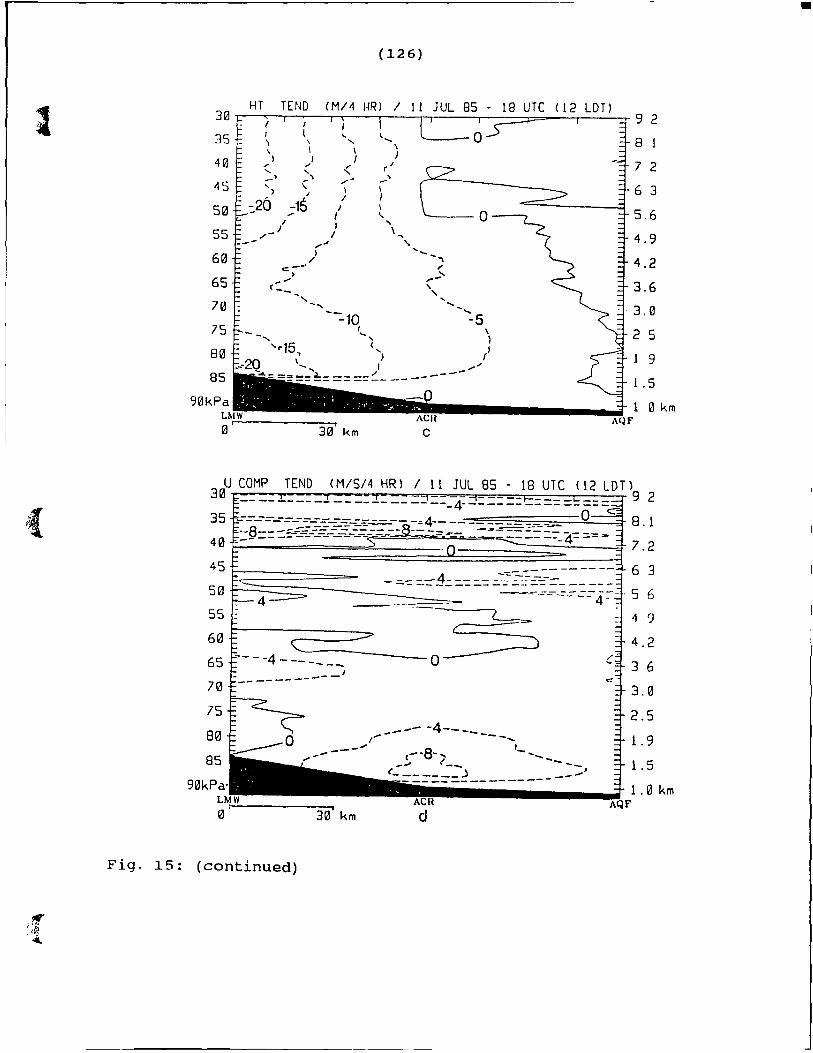
15
below 300 mb at 18 UTC (12 LOT), 11 July 1985. contour intervals as in Fig. 11.
Analyzed vertical cross sections of 4 hr (a) temperature tendency, (b) lifted parcel energy tendency, (c) height tendency, and (d) u-component of the wind tendency ending at 18 UTC (12 LDT) on 11 July 1985. Dashed contours show negative tendenciis. Contour interV!lS are 1°C 1 hr- , 10 Jk~-l 4 h
I- , 5 m 4 hr- , and
4 ms- 4 hr- • Shaded area is mean topographie cross section. standard pressure levels shown in kPa. Lifted parcel energy was calculated for each 10 mb increment based on the "lowest 30 mb" parcel used in the parcel ascent.
125
,
1 16
(12)
Analyzed fields of (a) capping lid strength, (b) surface wind and 2 hr temperature tendency, and (c) surface wind and 2 hr pressure tendency at 20 UTC (14 LOT), 11 July 1985. Contour intervals and wind vectors as in Figs. 8, 9, and 10.
127
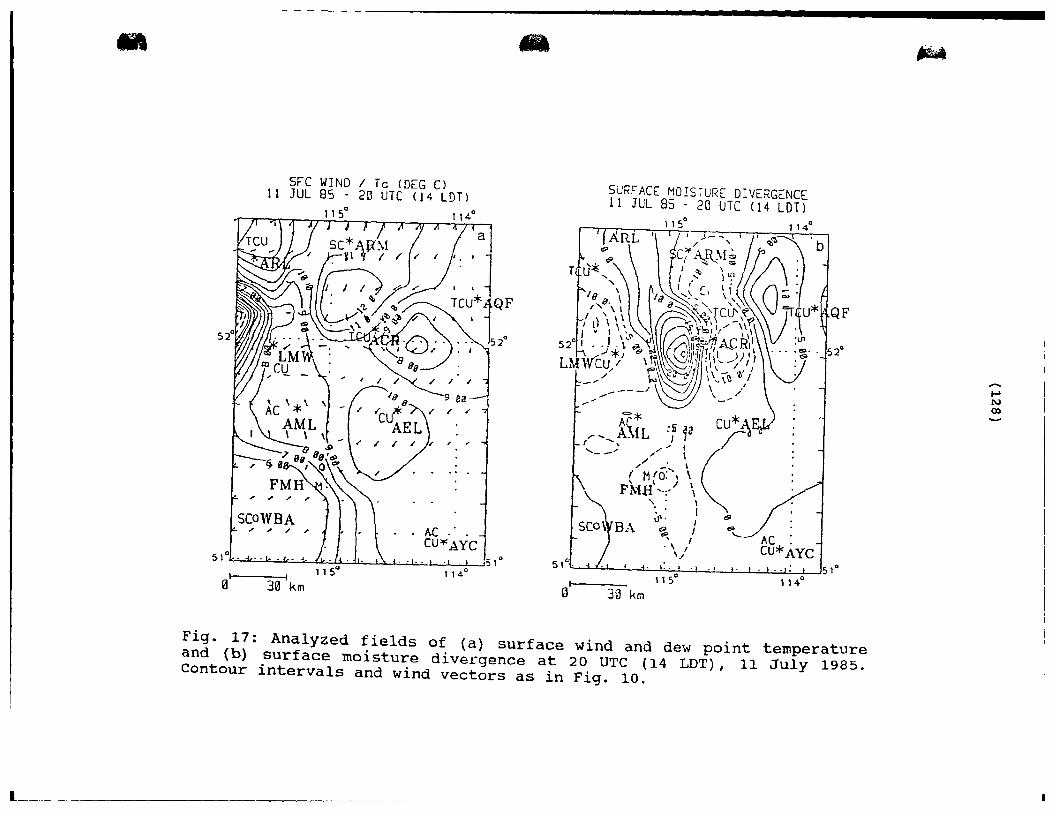
17 Analyzed fields of (a) ourface wind and dew 128 point tempe rature and (b) surface moisture divergence at 20 UTC (14 LOT), Il July 1985. Contour intervals and wind vectors as in Fig. 10.
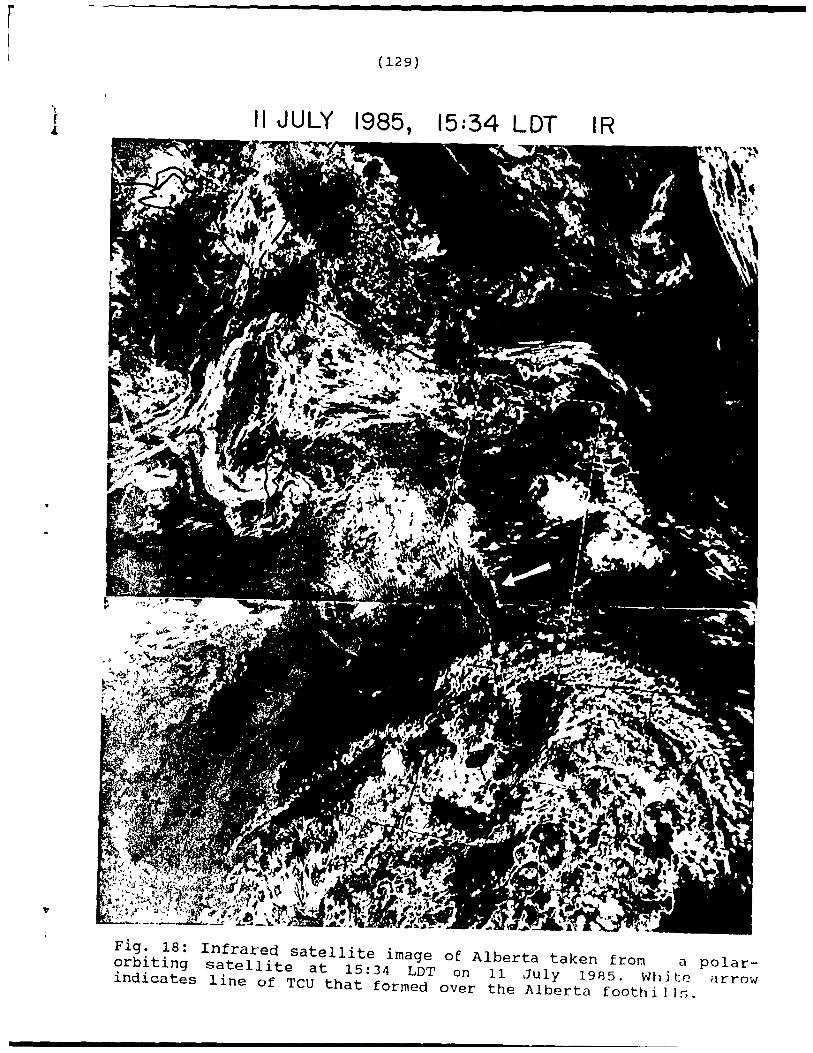
18 Infrared satellite image of Alberta taken from 129 a polar-orbiting satellite at 15:34 LOT on 11 July 1985. White arrow indicates line of TCU that formed over the Alberta foothills.
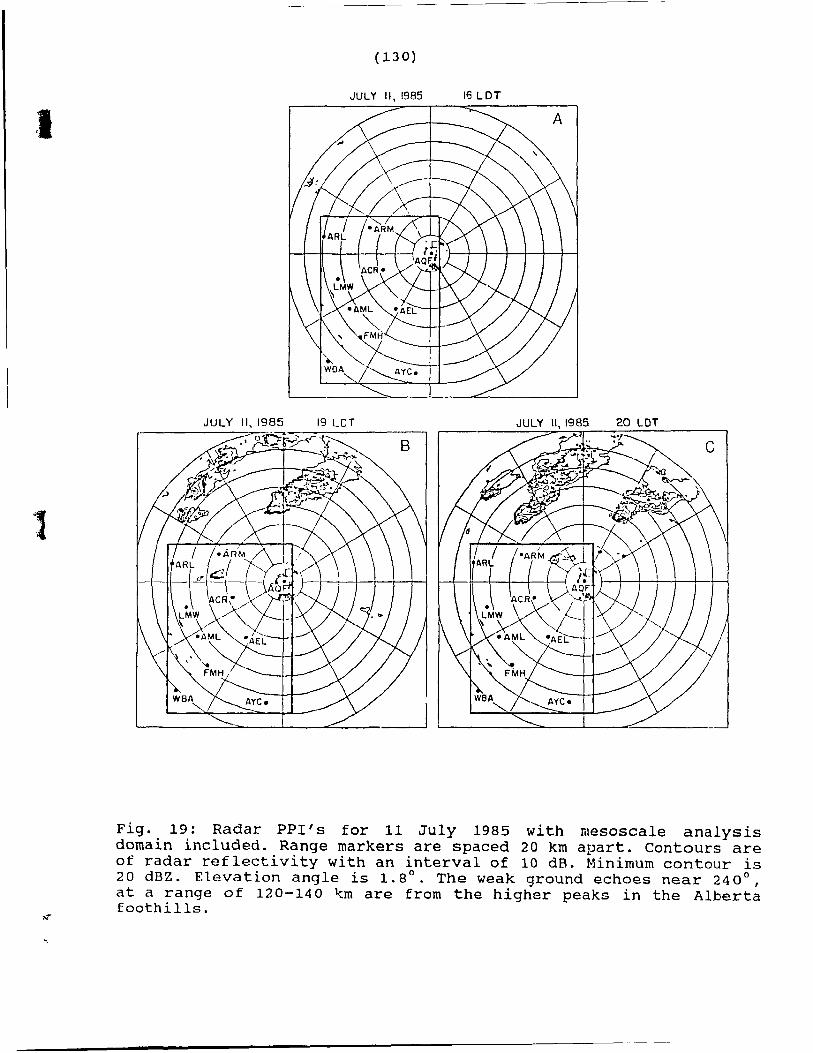
19 Radar PPI's for Il July 1985 with mesoscale 130 analysis domain included. Range markers are spaced 20 km apart. Contours are of radar reflectivity with an interval of 10 dB. Minimum contour is 20 dBZ. Elevation angle is 1.8°. The weak ground echoes near 240 0
,
at a range of 120-140 km are from the higher peaks in the Alberta foothills.
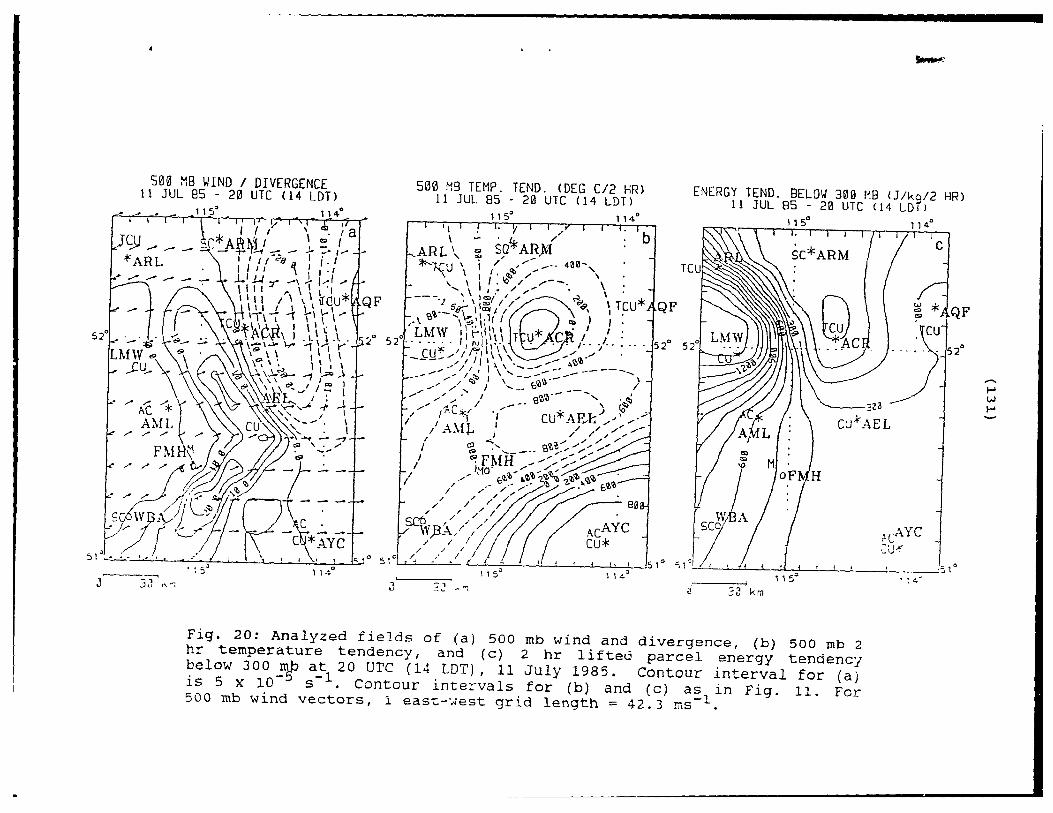
20 Analyzed fields of (a) 500 mb wind and 131 divergence, (b) 500 mb 2 hr temperature tendency, and (c) 2 hr lifted parcel energy tendency below 300 mb at 20 UTC (14 LOT), 11 July 1985. Contour intervai for (a) is 5 x 10⁻⁵ s-l. Contour intervals for (b) and (c) as in Fig. Il. For 500 mb wind ~Îctors, 1 east-west grid Iength = 42.3 ms .
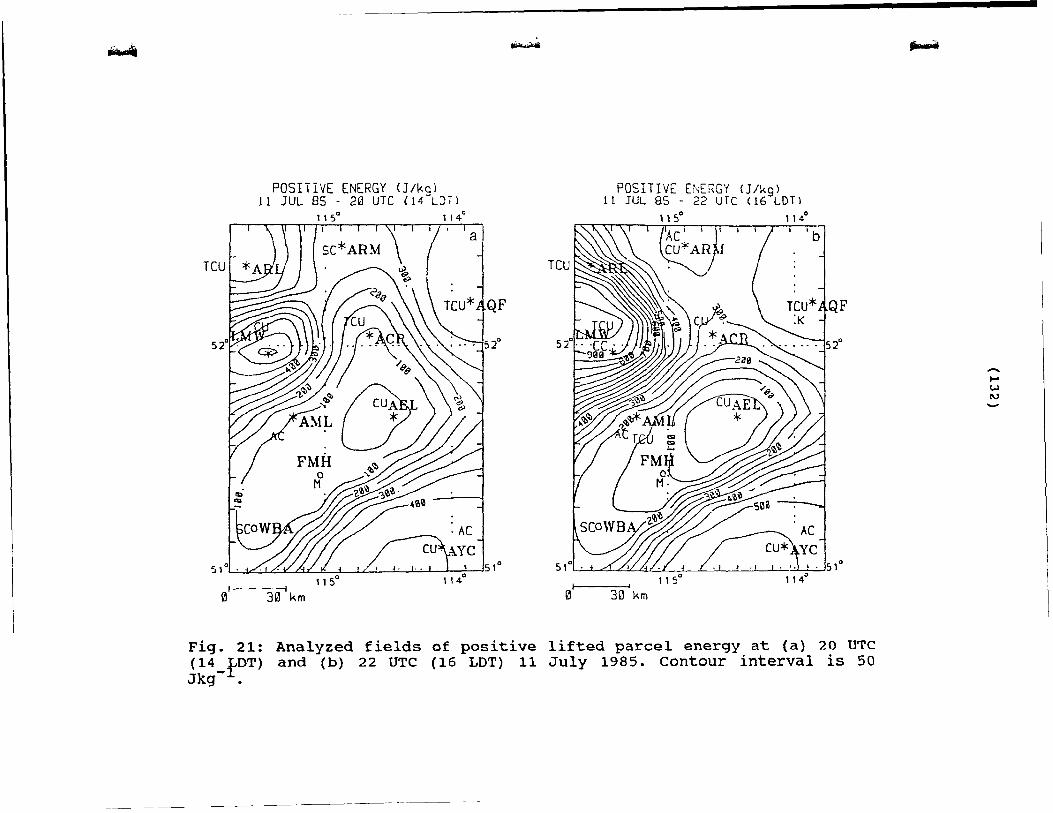
21 Analyzed fields of positive lifted parcel 132 energy at (a) 20 UTC (14 LOT) and Cb) 22 UTC (16 LO!i, Il July 1985. Contour interval is 50 Jkg •
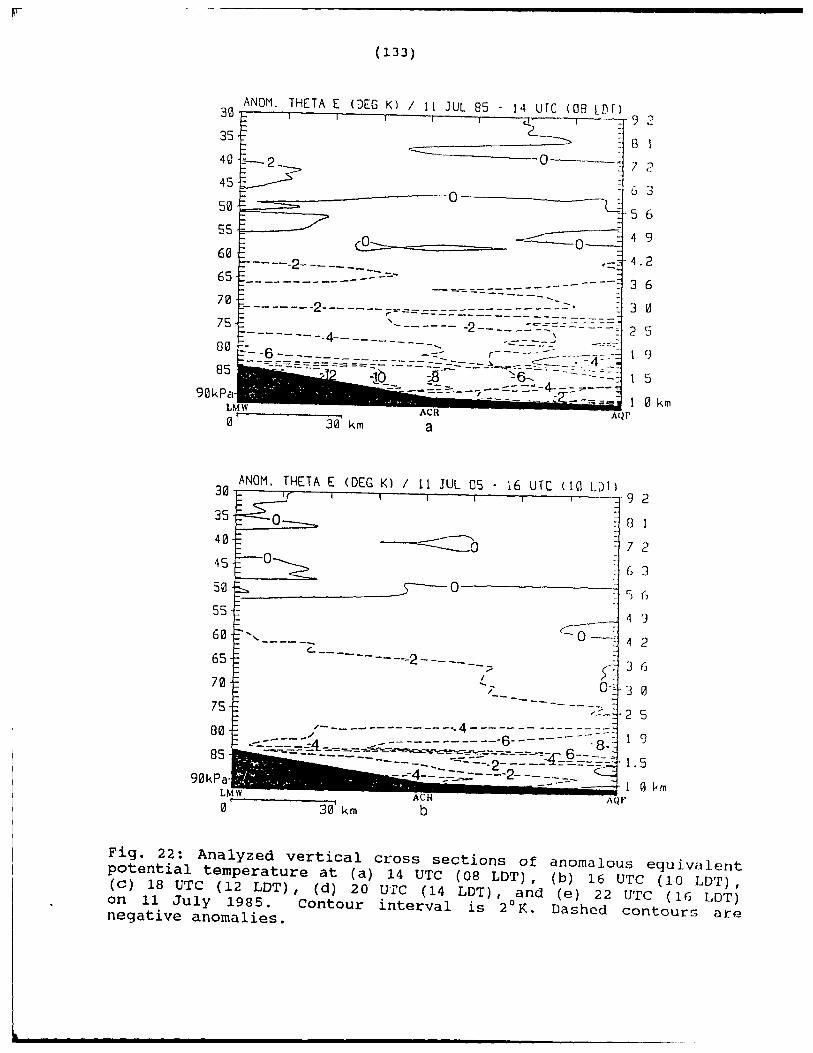
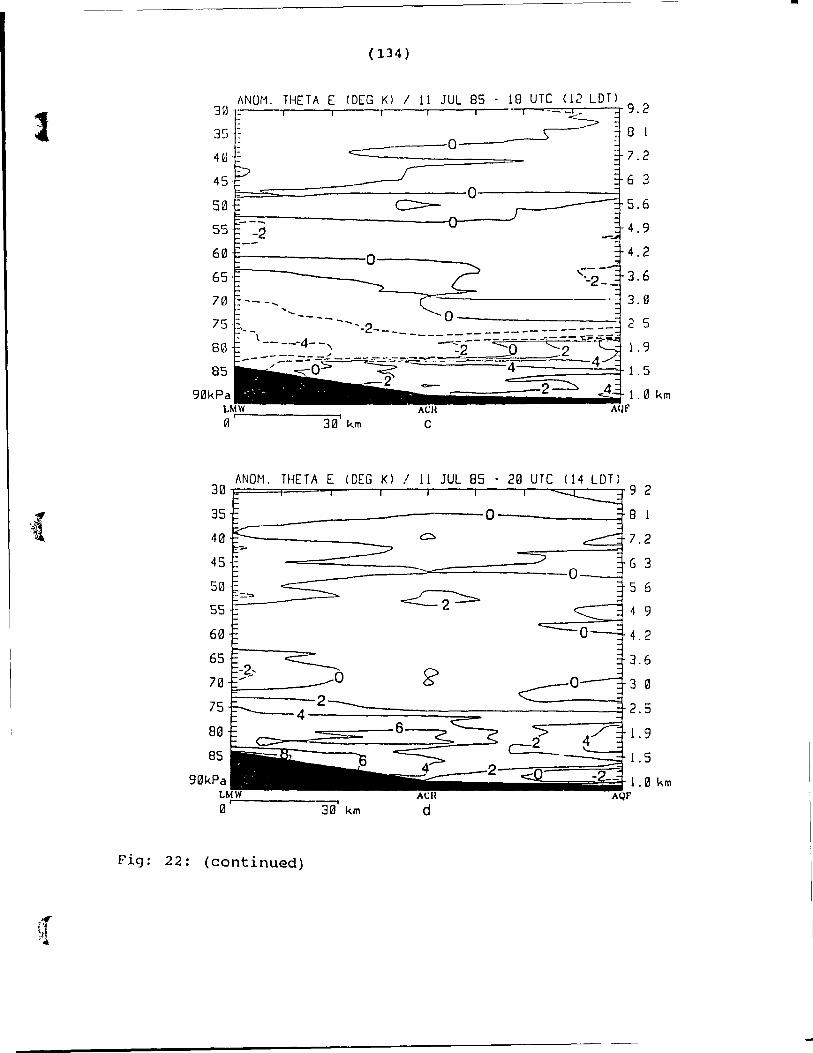
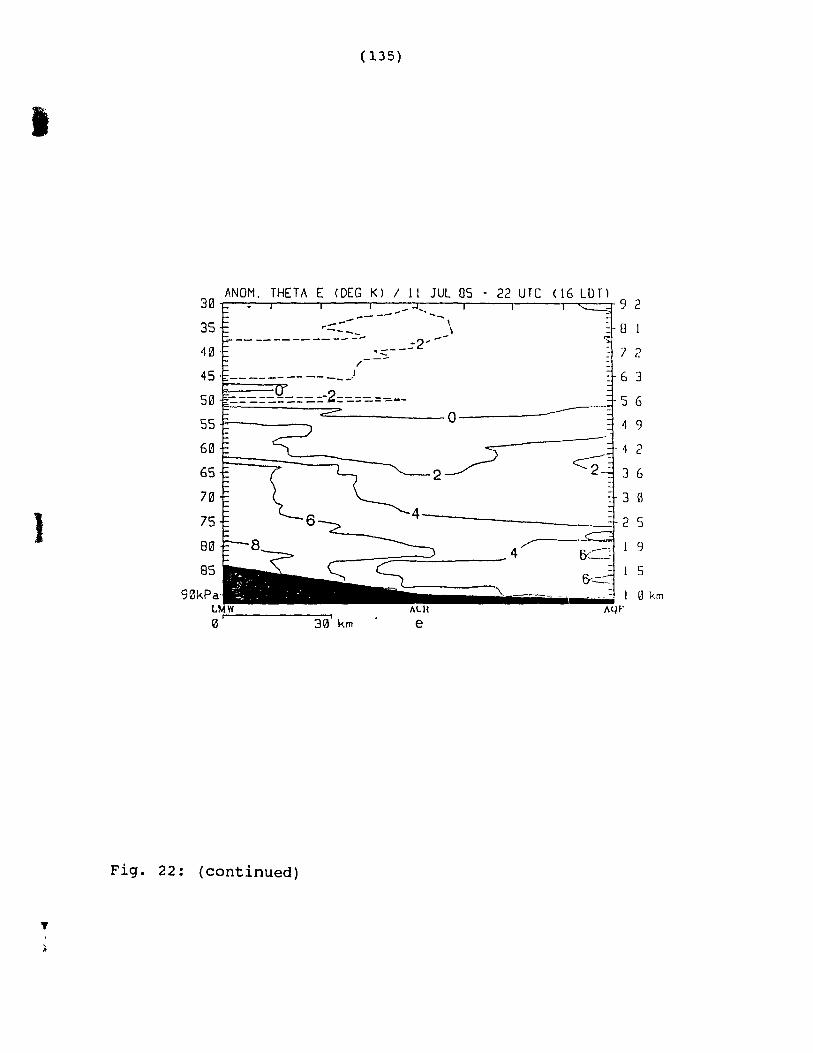
22 Analyzed vertical cross sections of anomalous 133 equivalent potential temperature at (a) 14 UTC
23
(08 LOT), (h) 16 UTe (10 LOT), (c) 18 UTC (12 LOT), (d) 20 UTC (14 LOT), and (e) 22 UTC (16 LOT) on 11 July 1985. Contour intervai is 2°K. Oashed contours are negative anomalies.
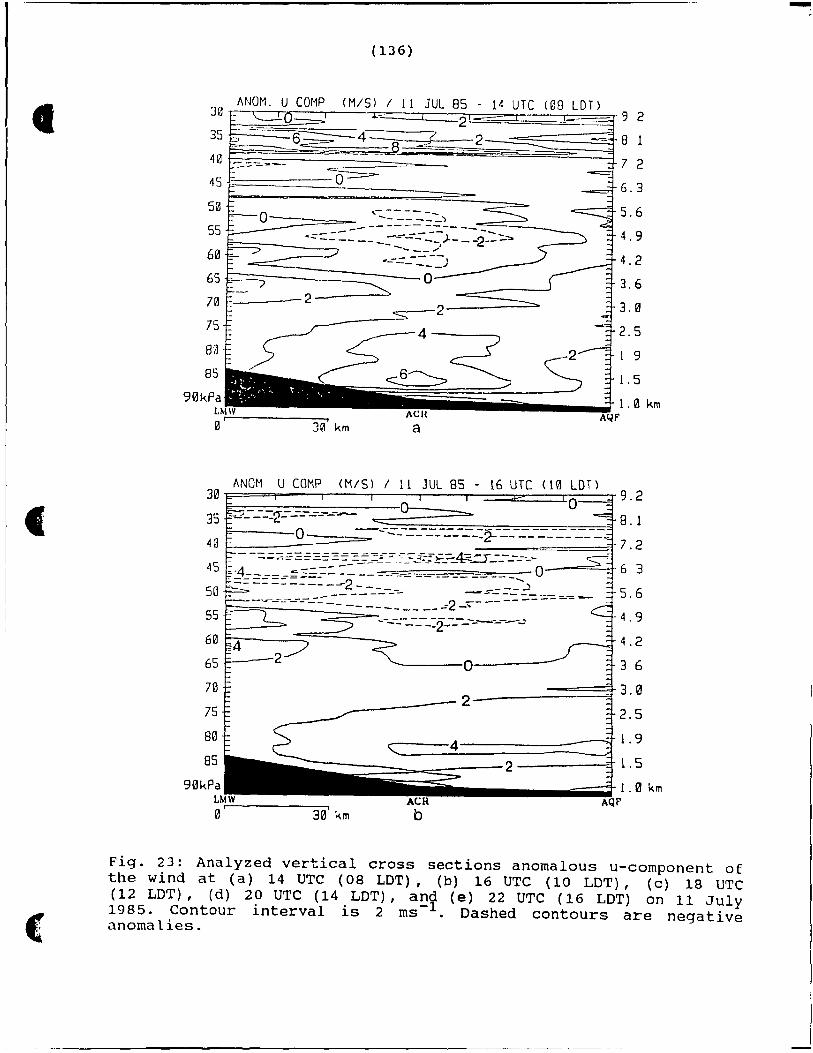
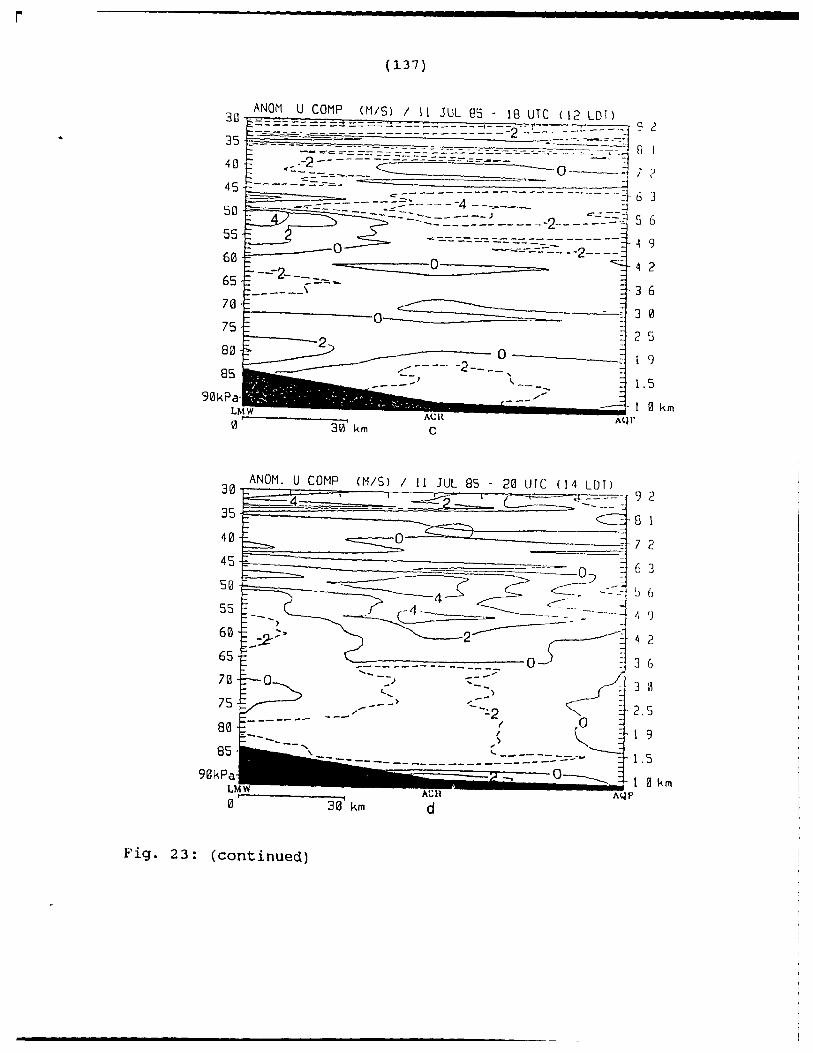
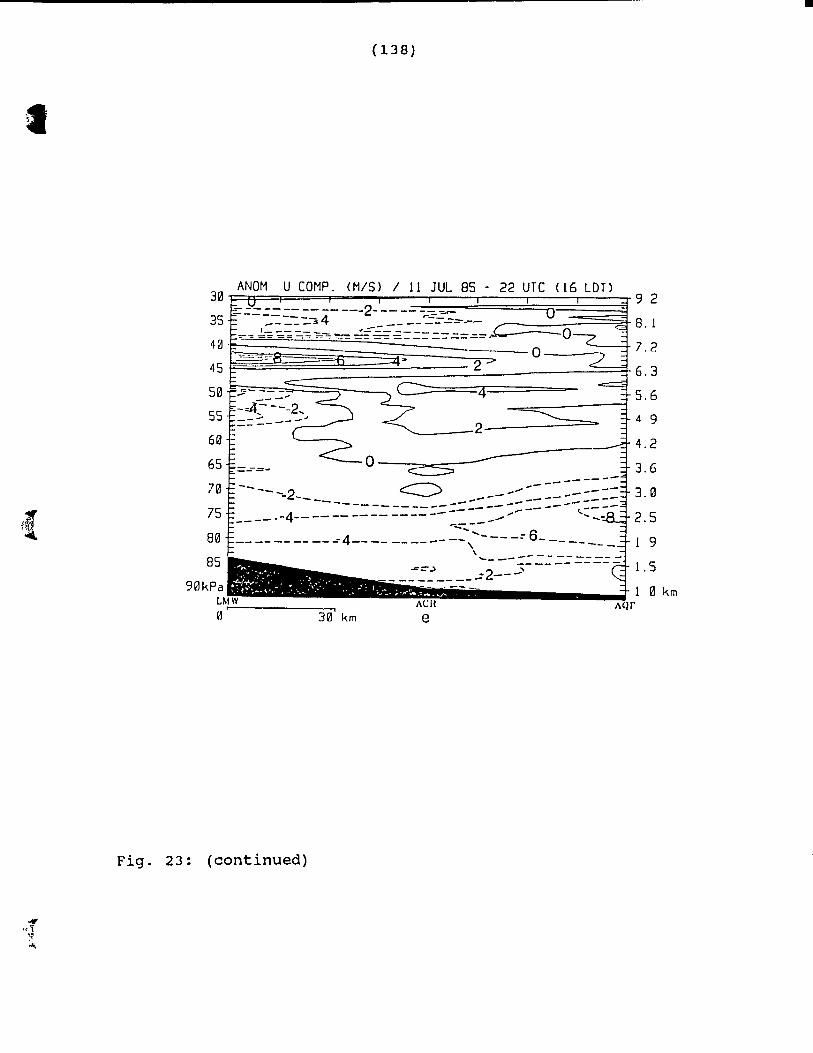
Analyzed vertical cross sections anomalous 136 u-component of the wind at (a) 14 UTC (08 LOT), (b) 16 UTC (10 LOT), (c) 18 UTe (12 LOT), (d) 20 UTe (14 LOT), and (e) 22 UTe (16 LOTi on Il July 1985. Contour interval is 2 ms- • Oashed contours are negative anomalies.
c
c
24
(13)
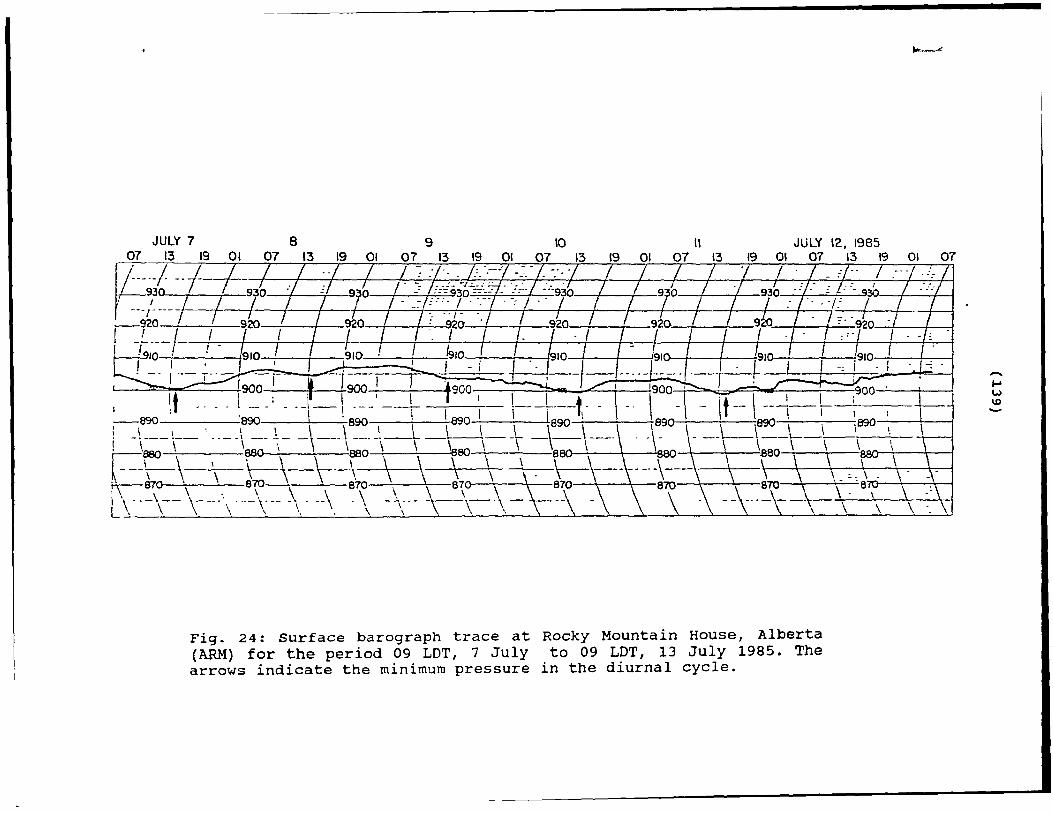
Surface barograph trace at Rocky Mountain House, Alberta (ARM) for the period 09 LOT, 7 July to 09 LOT, 13 July 1985. The arrows indicate the minimum pressure in the diurnal cycle.
139
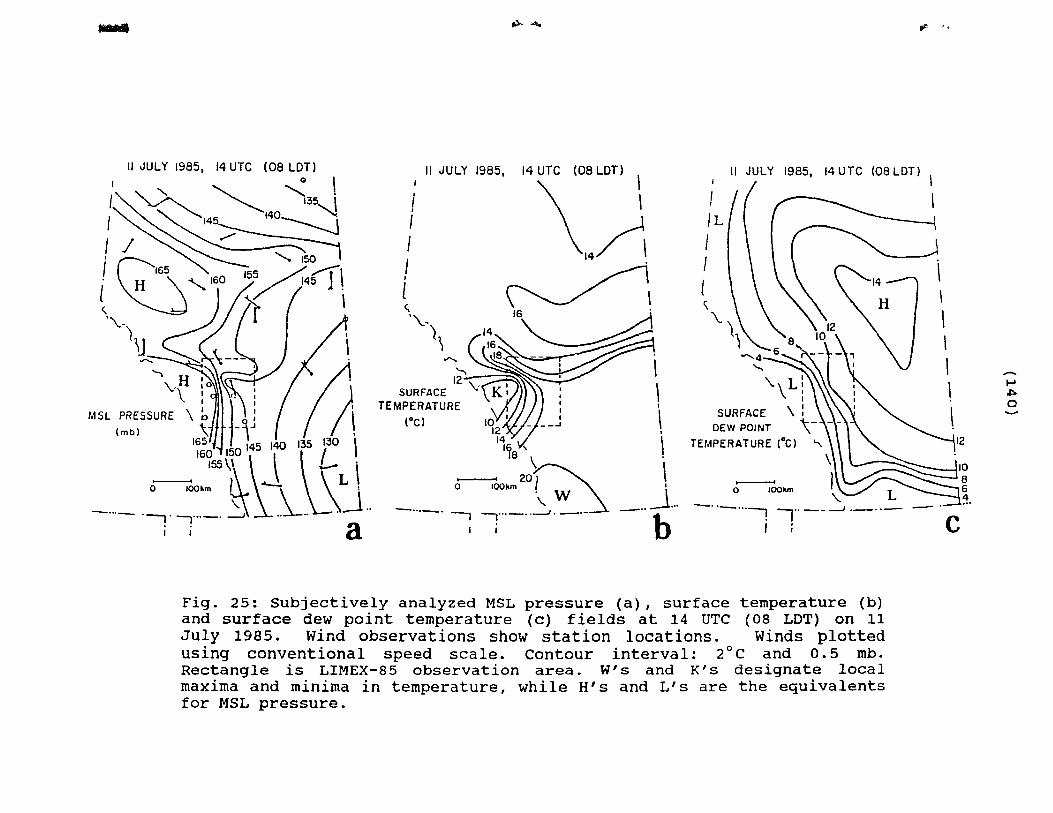
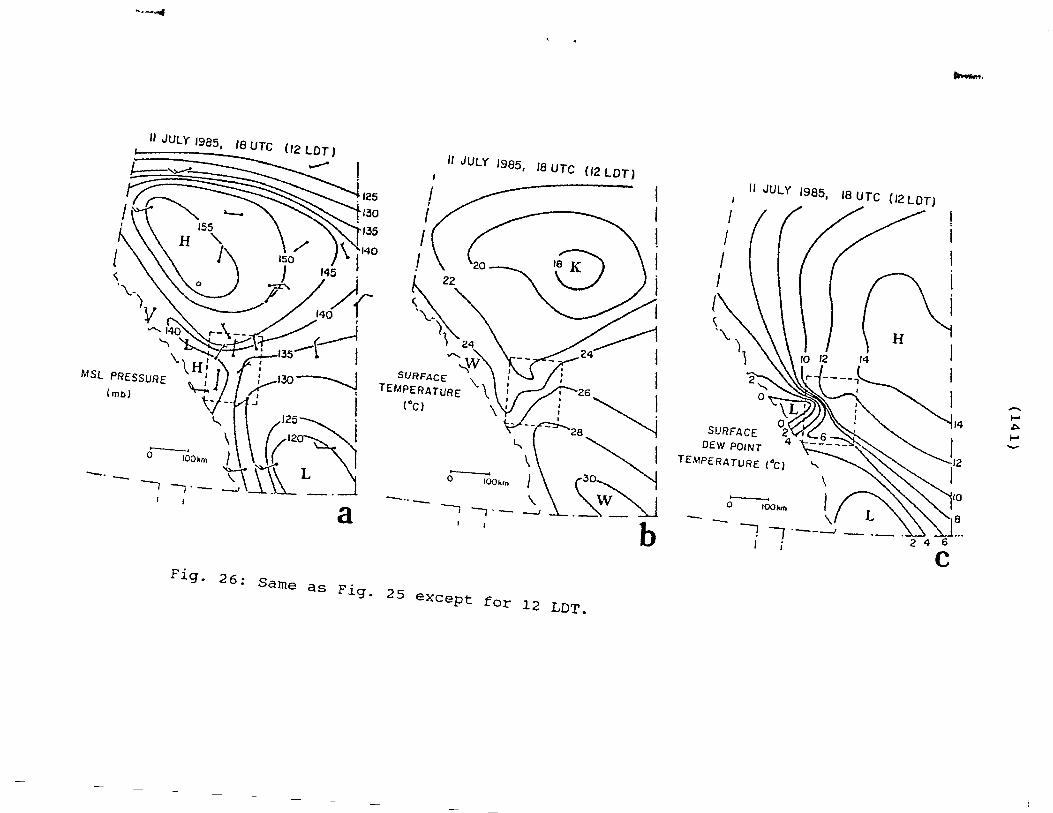
25 SUbjectively analyzed MSL pressure (a), surface 140 temperature (b) and surface dew point temperature (c) fields at 14 urcc (08 LOT) on 11 July 1985. Wind observations show station locations. Winds plotted using conventional speed scale. Contour interval: 2°C and 0.5 mb. Rectangle is LIMEX-85 observation area. W's and K's designate local maxima and minima in temperature, while H's and L's are the equivalents for MSL pressure.
26 Same as Fig. 25 except for 12 LOT. 141
27 Same as Fig. 25 except for 18 LOT. 142
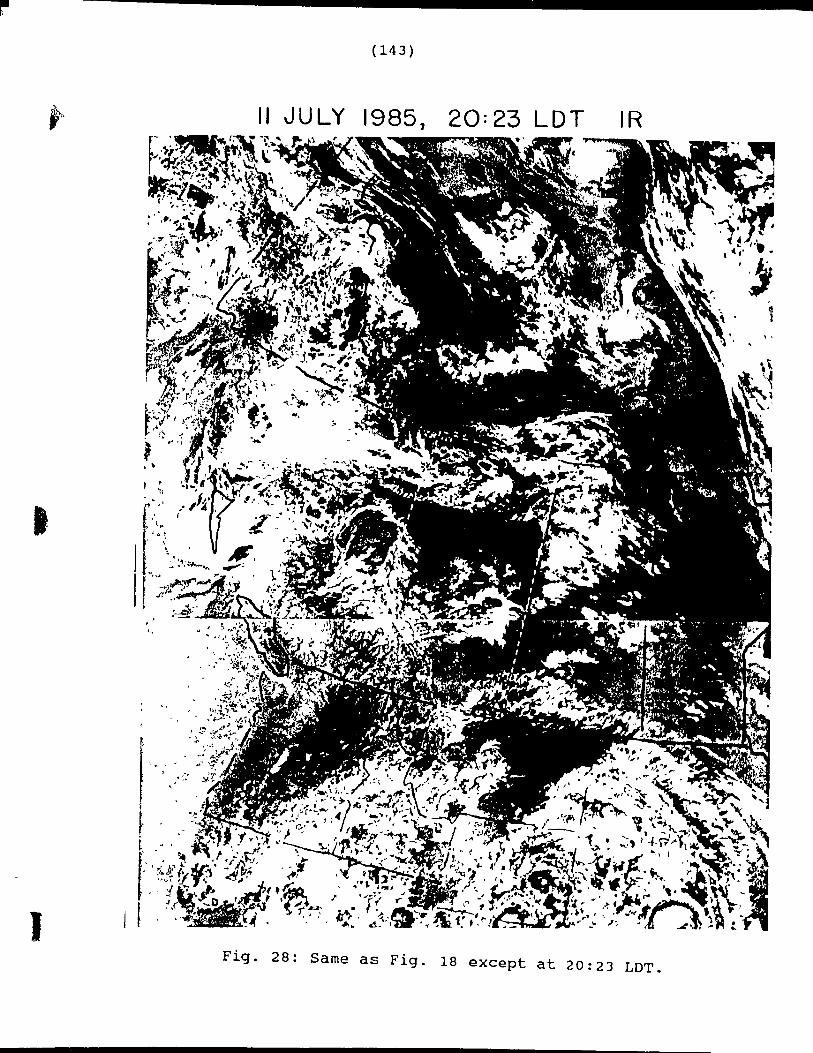
28 Same as Fig. 18 except at 20:23 LOT. 143
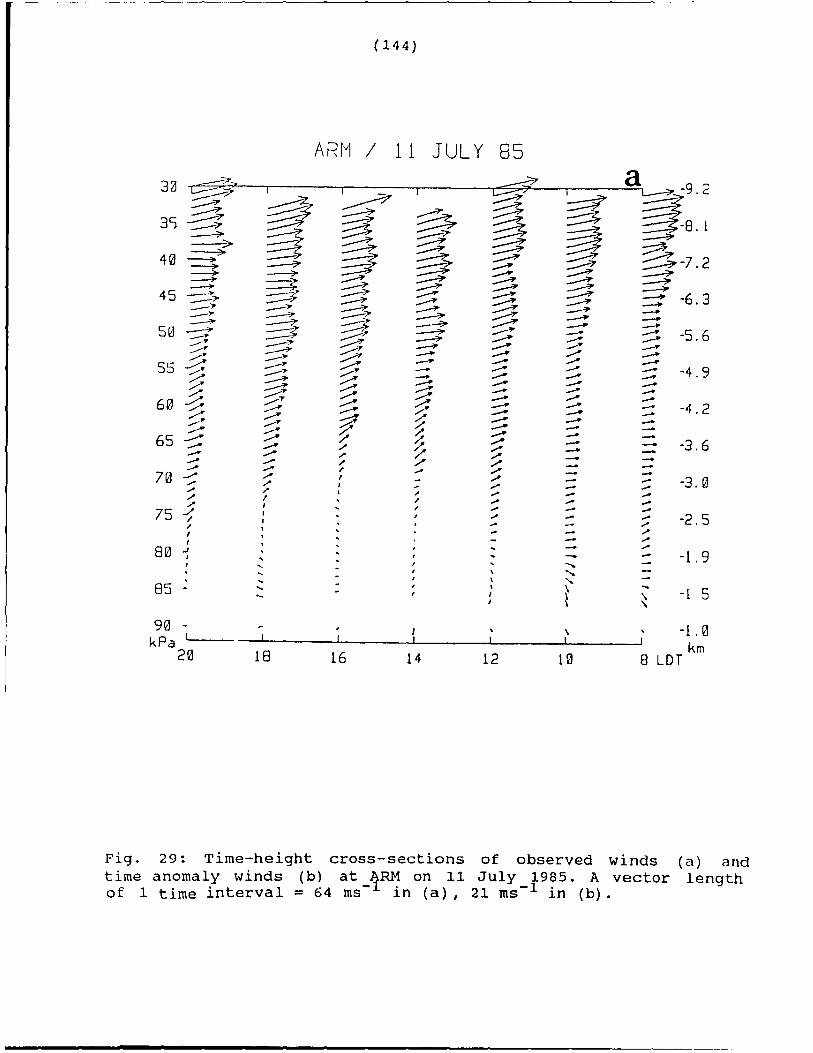
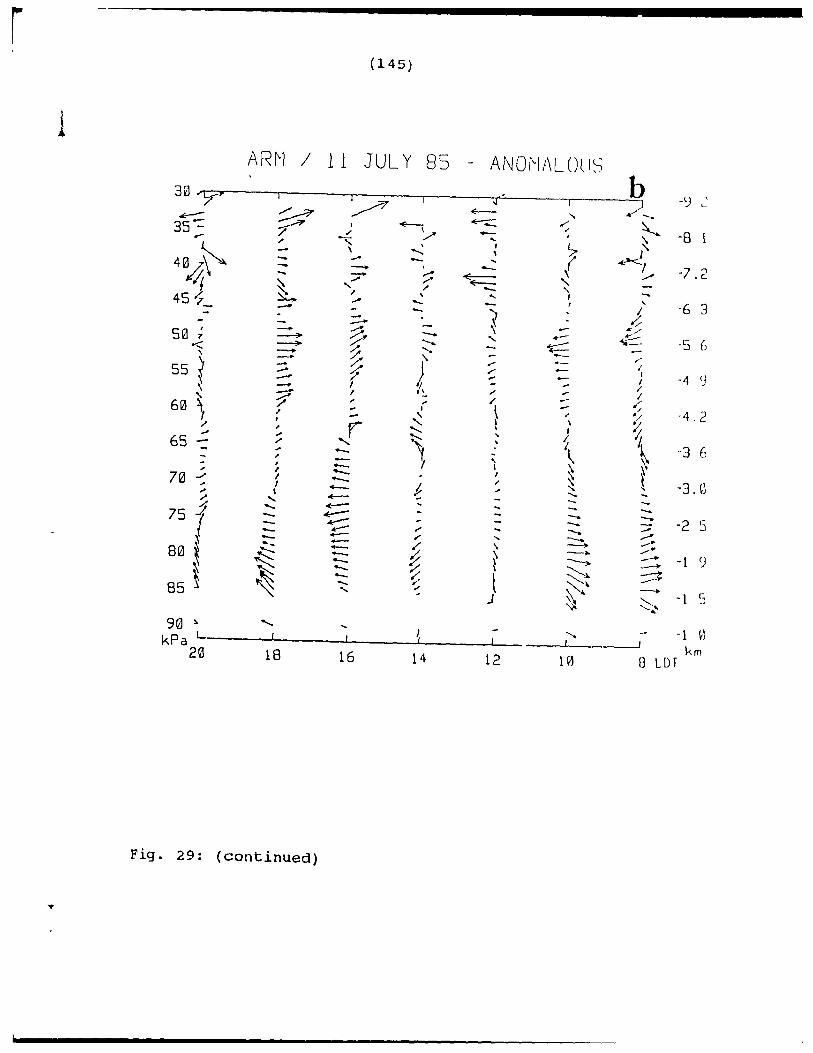
29 Time-height cross-sections of observed winds (a) and time anomaly winds (b) at ARM on 11 July 1985. A vyctor length of l time interval = 64 ms- in (a), 21 ms- in (b).
144
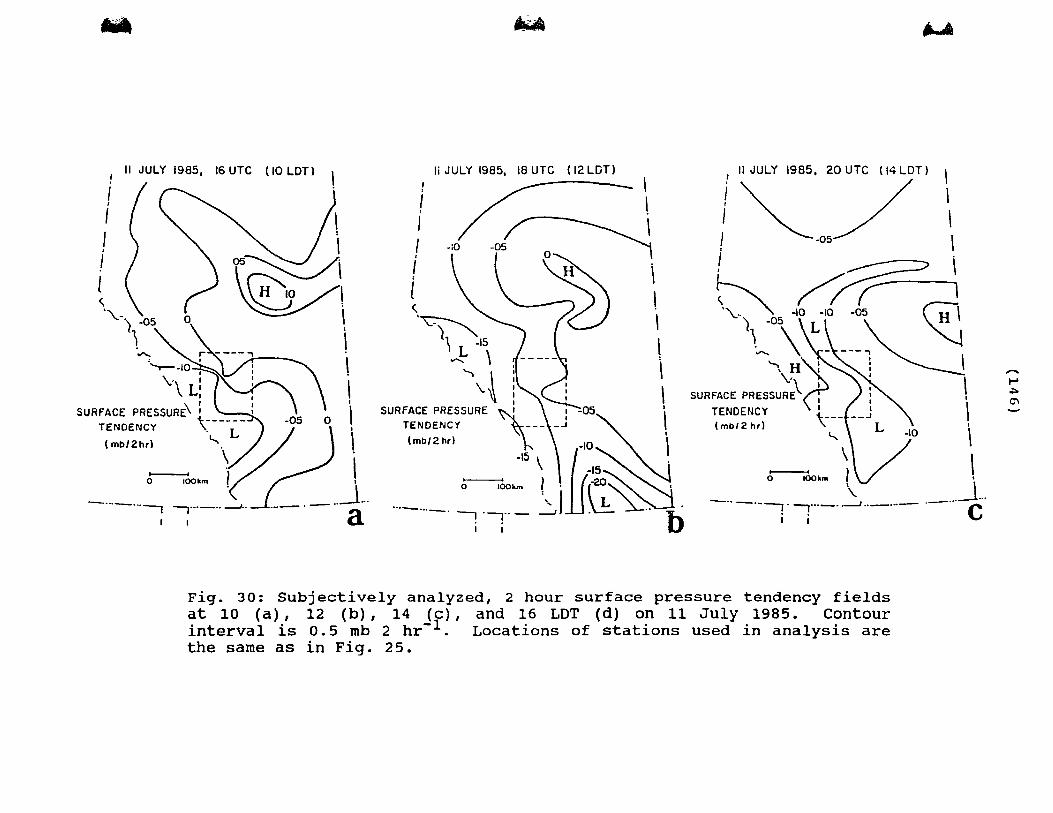
30 Subjectively analyzed, 2 hour surface pressure 146 tendency fields at 10 (a), 12 (b), 14 (c), and
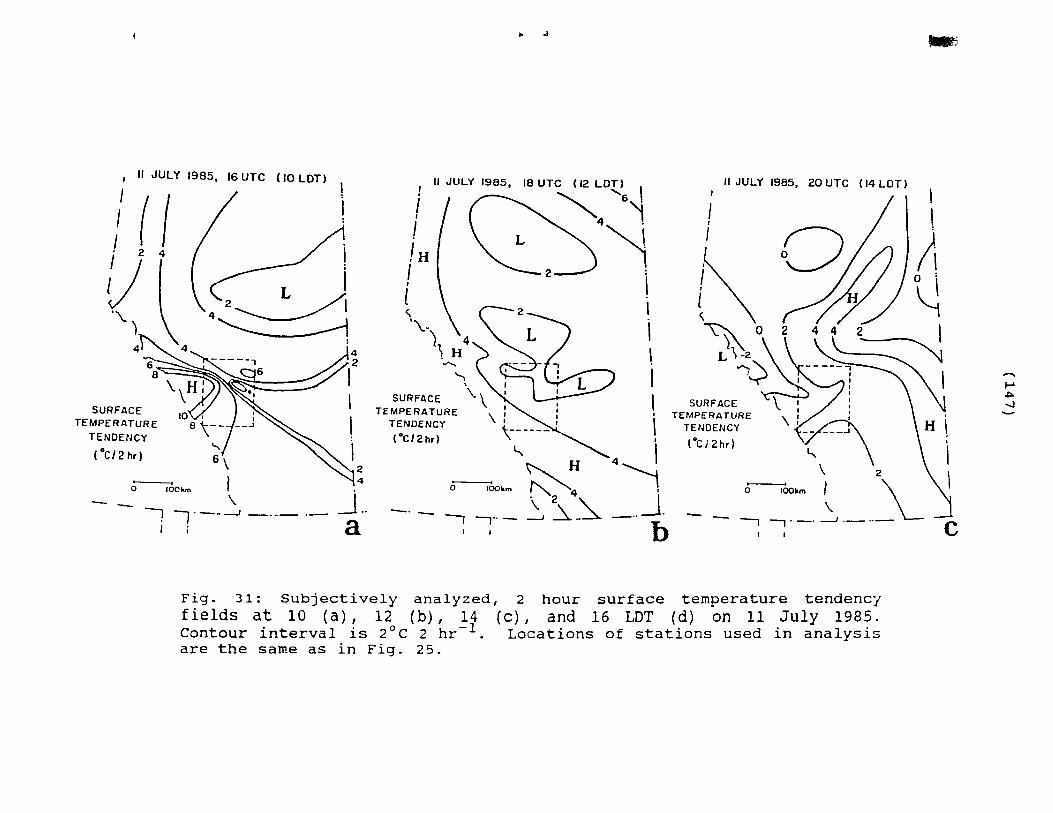
31
32
33
34
35
36
16 LOT (d) on 11 July 1985. Contour interval is 0.5 mb 2 hr-1 . Locations of stations used in analysis are the same as in Fig. 25.
Subjectively analyzed, 2 hQur surface temperature tendency fields at 10 (a), 12 (b), 14 (c), and 16 LOT (dl on 11 iUly 1985. Contour interval is 2 C 2 hr- • Locations of stations used in analysis are the ~ame as in Fig. 25.
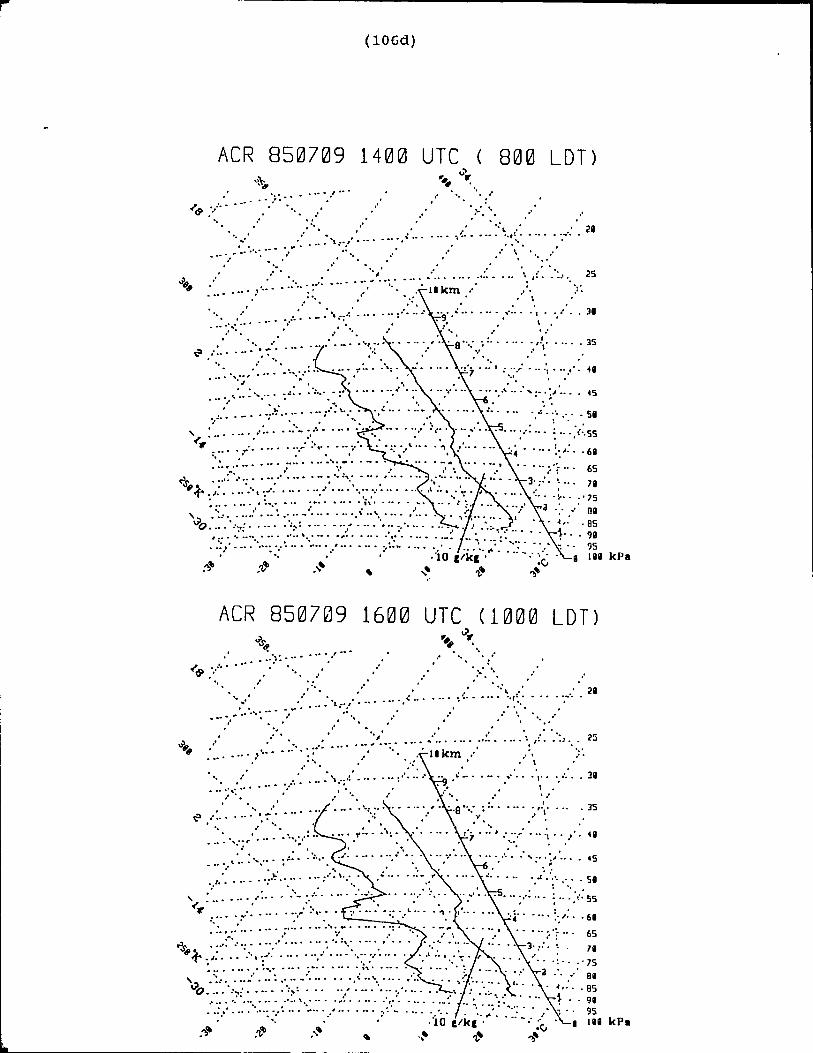
As in Fig. 6 except for 09 July 1985.
As in Fig. 8 except for 09 July 1985.
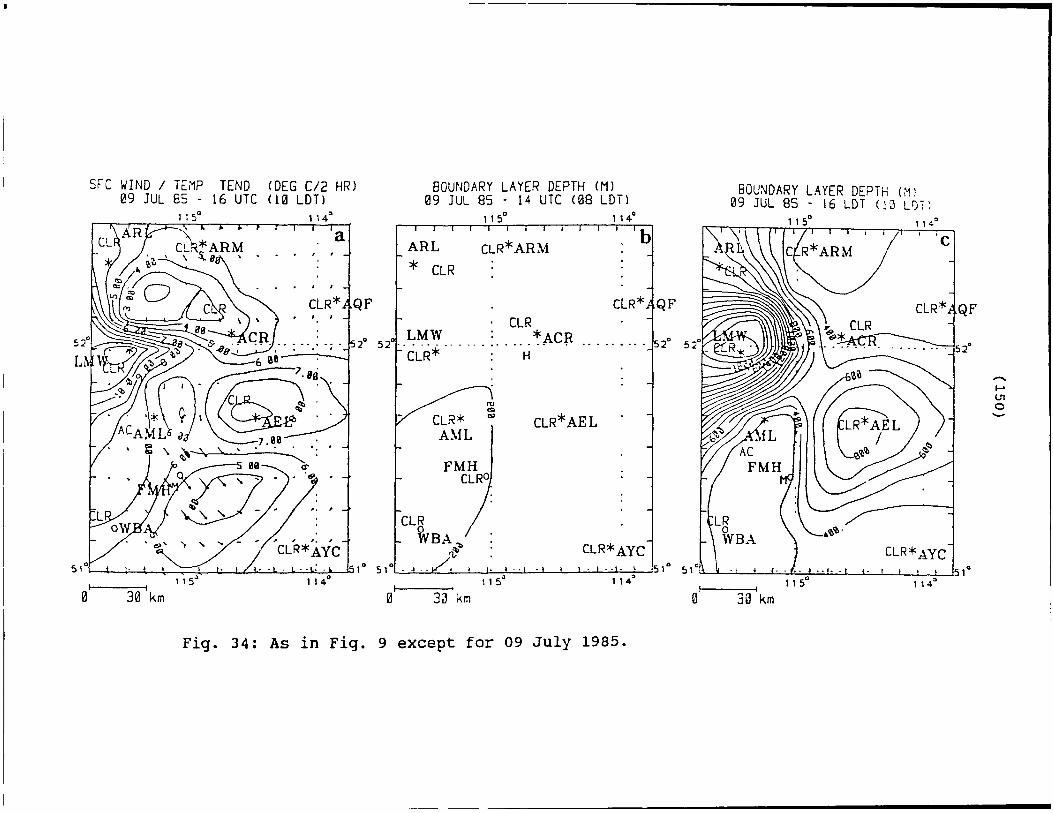
As in Fig. 9 except for 09 July 1985.
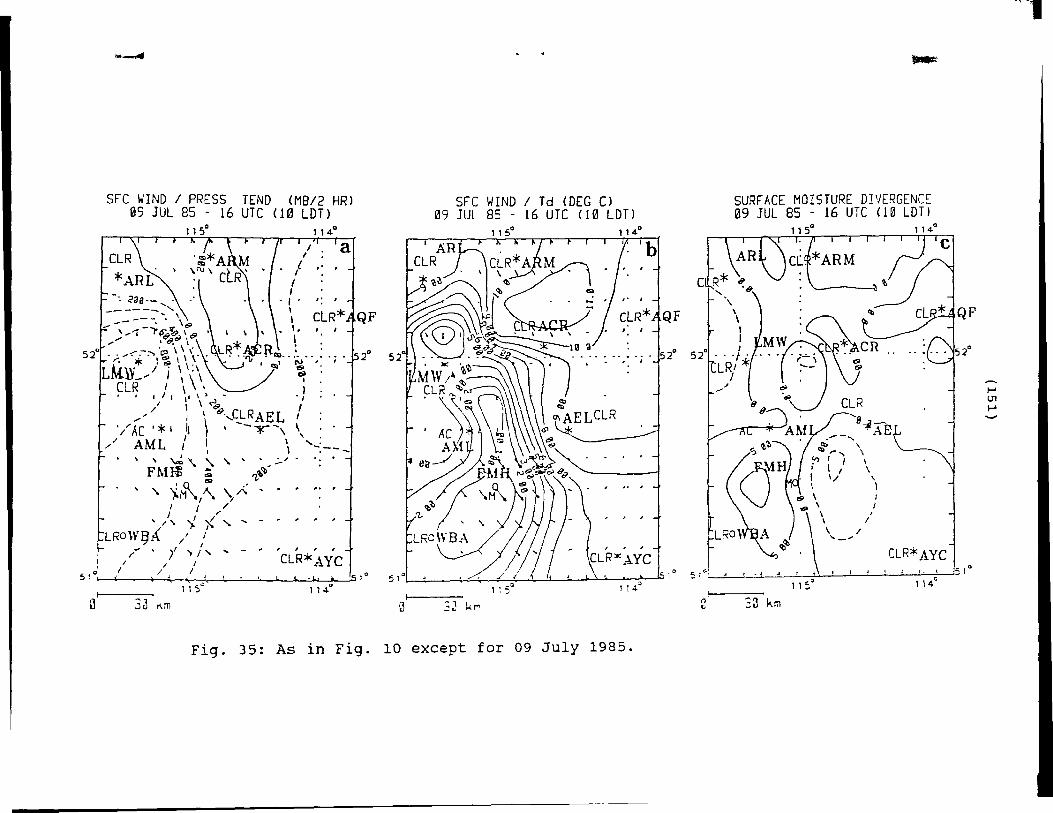
As in Fig. 10 except for 09 July 1985.
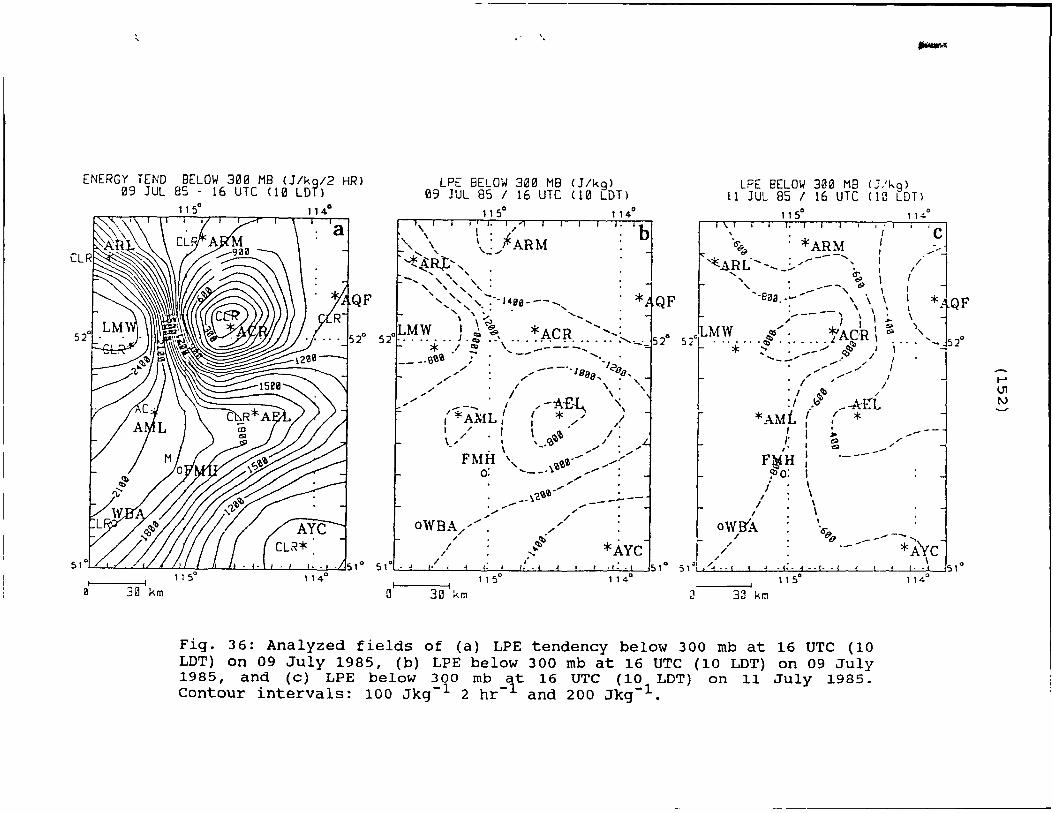
Analyzed fields of (a) LPE tendency below 300 mb at 16 UTC (10 LOT) on 09 July 1985, (b) LPE below 300 mb at 16 UTC (10 LOT) on 09 July 1985, and (c) LPE below 300 mb at 16 UTC (10 LOT) on il July 1985. Contour intervals: 100 Jkg- 2 hr-1 and 200 Jkg-1 •
147
148
149
150
151
152
1 37
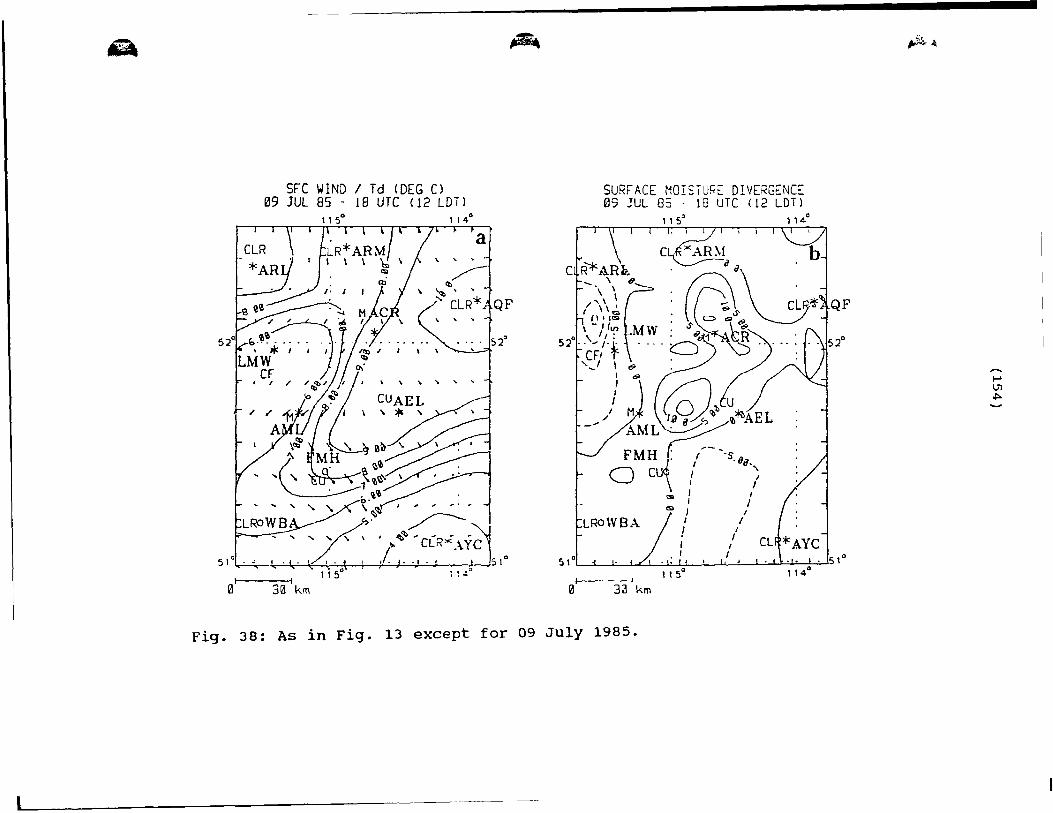
38
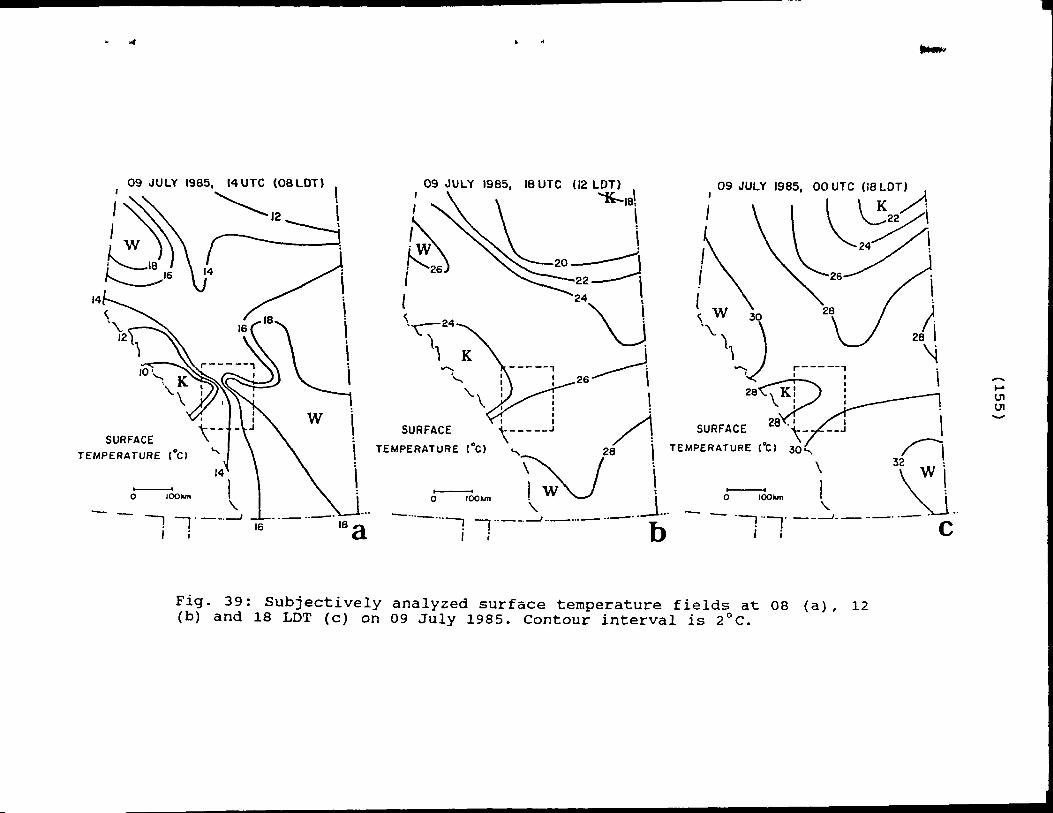
39
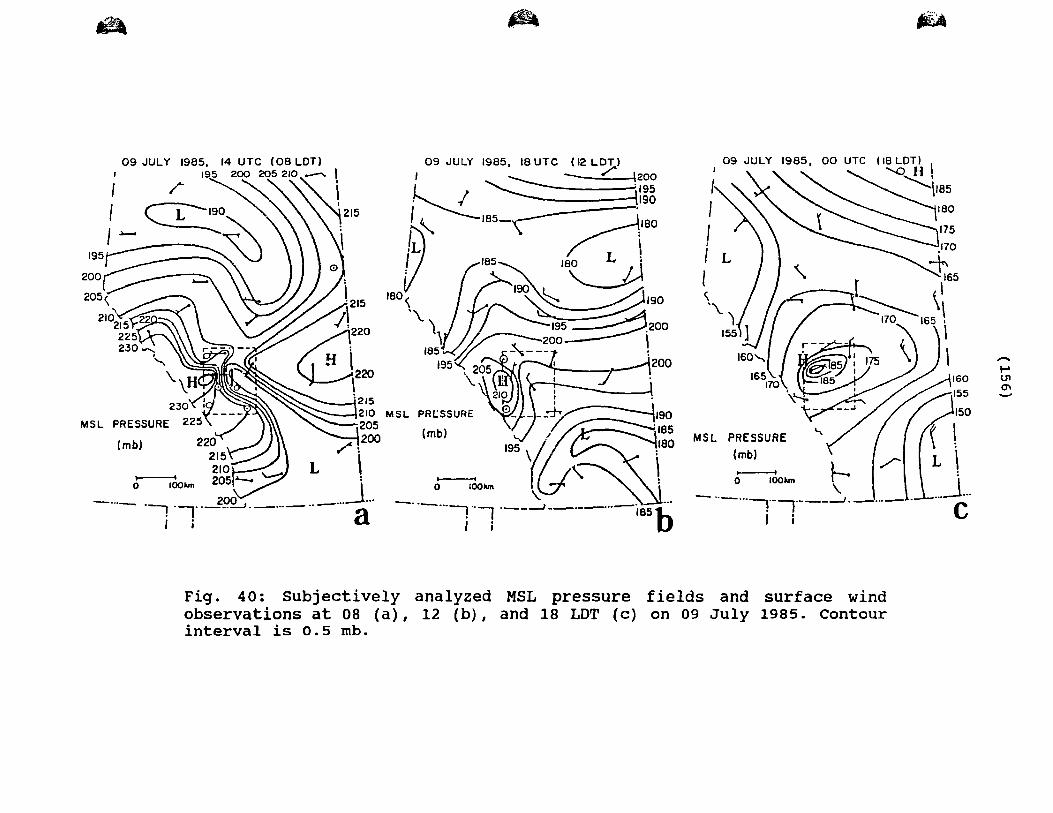
40
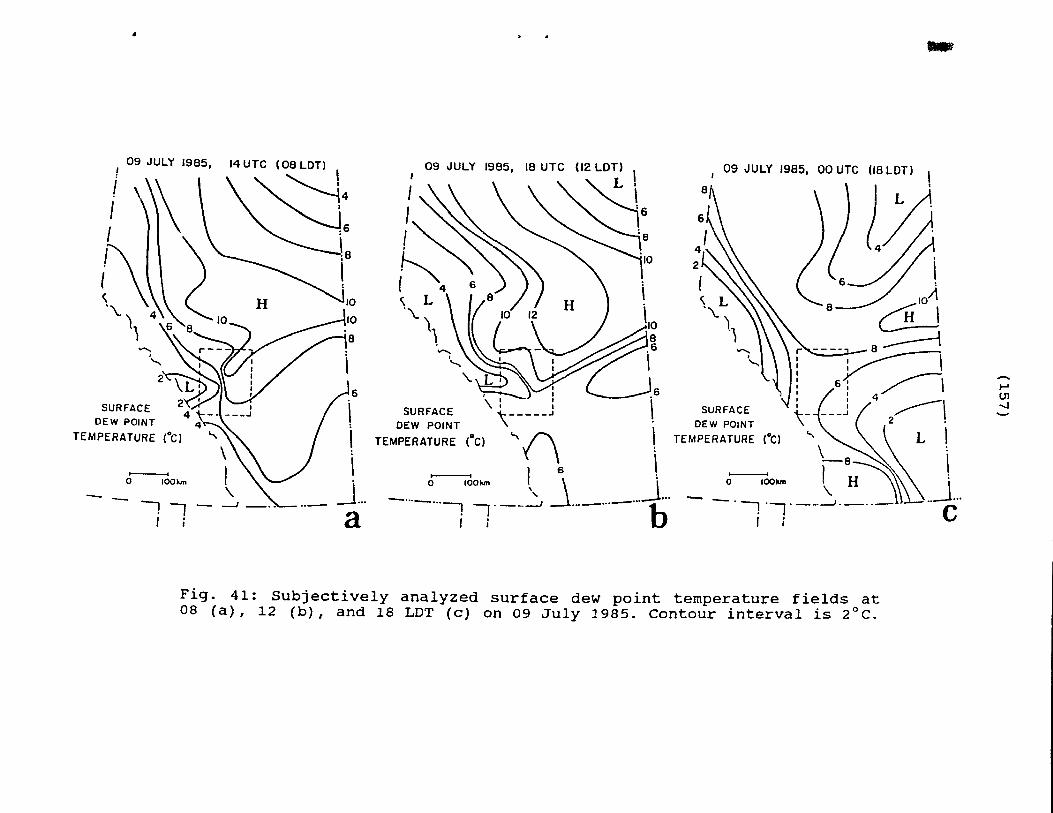
41
42
43
44
45
46
47
48
49
50
51
(14)
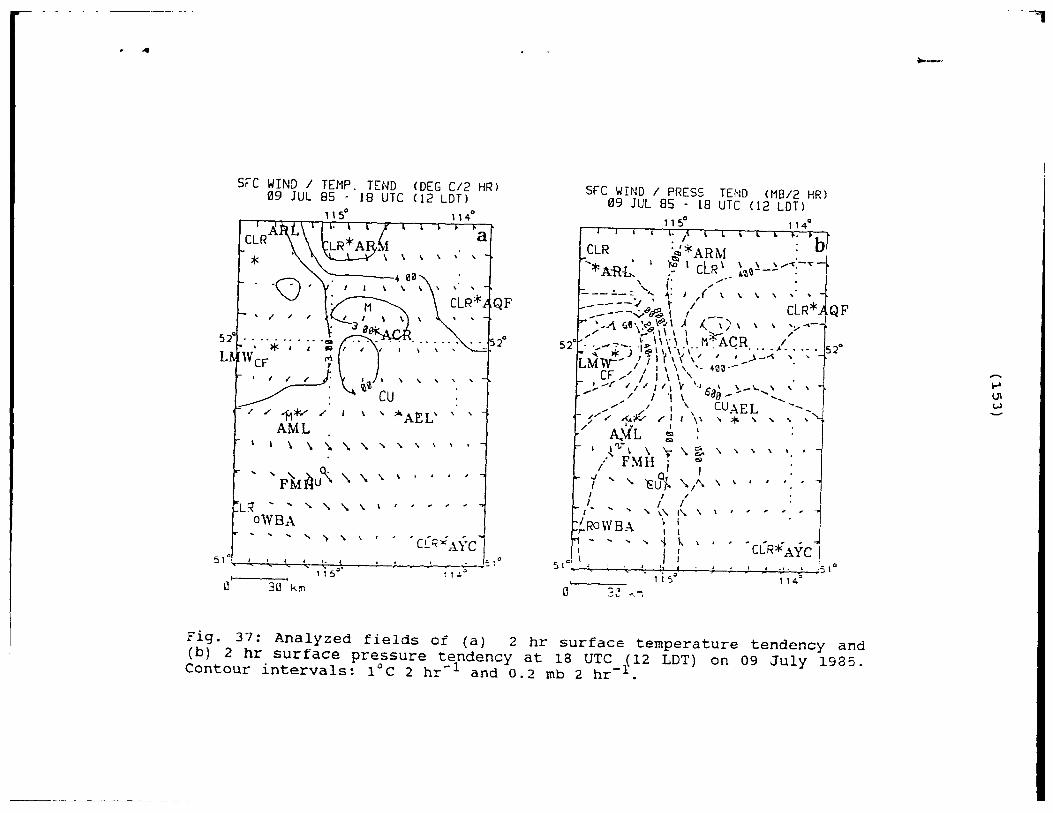
Analyzed fields of (a) 2 hr surface temperature tendency and (b) 2 hr surface pressure tendency at 18 UTe (12 LOT) on 09 JU!i 1985. Contour i~tervals: 1°C 2 hr and 0.2 mb 2 hr •
As in Fig. 13 except for 09 July 1985.
Subjectively analyzed surface temperature fields at 08 (a), 12 (b) and 18 LOT (c) on 09 July 1985. Contour interval is 2°C.
Subjectively analyzed MSL pressure fields and surface wind observations at 08 (a), 12 (b), and 18 LOT (c) on 09 July 1985. Contour interval is 0.5 mb.
Subjectively analyzed surface dew point temperature fields at 08 (a), 12 (b), and 18 LOT (c) on 09 July 1985. contour interval is 2°C.
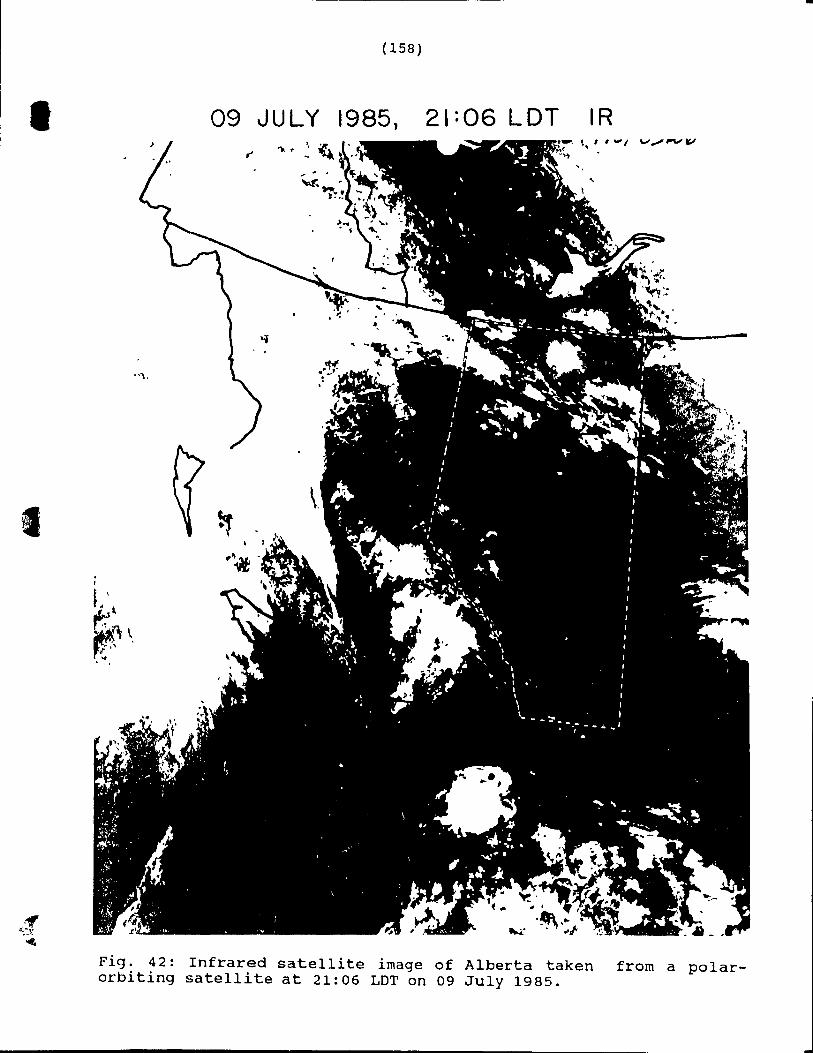
Infrared satellite image of Alberta taken from a polar-orbiting satellite at 21:06 LOT on 09 July 1985.
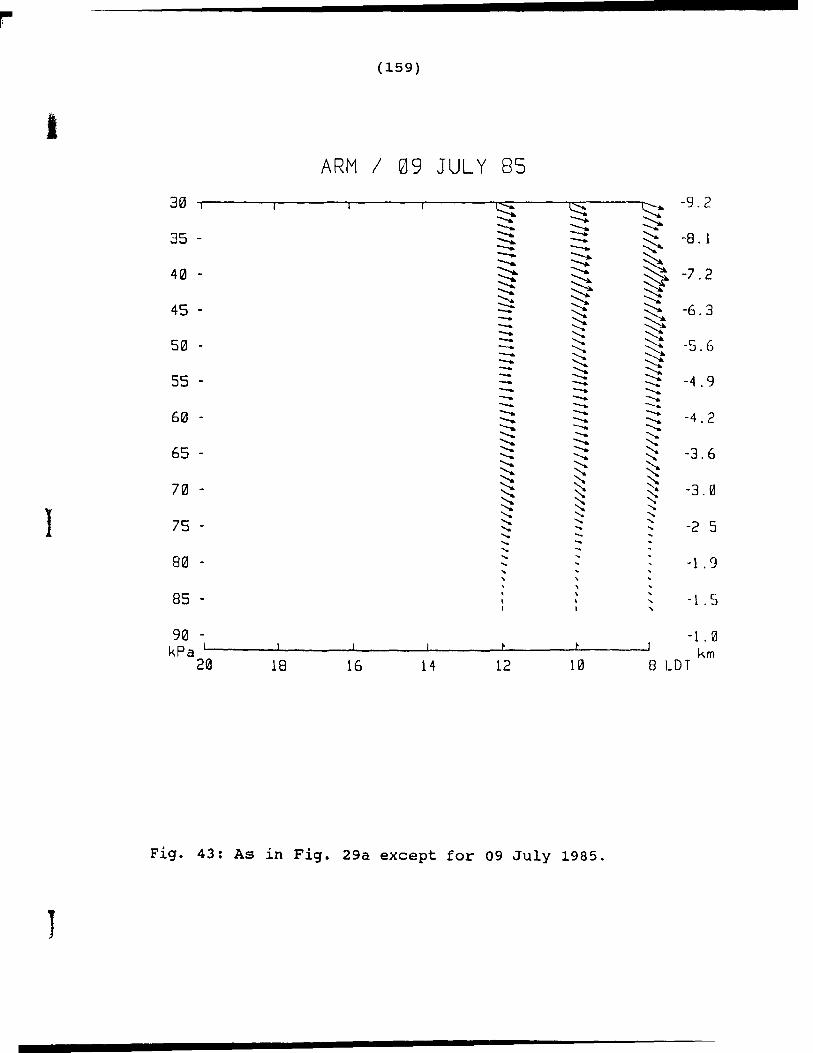
As in Fig. 29a except for 09 July 1985.
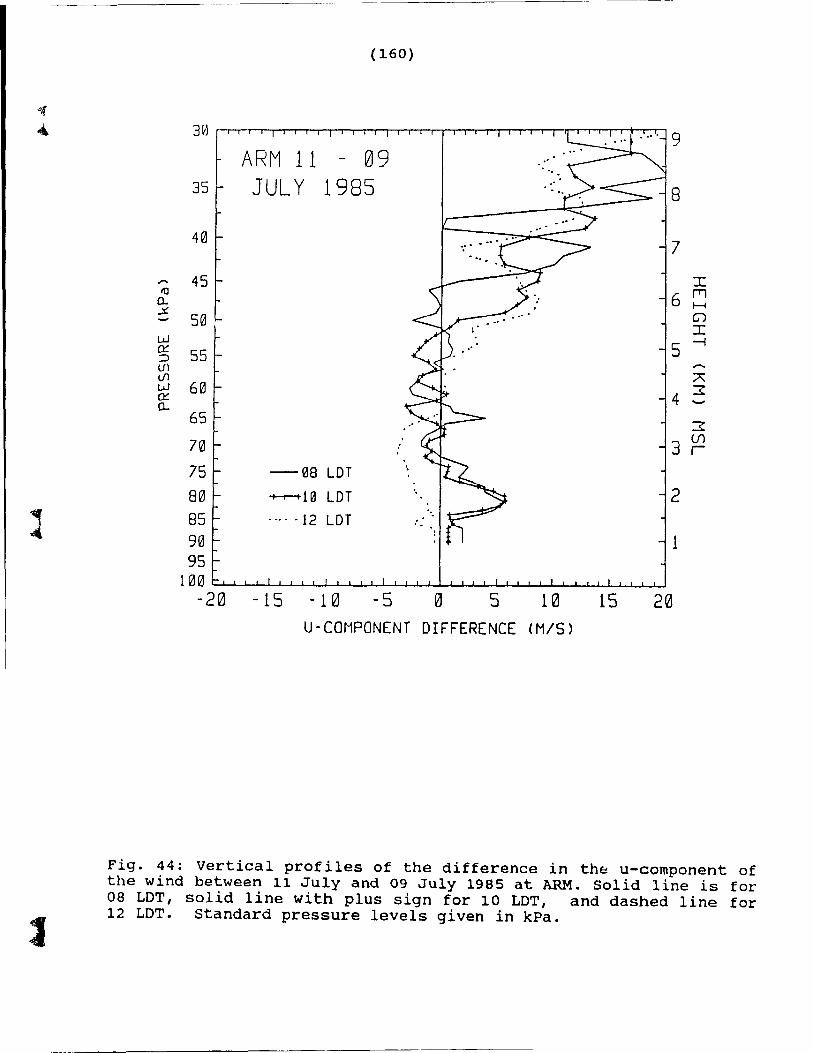
Vertical profiles of the difference in the u-component of the wind between 11 July and 09 July 1985 at ARM. Solid line is for 08 LOT, solid line with plus sign for 10 LOT, and da shed line for 12 LOT. Standard pressure levels given in kPa.
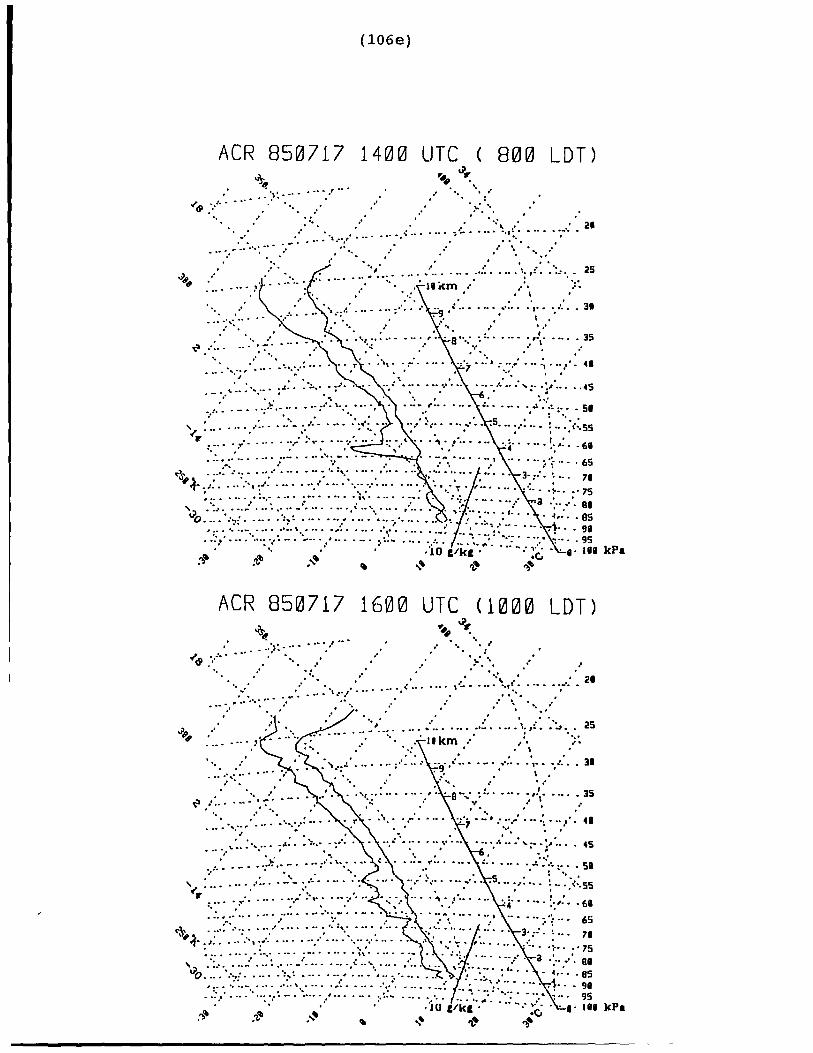
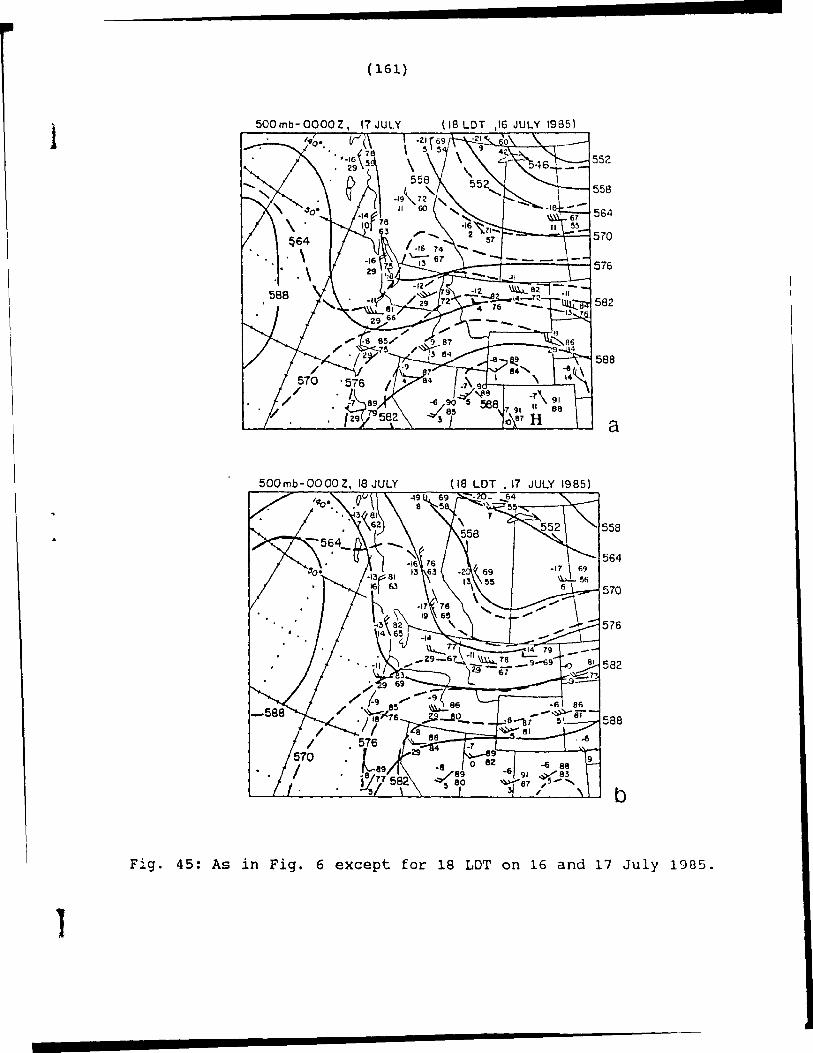
As in Fig. 6 except for 18 LOT on 16 and 17 July 1985.
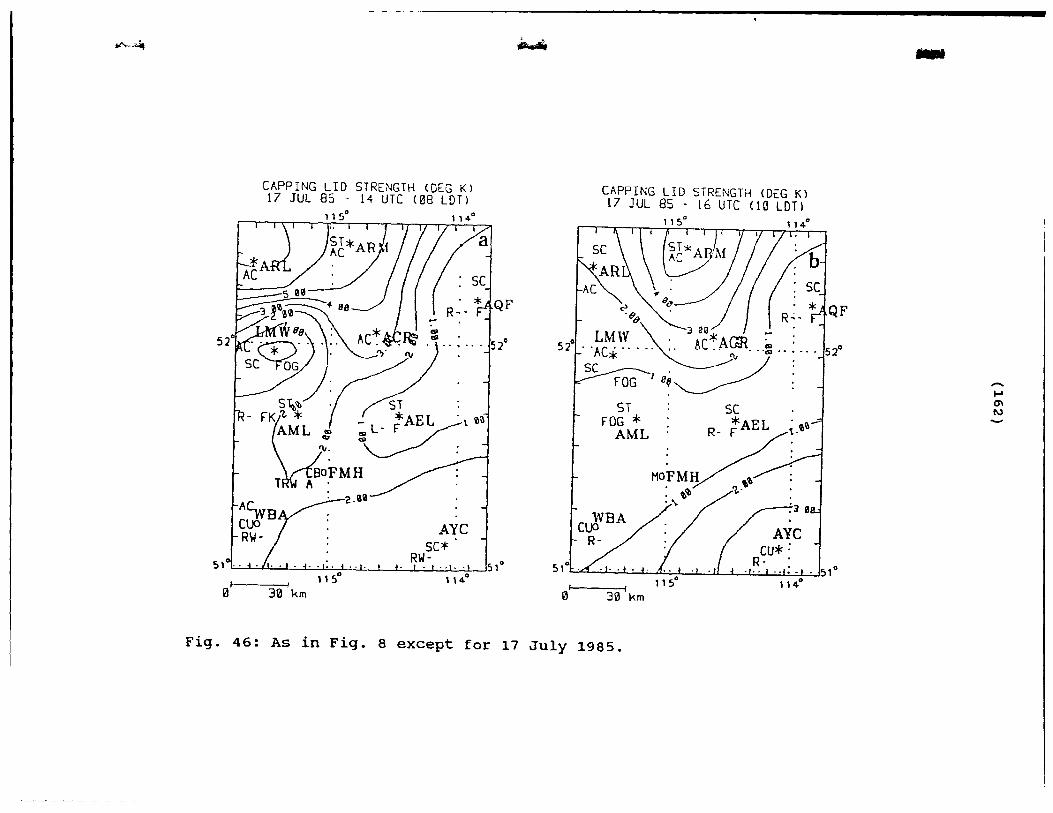
As in Fig. 8 except for 17 July 1985.
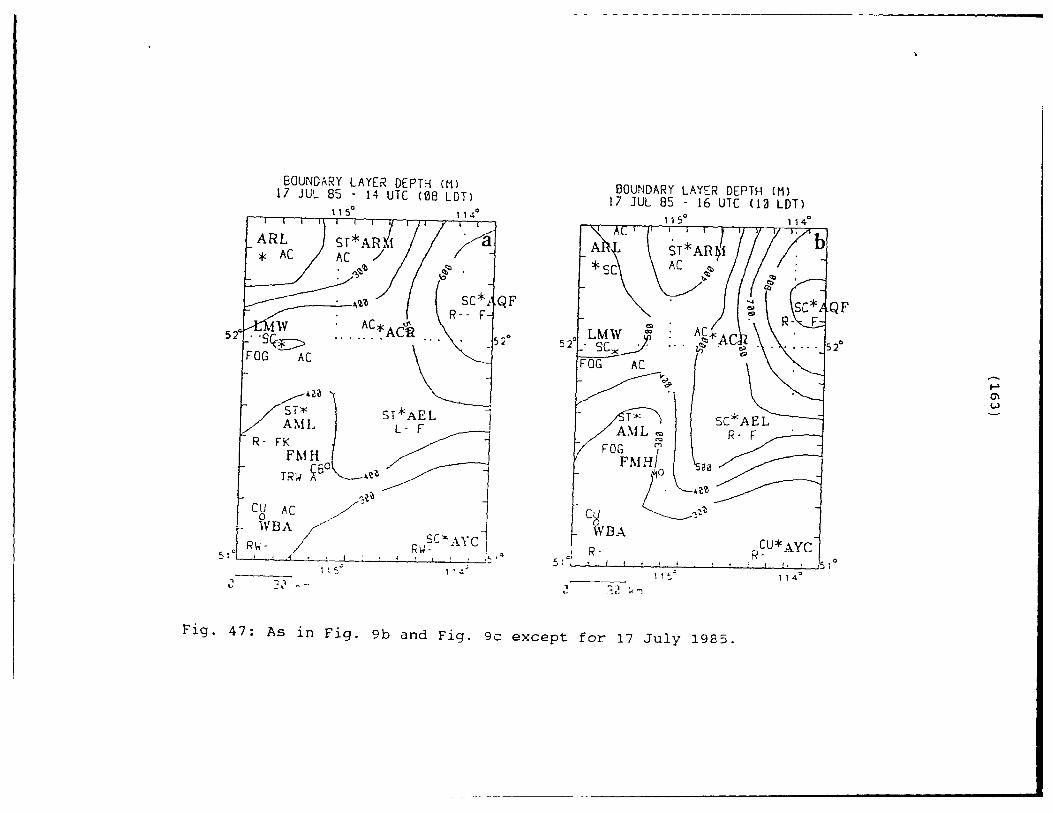
As in Fig. 9b and Fig. 9c except for 17 July 1985.
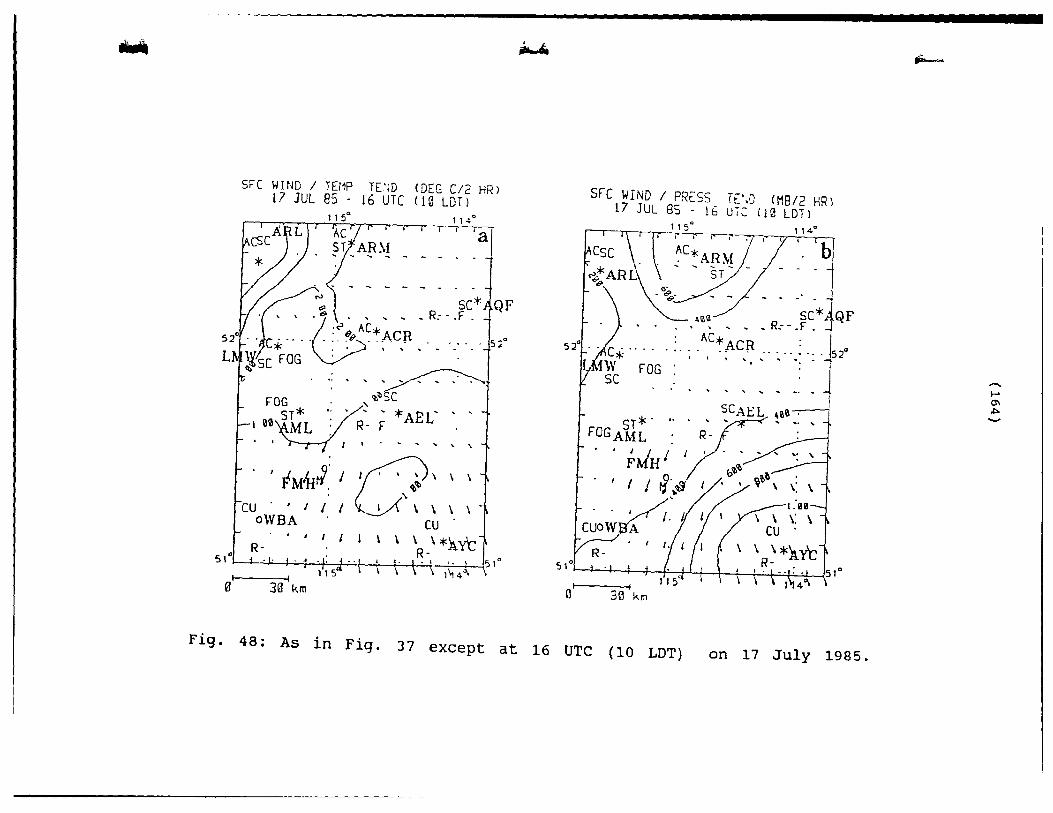
As in Fig. 37 except at 16 UTC (10 LDT) on 17 July 1985.
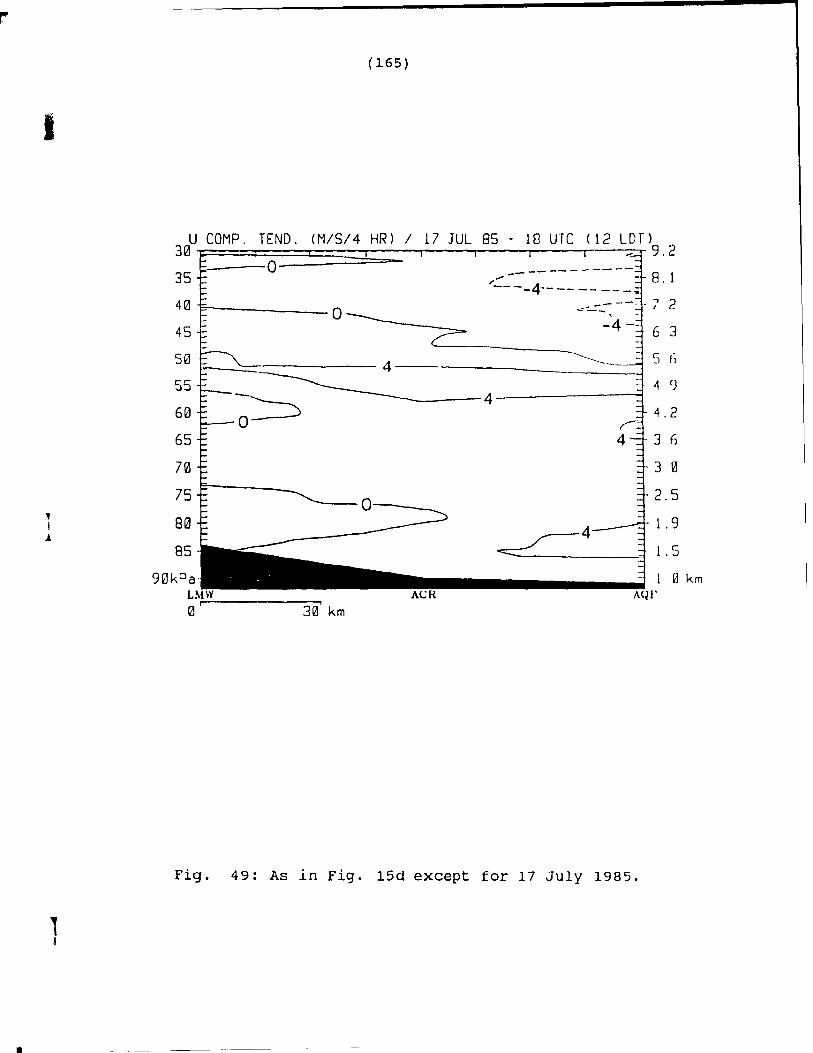
As in Fig. 15d except for 17 July 1985.
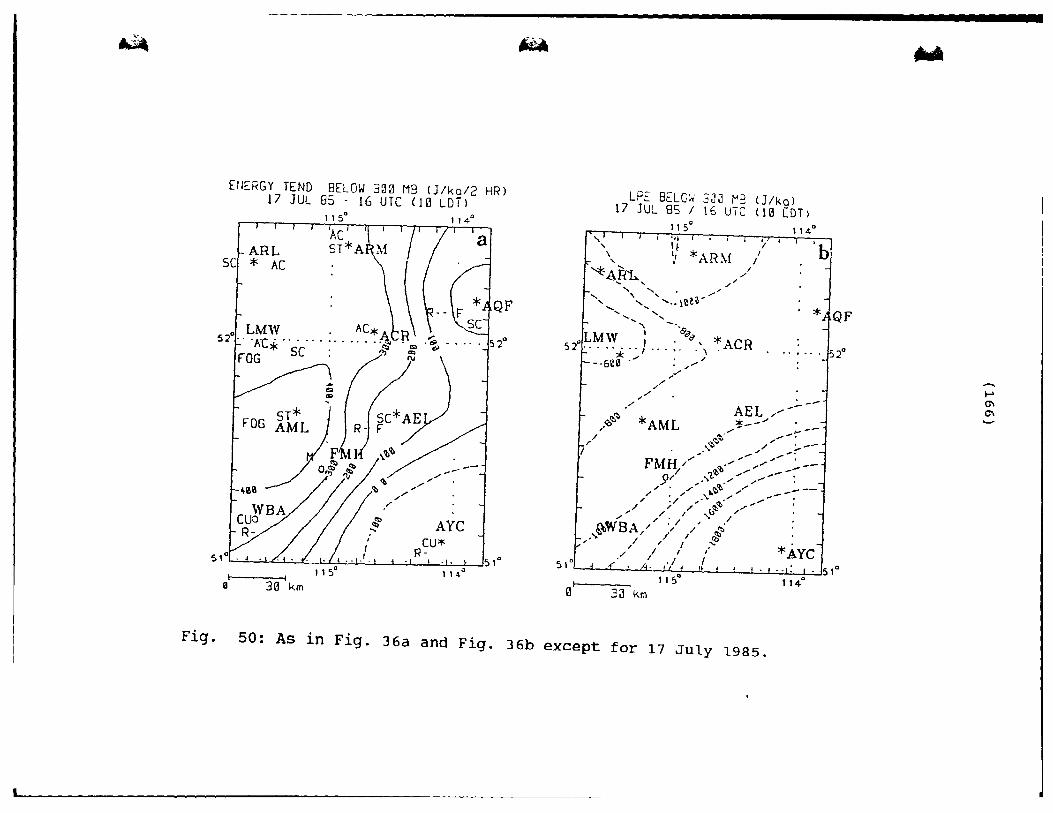
As in Fig. 36a and Fig. 36b except for 17 July 1985.
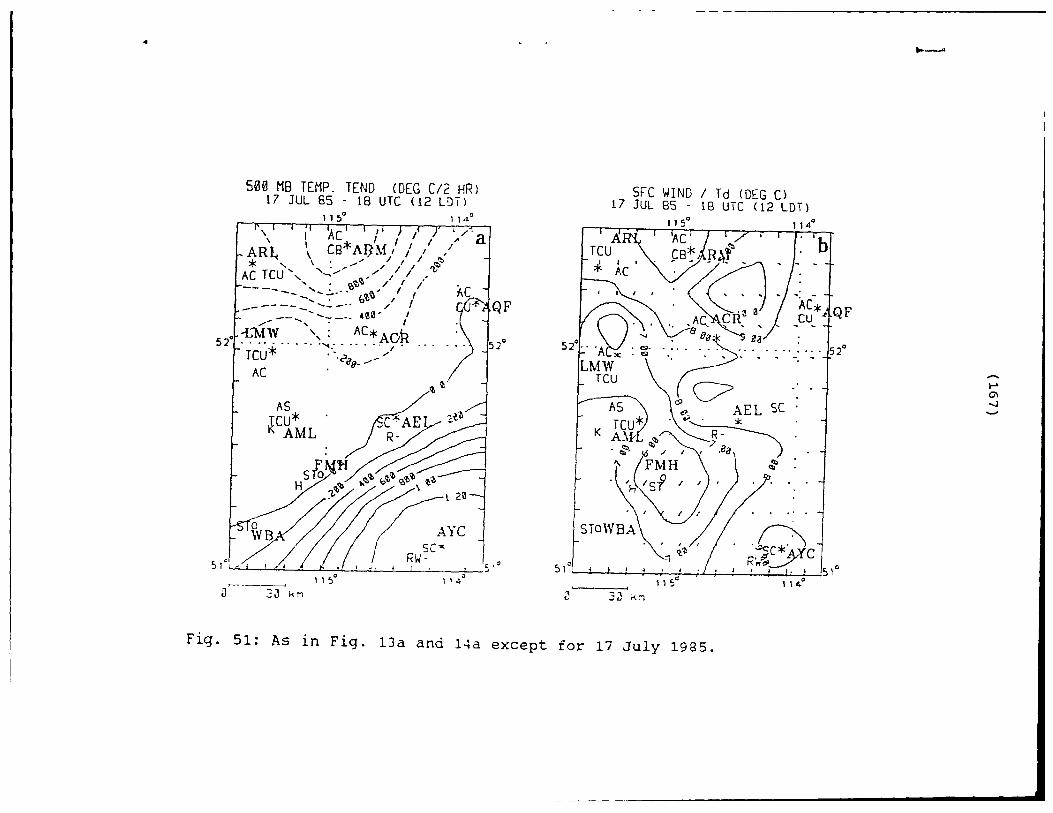
As in Fig. 13a and 14a except for 17 July 1985.
153
154
155
156
157
158
159
160
161
162
163
164
165
166
167
52
53
54
55
56
57
58
(15)
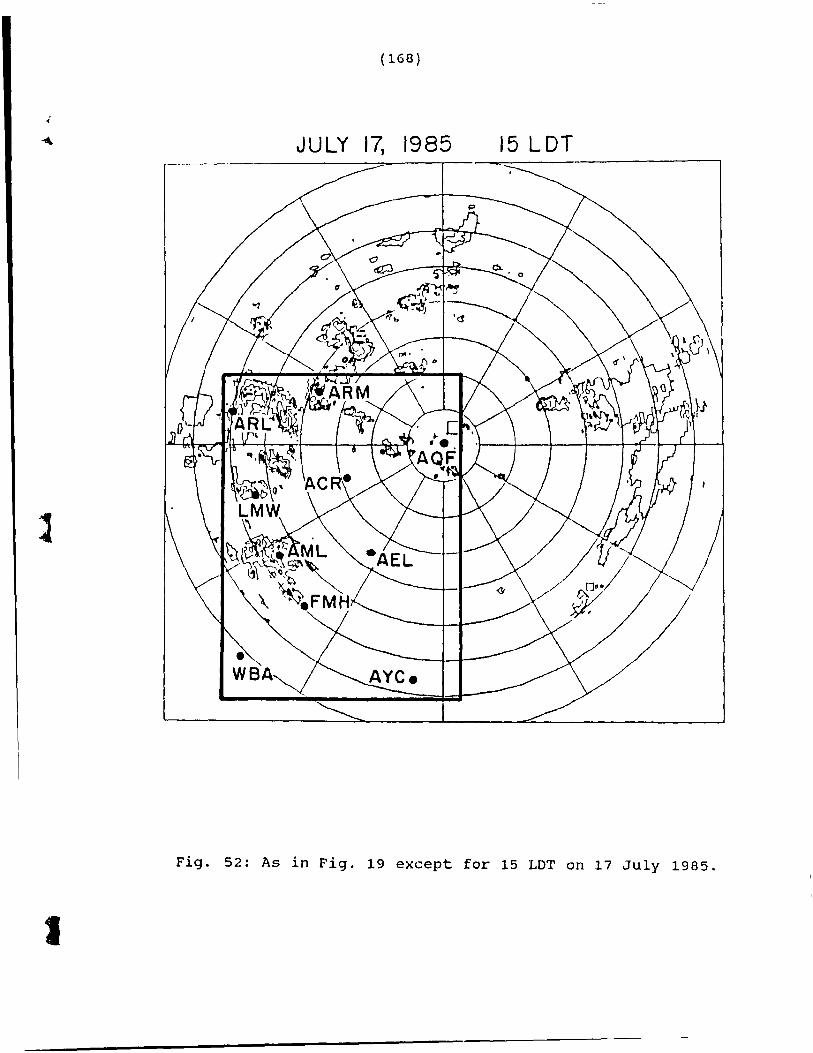
As in Fig. 19 except for 15 LDT on 17 July 1985. 168
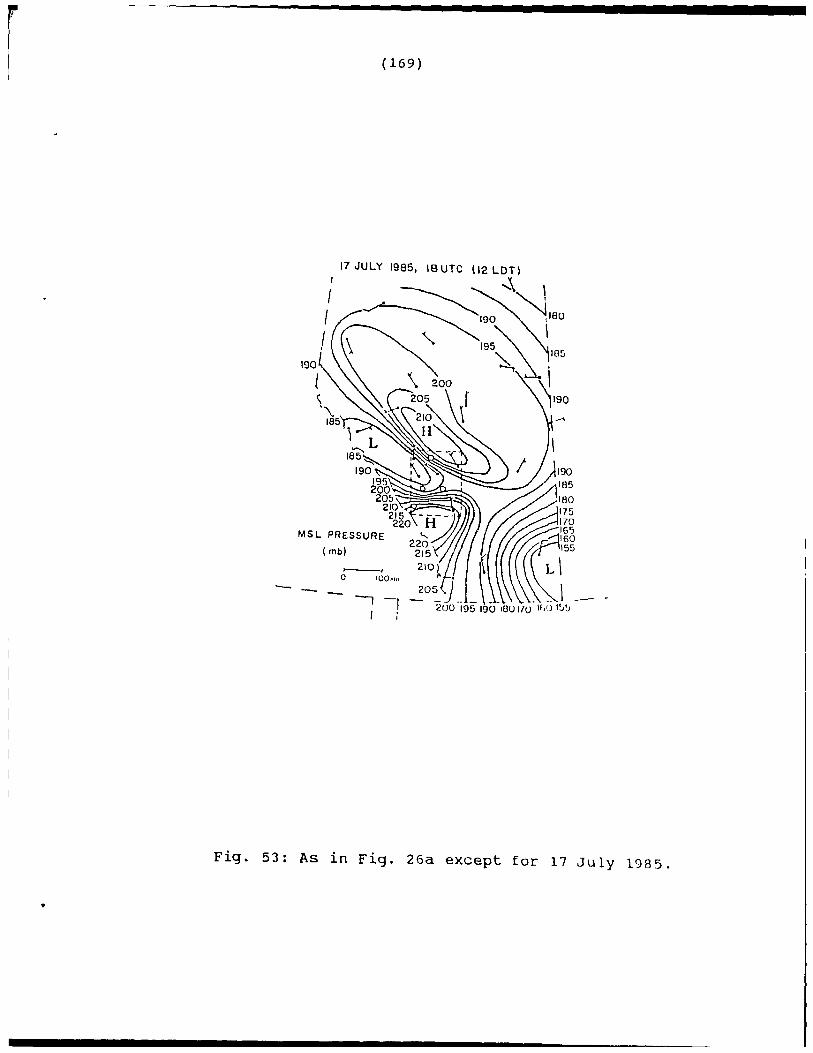
As in Fig. 26a except for 17 July 1985.
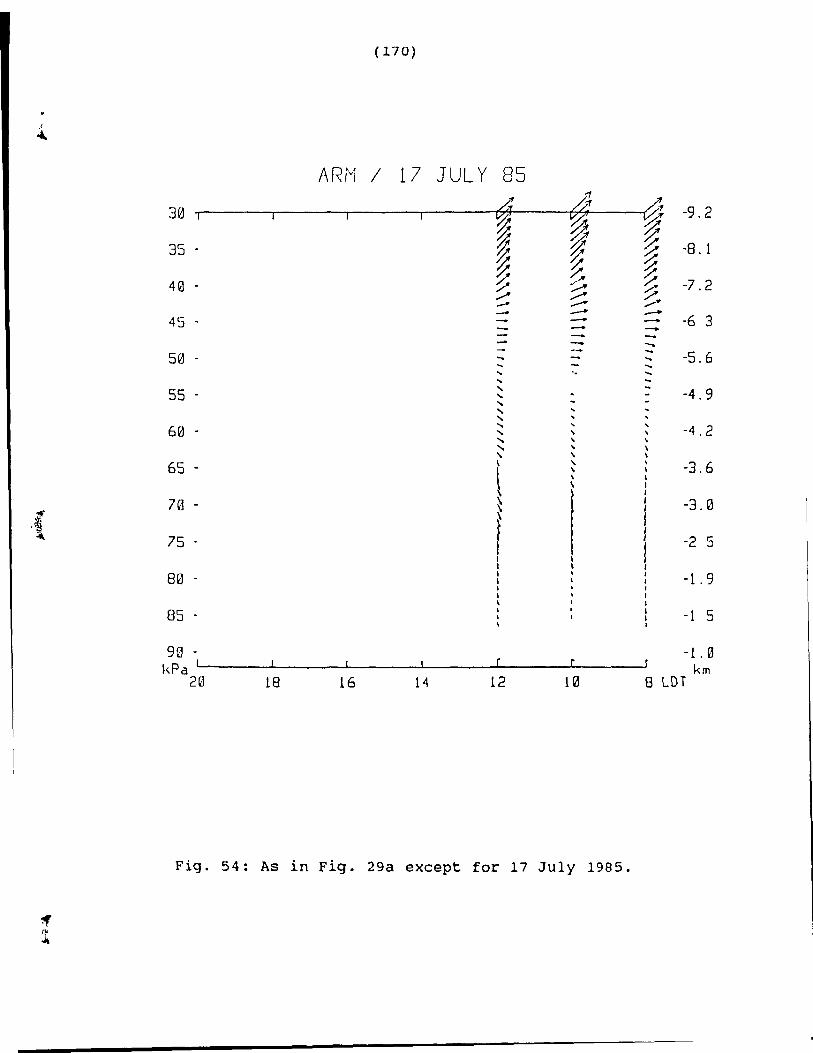
As in Fig. 29a except for 17 July 1985.
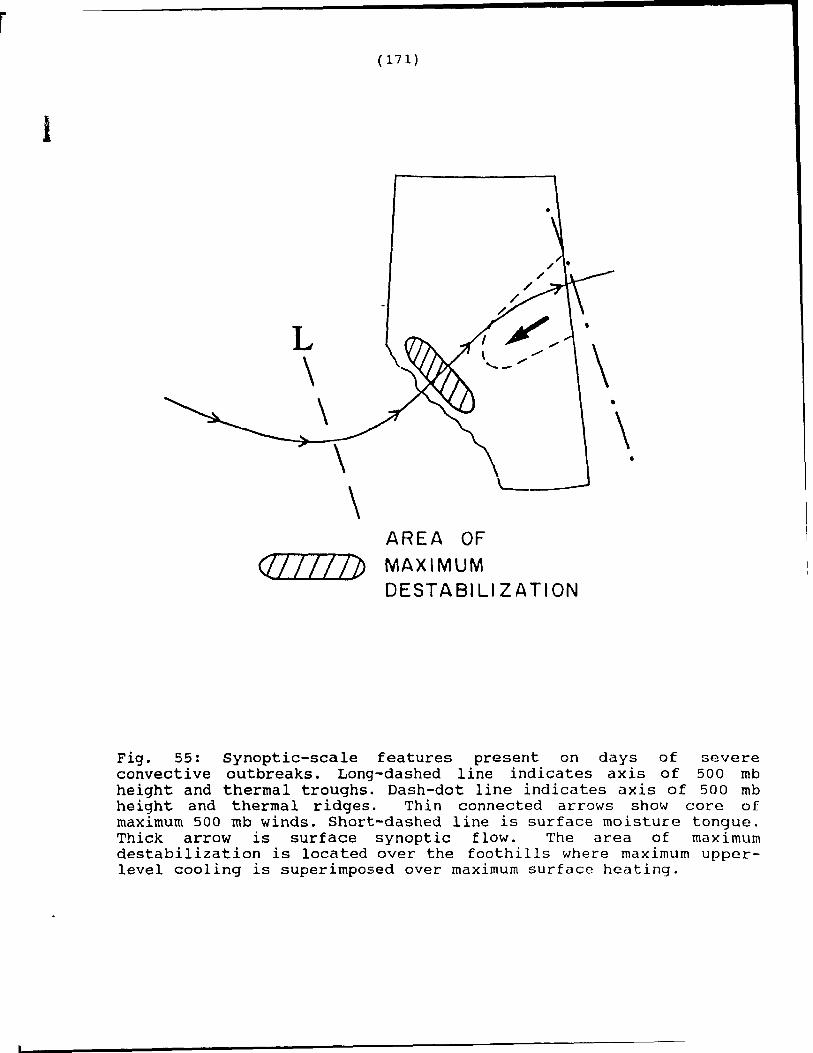
synoptic-scale features present on da ys of severe convective outbreaks. Long-dashed line indicates axis of 500 mb height and thermal troughs. Dash-dot line indicates axis of 500 mb height and thermal ridges. Thin connected arrows show core of maximum 500 mb winds. Short-dashed line is surface moisture tongue. Thick arrow is surface synoptic flow. The area of maximum destabilization is located over the foothills where maximum upper-level cooling is superimposed over maximum surface heating.
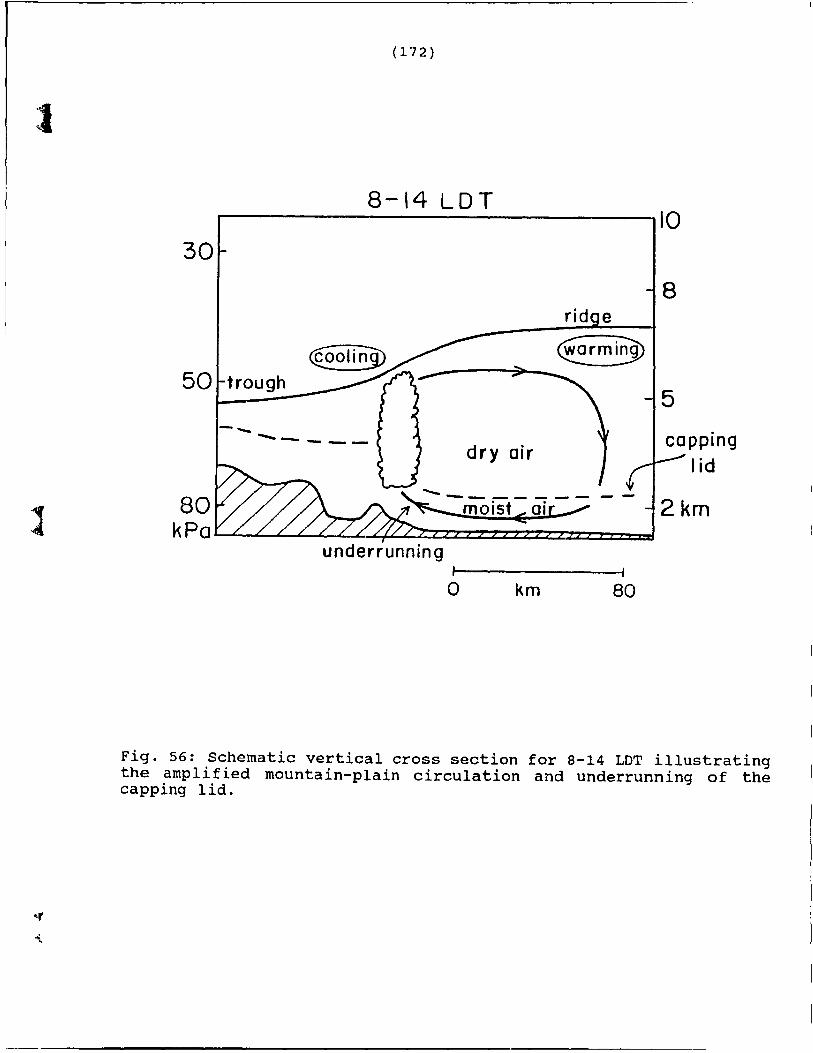
Schematic vertical cross section for 8-14 LDT illustrating the amplified mountainplain circulation and underrunning of the capping lido
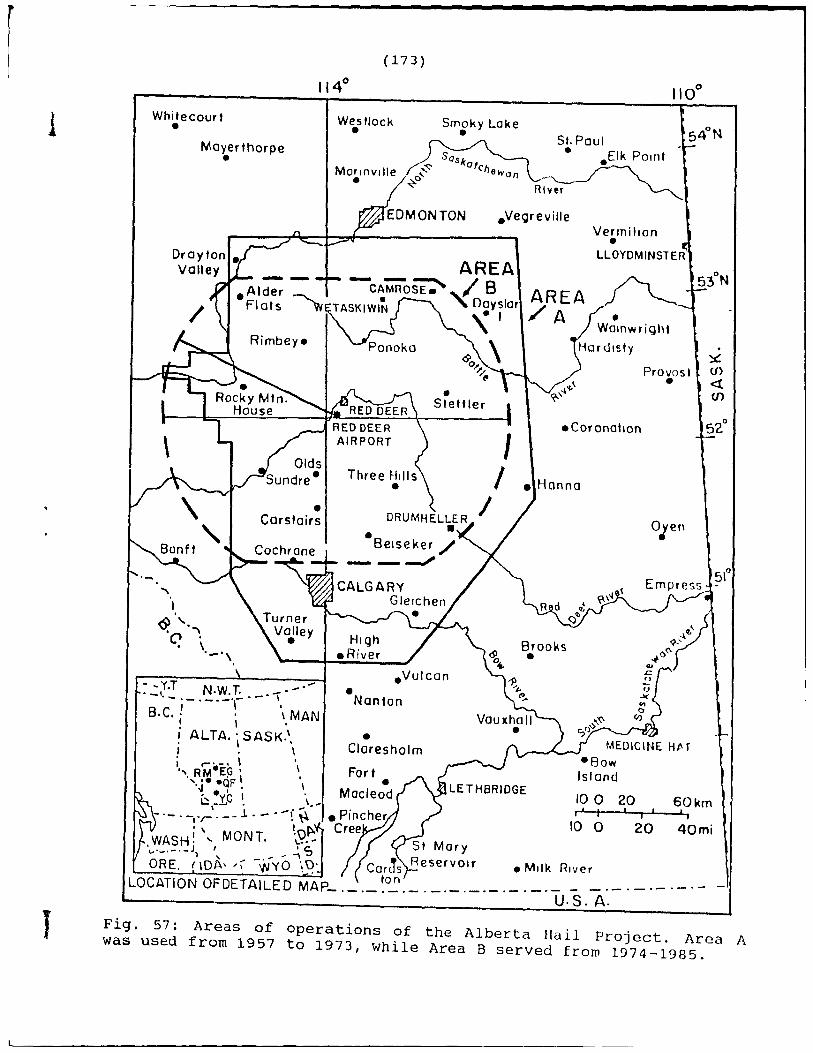
Areas of operations of the Alberta Hail Project. Area A was used from 1957 to 1973, while Area B served from 1974-1985.
Mean daily maximum dew point temperature for July in the Canadian prairies. Provinces from le ft to right: Alberta, Saskatchewan, and Manitoba. Contour interval is 0.5 oC.
169
170
171
172
173
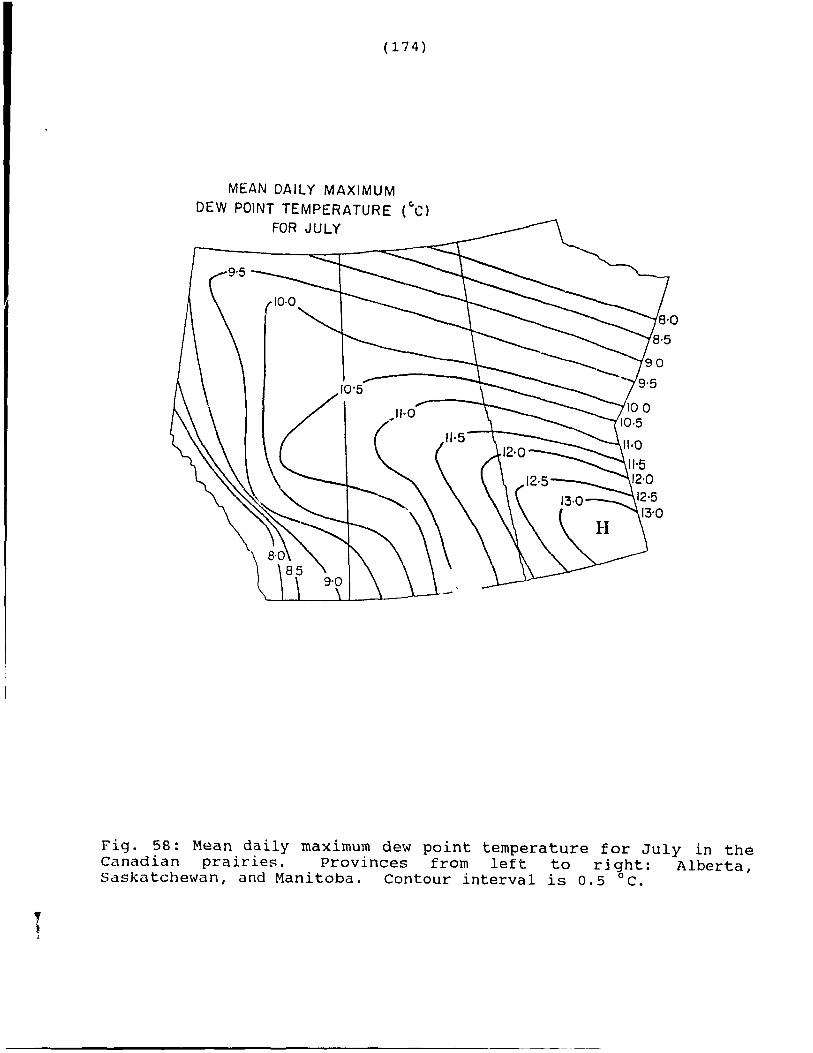
174
Table
1
2a
2b
3
4
5
6
7
8
9
10
(16)
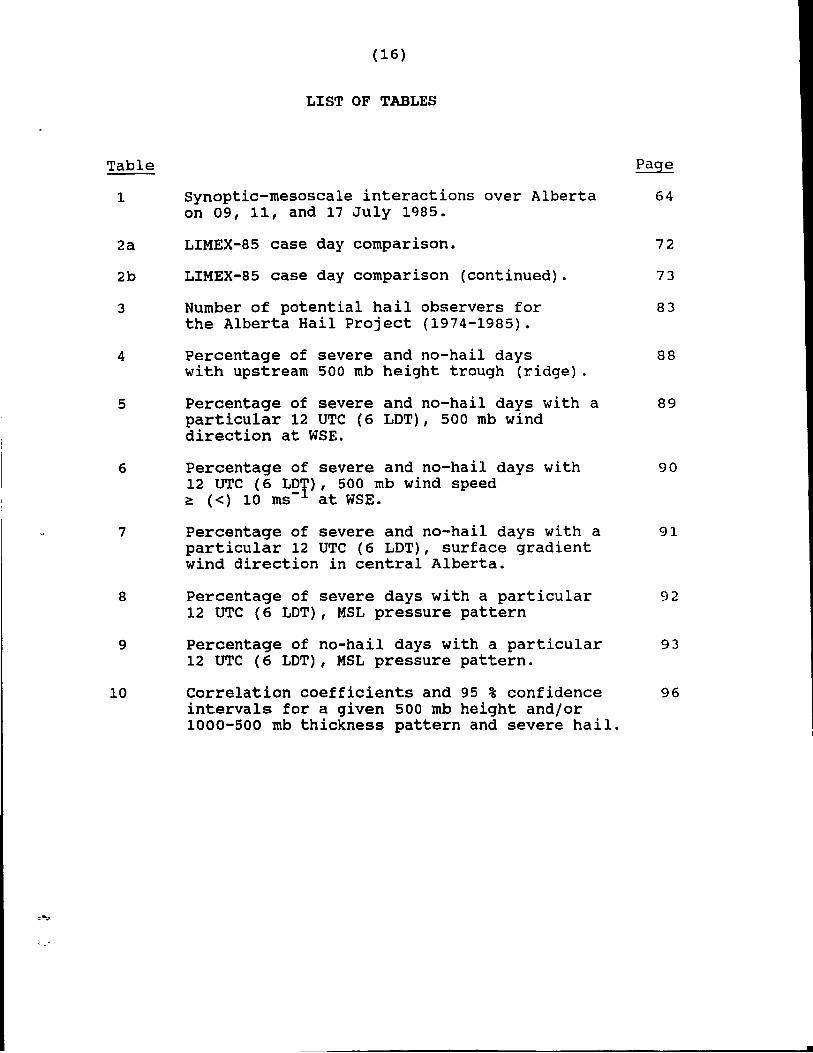
LIST OF TABLES
Synoptic-mesoscale interactions over Alberta on 09, 11, and 17 July 1985.
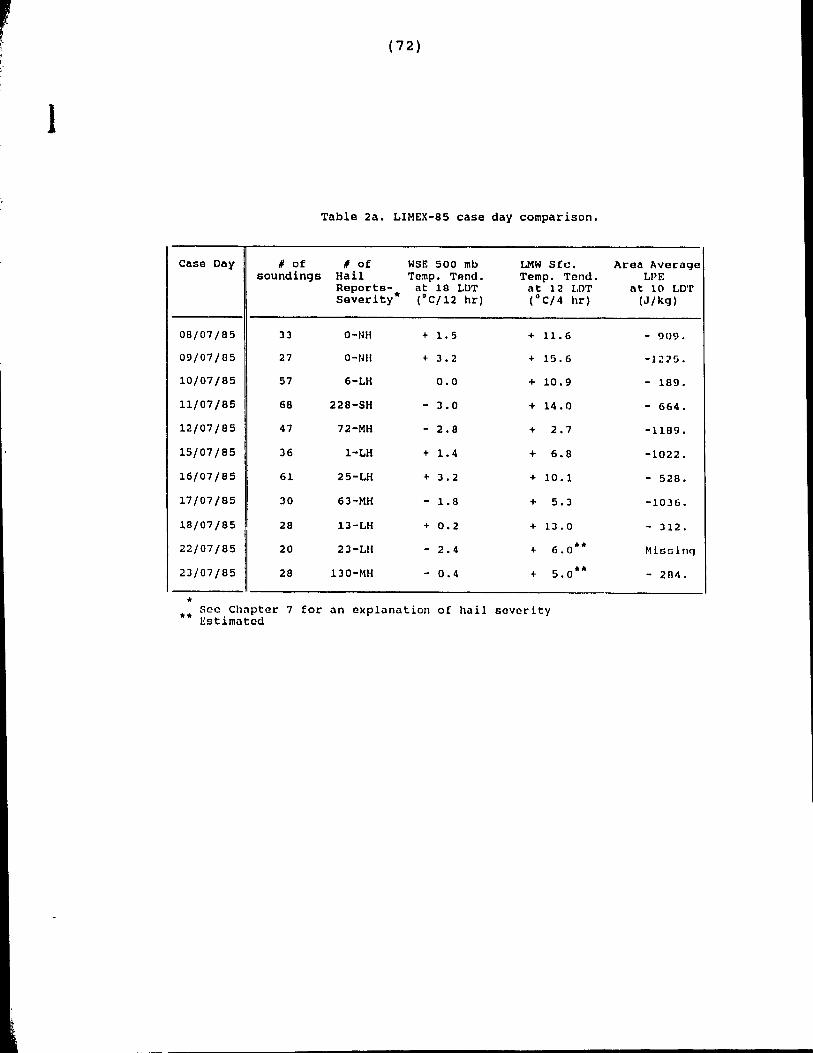
LIMEX-85 case day comparison.
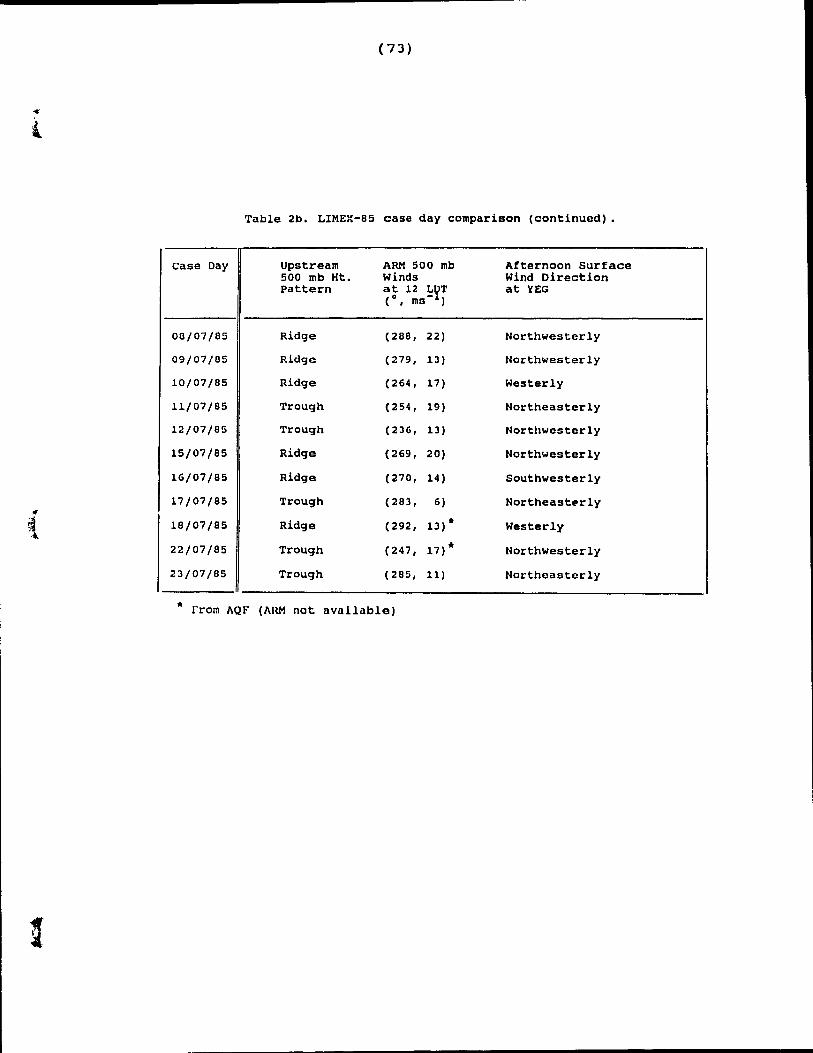
LIMEX-85 case day comparison (continued).
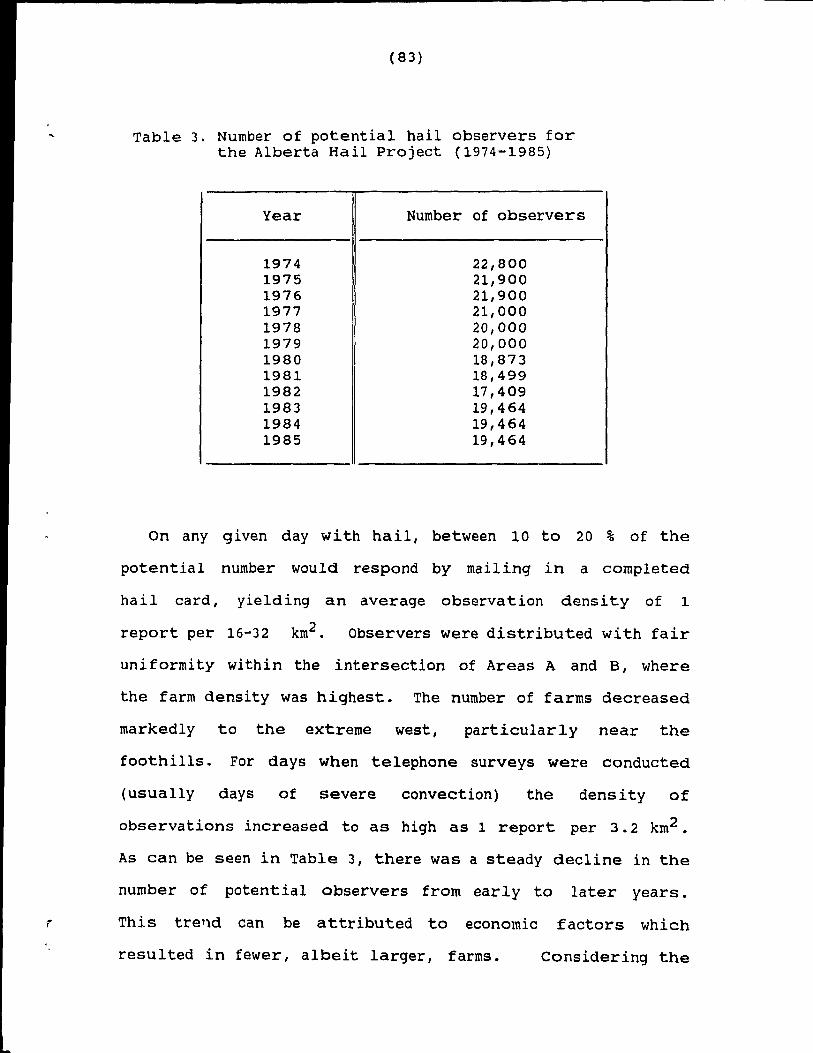
Number of potential hail observers for the Alberta Hail project (1974-1985).
Percentage of severe and no-hail days with upstream 500 mb height trough (ridge).
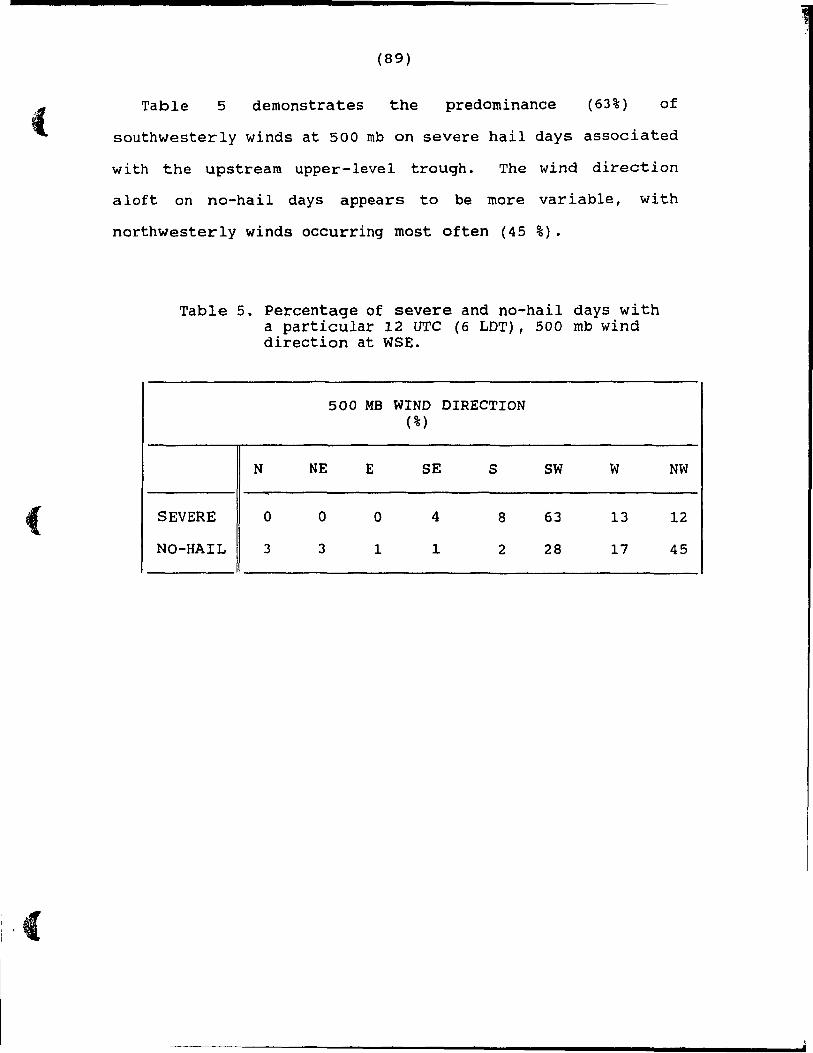
Percentage of severe and no-hail days with a particular 12 UTC (6 LOT), 500 mb wind direction at WSE.
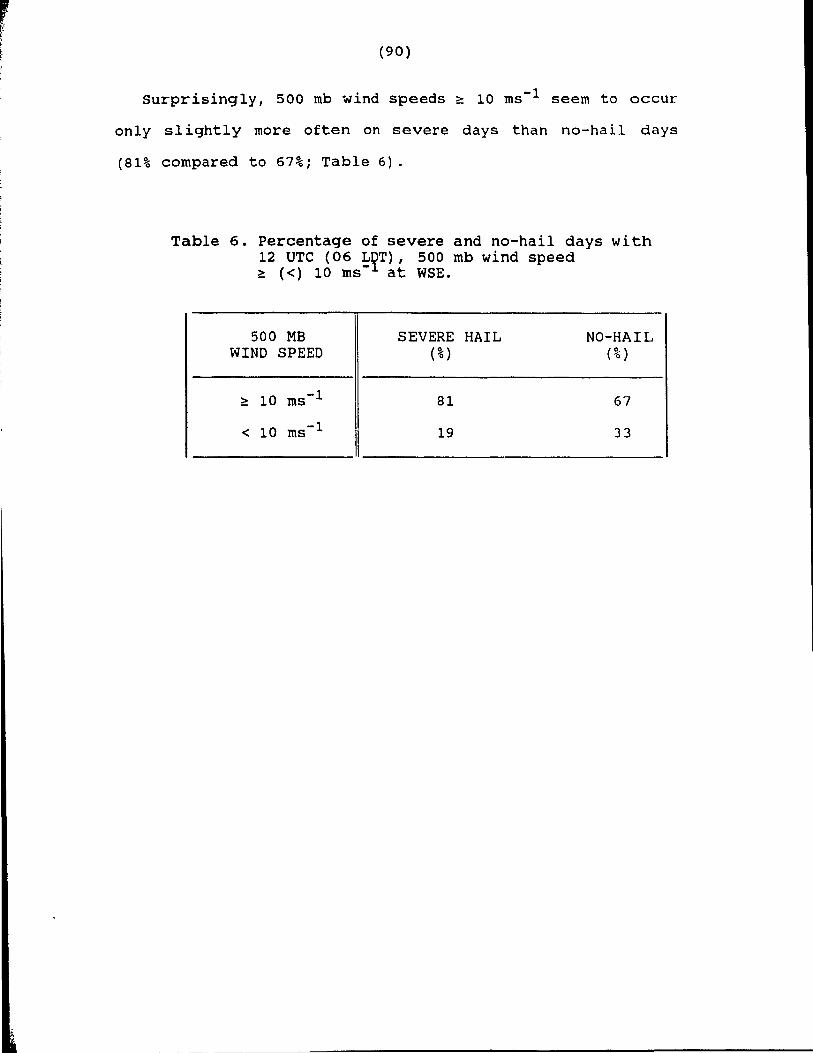
Percentage of severe and no-hail days with 12 UTC (6 L~I)' 500 mb wind speed ~ «) 10 ms at WSE.
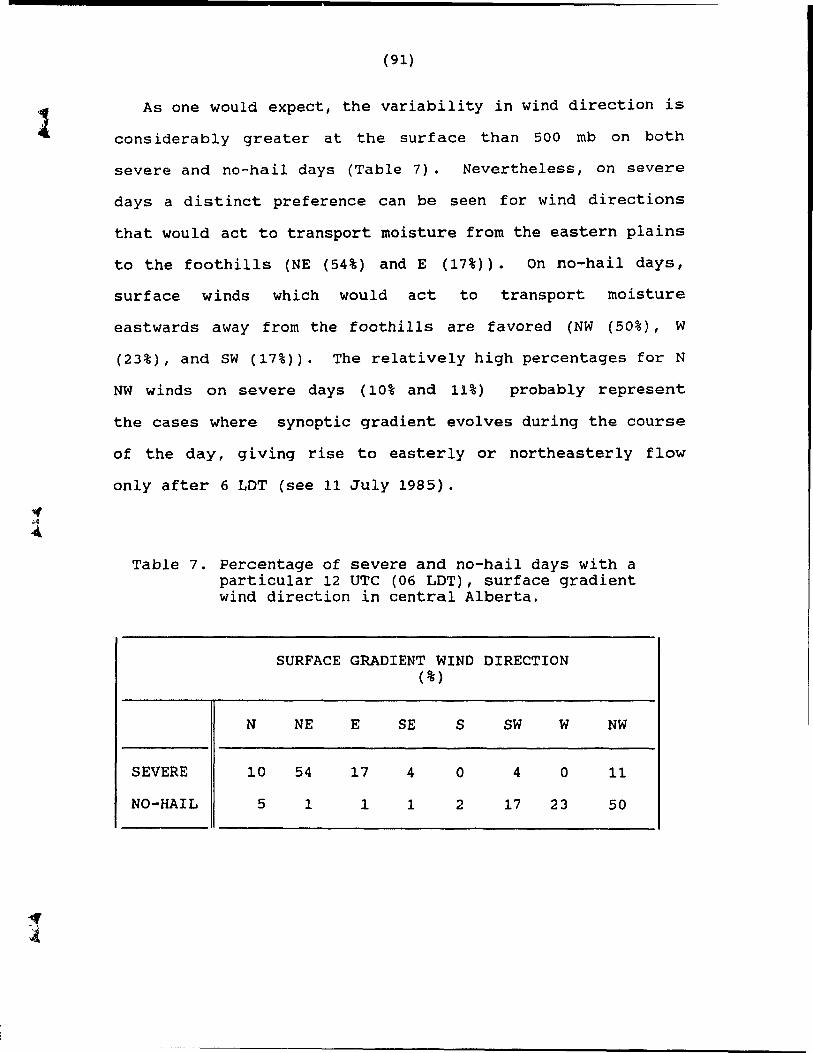
Percentage of severe and no-hail days with a particular 12 UTC (6 LOT), surface gradient wind direction in central Alberta.
Percent age of severe days with a particular 12 UTC (6 LDT), MSL pressure pattern
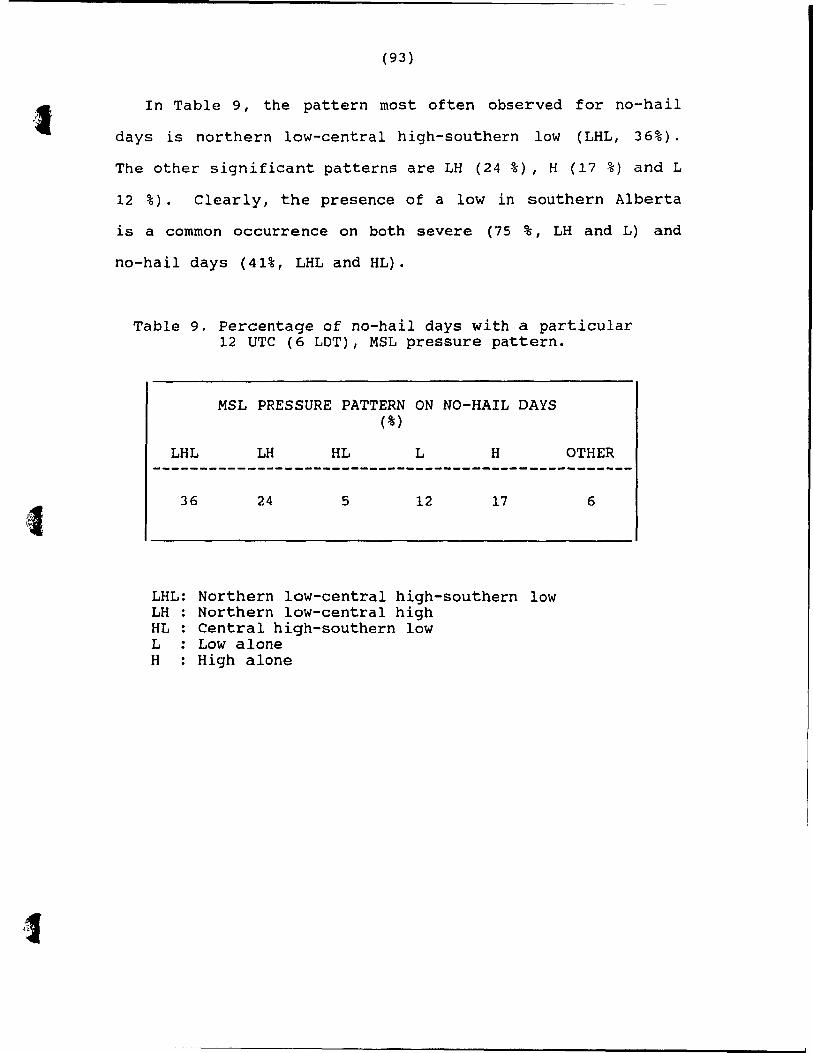
Percentage of no-hail days with a particular 12 UTC (6 LDT), MSL pressure pattern.
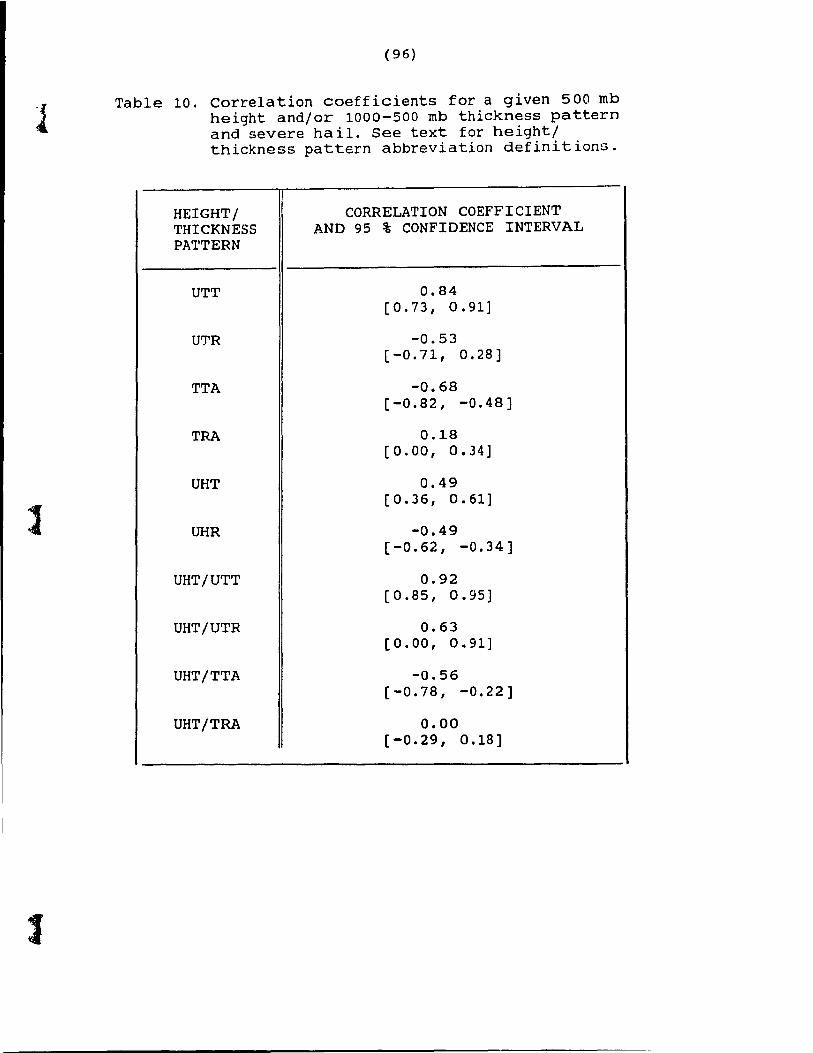
Correlation coefficients and 95 % confidence intervals for a qiven 500 mb height and/or 1000-500 mb thickness pattern and severe hail.
64
72
73
83
88
89
90
91
92
93
96
•
•• c
(17)
1. INTRODUCTION
1.1 Background
Central Alberta1 is a region highly susceptible to severe
summertime convection. Climat?logical statistics show that
the area is affected by hail on an average of 61 days each
summer (Wojtiw, 1975) and between 10 to 20 tornadoes are
reported annually (Bullas and Wallace, 1988; see also
Newark, 1984) . Although most of the hail cornes from
relati vely weak single and mul ticell storms, highly
organized multi or supercell storms develop three to five
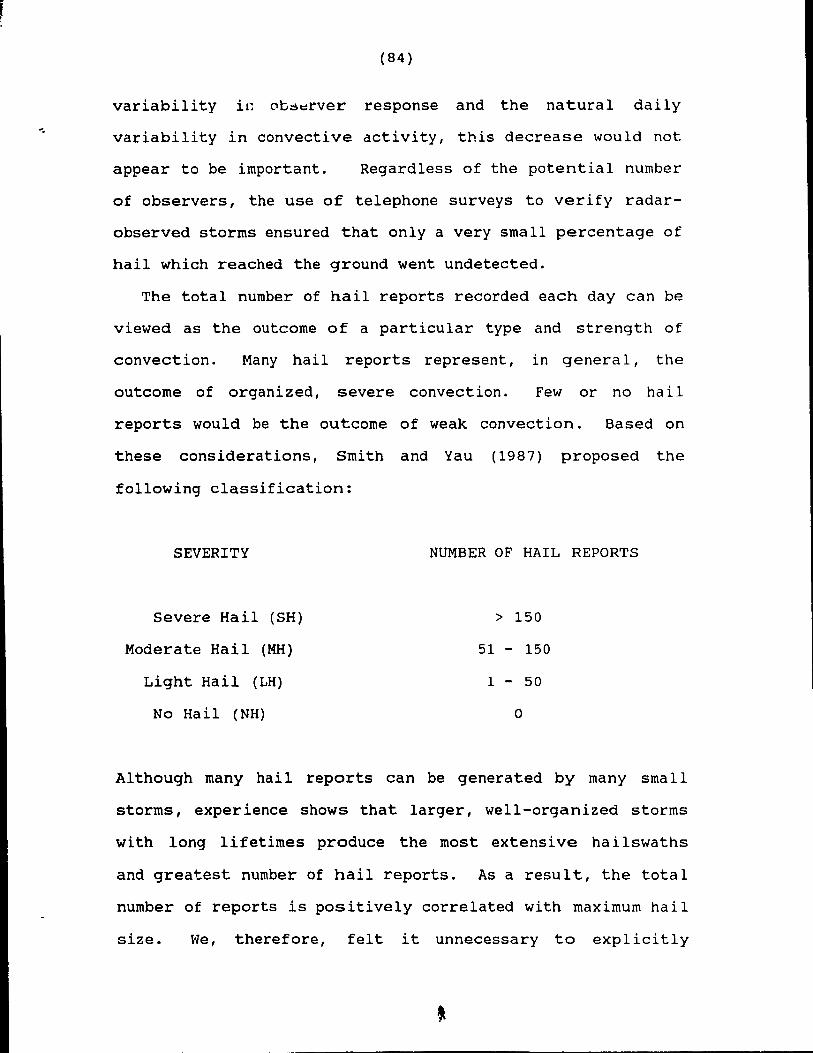
;:{ times a summer (Smith and Yau, 1987) and produce widespread,
large hail and/or tornadoes. In particular, the Edmonton
tornado of 31 July 1987, (F4 scale; Fujita, 1981) with 27
persons dead, 300 injured, and 250 millio~ dollars of
property damage (Bullas and Wallace, 1988) demonstrated the
1This region is generally thought of as being the part of the province between and including Edmonton and Calgary. We shall define it here as the area within a 130 km radius of Red Deer, which nearly corresponds to the maximum range of the weather radar operated bY the Alberta Research Council at the same location (Fig. 1).
(18)
vulnerability of the population to these organized outbreaks
of severe convection and underscored the need for improved
forecasting, pUblic awareness, and warning dissernination of
such events.
A number of conditions have generally been found to be
associated with the occurrence of severe convection (see
or underrunning the capping lid, including those mentioned
above and others not relevant to Alberta (e. g. the sea-
breeze circulation), the reader is referred to three
excellent papers by Barnes and Newton (1986), Schaefer et.
al (1986), and Schaefer (1987).
In a general sense, the goal of this dissertation is to
determine how the four conditions for the occurrence of
severe convection are usually met in Alberta. A brief
review of previous studies in the next section will allow us
to focus our goal considerably.
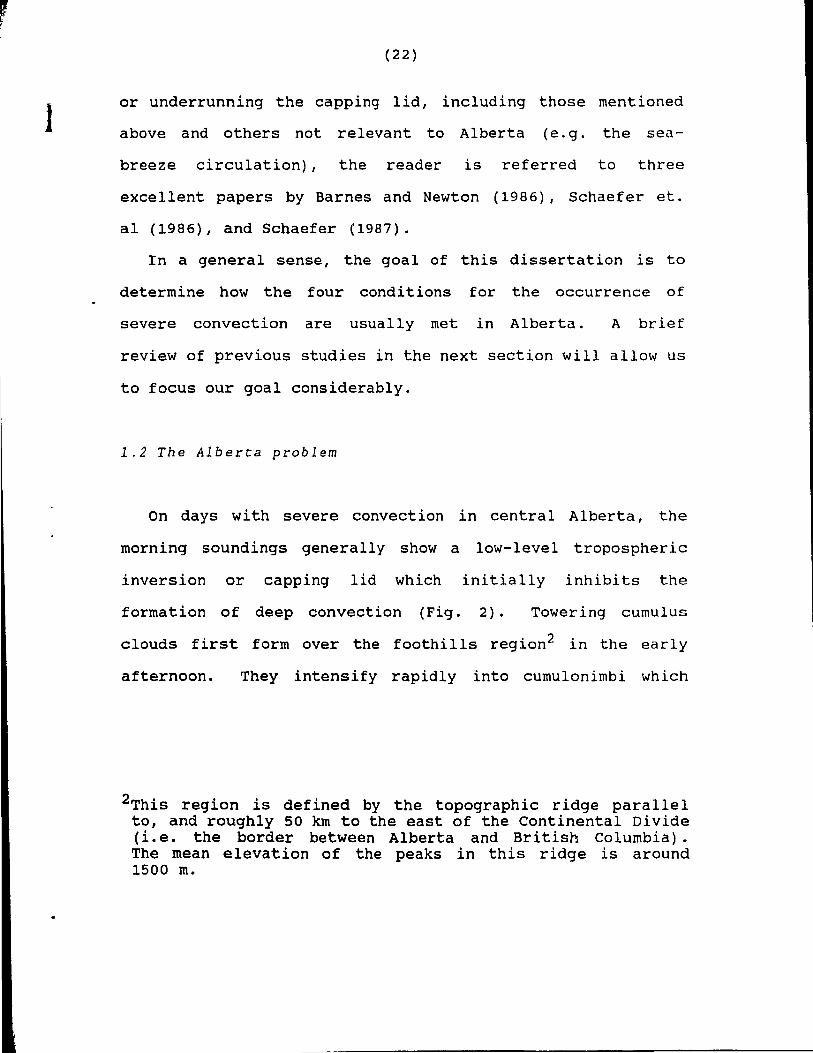
1.2 The Alberta problem
On days with severe convection in central Alberta, the
morning soundings generally show a low-Ievel tropospheric
inversion or capping lid which initially inhibits the
formation of deep convection (Fig. 2). Towering cumulus
clouds first form over the foothills region2 in the early
afternoon. They intensif y rapidly into cumulonimbi which
2This region is defined by the topographie ridge parallel to, and roughly 50 km to the east of the continental Divide (Le. the border between Alberta and British Columbia). The mean elevation of the peaks in this ridge is around 1500 m.
(23)
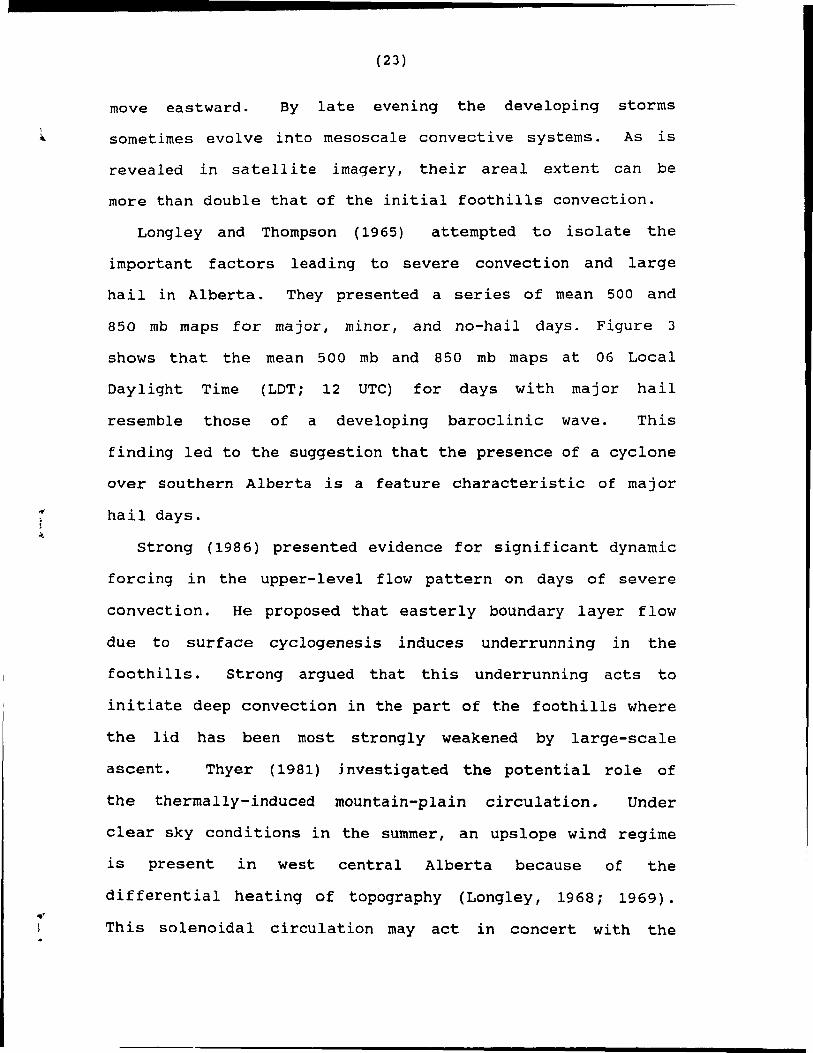
move eastward. By late evening the developing storms 1
li. sometirnes evol ve into mesoscale convective systems. As is
revealed in satellite imagery, their areal extent can be
more than double that of the initial foothills convection.
Long 1 ey and Thompson ( 1965 ) attempted to isolate the
important factors leading to severe convection and large
hail in Alberta. They presented a series of mean 500 and
850 rnb rnaps for major, minor, and no-hail days. Figure 3
shows that the mean 500 mb and 850 mb maps at 06 Local
Daylight Time (LOT; 12 UTC) for days with major hail
resemble those of a developing baroclinic wave. This
finding led to the suggestion that the presence of a cyclone
over southern Alberta is a feature characteristic of major
hail days.
strong (1986) presented evidence for significant dynamic
forcing in the upper-level flow pattern on days of severe
convection. He proposed that easterly boundary layer flow
due to surface cyclogenesis induces underrunning in the
foothills. strong argued that this underrunning acts to
initiate deep convection in the part of the foothills where
the lid has been rnost strongly weakened by large-scale
ascent. Thyer (1981) j nvestigated the potential role of
the thermally-induced mountain-plain circulation. Under
clear sky conditions in the summer, an upslope wind regime
is present in west central Alberta because of the
differential heating of topography (Longley, 1968; 1969).
"" f This solenoidal circulation rnay act in concert with the
l
(24)
synoptic-scale pressure gradient to give rise to severe
convection. Thyer demonstrated the presence of both the
upper and lower branchp.s of the mountain plain circulation
but failed to find any significant correlation between its
magnitude and the occurrence of hail. Regardless of the
source of the easterly component of the flow, its importance
is documented by smith and Yau (1987) who found, using a
well-mixed boundary layer model, that topographically-
induced upward motion is maximized in the Alberta foothills
when the upslope flow has an easterly component.
Considering the comparable regie/nal topographies, it is
reasonable to expect that factors which give rise to severe
convection in the High Plains of the united states (i. e.
Colorado, Wyoming and Montana) may be similar to those
operating in central Alberta. It is therefore of value to
mainly from an examination of synoptic maps (surface, 850,
700, and 500 mb levels) and tropopause/wind maxima charts on
30 severe weather days during June and July of 1979 over the
High Plains. The major features in his composite include:
1) An upper-Ievel trough upstream of the region where the convection is initiated,
2) Southwesterly winds ~ 10 ms- at 500 mb, 3) An easterly component of the surface flow
arising from the synoptic pressure gradient, and 4) A low-Ievel ~nversion.
These features are quite similar to those suggested by
Strong (1986) and Longley and Thompson (1965). Furthermore,
Doswell made the observation that the passage of a vigorous
(
(
(25)
short-wave trough through the High Plains is more Iikely to
terminate a severe weather episode than initiate it, unless
the passage occurs at the time of maximum heating.
Al though he did not have mesoscale observations to conf irm
it, Doswell felt that the increasing easterlies on days of
severe weather observed by Modahl (1979) are the result of
the surface synoptic circulation being enhanced by the
diurnal upslope flow.
1.3 Statement of the problem
The evidence presented above suggests that the forcing
provided by the synoptic environment is a necessary, and
perhaps sUfficient, condition for the occurrence of severe
convection in Alberta. However, on account of the coarse
resolution in the observations, the forcing provided by the
mesoscaie environrnent, in particular that of the mountain
plain circulation, has not been investigated adequately. In
thls dissertation, we will examine the interactions between
the mesoscale and synoptic-scale pre-storm environments over
Alberta to provide answers to the following questions:
1) What role, if any, does the mountain-plain circulation
play in the initiation of severe convection in Alberta?
2) What is the significance of the synoptic setting
1
(26)
described by Longley and Thompson (1965) for major hail
days? Is the existence of this setting a necessary and
sufficient condition for the initiation of severe convective
outbreaks?
3) When, where, and how is the capping lid first removed on
days of severe convective outbreaks in Alberta?
Our approach will be to carry out a detailed analysis of
a high resolution dataset collected in a rnesoscale
experiment in Alberta (Llmestone Mountain EXperiment 1985;
LIMEX-85). We shall focus on the evolution of the synoptic
and mesoscale features with special emphasis on three case
days: 11 July 1985, a day of severe convection; 09 July
1985, a day of weak, localized convection; and 17 July 1985,
a day of widespread, non-severe convection. Our resul ts
yielded a coherent picture of the interactions between the
synoptic and mesoscale circulations which act in concert ta
ini tiate severe convection. The combined mesoscale and
synoptic-scale analysis, cumulating in a conceptual model of
severe convective outbreaks in Alberta, has not been
attempted previously.
1.4 Out1ine of dissertation
Chapter 2 describes LIMEX-85, our data base and method of
•
(
(27)
analysis. A case of a severe weather outbreak on 11 July
1985 will be presented in Chapter 3 and the results compared
wi th those from two days of non-severe convection (09 and
17 July 1985) in Chapter 4. A brief comparison of aIl
eleven of the LIMEX-85 days will be made in Chapter 5. A
conceptual model of severe convecti ve outbreaks is then
proposed in Chapter 6 and will be substantiated by a
statistical analysis using climatological hail data in
Chapter 7. Conclusions, recommendations regarding
forecasting, and future research are found in Chapter 8.
(28 )
2. OBSERVATIONAL DATA AND METHOOS OF ANALYSIS
2.1 The LImestone Hountain EXperiment (LIHEX·85) and data
analyses
LIMEX-85 was carried out from 08 July to 23 July 1985.
Its primary objective was to obtain accurate surface and
upper-air data of high spatial and temporal resolution over
the Alberta foothills during days eXhibiting a capping lido
Figure 4 shows the LIMEX-85 observing network (see Appendix
l for station identifiers). Nine upper-air radiosonde and
airsonde stations provided soundings at two hour intervals
from 8 LOT (14 UTC) to 18 LOT (00 UTC). The surface network
included eight automated stations (CR-21 units manufactured
by Campbell Scientific Instrument company) which recorded
five minute averages of temperature, relative humidity, and
winds; 13 forestry service stations3 which provided manual
observations twice daily at 08:30 and 13:00 LOTi as weIl as
the 33 regular surface observation stations of the
Atmospheric Environment Service of Canada (AES; see Fig. 1).
A 10 cm, S-band radar located at Red Oeer (AQF) was operated
30n1y data from 4 of the 13 stations were used in the analyses (see Fig. 4 for station locations).
• (29)
by the Alberta Research Council throughout the experiment.
The digitized rsflectivity data in plan position indicator
(PPI) format, along with both polar-orbiting and
geostationary satellite imagery, were used to determin,~
the location and intensity of convection, and to verify
cloud observations reported by the manual observing
stations. The datas et was supplemented by five instrumented
aircraft flights, and by acoustic sounder (SODAR) 4
measurernents. In total, the full observational network was
in operation on 11 days5, and hail fell in the project area
on 9 of these days. Following the hail severity
classification of smith and Yau (1987; see Chapter 7), 5
days were classified as light hail days, 3 as moderate , and
(, 1 (11 July 1985) as severe. On the remaining 2 days only
cumulus (CU) and towering cumulus (TCU) clouds were present.
A total of 449 soundings were released during the entire
exper iment.
Two sets of analysis were carried out. The synoptic-
scale analyses were made manually and cover the whole of
Alberta for the fOllowing variables: Mean sea-level (MSL)
pressure, surface temperature, surface dew point
4Soth the aircraft and SODAR data were unavailable for this study.
4[. 5A reduced network was in operation on 3 other days.
r
1
'f
.,
(30 )
temperature, and 2-hour surface temperature and pressure
tendencies. The data that went into the analysis include
observations from the AES operational network and the
surface measurements at the upper-air stations wi thin the
LIMEX-85 area. It should be pointed that the MSL pr?!'"~sure
gradient in regions of elevated and/or sloping terrain is
subject to considerable uncertainties. To minimize the
errors, Sangster (1987) proposed a method of pressure
analysis using altimeter data, and Weaver and Toth (1990)
presented a modification of Sangster' s scheme.
Unfortunately, no altimeter settings were recorded during
LIMEX-85, and Sangster's method cannot be applied. To check
the accuracy of our MSL pressure analyses, we performed a
corresponding 850 mb height analysis. It was found that the
minima and maxima in MSL pressure were located within 30 km
of the corresponding minima and maxima in 850 mb height.
Since the actual magnitude of the MSL pressure gradient was
not crucial to our arguments, no attempt was made to improve
on its accuracy. We suggest that altimeter settings should
be recorded in future mesoscale experiments in Alberta to
allow a more accurate determination of surface pressure
gradients.
The other set of analysis is the objective mesoscale
analyses covering an are a depicted by the rectangle in Fig.
1. Horizontal and vertical cross sections of various
quantities were constructed at one or two hour intervals for
each of the eleven case days. The irregularly spaced data
....
(
( 31)
were f irst interpolated onto a regularly spaced (0.14 0)
12x14 grid mesh using a version of the Barnes (1973) scheme.
The Gaussian weighting function used, decreases from unit y
at zero distance from the grid point to a value of 0.1 at
the average distance of the four nearest stations. To
determine the adequacy of the analysis scheme, sorne
object~ vely analyzed fields were compared with the
corresponding subjectively analyzed fields. Good agreement
WdS found. Test analyses were also made using a coarser
(0.28°) 6x7 grid mesh and the results were found not to
deviate significantly from the fine mesh analysis.
For future reference, we show in Fig. 5 the analysis area
with the location of the observation stations superimposed.
The upper-air stations are denoted by a * symbole For the
sake of clarity, only the locations for two of the surface
stations (FMH and WBA) are plotted (0 symbol). Referring to
Fig. 4, i t is evident that the foothills are oriented
roughly in a northwest to southeast direction parallel to a
line connecting ARL, LMW, AML, and FMH. stations AYC, AEL,
ACR, ARM, and AQF in Fig. 5 shall be referred to as plains
stations, while ARL, LMW, AML, FMH, and WBA
stations.
foothills
In aIl the analyses involving upper-air and sounding
derived variables, data from the eight upper-air stations6
, ,
l
(32 )
were used. The distribution of stations is fairly uniform
except in the southwest corner of the gr id near WBA.
Fortunately, our conclusions do not depend cri tically on
upper-air data in this corner.
Data from aIl the surface stations shown in Fig. 4 were
used in our surface analysis except after 13 LOT, when fore-
stry station data were no longer available. To construct
vertical cross sections, data were interpolated linearly
onto a grid with a horizontal and vertical grid lengths of
13.8 km and 10 rob respectively.
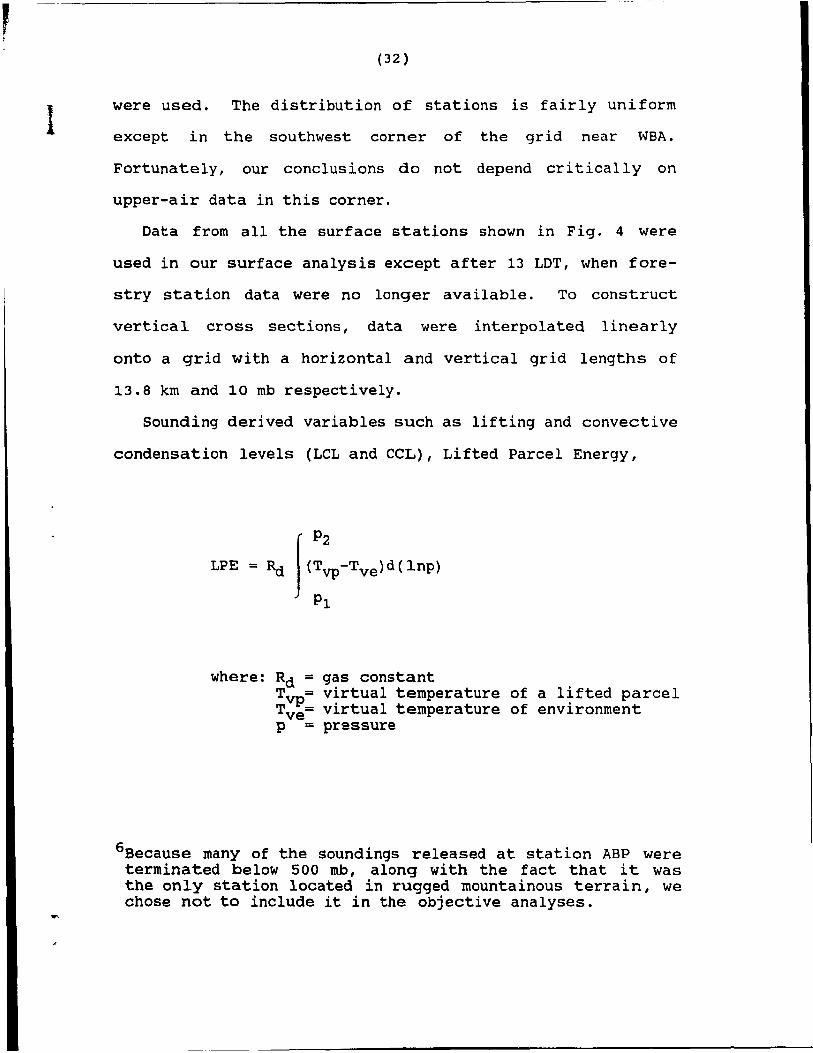
Sounding derjved variables such as lifting and convective
condensation levels (LeL and CCL), Lifted Parcel Energy,
LPE = Rd J(:~-Tve)d(lnp) Pl
where: Rd = gas constant Tvp: virtual temperature of a lifted parcel Tve- virtual temperature of environment p = prsssure
6Because many of the soundings released at station ABP were terminated below 500 mb, along with the fact that it was the only station located in rugged mountainous terrain, we chose not ta include it in the objective analyses.
1
(33)
etc., were deterrnined nurnerically using algorithrns given in
stackpole (1967). Surface quantities required in these
calculations were cornputed by averaging the variables in the
lowest 30 rnb of the sounding.
J
(34)
3. A CASE STUDY OF A SEVERE CONVECTIVE OUTBREAI<
- 11 JULY 1985
3.1 Introduction
July 11, 1985 was the only day that experienced a severe
convective outbreak during LIMEX-85. Well-organized
multicell storms began moving out of the faothills around 16
LDT. Radar reflectivities between 60 and 70 dBz were
maintained in these storms over the course of several hours.
A total of 228 hail reports were received, and 8 of these
were for hail with golfball size (3.3-5.2 cm). Data
coverage on this day was the best among all the LIMEX days.
Soundings were released every two hours beginning at 14 UTC
(08 LDT), 11 July and ending at 02 UTC, 12 July (20 LOT, 11
July) .
3.2 Operational, 500 mb analyses
The presence of a 500 mb trough upstream of central
Alberta and a ridge downstream at 18 LOT, 11 July 1985 (Fig.
6b) indicated large-scale ascent over the region. The
overall flow pattern resembled the Longley and Thompson
demonstrate the accelerating upslope flow while the posi
tive tendencies maximized around 600 mb, give an indication
of upper-Ievel return flow. The actual ACR winds at 850 mb
changed from (7 ms- l ,300°) at 8 LOT to (4 ms- l ,45°) at
12 LDT. The 600 mb wind at ACR increased from (9 ms-l,
260°) to (12 ms- l ,240°) during the same periode
3.3.2 Underrunning and low-leve1 moisture convergence -the formation of deep convection (12-16 LDT)
At 14 LOT, the capping lid was still weakest over the
foothills soutbeast of ARL. It had diminished slightly
(~ 2 °K/2 h) between ARM and ACR (Fig. 16a). The surface
temperature tendency field at this time (Fig. 16b) shows
that the greatest warming was occurring out over the capped
plains, while sorne cooling had begun near LMW. In agreement
with this pattern, maximum surface pressure falls had by
this time shifted to the plains (Fig. 16C), while the
smallest falls were found over the foothills.
A major change took place in the surface wind and dew
point temperature field from 12 LOT to 14 LOT (Figs. 13a and
17a) • Upslope flow was present over most of the grid at 14
LOT. Oew point temperatures increased by as rnuch as 8 Oc in
· j , ,
:F ...
( 41)
2 hours in areas of the foothills. The increase was
proropted by moisture convergence associated with low-level
transport of moist air from the plains to the foothills by
way of the lower branch of the amplifying mountain-plain
circulation (Fig. 17b) Infrared satellite imagery taken
at 15:34 LOT displays the line of TCU (see arrow in Fig. 18)
that formed along the foothills as a result of this
underrunning process. Figure 19 shows the location of the
f irst radar echo (300 0, 160 km range) at 16 LOT, shortly
after underrunning had taken place.
The effects of the intensifying secondary circulation can
also be inferred in the 500 rob divergence field presented in
Fig. 20a. Over the foothi1ls, a region of divergence is
observed, consistent with the argument that LMW was
located in the ascending branch of the mountain-plain
circulation. The band of strong convergence to the east
gives evidence of the return flow seen in Fig. 15d.
As of 14 LOT, coo1ing at 500 rnb had covered rnost of the
ana1ysis grid (Fig. 20b) • The general southeastward
progression with time of the leading edge of the 500 rob
coo1ing (Figs. lla, 14a, and 20b) , may be attributed to the
combined effects of large-scale lifting and cold air
advection associated with the advancinq upper-Ievel trouqh.
The mesoscale spatial and temporal variation evident in
these 500 mb fields is quite striking and is indicative of
the significant details largely unseen by the operational
forecasters given the coarse resolution of the current
1
. '
( 42)
upper-air network.
The result of the underrunning-induced moisture
convergence in the low levels is revealed in the LPE
tendency field ending at 14 LOT (Fig. 20c). The increases
in LPE over the foothills are of the same order as those
associated with surface heating between 8 and 10 LOT (see
Fig. 11b). Figures 21a and 21b display the horizontal
distribution of positive LPE7 below the level of neutral
buoyancy at 14 and 16 LOT respectively.
observation of TCU at AML, LMW, and ARL at
Note the
16 LOT, in
agreement with the line of clouds depicted in the 15:34 LOT
satellite image (Fig. 18). For the most part, the strongest
convective development seems to have been initiated over the
foothills where LPE was largest.
3.4 Vertical cross sections of time anomalies
To illustrate further the presence of underrunning and
the amplified solenoidal circulation, we computed vertical
cross sections of time anomalies of various variables. If S
is a scalar field, the anomaly field (SA) is defined as
7The positive LPE is more commonly known available potential energy (CAPE; see e.g. Jain, 1985) .
as convect ive Bluestein and
(
(43)
where 'S is the time-averaged field for the period 8 to 16
LOT. The vertical cross sections of anomalous equi valent
potential temperature (ee) and u-component of the wind at
two hour intervals are shown in Figs. 22 and 23. The
upslope transport of anomalously high Se air beneath the
capping lid is weIl illustrated in the 8, 10, 12, and 14 LDT
cross sections (Figs. 22a, 22b, 22c, and 22d). The vertical
transport of high ee air from the moist, capped boundary
layer to the narrow band of deepening convection over LMW is
apparent at 16 LOT (Fig. 22e). Weakening anomalous low
levei westerly flow (downslope winds) can be seen in the u
component cross sections at 8 and 10 LOT (Figs. 23a and
23b). By 12 LOT (Fig. 23c), anomalous low-Ievel easterlies
and anomalous westerlies between 600 and 450 mb are the
first signs of the lower and upper branches of the
solenoidal circulation. Upward transport of low-Ievel
easterly momentum by the ascending branch of the solenoidal
circulation over the foothills can be discerned in Figs. 23d
and 23e by the negative anomalies appearing above LMW. This
pattern agrees weIl with the 500 mb divergence field at 14
LOT shown in Fig. 20a.
J
,,..
(44)
3.5 Synoptic-scale surface analysis
As mentioned in Chapter l, work by Longley and Thompson
(1965) and strong (1986) suggest that an easterly component
of the upslope flow, capable of triggering severe
convection, cou Id be generated in the foothilis by a
baroclinic surface cyclone in southern Alberta. similarly,
a surface anticyclone located, for exampIe, to the north of
Edmonton, could yield the same effect. Indeed, operational
surface analyses during the summertime often depict small
scale cyclones over Alberta. An examination of surface
barograph traces for the LIMEX-85 experiment, such as 7-13
JUly 1985 pressure trace for Rocky Mountain House (ARM)
(Fig. 24), revealed that, by virtue of its large amplitude
relative
induced,
to synoptic-scale variations,
diurnal pressure wave was by
the thermally
far the dominant
forcing present. However, such evidence does not rule out
the importance of the synoptic-scale pressure field in
initiating severe convection. Therefore, we present a
sequence of subjectively analyzed fields for MSL pressure,
surface temperature, and surface dew point temperature.
Three major systems can be seen in the MSL pressure field
(Fig. 25a): a 1013.0 mb low pressure center in southeastern
Alberta, a 1016.5 hi~h northwest of the LIMEX area, and a
second high located over the foothills west of the LIMEX
area. Although the winds at this time were weak with a
downslope component, the synoptic pressure gradient
(45 )
resulting from the northwestern high and the southeastern
low favored the formation of a northeasterly flow over the
plains that would tend to enhance the thermally-induced
upslope flow near the foothills. Figure 25b shows that at
08 LOT, the temperature was relatively warm over southern
Alberta, and a warm tongue of air ran parallel and to the
east of the foothills. The northern part of the province
was relatively cool but the coldest temperatures were found
over the higher topography to the west of the LIMEX area.
'rhe surface dew point tempe rature field (Fig. 25c) was
distinguished by a tongue of moi sture extending from east
central Alberta towards the northwest.
At 12 LOT, the MSL pressure field (Fig. 26a) shows that
i the northwestern high had extended southeastward, with its
" central pressure falling 1 mb. The southeastern low had
deepened 1 mb with increased troughing towards the
northwest. As a resul t of surface heating, the central
pressure of the foothills high had dropped more than 2 mb.
In Fig. 26b, one observes temperatures in excess of 30°C in
southeastern Alberta. Significant warming arising from
insolation had created a warm tongue of air along and just
to the east of the continental Divide. A pool of cooler air
was situated to the north of the LIMEX area. The overall
effect of these changes was to strengthen the pressure
gradient over the plains, giving rise to northeasterly
winds. This flow pattern began te channel the moist plains
t{ air to the foothills along the northern edge of the LIMEX ..
( 46)
'!. area (Fig. 26c).
Six hours later at 18 LOT, the deepening of the
southeastern low by another 3 rob had further intensified
the northeasterly upslope flow over the LIMEX area (Fig.
27a). The wind field around the low indicates the presence
of a vortex. In northern Alberta, two high pressure
centers, one in the west and the other in the east, were
evident. The foothills high appears to have rnerged wi th
the westernmost of these two highs in the form of an
elongated ridge running parallel to the continental oivide.
From the temperature field (Fig. 27b), one notes that this
ridge was associated with cool air, probably the result of
cloud shading and the cold surface outflow from the
multicell storms. Warm temperatures continued to exist
within the southeastern low indicating that a significant
part of the deepening of this system rnay have been caused by
surface heating. The sparse cloud coyer over southern
Alberta in both the 15:34 and 20:23 LOT infrared satellite
images (Figs. 18 and 28) is consistent with this
possibility. The 18 LDT dew point field (Fig. 27c) shows
a well-defined moisture tongue extended from the Alberta
Saskatchewan border up to foothills northwest of the LIMEX
area. It demonstrates the effectiveness of the synoptic-
scale circulation in transporting the moist plains air up to
the foothills region. The most intense mul ticell storms
were formed in the foothills and moved eastward along the
,) axis of this moisture ridge where dew point temperatures
(47)
exceeded 12 0 C.
since the mountain-plain circulation and the synoptic
scale northeasterly flow both transported high-dew point air
to the foothills, it is useful to examine the interactions
between these two branches of the moisture transport. We
note that the upslope flow induced by the mountain-plain
circulation began in the morning over the foothills and
moved northeastward during the day as the horizontal extent
of the solenoid increased. concurrently, the northeasterly
flow caused by the synoptic circulation began over eastern
Alberta and moved southwestward as ridging occurred in
eastern Alberta. Bafore 12 LOT, cooling aloft modified the
upper-level stratification over the foothills 50 as to
( accelerate the destabilization already occurring there as a
result of surface heating. The now amplified mountain-plain
~1T ~4 ...
circulation initiated moisture convergence over the
foothills by transporting moisture up from the western
plains. However, it was not untii approximately 14 LDT,
when the northeasterly synoptic surface flow had succeeded
in advecting the moist air of the eastern plains into the
Iower branch of the mountain-plain circulation, that the
moisture convergence triggered deep convection. Thus the
picture that emerges is one of the mountain-plain
circulation becoming an effective trigger mechanism upon the
arrivaI of moist air from the eastern plains. The
interactions between the mesoscale and synoptic-scaie
motions are therefore crucial for severe convective outbreak
(48)
on this day.
3.6 Vertical profiles of the horizolltal IVllld
As discussed in Chapter 1, large vertical shear of the
horizontal wind is thought to aid in the organization of
long-lived severe convective storms. In this section, we
will examine the evolution of vertical wind shear on 11 July
1985 through profiles of the horizontal wind at one
representative station in the LIMEX network. Often,
conditions of large shear are associated with strong upper-
level winds and jet streaks. The questions of whether an
upper-level jet streak was present on this day and its role
in the initiation of convection will also be addressed.
Figure 29a shows the time-height cross section of the
winds at ARM. The southwesterly winds were strong in the
upper-levels and a clockwise turning of the wind vector with
time is evident below 650 mb, as the mountain-plain
circulation developed. The strong upper-level flow in
combinat ion with the northeasterly upslope flow created
conditions of strong vertical wind shear in central Alberta
by 14 LOT. The 850-500 mb shear increased from 5.1X10⁻³ s-l
at 12 LOT to 6.2X10⁻³ s-l at 14 LOT. Figure 29b presents
the time anomaly wind profiles (see section 3.4 for
definition) . The most significant variation took place
between 12 and 14 LOT, when a sharp transition from
anomalous downslope to upslope flow occurred. Between 650
(49)
and 450 mb the shift was from anomalous easterly-component
flow to westerly-component flow. The anomalous low-level
easterly-component and upper-Ievel westerly-component of the
winds persisted through 18 LOT.
As pointed out in section 3.3.2, the 500 mb operational
analysis for 18 LOT on Il July 1985 (Fig. 6b) shows the
presence of strong upper-Ievel winds with speeds of 25 ms-1
over central Alberta. A mesoscale isotach analysis at 18
LOT (not shawn) indicated a wind maximum of 28 ms-1 near
ARM, suggesting that the severe convection of Il July 1985
may have formed on the north side of a migrating jet streak.
However, this maximum was present only in the 18 LOT isotach
analysis, and it is difficult to determine whether it
represents a true jet-streak, a propagating gravit y wave, or
simply the result of an instrument error. Because of this
uncertainty, it is not possible to determine whether the
reg ion j ust to the north of the LIMEX gr id, where the
strongest multicell storms formed, was located beneath
either the left-front exit or right-rear entrance regions of
a jet streak.
We also have attempted Carlson et. al's (1983) method of
indirectly identifying the presence of a migrating upper-
level jet streak from surface pressure tendencies. Our
subjectively analyzed 2 hour surface pressure and
temperature tendency fields are depicted in Figs. 30 and
31. First, one notes the absence of any well-defined,
~f migrating couplet such as that shown in Fig. 6 of Carlson
""
1
".
(50)
et. al (1983). Secondly, our synoptic-scale pressure
tendencies were, to a large extent, the result of low-level
thermal forcing. Most notably, the strong falls along the
British Columbia-Alberta border at 10 and 12 LDT were aided
by surface heating in the elevated topography, and the same
applied to the region of maximum falls over southcrn
Alberta. Thus it appears that if an upper-level jet streak
were present on 11 July 1985, it had little or no effect on
the surface pressure tendencies and did not induce
underrunning in the manner put forth by Carlson et al.
(1983).
The analyses presented above indicate that although the
passage of an upper-level jet streak is probable over
central Alberta on 11 July 1985, it did not exert a
significant influence on the triggering of severe
convection. The importance of the jet-streak (or simply
the strong southwesterly flow aloft) rests mainly in
providing an environment of strong vertical wind shear into
which the nascent hailstorms eventually developed.
3.7 Summary
We have found that the formation of severe convection
over the Alberta foothills on 11 July 1985 can be attri~uted
to a very specifie interaction between the dynamically
determined synoptic-scale flow pattern and the thermally
induced rnountain-plain circulation. The occurrence of
(51)
upper-Ievel cooling associated with an advancing synoptic
scale trough, in phase with maximum surface heating over the
foothills led to the amplification of the mountain-plain
circulation. Simultaneously, the synoptic-scale surface
pressure gradient created by a high in nortp~~n Alberta and
an intensifying low in southern Alberta produced
northeasterly flow over the plains which 1) reinforced the
thermally-induced upslope flow and 2) transported moist air
from eastern Alberta up to the foothills leading to a
further destabilization and amplification of the mountain
plain circulation. The existence of the strong upper-level
winds, although not directly responsible for triggering
convection, resulted in large vertical wind shear in the
( pre-storm environrnent.
(
(52)
4. TWO CASE STUDIES OF NON-SEVERE CONVECTION
- 09 AND 17 JULY 1985
4.1 Introduction
In the previous chapter, it was shown that the mountain-
plain and synoptic circulations interacted constructi vely
leading to the outbreak of severe convection over Alberta on
11 July, 1985. To affirm our findings, it is essential to
establish that such interactions were either absent or
suppressed on a non-severe day. Furthermore, there remains
the need to determine the relative importance of the meso
and synoptic scales of motion. To this end, we present in
this chapter the results from two non-severe case days
during LIMEX-85.
An examination of the LIMEX dataset reveals that the non-
severe days were marked by two upper-Ievel flow patterns.
The first is the upstream trough pattern similar to that on
11 July. The other i~ an upstream ridge pattern. We shall
present here the analyses on 09 and 17 July when an upstream
ridge and trough pattern occurred respectively. We shall
aiso summarize the results from other case days in the next
chapter.
1
(53)
4.2 The 09 July case day - weak, localized convection
The clear sky conditions which existed during the rnorning
provided approximately the sarne amount of surface heating
(i.e. sarne surface temperature tendencies) 8 over the
foothills as was present on 11 July 19859 . Since it is this
heating which drives the mountain-plain circulation,
differences in the evolution of solenoid on these two days
must be attributed to other factors (e.g. the stability of
the ambient atmosphere). Because of the absence of deep
convection, sounding releases at LMW, AYC, AEL, ACR, and AML
were cancelled after 10 LOT. One additional sounding was
released at ARM, AQF, and ARL at 12 LOT. The 00 UTC (18
i LOT) operational sounding at Stony Plain (WSE) was the only
afternoon upper-air data available. We perforrned rnesoscale
upper-air analyses at 08 and 10 LOT and surface analysis for
03, 10 and 12 LOT. ~s was done for 11 July 1985, synoptic-
scale surface fields were analyzed at 08, 12, and 18 LDT.
8surface temperature advection was weak on both 09 and 11 July 1985. Therefore, similar surface temperature tendencies during the morning implies similar surface heating rates.
9Morn ing cloud shading over the LIMEX area on 08 July 1985 reduced surface heating.
1
--- ------------------
(54)
Despite the fact that mesoscale upper-Ievel observations at
later times were not available, our results still permit a
comparison of the morning evolution of the rnountain-plain
circulation on a weakly convective and a severely
convecti ve day.
4.2.1 Operational, 500 mb analysis
A sharp 500 mb height ridge with an axis lying along the
British Columbia-Alberta border was a conspicuous feature on
09 .July 1985 (Fig. 32). The associated subsidence warming
caused clear sky conditions over central Alberta where the
northwesterly upper-levei flow was moderately strong. The
l temperatures in the ridge were quite warm (-10 Oc at 500 mb
over Edmonton). The ridge moved eastward and weakened
during the ~ollowing 24 hours (see Fig. 6a).
4.2.2 Hesoscale analysis
similar to the case of 11 July 1985, surface heating was
responsible for a large part of the morning reduction in the
capping lid strength over the foothilis and the plains.
From 08 to 10 LOT, significant lid reduction had occurred
near LMW and AEL (Fig. 33), which were situated over the
regions of maximum surface temperatu~e tendency (Fig. 34a).
The effect of surface heating is also reflected in a large
1 increase in the depth of the adiabatic boundary layer (Figs
(55 )
34b and 34c) and by the existence of local maxima of surface
pressure faiis over the two stations (Fig 35a).
The distribution of moisture variables is qualitatively
similar to the severe day. However 1 the morning dew point
temperatures (Fig. 35b) show slightly higher values over the
foothills and slightly lower values over the plains (compare
with Fig. lOb). The surface moisture divergence field (Fig.
35c), associated with downslope flow over most of the grid,
indicates smaller local mimimum and maximum values bec au se
of the weaker dew point and moisture gradients invol ved.
The degree of destabilization from 08 to 10 LOT, signified
by the energy tendency below 300 mb, was of the same order
of magnitude on 09 and 11 July (Figs. 36a and 11b). 'l'he
:1 inference is that during this period, destabilization was
primarily the result of strong surface heating. However,
the synoptic environment was more stable on the 9th because
of the presence of the upper level ridge. As a result, the
net LPE below 300 mb at 10 LOT was much more negative on the
9 th (Fig. 36b) than on the l1th (Fig. 36c) except in the
reg ion around LMW.
By 18 UTe (12 LOT), the distribution of surface
temperature tendency was quite uniform over the LIMEX
domain (Fig. 37a), while pressure falls were still maximized
over the higher topography (Fig. 37b). Northeasterly
upslope flow had developed west of the line joining ACR and
AML. The dew point temperatures in this region are higher
C than those at 10 LDT and a considerable amount of moisture
.,
(56)
convergence is indicated (Figs. 38a and 38b). To the east
of this line, the surface winds are still characterized by
a significant downslope component, resulting in a divergence
of moisture.
Warming at the upper levels from the approaching ridge was
evident from 10 to 12 LOT. Ouring this period, the 500 mb
temperature rose by 0.2 Oc at both ARM and AQF (the sounding
from ARL did not reach 500 lllb). The corresponding changes
over ARM and AQF ° on 11 July 1985 were a 1.1 C drop and a
0.6 Oc drop respectively. The operational soundings at stony
Plain on the 9th exhibited a substantial warming of 3.2 Oc
at 500 mb from 06 to 18 LOT, which differs dramatically from
the 3.0 Oc cooling observed on 11 July 1985.
4.2.3 Synoptic-scale surface analysis
The distribution of surface temperature was qualitatively
similar on 09 and 11 July. At 14 UTe (08 LOT), the coldest
surface temperatures were observed over the h igher
topography and in northeastern Alberta (Figs. 39a and 25b).
A band of warmer air ran northwest-southeast across the
province. At 12 LOT, the 26 Oc isotherm on the 9th over the
LIMEX area was slightly north of its position on the 11th .
(Figs. 39b and 26b). In the afternoon, the surface
temperatures climbed above 32 0 C in southeastern Alberta
(Fig. 39c) . Intense insolation along the foothills
northwest of the LIMEX area had forced the temperatures
l
(57)
above 30° C. The time evolution of surface temperatures
confirm that the pattern and magnitude of surface heating
before 12 LOT did not differ significantly on these two case
days.
In response to the upper-Ievel ridge, the MSL pressure
field on 09 July exhibited considerably different
characteristics from those on the severe case day. While a
northern high and a southern low dominated the pressure
pattern on the latter day (Figs. 25a, 26a, and 27a), a
central high pressure center or ridge, and two low centers
located to the north and southeast of the high were the main
features on 09 July (Fig. 40).
The distribution of surface pressure exerts a controlling
1 influence on the surface air flow. Locally within the LIMEX
area, thermally-induced upslope flow developed from 08 to 18
LOT on 09 July (Fig. 40). However, east of the LIMEX
domain, 't:he surface wind was directed away from the
foothills rather than toward it as was the case at 12 and 18
LOT on 11 ~uly (compare with Figs. 26a and 27a).
An important effect of the surface air flow lies in the
transport of moisture to or away from the LIMEX area. At 08
LOT on both days, the highest dew points were found in east
central Alberta to the north-northeast of the LIMEX area
(F igs. 41a and 2 Sc) . Al though the dew points cont inued to
increase at 12 LOT over central Alberta (Figs. 41b and
26c), the influence of the surface air flow east of the
,1 LIMEX area away from the foothills on 09 July was beginning
l
(58)
to take effect. The dew points within the LIMEX area were
about 2 Oc lower on the non-severe day.
At 18 LDT, the dew point temperatures over most of Alberta
were significantly less on 09 July (Figs. 41c and 27c).
Of greatest importance was the drying that occurred to the
north of the LIMEX area. Here the northwesterly surface
flow had s~ept the moist plains air eastward. Consistent
with this drying, the infrared satellite image at 21:06 LOT
shows that the atrnosphere over Alberta was nearly devoid of
cloud cover (Fig. 42).
4.2.4 Vertical profiles of the horizontal wind
The tirne-height cross section of winds at ARM on 09 July
1985 illustrates a condition of moderate shear (Fig. 43).
h b -3 -1 T e 850-500 m shear at 12 LOT was 2. 9xl0 S. The
upper-level flow above 600 mb weakened after 08 LOT. winds
around 850 mb began to veer by 10 LDT, likely the result of
low-Ievel heating in the foothills.
The argument has been made that the rnountain-plain
circulation was amplified on 11 July 1985. To further
substantiate this clairn, we subtracted out the u-component
of the wind on the 9 th from that on the 11 th and display
the differences in Fig. 44. At 12 LDT, a layer of negati ve
difference extends from the surface to around 650 mb which
demonstrates a significant enhancernent of the easterly flow
on the 11th . A larger westerly component is located near
(
(
c
(59)
475 mb at both 10 and 12 LOT, indicati ve of a stronger
return flow on the severe day.
4.3 The 17 July case day - widespread, moderate convection
Both 17 and 23 July 1985 experienced a synoptic setting
similar to that of 11 July 1985 (i.e upstream 500 mb trough
and northeasterly surface synoptic flow) yet severe
convection did not occur. Because no soundings were
released on the 23rd at LMW, a critical foothills station,
the 17 th was chosen. Widespread, disorganized convective
storms formed on this day resul ting in 63 reports of hail
and a classification of moderate hail severity.
4.3.1 Operational. 500 mb ana1ysis
A short wave trough passed over central Alberta around 7
LOT (13 UTe) (Fig. 45). Ouring the morning hours, the 500
mb winds over central Alberta were southwesterly but fairly
weak at 5 to 10 ms-1 . Associated with the trough passage,
the 500 mb temperatures over stony Plain showed a drop of
1.8 Oc in 12 hr. Although the upper-Ievel flow was weaker
on this day than on 11 July, the basic flow was similar to
the upstream trough pattern associated with the occurrence
of major hail described by Langley and Thompson (1965; see
Fig. 3).
1
( 60)
4.3.2 Mesoscale analysis
Fig. 46 shows that cloudy conditions prevailed over aIl
observing stations at 08 and 10 LOT. In contrast to the 09
and 11 July case days, the capping lid strength here was
much weaker and was not subject to strong erosion over the
foothills. The corresponding analyses of bo~ndary layer
depth (Fig. 47) also do not depict strong increases. These
characteristics are related to the absence of strong surface
heating over the foothills and is illustrated by the weak
temperature tendency plotted in Fig. 48a. Consequently, the
isallobaric gradient was weak (Fig. 48b) and did not favor
the formation of thermally-induced upslope flow at 10 LOT.
Indeed, the accelerating downslope flow above ACR is
depicted by the positive, low-Ievel u-component tendencies
in Fig. 49. The actual 850 mb winds at ACR backed from (4
ms- l ,26°) at 08 LOT to (2 ms- l ,318°) at 12 LOT.
Cloud shading also weakened the destabilization over the
foothills. The LPE tendency field at 10 LOT (Fig. 50a)
shows a local maximum of 400 Jkg-12hr-1 near AML, far less
than the values of greater than 2000 Jkg-12hr-1 observed
over the foothills on 11 and 09 July (Figs. 11b and 36a).
Despite the lack of strong destabilization, LPE values over
the foothills at 10 LOT (Fig. SOb) were comparable to those
on 11 and 09 July (Figs. 36b and 36c).
The damping effect of cloud shading can be estimated by
comparing the actual LPE below 300 mb over LMW with the LPE
c
c
( 61)
that would have resulted if surface heating had taken place
under clear sky conditions. The latter quantity can be
approximated by applying the observed LPE tendency ending at
10 LOT on 09 July (+2637 Jkg-12hr-1) to the observed LPE at
08 LOT on the 17th (-894 Jkg-1). The "potential" clear sky
LPE at 10 LOT on 17 July turned out to be +1743 Jkg-1 , more
than four times the actual value of -558 Jkg-1 ! In other
words, without the reduction in surface heating due to cloud
shading, the amount of positive energy present above LMW on
17 July would have been in the range nermally associated
with high energy hailstorms (Chisholm, 1973).
By 12 LOT, cooling was occurring at 500 mb (Fig. 51a).
Near the surface, the winds were very weak and except for
those near FMH, continued to be directed downslope (Fig.
51b). Compared to the severe case day (Fig. 13a), the dew
point temperatures were fairly high ov'~r the foothills, and
the cloud and weather observations point to the existence of
thunderstorms. However, the widespread, disorganized echo
structure shown in the radar PPI at 15 LOT (Fig. 52)
indicates that these thunderstorms were net severe.
4.3.3 Synoptic-scale surface analysis
As on 11 July 1985, the MSL pressure pattern at 18 UTe
(12 LOT) (Fig. 53) exhibited a high and a low located
respecti vely over northwestern and southern Alberta. The
resul ting synoptic pressure gradient allowed for the
1
(62)
development, later in the morning,
over the eastern plains. Wi thout
of northeasterly flow
the thermally-induced
upslope flow acting in the same direction, however, this
northeasterly flow did not initiate severe convection.
4.3.4 Vertical profiles of the horizontal wind
Figure 54 shows the absence of low-Ievel upslope flow and
weak winds aloft at ARM. The 850-500 mb shear was small
with a value of 1.3X10⁻³ s-l at 12 LDT. The condition of
weak vertical shear is consistent with the disorganized
character of the convective storms depicted in Fig. 52.
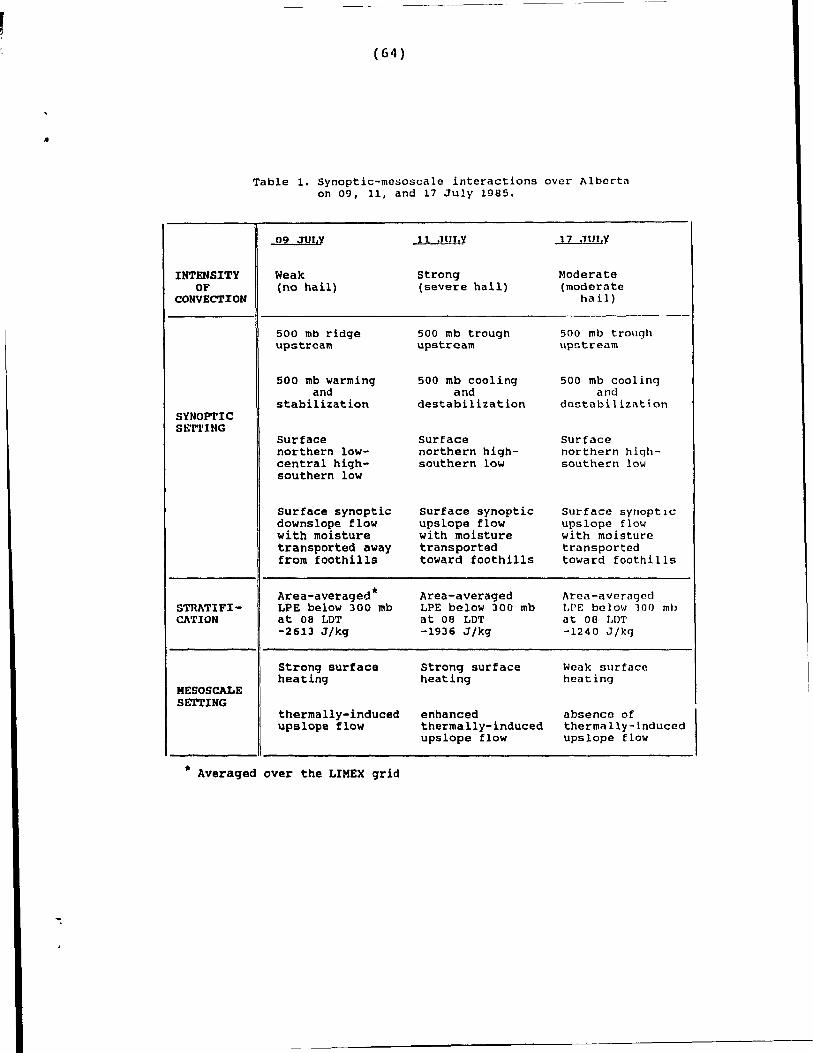
l 4.4 Discussion
To surnmarize our findings concerning the synoptic
mesoscale interactions over Alberta, we list in Table 1 the
important physical parameters on 09, 11, and 17 July 1985.
The 09 July analysis establishes the importance of the
synoptic circulation in the initiation of severe convective
outbreaks. By the time thermally-induced upslope flow had
been established to the east of the foothills, northwesterly
flow over the plains arising from the synoptic-scale
pressure gradient had transported the plains moisture to the
east. The desiccated lower-branch of the mountain-plain
circulation was therefore unable to trigger moist convection
in the foothills through underrunning. Northwesterly upper-
(63)
( level winds in combination with unamplified upslope flow
yielded an environment of weak shear.
The 17 July analysis establishes the importance of the
mountain-plain circulation in the initiation of severe
convective outbreaks. The upstream trough aloft and the
northeasterly flow at the surface provided the synoptic
environment conducive for the formation of severe
convection. However, the suppression of the mountain-
plain circulation by early cloud cover resulted in weak
destabilization over the foothills and disorganized
convecti ve storms. The exact cause of the early cloud
cover is difficult to determine. The axis of the 500 mb
;leight trough was closer to the foothills on 17 July than on
( 11 July 1985. Consequently, by the morning of the 17th ,
synoptic-scale ascent may have already weakened the capping
lid and destabilized the atmosphere to the point where
(
convection was easily realized. In this sense, the
improper phasing of dynamic forcing with diurnal heating may
increase the horizontal extent of convection, yet lessen its
severity.
In general, our results are consistent with Doswell's
(1987) proposal that convective systems depend primarily on
large-scale processes for deveLoping a suitable
thermodynamic structure, while mesoscale processes act
mainly to Initiate convection.
r
INTENSITY OF
CONVECTION
SYNOPTIC SE'l"l'ING
STRl\TIFICA'flON
MESOSCALE SETTING
(64)
Table 1. synoptic-mesoscale interactions over Alberta on 09, 11, and 17 July 1985.
09 JUI,Y
Weak (no hail)
500 mb ridge upstream
500 mb warming and
stabilization
Surface northern lowcentral highsouthern low
Surface synoptic downslope flow with moisture transported away from foothills
Area-averaged* LPE below 300 mb at 08 LOT -2613 J/kg
Strong surface heating
thermally-induced upslope flow
11 .ml.Y
strong (severe hail)
500 mb trough upstream
500 mb cooling and
destabi 1 bat ion
Surface northern highsouthern 10w
Surface synoptic upslope flow with moisture transported toward foothills
Area-averaged LPE below 300 mb at 08 LOT -1936 J/kg
strong surface heating
enhanced thermally-induced upslope flow
17 .1UJ.tY
Moderate (moderate
hail)
500 mb trough upstream
500 mb cooling and
destabi lizat ion
Surface northern hiqhsouthern 10111
Surface synoptlc upslope flolll with moisture transported toward foothills
J\raa-averagec! 1,PE balow 100 mb at 00 LDT -1240 J/kg
Waak surfl1ce heating
absence of thermally-lnduced upslope flow
* Averaqed over the LIHEX qrid
(65 )
5. A COMPARISON OF LIMEX-85 CASE DAYS
5.1 Introduction
A brief comparison of the LIMEX-85 days is used in this
chapter to provide additional evidence for the interaction
between the mountain-plain and synoptic circulations in
initiating and determining the severity of convection. As
was done for 09, 11, and 17 July 1985, detailed analyses
were prepared for the other eight case days. For reason of
econorny, the y will not be shown. Instead, we present a
short description of the synoptic and mesoscale environments
and indicate how they were related to the observed
convection.
5.2 Comparison of LIHEX-85 days
5.2.1 July 08, 1985
The case day of 08 July 1985 was the first of three days
preceding the severe convective outbreak on the llth • A 500
mb ridge which formed along the west coast of North America
on 06 July 1985 was beginning its eastward migration across
Alberta. Winds at 500 mb were northwesterly ahead of the
ridge. During the morning hours, surface heating occurred
( over the foothills, although somewhat weakened by early
i'
l
(66)
cloud shading. Warming was taking place at 500 mb.
Weak thermally-induced upslope flow developed over the
LIMEX area. The MSL synoptic pressure pattern over central
Alberta was dominated by a high pressure center. Surface
winds resulting from this pattern had a westerly component
which transported surface moisture away from the foothills.
These factors combined to keep LPE small and to limit
convection to CU and TCU.
5.2.2 July 09, 1985 (see Ghnpter 4)
The 500 rob ridge of 08 July continued to move further
into Alberta on this day. Upper-level flow was still
northwesterly. Warroing at the surface and at 500 mb again
took place over the foothills during the morning hours.
Diurnal upslope flow formed later in the afternoon to the
east of the foothills. The pressure gradient arising from a
low pressure center in northern Alberta and a high in
central Alberta caused northwesterly flow which kept the
moist plains air away form the foothills.
this day was limited to cù.
5.2.3 July 10, 1985
Convection on
The axis of the 500 mb ridge, upstream on the previous
two days, passed over central Alberta late on this day" and
the 500 rob winds backed to a southwesterly direction. The
(67)
situation over the foothills during the morning continued
to be one of warming at both 500 mb and the surface.
Thermally-induced upslope winds were quickly replaced by
downsiope winds caused by surface outfiow from sorne weak
single cell storms which formed over the foothills.
Significant low-levei moisture and warm surface temperatures
present over the LIMEX grid in the morning produced
substantial LPE. However, the downslope winds, aided by
westerly gradient flow, swept the moisture to the east and
quickly reduced LPE over the foothills. The single cell
storms produced sorne hail which resulted in 6 hail reports.
5.2.4 Ju1y 11, 1985 (see Chapter 3)
with the approach the 500 mb trough, the atmosphere above
the foothills was subject to cooling aloft and strong
heating near the surface during the morning. This localized
destabilization produced an amplified mountain-plain
circulation which was further enhanced by moist
northeasterly synoptic flow over the plains. A severe
convective outbreak, in the forrn of well-organized multicell
storrns, caused widespread large hail which was reflected in
the large number of hail reports (228) recorded on this day.
5.2.5 Ju1y 12.1985
The 500 mb trough, upstream on 11 July, passed over
l central Alberta late on
convection of the 11 th,
neutral and quite moist.
(68)
this day. Owing to the deep
the atmosphere was convectively
Despite substantial cooling at
500 mb, widespread cloud cover and stratiform precipitation
present in the morning suppressed the mountain-plain
circulation by reducing the surface heating and LPE in the
foothills. Surface synoptic flow was northwesterly over the
plains. The lifting generated by the passage of the upper-
level trough occurring under the convectively neutral
conditions caused the development of sorne strong single
cell storms. These storms, which were embedded within the
stratiform precipitation, were responsible for 72 reports of
hail.
5.2.6 July 15, 1985
This day marked the beginning of the passage of a second
upper-Ievel ridge-trough system over central Alberta during
LIMEX-85. A 500 mb ridge situated upstream produced warming
aloft and westerly 500 mb flow over the foothills.
(TRA) , upstream thickness trough (UTT), and upstream
thickness ridge (UTR». Each day was tagged with a
pa~ticular hail severity and 500 mb height and 1000-500 rnb
thickness pattern, determined subjectively from archived
operational analyses (1981-1985) . Of the 259 days
10The word aloft, in this instance, signifies directly above central Alberta.
J
l
J
(95 )
considered, 16 were classified as SH, 39 as MH, 123 as LH
and 81 as NH. In total 140 were tagged UH'r and 122 UHR.
ThE: breakdown for TTA, TRA, UTT, and UTR was 43, 122, 46,
and 48, respectively. The large number of TRA days is mast
likely due to s ::rong surface heating present over Alberta
during the summer months which often builds and maintains a
thickness ridge. We first correlated the six: synoptic
patterns with the four severities separately. For the
purpose af comparing with our conceptual model, we present
only the results for severe hail. The first six entries in
Table 10 are the correlation coefficients and 95 %
confidence intervals.
l
------- -----------------
( 96)
Table 10. Correlation coefficients for a given 500 rnb height and/or 1000-500 rnb thickness pattern and severe hail. See text for height/ thickness pattern abbreviation definitions.
HEIGHT/ CORRELATION COEFFICIENT THICKNESS AND 95 % CONFIDENCE INTERVAL PA'l'TERN
UTT 0.84 [0.73, 0.91 ]
U'J'R -0.53 [-0.71, 0.28 ]
TTA -0.68 [-0.82, -0.48 ]
TRA 0.18 [0.00, 0.34 ]
UHT 0.49 [0.36, 0.61 ]
UHR -0.49 [-0.62, -0.34 ]
UHT/UTT 0.92 [0.85, 0.95 ]
UHT/UTR 0.63 [0.00, 0.91]
UHT/TTA -0.56 [-0.78, -0.22 ]
UHT/TRA 0.00 [-0.29, 0.18]
i
1
(97 )
We remark that thp. upstream thickness trough (UTT) is
more strongly co.crelated to the occurrence of severe hail
than the upstream height trough (UHT; 0.84 compared ta
0.49). During the surnrner in Alberta, temperature advection
in the lower troposphere is generally weak so that the
passage of a 1000-500 mb thickness trough is usually
indicative of cooling at 500 mb. A thickness trough
upstream of central Alberta usually places the foothills
beneath the region of steepest thickness gradient or,
assuming the normal eastward migration of troughs, the
region of strongest upper-level cooling. Therefore, the
large correlation coefficient for UTT lends support to our
hypothesis for the need for upper-level cooling on days of
severe convection. The 0.49 correlation for UHT points out
that while an upstream height trough is a feature common ta
most severe hail days,
days and probably would
convection.
i t can also be observed on other
be a poor predictor of severe
We repeated the above calculations, looking at the
correlation between a given hail severity and a particular
joint, height and thickness pattern. The last four entries
in Table 10 are the results for severe hail and the
upstream height trough (UHT). A correlation coefficient of
0.92 for (UHT/UTT) indicates that while an upstream height
trough alone is only moderately correlated with severe hail,
when accompanied by an upstream thickness trough it is
highly correlated (li ttle conf idence can be placed in a
correlation
sample size
(98 )
coefficient of
was too small).
0.63 for UHT/UTR because
It would seem that if
the
the
passage of the upper-level height trough over Alberta is not
in phase with the passage of the upper-level thermal trough
a severe convective outbreak is unlikely. This is
consistent with Longley and Thompson's (1965) mean 500 mb
map for major hail days (Fig. 3) and with our conceptual
model.
r
i
(99)
8. CONCLUSIONS
8 1 Summary and conclusIons
In this dissertation, we have set out ta understand the
interactions between the mountain-plain and synoptic-scale
circulations on days when severe convection is initiated
over central Alberta. We f irst presented three deta iled
case day analyses for th~ LIMEX-85 mesoscale field
experiment. On 11 JUly 1985, the mountain-plain and
synoptic circulations acted in concert to trigger a severe
convective outbreak. On 09 July 1985, the mountain-plain
circulation was opposed by the synoptic circulation and
weak, localized convection resulted. Finally, on 17 July
1985, the mountain-plain circulation was suppressed by
early cloud cover, and the synoptic circulation alone
produced only widespread, non-severe convection. We next
made a brief cornparison of aIl 11 of the LIMEX-85 case days
and found that even though the synoptic setting was
conducive for the occurrence of severe convection on 11, 17,
and 23 July 1985, only on 11 July did upper-level cooling
and strong surface heating over the foothills give rise to
an amplified mountain-plain circulation which effectuated
underrunning of the capping lido
Based on these results we proposed a two stage conceptual
model of severe convective outbreaks in Alberta. stage 1
describes the upstrearn 500 mb height ridge situation of the
( 100)
day (s) preceding the outbreak event, while stage 2 covers
the upstrea'll trough situation of the severe day itself.
Addi tional evidence for the conceptual model was furnished
by a statistical analysis which related the synoptic-scale
circulation to the severity of hail.
The principal conclusions from our stuùy are:
1) Under generally clear sky conditions, cumulus convection
begins over the Alberta foothills, where the capping lid is
quickly eroded by strong surface heat;~g.
2) Most severe convective outbreaks would appear to occur
when cooling aloft, associated with an approaching synoptic-
l' scale, upper-level trough is in phase with strong surface '.il
heating over the foothills. The surface syncptic pressure
gradient provides for east-northeasterly winds over the
plains which transport moist plains air towards the
foothi Ils and into the lower-branch of the mountain-plain
circulation. Such a configuration brinqs about localized,
deep destabilization which gives rise to an arnplified
mountain-plain circulation and underrunning of the capping
lido
3) The mountain-plain circulation is ineffecti ve in
initiating severe convection when subsidence warming
associated with an upstream ridge inhibits its growth, and
the surface synoptic pressure gradient provides for
•
ï
(101 )
northwesterly, westerly or southwesterly winds over the
plains. Under these conditions, the plains moisture is
advected away from the foothills, 50 that by the time the
thermally-induced upslope flow has developed, its moisture
content has been depleted to the point of being unable of
supporting severe convection.
In regard to improved preùiction of severe convective
outbreaks, it would seem that as early as 12 UTC (6 LOT) t
the presence of an upstream 500 mb height and thermal trough
wi th southwesterly winds ?: 10 ms- 1 and east-northeasterly
surface gradient wind direction should alert the aperational
forecaster to the potential for a severe convective outbreak
in central Alberta. In arder to determine the time and
location of convective triggering through underrunning, the
surface dew point temperature and wind fields could be
moni tored for the presence of a capped moisture tangue
approaching the foothills.
•
(102)
..r 8 2 Sug[jestlOTlS for future research
Our conceptual model of severe convective outbreaks
represents a signif icant f irst step towards understanding
how the mesoscale and synoptic-scale processes interact to
initiate severe convection in Alberta. It also provides an
excellent observational study to which numerical modeling
simulation3 may be compared. Three-dimensional simulations
using either a hydrostatic or non-hydrostatic primitive
equations model with realistic topography could be used to
investigate the breakdown of the capping lid and the effects
of upper-level temperature tendency, low-Ievel moisture
divergence, cloud cover, and wind shear on the development
of the mountain-plain circulation.
There are several outstanding questions concerning severe
convection in Alberta that are beyond the scope of this
dissertation. One of the most important of these is what is
the principle moisture source for convection in Alberta?
Figure 58, which displays contours of climatological (1951 -
1980) mean maximum daily dew point temperature for July,
suggests that a tongue of modified maritime tropical air
which enters the prairie provinces in southern Manitoba and
extends westward into east-central Alberta is the most
likely source. However, McKay and Lowe (1960) believed that
an important fraction of the low-level moisture must
originate from evapotranspiration. Potential moisture
l sources for evapotranspiration include lakes, marshes, river
valleys, foothills
possible method to
(103 )
forests
identify
and irrigated
source reg ions
fields.
for the
une
long
range transport of moisture into Alberta wou Id be to carry
out insentropic trajectory analysis (e.g. Carlson and Ludlum
(1968» for each of the LIMEX-85 days. The contribution of
evapotranspiration to the total moisture content of the low
level air in Alberta could be quantified by comparing field
measurements of evaporation with values resulting from
numerical model simulations.
Another related subject worthy of further investigation
concerns the frequent occurrence of low pressure centers in
southern Alberta during the summer. We note that the low on
the weakly convective day (09 July 1985) actually had a
stronger rate of deepening (5 mb/10 hour) than a s imi lar
southern low on the severe day (11 July 1985; 3.5 mb/IO
hour) . It is of interest to determ:ne the rel~tive
contribution of quasi-geostrophjc processes and diabatic
processes te the deepening of such lows. Another connected
question is how are these Alberta lows, whose diameters are
often less than 200 km and whose cores are warm, related to
the type of warm-core mesovortex studied by Menard and
Fritsch (1989)? High resolution numerical simulations of
LIMEX-85 days such as those performed by Zhang and Fritsch
(1988) could provide sorne answers to these questions.
The Alberta rnountain-plain circulation is another example
of a wide class of mesoscale solenoidal circulations that,
increasingly, appear to play a fundamenta l role in the
\..
(104)
initiatiorl of severe c\onvection (see Schaefer, 1987). For
Alberta, we have identified upper-level cooling associated
wi th a synoptic-scale trough as a key factor in perrni tting
such a circulation to arnplify. It is of interest to know
if su ch cooling is also operating in other areas (e. g. the
rnidwest region of the United states) where differential
surface heating and a favorabl~ surface synoptic circulation
induce underrunning and the subsequent triggering of severe
convection. Such knowledge is vital in deterrnining the best
utilization of current and future observing systems for the
forecast of severe weather.
ï
. f
J.
AQF ARM AYC LMW ABP ACR AEL AML ARL WSE YEG WBA FMH FGH FBH FBL FBK FCW JRB AEV AGL APC ARF ASU ATP AWV ACH LMR
(105)
APPENDIX l
station Identifiers
Red Deer Rocky Mountain House Calgary (University of Calgary) Limestone Mountain West Bow Pass Caroline Elkton Mountainaire Lodge Ram Lookout East Stony Plain Edmonton International Banff Mockingbird Hill Ghost Blue hill Baseline Burnstick Clearwater James River Bridge Evergreen Glennifer Lake prairie Creek Ram Falls Sundre West Tee-Pee Pole Creek Water Valley Cheddarville Limestone Mountain Ridge
Barnes, S.L., 1973: Mesoscale objective analysis using weighted time-series observations. 60 pp. NTIS Rep. No. COM-73-10781, National Techniçal Information Service, springfield, VA.
---, and C.W. Newton, 1986: Thunderstorms in their synoptic setting. Thunderstorm Morphology a/ld Dynamics. 2nd EdItion. Univ. of Oklahoma Press, 75-112.
Beebe, R.G., and F.C. Bates, 1955: A mechanism for assisting in the release of convective instability.
Mon. Wea.Rev., 83, 1-10.
Bluestein, H.B., and M.H. Jain, 1985: Formation of mesoscale lines of precipitation: Severe squall lines in Oklahoma during the spring. Mon. Wea. Rev., 42, 1711-1732.
Browning, K.A., 1986: Morphology and classification of middle-latitude thunderstorms. Thunderstorm Morphology and Dynamics. 2nd Edition. Univ. of Oklahoma Press, 133-152.
Bullas, J.M., and A.F. Wallace, tfi88: The Edmonton tornade, July 31, 1987. Preprints 15 Conf. on Severe LOCJl
Storms, Baltimore, Amer. Meteor. Soc., 437-443.
Carlson, T.N., and ~.H. Ludlam, 1968: Conditions fer the occurrence of severe local storms. TeIIus, 20, 203-226.
____ , S.G. Benjamin, G.S. Forbes, and Y.-F. Li, 1983: Elevated mixed layers in the regional severe storm environment: Conceptual model and case studies. Mon. Wea. Rev., 111, 1453-1473.
Chisholm, A.J., 1973: Alberta hailstorms. Part I: Radar case studies and airflow models. Amer. Heteor. Soc. Meteoroi. Monogr. No. 36, 1-36.
___ , and J.H. Renick, 1972: 'l'he kinematics of multicell and supercell Alberta hailstorms. Hail Studies Report 72-2, Alberta Research council, 24-31. [Available from Alberta Research council, Edmonton, Alberta, T6H 5X2.]
Darkow, G.L., 1986: Basic thunderstorm energetics and thermodynamics. Thunderstorm Morphology and Dynamlcs. 2 nd EdItIon. Univ. of Oklahoma Press, 59-73.
l
..
(108)
Doswell, C.A., III, 1980: Synoptic-scale environrnents as~ociated with High Plains severe thunderstorms. Bull. Amer. Meteor. Soc., 61, 1388-1400.
, 1987: The distinction between large scale and ------rnesoscale contribution to severe convection: A
case study exarnple. Wea Forecasting, 2, 3-16.
Fankhauser, J.C., 1971: Thunderstorm-environrnent interactions determined from aircraft and radar observations. Mon. Wea. Rev., 99, 171-192.
Farrel, R.J., and T.N. carlson, 1989: Evidence for the role of the lid in an outbreak of tornadic thunderstorms. Mon. Wea. Rev., 117, 857-871.
Fawbush, W.J., and R.C. Miller, 1952: A mean sounding representative of the tornadic air mass environment. Bull. Amer Meteor Soc., 33,303-307.
----- , , and L.G. starrett, 1951: An ernpirical method of forecasting tornado development. Bull. Amer. Meteor. Soc., 32, 1-9.
Fujita, T.T., 1981: Tornadoes and downbursts in the context of generalized planetary scales. J. Atmos. Sei., 38, 1511-1534.
Fulks, J.R., 1951: The instability line. Compendium of Heteorology. T.P. Malone, Ed., Amer. Meteor. Soc., 647-652.
Longley, R.W., 1968: The diurnal variation of wind direction at Calgary. Atmosph., 6, 23-38.
----- , 1969: Further comments on the diurnal variation of wind direction at Calgary. Atmosph., 7, 1-36
_____ , and C.E. Thompson, 1965: A study of the causes of hail. J. Appl. Meteor., 4, 69-82.
Miller, R.C., 1972: Notes on analysis and severe-storm forecasting procedures of the Air Force Global Weather Central. Tech. Report 200 (Rev.), Air Weather Service (MAC), Offutt Air Force Base, Nebraska.
Modahl, A.C., 1979: Low-Ievel wind and moisture variations preceding and following hailstorrns in Northeast Colorado. Mon. Wea. Rev., 107, 442-450.
( 109)
Newton, C.W., 1963: Dynamics of severe convective storms. Amer. Meteor Soc NetE'orol NOllogr No. 27, 33-58.
Newark, M.J., 1984: Canadian tornadoes, 1950-1979. Atmos.-Ocean, 22, 343-353.
Ninomiya, K., 1971: Mesoscale modification of synoptic situations from thunderstorm development as revealed by ATS III and aerological data. J. Appl. Meteorol , 10, 1103-1121.
Reinelt, E.R., 1970: On the variation of the 500 mb wind and its effect on the release of instability in the lee of the Alberta Rockies. Acmosph , 8, 119-127.
Sangster, W.E. 1987: An improved technique for computing the horizontal pressure-gradient force at the Earth's surface. Mon. Wea. Rev., 115, 1358-1369.
Schaefer, J.T., 1987: Severe thunderstorm forecasting: A historical perspective. Wea. Forecastlng, 1, 164-189.
---, and L.R. Hoxit, and C.F. Chappell, 1986: Thunderstorms and their mesoscale environment. Thunderstorm Morphology and Dynamlcs, 2 nd Edltloll,
Univ. of Oklahoma Press, 113-131.
Smith, S.B., 1986: The mesoscale effect of topography on the genesis of Alberta hailstorms. M.Sc. thesis, Dept. of Meteorology, McGill University, Montreal, Quebec, H3A 2K6, 180 pp.
_____ , and M.K. Yau, 1987: The rnesoscale effect of topography on the genesis of Alberta hailstorms. Beltr. Phys. Atmos., 60, 371-392.
Stackpole, J.O., 1967; Numerical analysis of atmospheric soundings. J. Appl. Meteor., 6, 464-467.
strong, G.S., 1986: Synoptic ta mesoscale dynamics of severe thunderstorm environments: A diagnostic study with forecasting applications. Ph.D. thesis, Dept. of Geography, University of Alberta, Edmonton, Alberta, T6G 2H4, 345 pp.
Thyer, N., 1981: Diurnal variations of upper winds in summer in Alberta. Atmos.-Ocean, 19, 337-344.
Uccellini, L.W., and D.R. Johnson, 1979: The coupling of upper and lower tropospheric jet streaks and implications for the development of severe convective storms. Mon. Wea. Rev., 107, 682-703.
Varney, B.M., 1926: Aerolagical evidence as ta the causes of tornadoes. Hon Wea. Rev , 54, 163-165.
r
( 110)
Weaver, J.F., and J.T. Toth, 1990: The use of satellite imagery and surface pressure gradient analysis modified for sloping terrain to analyze the mesoscale events preceding the severe hailstorms of 2 August 1986. Wea. Forec3stlIlg, 5, 279-298.
Weisman, M.L., and J.B. Klemp, 1986: Characteristics of isolated convective storms. Mesoscale Heteorology and Forecastlng Amer. Meteor. Soc., Boston, 331-358.
Wojtiw. L., 1975: Climatic summaries of hailfall in Central Alberta (1957-73). Alberta Research Council, 102 pp. [Available from Alberta Research Council, Edmonton, Alberta, T6H 5X2.]
Zhang, D-L, and J.M. Fritsch, 1988: A numerical investigation of a convectively generated, inertially stable, extratropical warm-core mesovortex over land. Part I: Structure and evolution. Mon. Wea. Rev., 116, 2660-2687.
,.
(111)
D" 1 •
1 High Level 1 A
1 1
1
• HOURLIES ONLY
o SYNOPTIC ONLY
o SYNOPTIC AND PART HOURLIES
• SYNOPTIC AND 24 HOURLIES • AUTOMATIC STATION
/ UPPER AIR
"UPPER AIR ONLY
'--~', Fort Sml th A •
Fort \ McMurroy A •
\ 1
\ Lake
o IOOkm
Fig. 1: LIMEX-B5 mesoscale analysis domain (rectangle) and r~d~r coverage (circle) with respect to the AES operational observing network in Alberta. Note that Edrnonton-Stony Plain (WSE) is the only operational upper-air station in the province.
Fig. 2: Temperature and dew point sounding plotted on il tephigram. A capping lid (defined, as shown, by ôe which is the difference between the potential temperature of the convective condensation level and that of the surface) is visible.
Fig. 3: Mean (a) 500 mb and (b) 850 rob maps, 06 LOT (12 UTC) for days with major hail. Salid Ilnes are helghts ln rneters with a contour interval of 50 and 25 neters for 500 and 850 rnb maps, respectively. Oashed lines are lsother~s wlth a contour interval of 2~C. Temperature to nearest tenth of deg:-ee platted ta the 1eft of helght ',nth blan}: space for decImal pOlnt. De·.~· pOInt tenperature ta nearest tenth of degree plotted belo~ te~Ferature on 850 rob map (fro~ Longley and Thompson, 1965).
Fig. 4: LIMEX-85 mesoscale observing network. Solid line shows location of vertical cross section described in Chapter 3.
r
1
*ARL
(115)
STATION LOCATIONS L I~lEX - 85
1 1 5°
* AR1vf
o Ltvf 1,y 52 " . - - - '-
1
0
*
*AML
FMfI 0:
OWBA
1 1 5° 1
30 km
AEL *
* QP
*AYC 51
0
1 1 -1.0
Fig. 5: Locations of LIMEX-S5 upper-air stations (*) and two surface stations (0) superirnposed on objective analysis grid.
(116)
594 A
500 mb -00002, 12 JULY (18 LOT, Il JULY 1985)
\
8 c
Fig. 6: AES operational 500 mb analyses at 18 LDT on (a) 10, (b) 11, and (c) 12 of July 1985. Height and 500-1000 rob thickness contours (decaroeters) are given by solid and da shed lines respectively. Observations are plotted following conventional upper-level station model. Note in (c) plotted station in Alberta is AQF (Red Deer) rather than WSE (Stony Plain).
r 1
l
(117)
330 LMW, Il ,JULY 1~(l5
r--r-~--'---'---'--r, -;-, - r--,.-r-r--r- -y---r- T ---,
a 325
320
~ 315 l!) w .e 310
Cl o - - 0
o
<t ~ 305 :x: 1-
300
295
Fig. 7: Time traces of 8 C and 8 SF ' on Il ,July 1985 for (;1) foothills station LMW and (br plains station ARM showing breakdoltJn of the capping lid primariIy by surface heating. Corresponding manual cloud and weather observations also plotted (see Appendix II for syrnbol definitions).
.'.:;~
CAPPING LID STRENGTH (C~~ KI 11 JUL 85 - 14 UTe (08 L)T)
1140
a
CU~XAYC
5:;:°
-<4 -'''-il If" il -'-1 1"! t-,51° - 0
114
0r--~km
... -~
CAFPING LID STRENGTH (DEG KI 11 JUL 85 - 16 UTe <10 LDT)
\ \ 4-° 0~ --33~km
b
QF
Fig. 8: Analyzed fields of capping lid strength at (a) 14 UTe (08 LOT) and (h) 16 UTC (10 LOT) for Il July 1985. Contour interval is 10 K.
Fig. 9: Analyzed fields of (a) surface wind and 2 hr temperature tendency at 16 UTC (la LDT), (b) boundary layer depth at 14 UTC (08 LDT), and (c) boundary layer de~th at 16 UTC (la LDT) for Il July 1985. Contour intervals are 1°C 2 hr- and 100 m. For surface wind vectors, l east-west grld length = 10.0 ns- l .
" CI· i ,.t. , ,. ! .. , .. ,. ~.~ \ .. \ .. ,. SI 51 SI SI ~ o \ • 0 0 ~ c
1 1 '" 3~ km
114 1 _
'" .:J km (J~~"km
Fig. 10: Analyzed fields of (a) surface wind and 2 hr pressure tendency, (b) surface wind and dew point temperature, and (c) surface moisture divergence at 16 UTC (10 LOT), 11 July 1985. Contour intervals are 0.2 rnb 2 hr-1
, 1°C, and 5Xl0-4 gkg-1s- 1. Wind vectors as in Fig. 9.
ENERGY TEND. BELOW 300 MB (J/kg/2 HR) Il JUL 85 - 16 UTC <10 LDT>
b
QF
st
2C--~krr: 114°
Fig. Il: Analyzed fields of (a) 500 mb, 2 hr teroperature tendency and (b) lifted parcel energy tendency below 300 rob at 16 UTC (10 LDT), 11 July 1985. Contour intervals are O.2°C 2 hr-1 and 100 Jkg- l 2 hr- l .
--.,...1
.-. ..... rv .....
520
CAP?ING LID STRENGTH (DEG Kl Il JUL 85 - 18 ure (12 LDT)
TCLJ HKD
1150
1.
a
QF
152°
SFC IHiJD / TE!1P. TEND <DEG C/2 HR l Il JUL 85 - 18 UTe (12 LDT)
SFC WIND / PRESS rEND (MB'2 HR) Il JUL 85 - 18 ure <:2 LDT)
0'--3;f'km 1 1 Sa 1 .40 1 1 115° 1 14° 1 1 11 SO 1 14°
o 3J km 0 3~ km
Fig. 12: Analyzed fields of (a) capping lid strength, (b) surface wind and 2 hr temperdture tendency, and (c) surface wind and 2 hr pressure tendency at 18 UTC (12 LDT), 11 July 1985. Contour intervals and wind vectors as in Figs. 8, 9, and 10.
Fig. 13: Analyzed fields of (a) surface wind and dew point temperature and (b) surface rnoisture divergence at 18 UTe (12 LDT), 11 July 1985. Contour intervals and wind vectors as in Figs. 9 and 10.
52"l.LMwj , :.' /,---,' cu l\QF -ë'u* -~-",I)0,/:~/.çl)*: ACR' ..... ' ''''''' ~ _"_"~,,/., f 8 e~""2/''!8':':'' 152
0
.. / / (( 289 8,'
"'_.... ,,/ '"" " ,," . -,/- AC:!-~ . / ~. . 'I
8i!
, A-(.{L . 0 EL
~ll!·1 ~~ W,P(' O. !O 'à'tl~ / / / .. \ ~~
~ 29
,. . AC
AYC
_, cf CUx' •• /, 1, K _, •• , .. 1 , , '! IS1°
1140
1 1 o 30 km
l'
ENERGY TEND BELOW 300 MB (J/ka/2 HRl Il JUL 85 - 18 ure (12 LD1l
QF
1 1 ~ 30 km
Fig. 14: Analyzed fields of (a) 500 mb 2 hr temperature tendency and (b) lifted parcel energy tendency below 300 rob at 18 UTC (12 LOT), 11 July 1985. Contour intervals as in Fig. 11.
85 _... 3- 2 -- '" \ \/ - - -1 --~ 5 ..... -" km L ACH
0 30 km a
TEND 11 JUL 85 - 10 ure ( 12 LDf) 9 ') c.
2
3
h
4 2
3 6
3 0
2.5
9
5 90kP
0 km
0 30 km
Fig. 15: Analyzed vertical cross sections of 4 hr (a) tempe rature tendency, (b) lifted parcel energy t.endency, (c) height t(mùcncy, and (d) u-component of the wind tendency end ing ct t lB UTC (l? LI)'!') on ~~ July 1985. Dashed contours show negative tendeneies. contîur intirvals are 1°C 4 hr-l, 10 Jkg- l 4 hr- l , 5 m 4 hr- l , and 4 ms- 4 hr- Shaded area is mean topographie cross section. Stélndélrd pressure levels shown in kPa. Lifted parcel energy was calculateù for each 10 mb increment based on the "lowest 30 rob" parcel used in the parcel ascent.
\ \ ~ --ï AC * '! 1 1 g T r ,,- / r, ,\1 L "" / 1 '" ..... \1 l "" "" , l, 1 \ \ ;. al <:>
[
"', ,,-./.1 / " , ,
--1'MH j' :-
~ , 1 1 O' J 1
I N" " 1 / 1 1
r ' ., ., 'r-{ . / 1 1
1 C~o,\rB""- 1 . cr~-w~/ /' ... ~ ~
51a~, ~ / i /. ,
rw, i _c -~, -c ~'-f:AYC r "ea-"''tJ " , , l '::.u' AYC
l '1:; 0 cl c ~I 1 1 .0 ~-' 1 51.,,,, . 1, ..1. '.. 'If , '5' S· -, ., 1. 1. .Ir :,.. "1 l 51
C -J .: km
1 15Q
114. 1;5' 114.0 115~ 1~4c
01 - ~ 1 .:'" r\,~ :; J ~ r.1
Fig. 16: Analyzed fields of (a) capping lid strength, b) surface Nind and 2 hr temperature tendency, and (c) surface wind and 2 hr pressure tendency at 20 UTC (14 LDT), 11 July 1985. Contour interva1s and wind vectors as in Figs. 8, 9, and 10.
~ IV -..1 -
lA
1
5
SFC WIND / Ta (DEG Cl 11 JUL 85 - 20 UTe (14 LDT)
AC. CU""AYC
2°
'- 0 1 ·f t t!ll
1 1 o 30 km 114
0
•
SURFACE MOISrURE DIVERGENCE Il JUL 85 - 20 UTC (14 LDT)
<:>* ,r __ ~\fL ~f ~a
/-' 1 ,. \ /" . \
1 M 10-" \ \ \.' \
FMll ...... / \ '.. \
• 1 ,p, 1
~ 1 , 1
\ 1 '/
CU*:.\. ~
~ ... AC . cU*AYC
b
QF
52°
51 0 •• , .
115° ,. ..,; 151 0
,,' 30 km 114°
Fig. 17: Analyzed fields of (a) surface wind and dew point temperature and (h) surface moisture divergence at 20 UTC (14 LDT), Il July 1985. Contour intervals and wind vectors as in Fig. 10.
-
1-' l\J (»
r (129)
Il JULY 1985, 15:34 LOT IR
Fig. 18: Infrared satellite image of Alberta taken from a polarorbiting satellite at 15:34 LOT on Il July 1985. Whjt~ arraw indicates line of TeU that formed over the Alberta foath i 11;,.
,1
(130)
JUL y Il, 1985 16 LDT
Fig. 19: Radar PPI' s for 11 July 1985 with mesoscale analysis domain included. Range markers are spaced 20 km apart. Contours are of radar reflectivity with an interval of 10 dB. Minimum contour is 20 dBZ. Elevation angle is 1.8°. The weak ground echoes near 240°, at a range of 120-140 ~m are from the higher peaks in the Alberta foothills.
Fig. 20: Analyzed fields of (al 500 mb wind and divergence, (b) 500 rob 2 hr temperature tendency, and (c) 2 hr lifted parcel energy tendenc:l below 300 mb at 20 UTC (14 LOT), 11 July 1985. Contour interval for (a) is 5 x 10-
5 5-
1. Contour intervals for (b) and (c) as in Fig. 11. For
500 rob wind vectors, 1 eas~-~est grid length = 42.3 ms- l .
~ ~ t.
,.... w ,....
M
POSITIVE ENERGY (J/kcl Il JUL 85 - 20 ure (!4-L)Tl
. AC
YC
QF
51 °1 . iA /~A l.f i 1 /1 1· I··! ! ! 151° 115° 114°
Fig. 22: Analyzed vertical cross sections of anomalous equivalent potential temperature at (a) 14 UTC (08 LDT), (b) 16 UTC (10 LDT), (c) 18 UTC (12 LOT), (d) 20 UTC (14 LOT), and (e) 22 UTe (16 LOT) on Il July 1985. Contour interval is 2 0 K. Dashûd contours are negative anomalies.
1
:{ 30
35
40
45
50
55
60
65
70
75
80
85
90kPa
(134 )
ANOM. THETA E IDEG K) / Il JUL 85 - 18 UTe (12 LDT) ,-----r----~---r_·--~----~----~~~----~9.2
Fig. 23: Analyzed vertical cross sections anomalous u-component of the wind at (a) 14 UTC (08 LOT), (b) 16 UTC (10 LOT), (c) 18 UTC (12 LOT), (d) 20 UTC (14 LOT), and (e) 22 UTC (16 LDT) on 11 July 1985. Contour interval is 2 ms-le Dashed contours are negative anomalies.
-,
r
..
90kP
30
90kP
(137)
ANOM U COMP (MIS) 1 II JUL 85 - 18 UTC (12 LDT) :: 9 è
ANOM U COMP. (MIS) 1 Il JUL 85 - 22 urc (16 LDT> 9 2
--~:::.~ ~;4- ---~_--=-_--=---:?.;;-=---
Fig. 23: (continued)
~~~~==========L ___ --__
1
30 km
4
2 --------"'~ 4 9
__ ------:1 4.2
----_ .... 3.0
1 9
1.5 ••• iiii _______ ~ 1 0 km
ACII
e
•
Fig. 24: Surface barograph trace at Rocky Mountain House, Alberta (ARM) for the period 09 LOT, 7 July to 09 LOT, 13 July 1985. The arrows indicate the minimum pressure in the diurnal cycle.
"'rl--""
-.... W \D
....
MSL PRESSURE (mbl
Il JULY 1985,
1 1
1 1 1 1
l C\ '"\.-
\
p,.-t\o fP- .1' ,
Il JULY 1985, 14 UTe (08 LDT) 1
II(~ \ IL 1 1 1
"'4
" \.\ L: 1
SURfACE \: DEW POINT ,-
TEMPERATURE (~) ~
\ ----.JIO
------' 1
" o 100"'"
_"_"'! ," __ ---1._ .. -
1 1
Fig. 25: Subjectively analyzed MSL pressure (a), surface temperature (b) and surface dew point temperature (c) fields at 14 UTC (08 LOT) on 11 July 1985. Wind observations show station locations. Winds plotted using conventional speed scale. Contour interval: 2°C and 0.5 mb. Rectangle is LIMEX-85 observation area. W' sand K' s designate local maxima and minima in temperature, while H's and L's are the equivalents for MSL pressure.
Fig. 29: Time-height cross-sections of observed winds time anomaly winds (b) at ARM on Il July 1985. A vector of 1 time interval = 64 rns- 1 in (a), 21 rns- 1 in (b).
\ '-\L: 1 \ : -05. CE PRESSURE \ ____ {:;__ \ SURFA L
TENDENCY _" - _,
• 1 ~05~ RE 1 , , SUR~~~~::~~SU \ ___ J _'O~,
(mb/2 hrl -15 \ Jj-~o . (mb/2hrl \
0----<00
km 1 ~ __ _ 01_
---.J__ - a --------"--J ,------ >----<00 km ',' '-=L'"' " . o , ~ ~~- b ----._--- "--J --r- -i 1
Fig. 30: Subjectively analyzed, 2 hour surface pressure tendency fields at 10 (a) 1 12 (b), 14 (c), and 16 LDT (d) on 11 July 1985. Contour interval is 0.5 rnb 2 hr-1 . Locations of stations used in analysis are the sarne as in Fig. 25.
....... 1-' ..,. C\
~ " ~
, Il JULY 1985, 16 UTC (10 LOT) II JULY 1985, 18 UTC (12 LOT) \ Il JULY 1965, 20 UTC (14 LOT)
! ( 1 ! 2 4
{) '\.
)
SURFACE TEMPERATURE
TENDENCY
( °C/2 hr)
----. " 6\
2 4
j '" '6~ , 4 1
! L ~' l ' rH 1 : r 1 l i <.
'\.-) '4
\ H '"
SURFACE TEMPERATURE
TENDENCY (oC/2 hrl
"
i \ 1
1 1
\
1 1
i\1 O~ li i ~ <. ~02442 1
L\~~~~ SURFACE \ t :
TENOENCY /-~ .
(oCi2hrl ,,\ 1
o 1001vn 1 J.,
4~ TEMPERATURE \ i : \ '\
\ 2 \
_ _ o-Iookm ~ ~ 0----100 km 0 H
, 2 4 -,
1
\ ,'---J _,._._ r a -"- ~ ~'"- ~ ~-~ -,.~.
b ~ ~'-~"--- C
Fig. 31: Subjectively analyzed, 2 hour surface temperature tendency fields at 10 (a), 12 (b), 14 (c), and 16 LDT (d) on 11 July 1985. Contour interval is 2°C 2 hr- 1 . Locations of stations used in analysis are the same as in Fig. 25.
..... 1-' ~
-.J
(148)
(18LOT ,09 JULY 1985)
576
588
~~--~--~~--~~--~--~~----~--------~ 594
Fig. J 2: As in Fig. 6 except for 09 July 1985.
a
CAPPlNG LlD STRENGTH <DEG KI e9 JUL 85 - 14 UTC (08 LDTI
Fig. 36: Analyzed fields of (a) LPE tendency below 300 rnb at 16 UTC (10 LDT) on 09 July 1985, (b) LPE below 300 rnb at 16 UTC (10 LDT) on 09 July 1985, and (c) LPE below 300 rob at 16 UTC (la LDT) on Il July 1985. Contour intervals: 100 Jkg- 1 2 hr-1 and 200 Jkg- 1 .
,../ l '\ \ ua - - ............ //"'.... /' l '- eUAEL ~ ..... " .r 1-'~ .r 1 1 \ \ "' * " "' ,
/ A.\fL ~ '1,,~ "" -t\\ ... '\~,\,
/ F~fH i "" J QI 1 ( " " 'f!:u ~ '- /\ '\ \
1 1
l '...,
tROWBA
1 , 1 1 ,\, I\' \ \ \ 1 1 1 , _
' ... " i \., \ - CLR* AYC \ j • .f. • 15 t O 51
ci. , '!' , '40 ,< , , , 5~
c ":1 _ __ \.0 ..... 1
Fig. 37: Analyzed fields of (a) 2 hr surface temperature tendency and (b) 2 hr surface pressure tendency at 18 UTC (12 LDT) on 09 July 1985. Contour intervals: IOC 2 hr- 1 and 0.2 mb 2 hr- I .
Fig. 40: Subjectively analyzed MSL pressure fields and surface wind observations at 08 (a), 12 (b), and 18 LDT (c) on 09 July 1985. Contour interva1 is 0.5 mb.
-.... U1 0\
4
SURFACE DEW POINT
TEMPERATURE te)
>------< o IOOIun
!I 1 i
14U~~4
\. ~6 le i
6
\ i \
J ... a
09 JULY 1985,
1
'\a--) : 1 1 SURFACE ~ _____ .J
DEW POINT "
6
\ \ TEMPERATURE te) " n
1 6\ \ j 1
>-------< o IOOIun , ~_.
-"'-"', l' -_.--' .-_ ... -." b 1 i
09 JULY 1985,
SURFACE DEW POINT
TEMPERATURE (oC)
>--t o IOOIun
Fig. 41: Subjectively analyzed surface dew point temperature fields at 08 Ca), 12 Cb), and 18 LDT Cc) on 09 July 1985. Contour interval is 2°C.
..
.... 111 ~
• (158)
09 JULY 1985, 21 :06 LOT IR
Fig. 42: Infrared satellite image of Alberta taken frorn a polarorbiting satellite at 21:06 LOT on 09 July 1985.
Fig. 44: Vertical profiles of the difference in the u-cornponent of the wind between 11 July and 09 July 1985 at ARM. Solid line is for 08 LOT, solid line with plus sign for 10 LOT, and da shed line for 12 LOT. Standard pressure levels given in kPa.
(161)
1 500mb-OOOOZ, 17JULY {I8 LOT ,16 JULY 19951
582
a
500mb-OOOOZ,18JULY (18 LOT ,17 JULY 19851 r---~----~~~~r-~~~~~~
.r)
b
Fig. 45: As in Fig. 6 except for 18 LDT on 16 and 17 July 1985.
l
~.~
CAPPING LID STRENGTH (DEG Kl 17 JUL 85 - 14 UTC (08 LOT)
Fig. 55: Synoptic-scale features present on days of severe convective outbreaks. Long-dashed line indicates axis of 500 mb height and thermal troughs. Dash-dot line indicates axis of 500 mb height and thermal ridges. Thin connected arrows show core of maximum 500 mb winds. Short-da shed line is surface moisture tongue. Thick arrow is surface synoptic flow. The area of maximum destabilization is located over the foothills where maximum uppcrlevel cooling is superimposed over maximum surface heating.
1
·r
(172)
8-14 LOT 10
30
8 rid e
@rm§>
50 trough
--dry air
80 kPa
underrunning 1 1 0 km 80
Fig. 56: Schematic vertical cross section for 8-14 LOT illustrating the arnplified mountain-plain circulation and underrunning of the capping lido
Fig. 57: Areas of operations of the Alberta Bail proj ect. Area A was used from 1957 to 1973, while Area B served from 1974-1985.
T J
(174)
MEAN DAILY MAXIMUM DEW POINT TEMPERATURE ("C)
FOR JULY
Fig. 5B: Mean daily maximum dew point temperature for July in the Canadian praIrIes. Provinces from left to r j ght: Alberta, Sdskatchewan, and Manitoba. Contour interval is 0.5 oC.