The Changing Electricity Sector CONTENTS Introduction Potential for Distributed Generation Impacts of Distributed Generation Potential for Residential Roof Top Solar PV Payback Period Calculation Derived for Roof Top PV Case Study of Bisasar Road Landfill gas to electricity project Conclusion Sanjeeth Sewchurran. Pr Eng (eThekwini Electricity, UKZN)
Transcript
The Changing Electricity Sector
CONTENTS
Introduction
Potential for Distributed Generation
Impacts of Distributed Generation
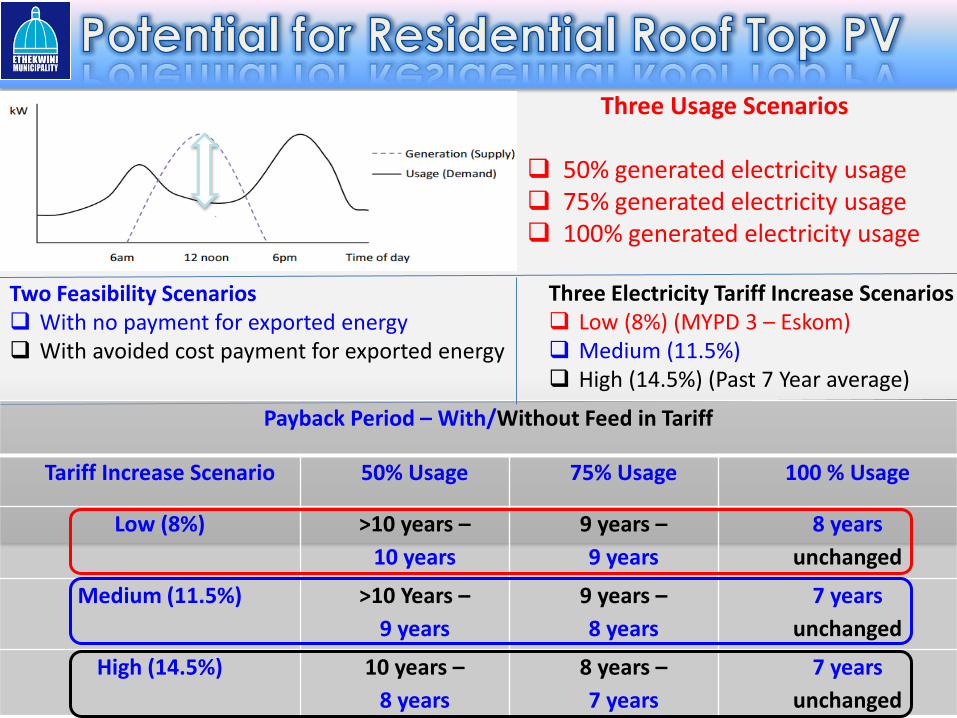
Potential for Residential Roof Top
Solar PV
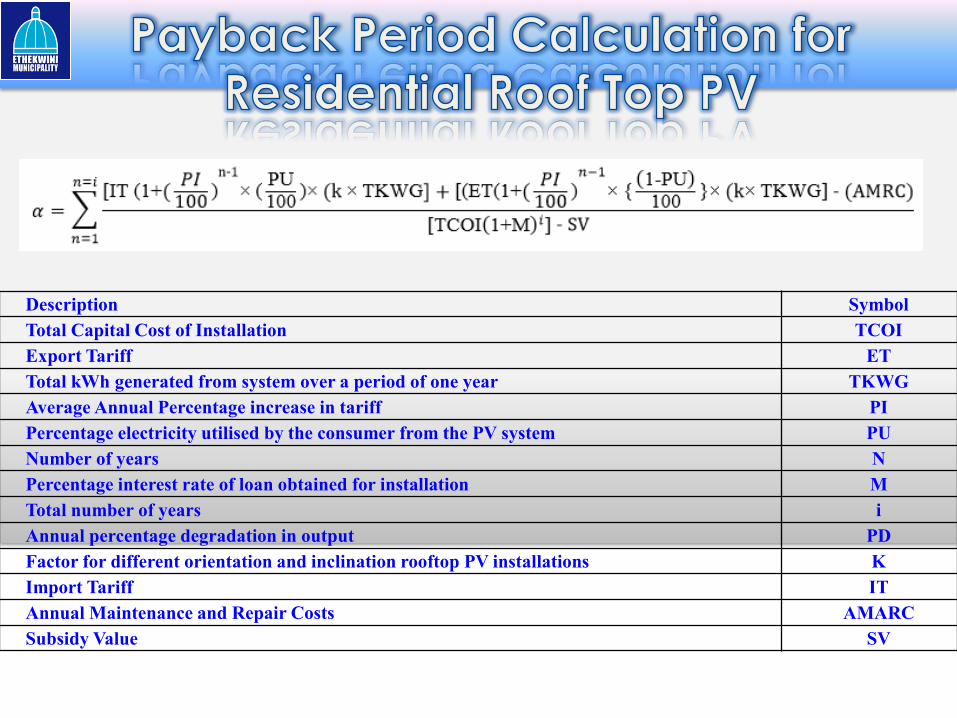
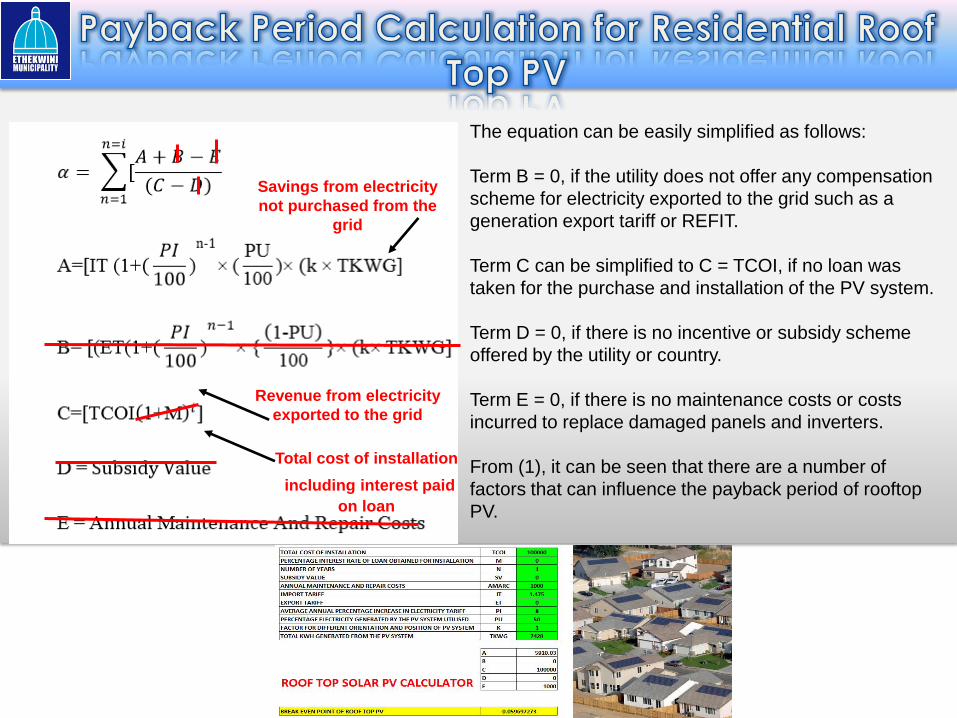
Payback Period Calculation
Derived for Roof Top PV
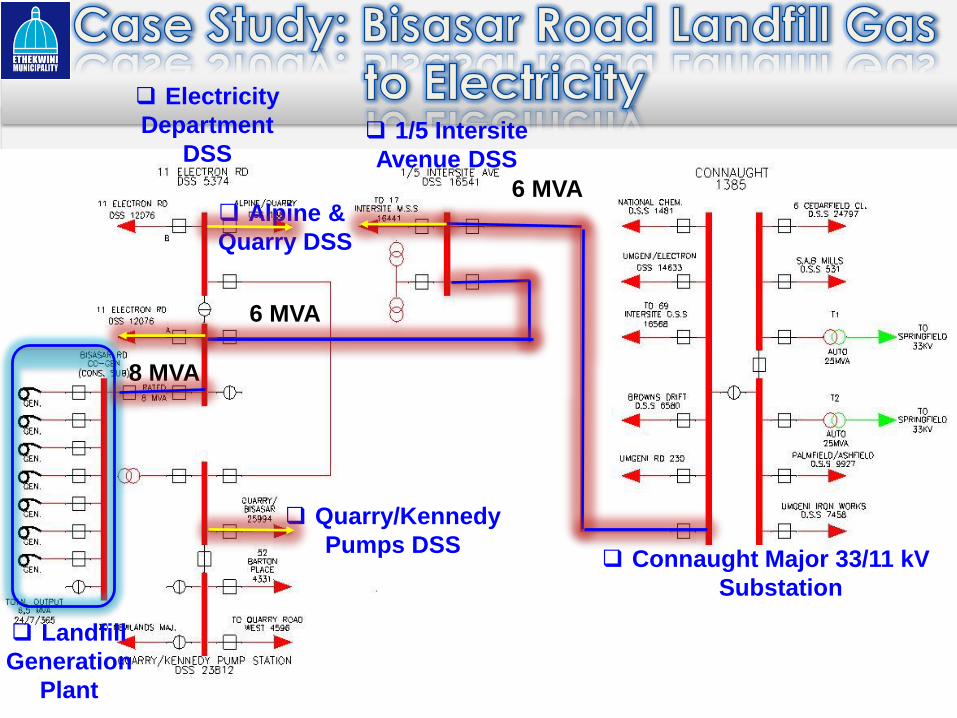
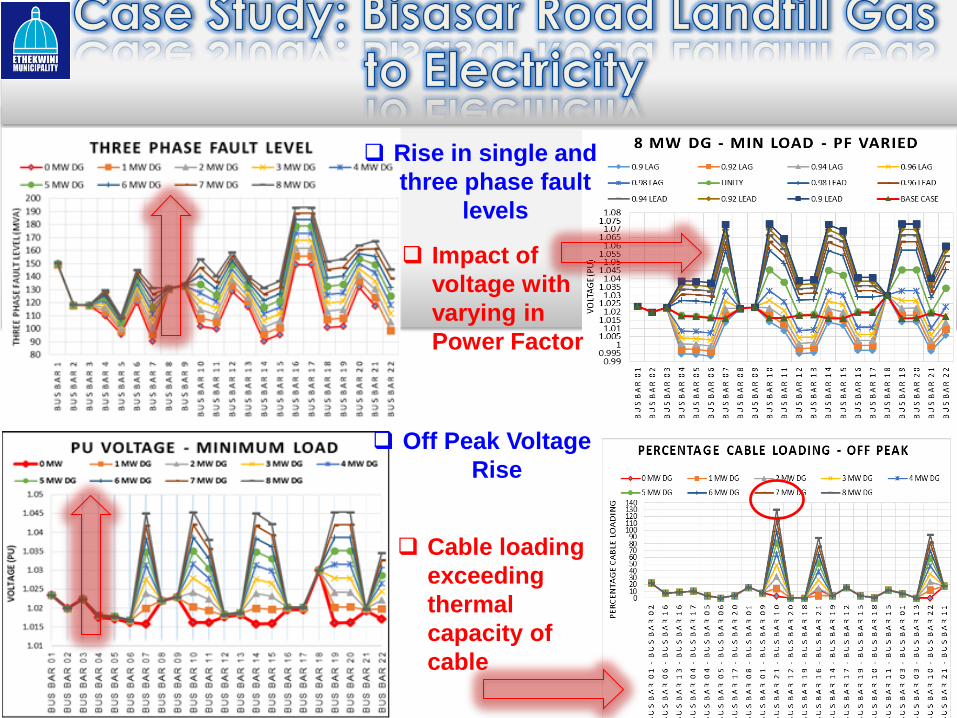
Case Study of Bisasar Road
Landfill gas to electricity project
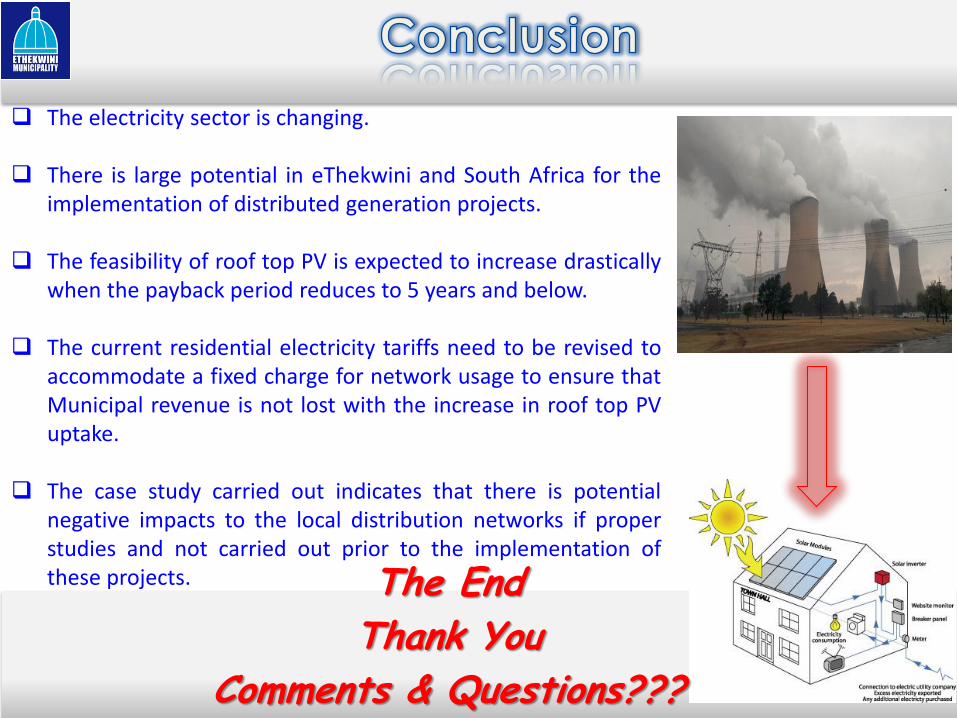
Conclusion
Sanjeeth Sewchurran. Pr Eng (eThekwini Electricity, UKZN)
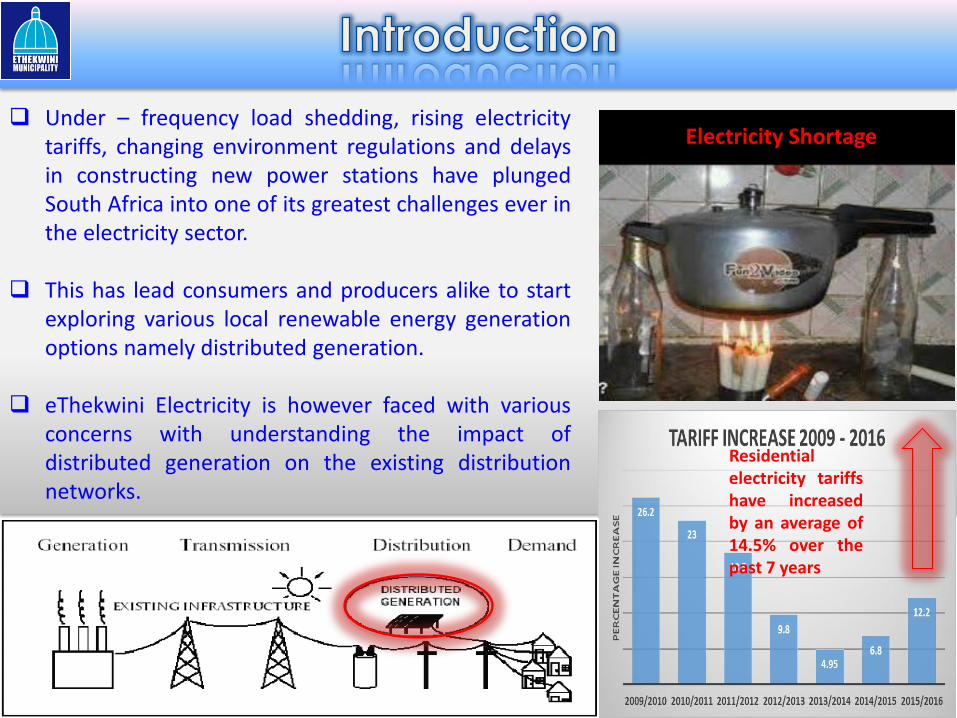
Under – frequency load shedding, rising electricity tariffs, changing environment regulations and delays in constructing new power stations have plunged South Africa into one of its greatest challenges ever in the electricity sector.
This has lead consumers and producers alike to start
exploring various local renewable energy generation options namely distributed generation.
eThekwini Electricity is however faced with various
concerns with understanding the impact of distributed generation on the existing distribution networks.
Electricity Shortage
Residential electricity tariffs have increased by an average of 14.5% over the past 7 years
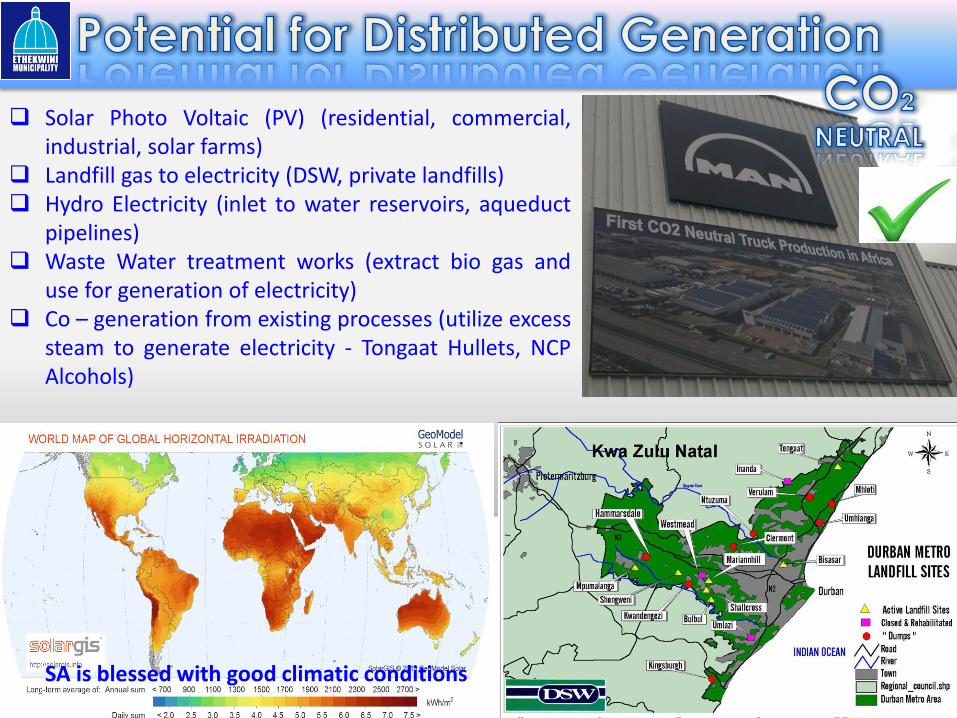
Solar Photo Voltaic (PV) (residential, commercial, industrial, solar farms)
Landfill gas to electricity (DSW, private landfills) Hydro Electricity (inlet to water reservoirs, aqueduct
pipelines) Waste Water treatment works (extract bio gas and
use for generation of electricity) Co – generation from existing processes (utilize excess
steam to generate electricity - Tongaat Hullets, NCP Alcohols)
SA is blessed with good climatic conditions
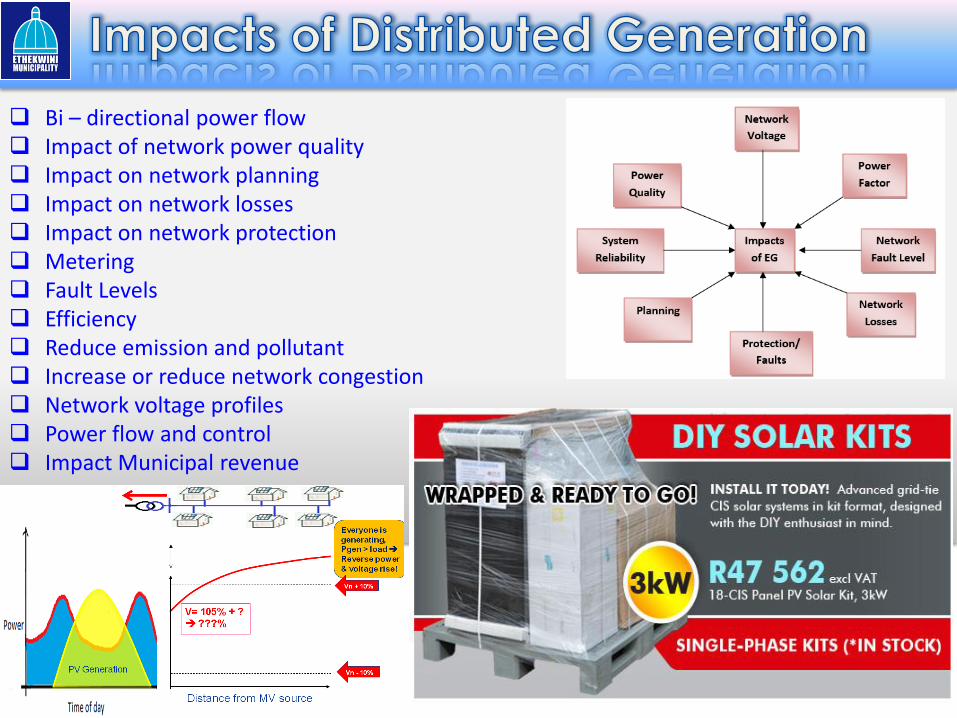
Bi – directional power flow Impact of network power quality Impact on network planning Impact on network losses Impact on network protection Metering Fault Levels Efficiency Reduce emission and pollutant Increase or reduce network congestion Network voltage profiles Power flow and control Impact Municipal revenue
Two Feasibility Scenarios With no payment for exported energy With avoided cost payment for exported energy