186
World Intellectual Property Report The Changing Face of Innovation 2011 WIPO Economics & Statistics Series
| Date post: | 02-Jan-2017 |
| Category: |
Documents |
| Upload: | truongngoc |
| View: | 225 times |
| Download: | 7 times |
World Intellectual Property Report The Changing Face of Innovation
2011WIPO Economics & Statistics Series
WIP
O E
cono
mic
s &
Sta
tistic
s S
erie
s20
11
| W
orld
Inte
llect
ual P
rope
rty
Repo
rt
| Th
e C
hang
ing
Face
of I
nnov
atio
n
For more information contact WIPO at www.wipo.int
World Intellectual Property Organization34, chemin des ColombettesP.O. Box 18CH-1211 Geneva 20Switzerland
Telephone :+4122 338 91 11Fax :+4122 733 54 28
WIPO Publication No. 944E/2011 ISBN 978-92-805-2160-3
World Intellectual Property Report The Changing Face of Innovation
2011WIPO Economics & Statistics Series

Foreword

3
Innovation is a central driver of economic growth, de-
velopment and better jobs. It is the key that enables
firms to compete in the global marketplace, and the
process by which solutions are found to social and
economic challenges.
The face of innovation has evolved significantly over the
last decades.
First, firms are investing historically unprecedented
amounts in the creation of intangible assets – new ideas,
technologies, designs, brands, organizational know-how
and business models.
Second, innovation-driven growth is no longer the
prerogative of high-income countries alone; the techno-
logical gap between richer and poorer countries is nar-
rowing. Incremental and more local forms of innovation
contribute to economic and social development, on a
par with world-class technological inventions.
Third, the act of inventing new products or processes
is increasingly international in nature and seen as more
collaborative and open.
Fourth, knowledge markets are central within this more
fluid innovation process. Policymakers increasingly seek
to ensure that knowledge is transferred from science to
firms, thereby reinforcing the impact of public research.
Moreover, ideas are being co-developed, exchanged and
traded via new platforms and intermediaries.
In this new setting, the role of intellectual property (IP)
has fundamentally changed. The increased focus on
knowledge, the rise of new innovating countries and
the desire to protect inventions abroad have prompted
a growing demand for IP protection. IP has moved from
being a technical topic within small, specialized com-
munities to playing a central role in firm strategies and
innovation policies.
Understanding these innovation trends and the asso-
ciated role of IP is important in order for public policy
to support new growth opportunities. The essential
questions to ask are whether the design of the current
IP system is fit for this new innovation landscape, and
how best to cope with the growing demand to protect
and trade ideas. To move beyond polarized debates on
IP, more fact-based economic analysis is needed. In ad-
dition, it is crucial to translate economic research in the
field of IP into accessible policy analysis and messages.
I am pleased therefore that WIPO’s first World IP Report
explores the changing face of innovation. Through this
new series, we aim to explain, clarify and contribute to
policy analysis relating to IP, with a view to facilitating
evidence-based policymaking.
Clearly, this Report leaves many questions open. Where
the available evidence is insufficient for making informed
policy choices, the World IP Report formulates sugges-
tions for further research. This first edition does not ad-
dress all the important IP themes – notably, trademarks
and branding, copyright and the cultural and creative
industries, or the protection of traditional knowledge.
We intend to focus on these and other areas in future
editions of this series.
Francis GURRY
Director General
FoReWoRd
4
AcknoWledgementsThis Report was developed under the general direction
of Francis Gurry (Director General). It was prepared and
coordinated by a core team led by Carsten Fink (Chief
Economist) and comprising Intan Hamdan-Livramento
(Economist) and Sacha Wunsch-Vincent (Senior
Economist), all from the Economics and Statistics Division.
Chapter 3 draws heavily on a contribution from Josh
Lerner and Eric Lin from Harvard Business School.
The IP Statistics and Data Development Sections sup-
plied many of the data used in this Report and made
written contributions to Chapters 1 and 4. Special thanks
go to Mosahid Khan and Hao Zhou. Ignat Stepanok and
Maria-Pluvia Zuñiga contributed to the development of the
data methodology and to several sections of Chapter 4.
Background reports were prepared by Suma Athreye,
José Miguel Benavente, Daniel Goya, Ove Granstand,
Keun Lee, Sadao Nagaoka, Jerry Thursby, Marie Thursby,
Yong Yang, and María Pluvia Zuñiga.
Nuno Pires de Carvalho and Giovanni Napolitano from
the Intellectual Property and Competition Policy Division
provided helpful input for Chapter 3. Ilaria Cameli, Yumiko
Hamano, Ali Jazairy and Olga Spasic from the Innovation
and Technology Transfer Section contributed to and of-
fered helpful suggestions on Chapter 4.
The Report team benefitted greatly from comments
on draft chapters from Alfonso Gambardella, Richard
Gilbert, Christian Helmers, Derek Hill, Martin Schaaper,
Mark Schankerman, Pedro Roffe, and Jayashree Watal.
In addition, several WIPO colleagues also offered helpful
suggestions, namely Philippe Baechthold, Juneho Jang,
Ryan Lamb, Bruno Le Feuvre, Tomoko Miyamoto, Julio
Raffo, Yoshiyuki Takagi and Takashi Yamashita.
Thanks also go to the Association of University
Technology Managers (AUTM), Bronwyn Hall, Derek
Hill, the Organisation for Economic Co-operation and
Development, Maxim Pinkovskiy, Melissa Schilling, and
the UNESCO Institute for Statistics for kindly providing
data used in this report.
Samiah Do Carmo Figueiredo provided valuable admin-
istrative support.
Finally, gratitude is due to Heidi Hawkings and Stephen
Mettler from the Communications Division for editing and
designing the Report and the Printing and Publication
Production Section for their printing services. All worked
hard to meet tight deadlines.
5
dIsclAImeR tecHnIcAl notesThis Report and any opinions reflected therein are the
sole responsibility of the WIPO Secretariat. They do not
purport to reflect the opinions or views of WIPO Member
States. The main authors of this Report also wish to
exonerate those who have contributed and commented
upon it from responsibility for any outstanding errors
or omissions.
Readers are welcome to use the information provided in
this report, but are requested to cite WIPO as the source.
COUNTRY INCOME GROUPS
This Report relies on the World Bank income classifica-
tion based on gross national income per capita to refer
to particular country groups. The groups are: low-income
(USD 1,005 or less); lower middle-income (USD 1,006 to
USD 3,975)-; upper middle-income (USD 3,976 to USD
12,275); and high-income (USD 12,276 or more).
More information on this classification is available at
http://data.worldbank.org/about/country-classifications.
IP DATA
The majority of the IP data published in this Report are
taken from the WIPO Statistics Database, which is primar-
ily based on WIPO’s annual IP statistics survey and data
compiled by WIPO in processing international applica-
tions/registrations filed through the Patent Cooperation
Treaty (PCT), the Madrid System and the Hague System.
Data are available for download from WIPO’s web-
page: www.wipo.int/ipstats/en. WIPO’s annual World
Intellectual Property Indicators, freely available on the
same webpage, provides additional information on the
WIPO Statistics Database.
The patent family and technology data presented in
this Report come from the WIPO Statistics Database,
the most recent Worldwide Patent Statistical Database
(PATSTAT) of the EPO, and from selected national data
sources, as indicated in the Report.
Every effort has been made to compile IP statistics based
on the same definitions and to ensure international compa-
rability. The data are collected from IP offices using WIPO’s
harmonized annual IP statistics questionnaires. However,
it must be kept in mind that national laws and regulations
for filing IP applications or for issuing IP rights, as well as
statistical reporting practices, differ across jurisdictions.
Please note that, due to the continual updating of miss-
ing data and the revision of historical statistics, data pro-
vided in this Report may differ from previously published
figures and the data available on WIPO’s webpage.
6
eXecUtIVe sUmmARYThroughout human history, innovation has been a power-
ful force for transformation. This arguably holds true now
more than ever. However, the face of innovation – the
“who”, the “how”, and the “what for” – has continu-
ously changed.
Understanding these changes is important. In modern
market economies, innovation is a key ingredient of
sustained economic growth. In high-income countries,
studies have estimated that innovation accounts for as
much as 80 percent of economy-wide growth in produc-
tivity. Research at the firm level has shown that firms that
innovate outperform their non-innovating peers. Less is
known about innovation and its economic impact in low-
and middle-income economies. However, the available
evidence similarly suggests that innovating firms in those
economies are more productive – especially if applying
a broad view of innovation that includes incremental
product and process improvements. Indeed, the experi-
ence of several East Asian economies has demonstrated
how innovation can spur economic catch-up – even
if innovation may be only part of the success story of
those economies.
For policymakers in particular, it is important to monitor
and assess how innovation changes. Governments are
key stakeholders in national innovation systems. They
directly fund research and provide incentives for firms
to invest in innovation – including through the protection
of intellectual property (IP). As innovation practices shift,
governments need to assess the effectiveness of existing
policies and, where necessary, adapt them.
This Report seeks to make an analytical contribution in
this respect. It does so in two ways. First, it sheds light
on global innovation trends – especially those concerning
IP – and assesses the ways in which innovation has really
changed. Second, it reviews the available evidence on
how IP protection affects innovative behavior and what
this evidence implies for the design of IP and innova-
tion policies.
How is the face of innovation changing?
Claims about new innovation models and practices
abound. Assessing the significance of those claims
requires a dispassionate look at the available data – a
task performed in Chapter 1.
The geography of innovation has shifted, although high-income countries still dominate global R&D spending
A natural first step is to look at trends in research and
development (R&D). Global R&D expenditure almost
doubled in real terms from 1993 to 2009. Since this period
also saw marked growth of the global economy, the share
of global gross domestic product (GDP) devoted to R&D
increased at a more modest rate – from 1.7 percent in
1993 to 1.9 percent in 2009. Two other important insights
emerge from the available R&D data (see Figure 1):
• MostR&Dspendingstilltakesplaceinhigh-income
countries – around 70 percent of the world total. They
spend around 2.5 percent of their GDP on R&D – more
than double the rate of middle-income economies.
• Low-andmiddle-incomeeconomiesincreasedtheir
share of global R&D expenditure by 13 percent be-
tween 1993 and 2009. China accounts for most of this
increase – more than 10 percentage points – propel-
ling China to the world’s second largest R&D spender
in 2009.

7
eXeCUTIVe SUMMArY
Figure 1: R&D expenditure still comes
mainly from high-income countries
Worldwide R&D expenditure, by income group, in 2005 PPP Dollars, 1993 and 2009
See Figure 1.5.
R&D statistics paint only a partial picture of innovation
landscapes. The innovation performance of economies
depends on broader investment in knowledge beyond
formal R&D spending. This includes, above all, invest-
ment in education. The introduction of new machinery
and equipment is another important component of
innovation expenditure, especially in low- and middle-
income countries.
Studies have also pointed to the importance of non-tech-
nological innovation – including organizational, marketing,
design and logistical innovation – as an important driver
of firm and economy-wide productivity enhancements.
Indeed, data show that firms’ investment in all types
of intangible assets has grown more rapidly than their
investment in tangible assets; in selected countries,
firms even invest more in intangible than in tangible as-
sets. However, few hard data exist to rigorously assess
whether non-technological innovation has risen in relative
importance – not least because such innovation often
complements technological breakthroughs.
The innovation process is increasingly international in nature
Clear evidence exists that innovation is increasingly
international in nature. Greater mobility of students,
highly-skilled workers and scientists has spurred the in-
ternational exchange of knowledge. There also has been
a sharp increase in the share of peer-reviewed science
and engineering articles with international co-authorship,
and a rising share of patents that list inventors from more
than one country. More and more, multinational firms are
locating their R&D facilities in a variety of countries – with
certain middle-income economies seeing particularly
fast growth. The rising share of middle-income countries
in the global economy is, in turn, reorienting innovation
towards the demands of those countries.
Innovation is seen to have become more collaborative and open… but is this perception correct?
One much-discussed element of the new innovation
paradigm is the increasingly collaborative nature of the
innovation process. Indeed, the available data confirm
that there is greater collaboration in some respects. The
above-mentioned trend of more frequent international
co-patenting points to greater collaboration at the in-
ternational level. In addition, the available data on R&D
alliances have shown upward trends in some sectors,
although not necessarily in recent years, and the reliability
of those data is weak.
Heightening perceptions of greater collaboration, scholars
and business strategists have emphasized that innova-
tion is becoming increasingly “open”. In particular, firms
practicing open innovation strategically manage inflows
and outflows of knowledge to accelerate internal innova-
tion and to expand the markets for external uses of their
intangible assets. “Horizontal” collaboration with similar
firms is one important element of open innovation, but
it also includes “vertical” cooperation with customers,
suppliers, universities, research institutes and others.
523
56 44
854
245 105
0
200
400
600
800
1000
High-income Middle-and low-income
Middle- and low-income, excluding China
1993 2009

8
Assessing the true scale and importance of open innova-
tion is challenging. For one, it is difficult to draw a clear
distinction between open innovation strategies and long-
standing collaborative practices, such as joint R&D, joint
marketing or strategic partnerships. In addition, certain
elements of open innovation strategies – such as new
policies internal to firms or informal knowledge exchanges
– cannot easily be traced. Anecdotally, examples of truly
new approaches abound – notably, so-called crowd-
sourcing initiatives, prizes and competitions, and Internet
platforms on which firms can post challenges. Modern
information and communications technologies (ICTs) have
facilitated many of these approaches.
IP ownership has become more central to business strategies
Turning to the IP system, there is every indication that IP
ownership has become more central to the strategies of
innovating firms. IP policy has, therefore, moved to the
forefront of innovation policy.
Demand for patents has risen from 800,000 applications
worldwide in the early 1980s to 1.8 million in 2009. This
increase has occurred in different waves, with Japan
driving filing growth in the 1980s, joined by the United
States (US), Europe and the Republic of Korea in the
1990s and, more recently, by China.
There are many causes of this rapid increase in patent-
ing, including some which are specific to countries and
industries. However, two key forces stand out:
• Dividingthegrowthinpatentingworldwideintoso-
called first filings – approximating new inventions
– and subsequent filings – primarily filings of the
same invention in additional countries – shows that
the latter explains slightly more than one-half of that
growth over the last 15 years (see Figure 2). Patent
applicants increasingly seek to protect their patents
abroad and, indeed, in a larger number of countries,
reflecting greater economic integration.
• Comparinggrowth inthenumberoffirstfilingsto
growth in real R&D expenditure shows that, for the
world as a whole, the latter has grown somewhat faster
than the former. This suggests that growth in patent-
ing is rooted in underlying knowledge investment. As
discussed further below, however, patenting and R&D
trends vary markedly across countries and industries,
with important implications for how firms innovate.
Figure 2: Patenting abroad is the main
driver of worldwide patenting growth
Patent applications by type of application, indexed 1995=1
Contribution of first and subsequent applications to total growth, in percent, 1995-2007
See Figure 1.20.
48.3%
51.7%
First ling Subsequent ling
0.0
0.5
1.0
1.5
2.0
2.5
3.0
1975
1977
1979
1981
1983
19
85
1987
1989
1991
1993
19
95
1997
1999
2001
2003
20
05
2007
First ling Subsequent ling
eXeCUTIVe SUMMArY
9
Demand for other IP rights – which firms often use as a
complement to patents – has also seen marked growth.
Trademark applications worldwide increased from 1
million per year in the mid-1980s to 3.3 million in 2009.
Similarly, industrial design applications worldwide more
than doubled from about 290,000 in 2000 to 640,000
in 2009. Greater internationalization is also an important
factor behind the rising demand for protection of these
forms of IP. However, little is known about what precisely
has driven their filing growth and to what extent their role
in business strategies has shifted.
Knowledge markets based on IP rights are on the rise, though still nascent
A final important trend concerns the rise of IP-based
knowledge markets. Evidence suggests that the trad-
ability of IP has increased over the last few decades. This
is reflected in more frequent licensing of IP rights and the
emergence of new technology market intermediaries.
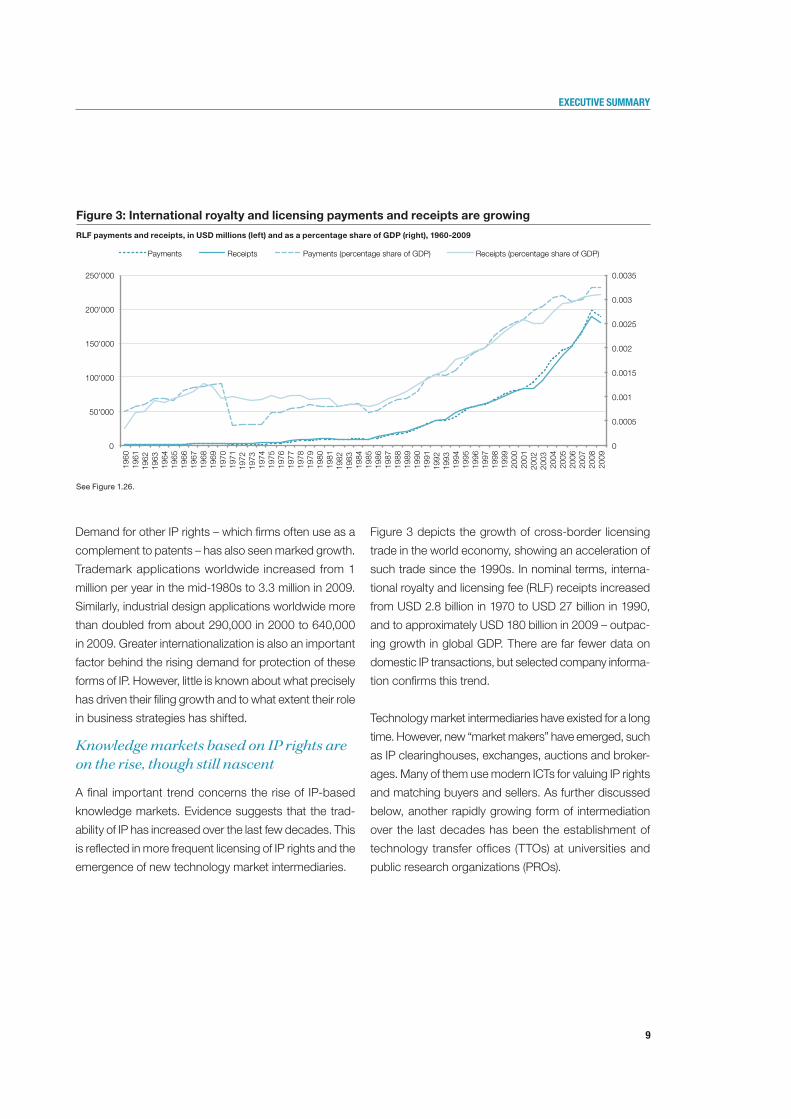
Figure 3 depicts the growth of cross-border licensing
trade in the world economy, showing an acceleration of
such trade since the 1990s. In nominal terms, interna-
tional royalty and licensing fee (RLF) receipts increased
from USD 2.8 billion in 1970 to USD 27 billion in 1990,
and to approximately USD 180 billion in 2009 – outpac-
ing growth in global GDP. There are far fewer data on
domestic IP transactions, but selected company informa-
tion confirms this trend.
Technology market intermediaries have existed for a long
time. However, new “market makers” have emerged, such
as IP clearinghouses, exchanges, auctions and broker-
ages. Many of them use modern ICTs for valuing IP rights
and matching buyers and sellers. As further discussed
below, another rapidly growing form of intermediation
over the last decades has been the establishment of
technology transfer offices (TTOs) at universities and
public research organizations (PROs).
0
0.0005
0.001
0.0015
0.002
0.0025
0.003
0.0035
0
50'000
100'000
150'000
200'000
250'000
1960
19
61
1962
19
63
1964
19
65
1966
19
67
1968
19
69
1970
19
71
1972
19
73
1974
19
75
1976
19
77
1978
19
79
1980
19
81
1982
19
83
1984
19
85
1986
19
87
1988
19
89
1990
19
91
1992
19
93
1994
19
95
1996
19
97
1998
19
99
2000
20
01
2002
20
03
2004
20
05
2006
20
07
2008
20
09
Payments Receipts Payments (percentage share of GDP) Receipts (percentage share of GDP)
Figure 3: International royalty and licensing payments and receipts are growing
RLF payments and receipts, in USD millions (left) and as a percentage share of GDP (right), 1960-2009
See Figure 1.26.
eXeCUTIVe SUMMArY

10
While only limited analysis is available on the size and
scope of actual IP transactions, the available evidence
on patent licensing, auctions and other IP-based transac-
tions suggests that trading activity remains at incipient
levels. For example, firms typically license less than 10
percent of their patents. Certainly, technology markets
are still small relative to the revenue of firms’ or the overall
output of economies. However, they increasingly shape
how innovation takes place and therefore deserve care-
ful attention.
Many of the above-outlined changes in the innovation
landscape are challenging long-standing business prac-
tices. Firms need to adapt in order to remain competitive.
But do these changes also require a rethinking of the
policy framework for innovation? This question is at the
heart of the remainder of the Report. The Report first of-
fers a general introduction to the economic literature on
how IP protection affects innovation; it asks, in particular,
how the views of economists have changed in the last
few decades (Chapter 2). It then returns to the theme
of collaboration, first looking at collaborative practices
between firms (Chapter 3) and then at collaboration be-
tween public research institutions and firms (Chapter 4).
How have economists’ views on IP protection evolved?Understanding how IP protection affects innovative be-
havior has long been a fertile field in economic research.
Important insights from the past still shape how econo-
mists view the IP system today. Above all, compared to
other innovation policies, IP protection stands out in that
it mobilizes decentralized market forces to guide R&D
investment. This works especially well where private
motivation to innovate aligns with society’s technological
needs, where solutions to technological problems are
within sight, and where firms can finance upfront R&D
investment. In addition, the effectiveness of different IP
instruments depends on the absorptive and innovative
capacity of firms, which varies considerably across
countries at different levels of economic development.
Difficult trade-offs exist in designing IP rights, not least be-
cause IP protection has multifaceted effects on innovative
behavior and market competition. As technologies ad-
vance and business models shift, optimally balancing these
trade-offs represents a continuing high-stakes challenge.
In more recent history, economists have refined their
view of the IP system – partly as a result of new research
and partly due to real world developments. The patent
system has received particular attention.
Patent portfolio races complicate cumulative innovation processes
Economists have long recognized that innovation seldom
happens in isolation; one firm’s solution to a problem
typically relies on insights gained from previous innova-
tion. Similarly, in competitive markets, firms innovate
simultaneously and develop technologies that may
complement each other. The rapid increase in the number
of patent filings has, in turn, raised concerns about pat-
ents hindering cumulative innovation. Indeed, patenting
activity has grown especially fast for so-called complex
technologies. Economists define complex technologies
as those that consist of numerous separately patentable
inventions with possibly widespread patent ownership;
discrete technologies, by contrast, describe products or
processes made up of only a few patentable inventions.
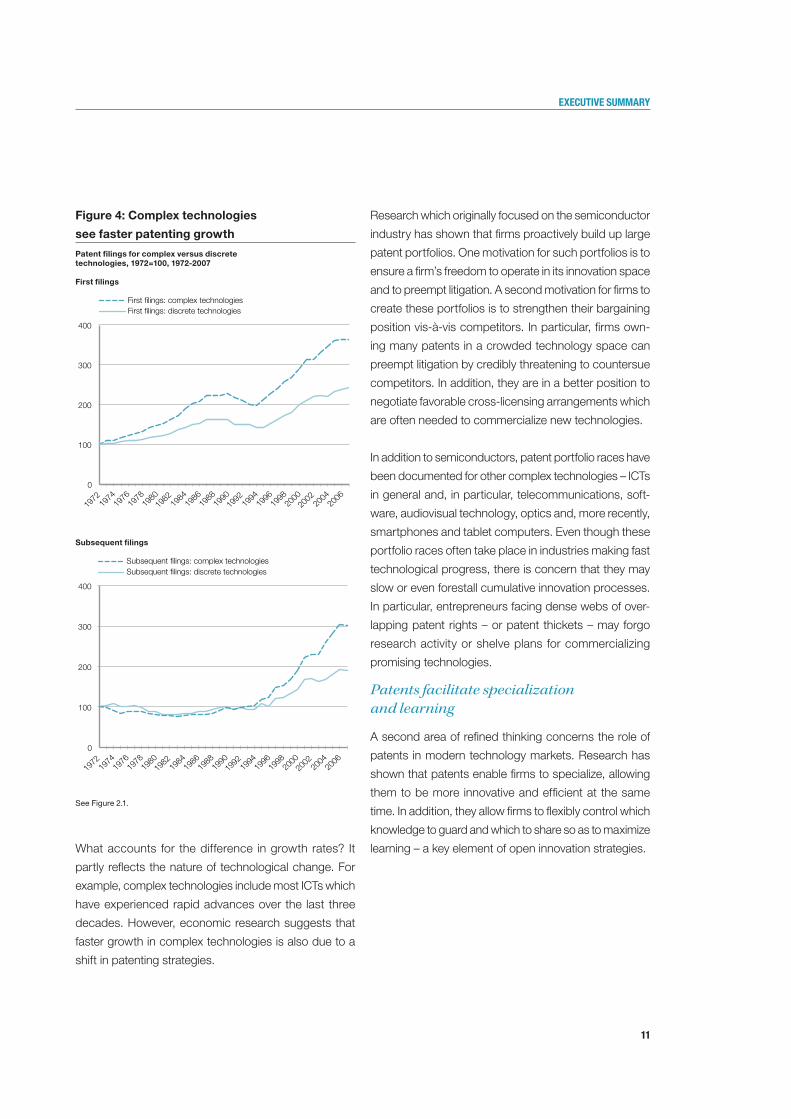
Figure 4 shows that complex technologies have seen
faster growth in patent applications worldwide.
eXeCUTIVe SUMMArY
11
Figure 4: Complex technologies
see faster patenting growth
Patent filings for complex versus discrete technologies, 1972=100, 1972-2007
First filings
Subsequent filings
See Figure 2.1.
What accounts for the difference in growth rates? It
partly reflects the nature of technological change. For
example, complex technologies include most ICTs which
have experienced rapid advances over the last three
decades. However, economic research suggests that
faster growth in complex technologies is also due to a
shift in patenting strategies.
Research which originally focused on the semiconductor
industry has shown that firms proactively build up large
patent portfolios. One motivation for such portfolios is to
ensure a firm’s freedom to operate in its innovation space
and to preempt litigation. A second motivation for firms to
create these portfolios is to strengthen their bargaining
position vis-à-vis competitors. In particular, firms own-
ing many patents in a crowded technology space can
preempt litigation by credibly threatening to countersue
competitors. In addition, they are in a better position to
negotiate favorable cross-licensing arrangements which
are often needed to commercialize new technologies.
In addition to semiconductors, patent portfolio races have
been documented for other complex technologies – ICTs
in general and, in particular, telecommunications, soft-
ware, audiovisual technology, optics and, more recently,
smartphones and tablet computers. Even though these
portfolio races often take place in industries making fast
technological progress, there is concern that they may
slow or even forestall cumulative innovation processes.
In particular, entrepreneurs facing dense webs of over-
lapping patent rights – or patent thickets – may forgo
research activity or shelve plans for commercializing
promising technologies.
Patents facilitate specialization and learning
A second area of refined thinking concerns the role of
patents in modern technology markets. Research has
shown that patents enable firms to specialize, allowing
them to be more innovative and efficient at the same
time. In addition, they allow firms to flexibly control which
knowledge to guard and which to share so as to maximize
learning – a key element of open innovation strategies.
0
100
200
300
400
1972
19
74
1976
1978
1980
1982
19
84
1986
1988
1990
1992
19
94
1996
1998
2000
2002
20
04
2006
First lings: complex technologies First lings: discrete technologies
0
100
200
300
400
1972
19
74
1976
1978
1980
1982
19
84
1986
1988
1990
1992
19
94
1996
1998
2000
2002
20
04
2006
Subsequent lings: complex technologies Subsequent lings: discrete technologies
eXeCUTIVe SUMMArY
12
Such learning can also take place when patents are
disclosed to the public. Little evidence is available on the
value of patent disclosure, although some surveys have
revealed that published patents are indeed an important
knowledge source for firms conducting R&D – more
so in Japan than in the US and Europe. Yet, the patent
literature represents a valuable source of knowledge
for creative minds anywhere in the world. In addition,
the easy availability of millions of patent documents to
anyone connected to the Internet has arguably created
new catch-up opportunities for technologically less
developed economies.
Well-functioning patent institutions are crucial
Finally, economic research has come to recognize the
crucial role played by patent institutions in shaping in-
novation incentives. Patent institutions perform the es-
sential tasks of ensuring the quality of patents granted
and providing balanced dispute resolution.
Unprecedented levels of patenting have put these institu-
tions under considerable pressure. Many patent offices
have seen growing backlogs of pending applications. In
2010, the number of unprocessed applications world-
wide stood at 5.17 million. In absolute terms, the patent
offices of Japan and the US as well as the European
Patent Office account for the largest office backlogs.
However, relative to annual application flows, several
offices in middle-income countries face the most sub-
stantial backlogs. The increasing size and complexity
of patent applications have added to the “examination
burden” of offices.
The choices patent offices face can have far-reaching
consequences on incentives to innovate. These include
the amount of fees to charge, how to involve third par-
ties in the patenting process, how best to make use of
ICTs and the level and type of international cooperation
to pursue. In making these choices, a key challenge is to
reconcile incentives for efficient office operations with a
patenting process that promotes society’s best interest.
Do markets forces optimally balance collaboration and competition?
Firms increasingly look beyond their own boundaries to
maximize their investment in innovation. They collaborate
with other firms – either in the production of IP or on the
basis of IP ownership in commercializing innovation.
Collaboration can benefit firms and society
Joint IP production occurs through R&D alliances, in
particular contractual partnerships and equity-based
joint ventures. Data on such alliances are limited and
sometimes difficult to interpret, but they suggest that
firms in the ICT, biotechnology and chemical industries
most frequently enter into such alliances.
Joining forces with competitors offers several benefits.
A firm can learn from the experience of others, reduce
costs by dividing efforts, share risk and coordinate with
producers of complementary goods. Society usually
benefits from such collaboration as it enhances the ef-
ficiency and effectiveness of the innovation process.
Collaboration between firms extends beyond the joint
production of IP. In many cases, firms only join forces
when, or even after, they commercialize their technolo-
gies. As explained above, the fast growth of patenting in
complex technologies has given rise to patent thickets,
whereby patent rights are distributed over a fragmented
base of patent holders. Those seeking to introduce
products that use such technologies face the high cost
of negotiating with multiple parties. If each technology
is essential, a negotiation failure with any of the patent
holders amounts to a failure with all.
eXeCUTIVe SUMMArY
13
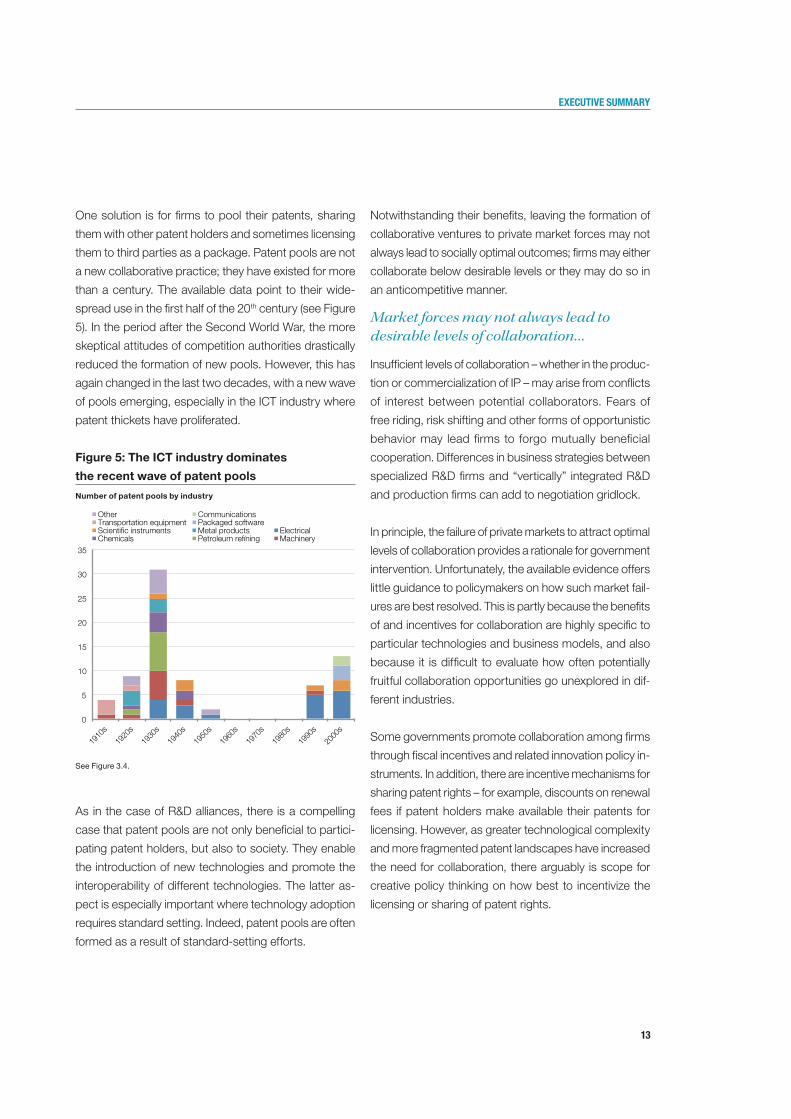
One solution is for firms to pool their patents, sharing
them with other patent holders and sometimes licensing
them to third parties as a package. Patent pools are not
a new collaborative practice; they have existed for more
than a century. The available data point to their wide-
spread use in the first half of the 20th century (see Figure
5). In the period after the Second World War, the more
skeptical attitudes of competition authorities drastically
reduced the formation of new pools. However, this has
again changed in the last two decades, with a new wave
of pools emerging, especially in the ICT industry where
patent thickets have proliferated.
Figure 5: The ICT industry dominates
the recent wave of patent pools
Number of patent pools by industry
See Figure 3.4.
As in the case of R&D alliances, there is a compelling
case that patent pools are not only beneficial to partici-
pating patent holders, but also to society. They enable
the introduction of new technologies and promote the
interoperability of different technologies. The latter as-
pect is especially important where technology adoption
requires standard setting. Indeed, patent pools are often
formed as a result of standard-setting efforts.
Notwithstanding their benefits, leaving the formation of
collaborative ventures to private market forces may not
always lead to socially optimal outcomes; firms may either
collaborate below desirable levels or they may do so in
an anticompetitive manner.
Market forces may not always lead to desirable levels of collaboration…
Insufficient levels of collaboration – whether in the produc-
tion or commercialization of IP – may arise from conflicts
of interest between potential collaborators. Fears of
free riding, risk shifting and other forms of opportunistic
behavior may lead firms to forgo mutually beneficial
cooperation. Differences in business strategies between
specialized R&D firms and “vertically” integrated R&D
and production firms can add to negotiation gridlock.
In principle, the failure of private markets to attract optimal
levels of collaboration provides a rationale for government
intervention. Unfortunately, the available evidence offers
little guidance to policymakers on how such market fail-
ures are best resolved. This is partly because the benefits
of and incentives for collaboration are highly specific to
particular technologies and business models, and also
because it is difficult to evaluate how often potentially
fruitful collaboration opportunities go unexplored in dif-
ferent industries.
Some governments promote collaboration among firms
through fiscal incentives and related innovation policy in-
struments. In addition, there are incentive mechanisms for
sharing patent rights – for example, discounts on renewal
fees if patent holders make available their patents for
licensing. However, as greater technological complexity
and more fragmented patent landscapes have increased
the need for collaboration, there arguably is scope for
creative policy thinking on how best to incentivize the
licensing or sharing of patent rights.
0
5
10
15
20
25
30
35
1910
s
1920
s
1930
s
1940
s
1950
s
1960
s
1970
s
1980
s
1990
s
2000
s
Other Transportation equipment Scienti c instruments Metal products
Petroleum re ning Chemicals
Communications Packaged software
ElectricalMachinery
eXeCUTIVe SUMMArY

14
… and they may sometimes result in anticompetitive practices
The problem of anticompetitive collaborative practices
seems to be easier to address from a policymaker’s
viewpoint. Such practices are generally more observable,
and authorities can assess the competitive effects of
collaborative agreements on a case-by-case basis.
In addition, some consensus exists about the type of
collaborative practices that should not be allowed or
that, at the least, trigger warning signs. Nonetheless,
evaluating the competitive effects of specific collaborative
agreements remains challenging. Technologies move fast,
and their market impact is uncertain. In addition, many
low- and middle-income countries have less developed
institutional frameworks for enforcing competition law
in this area – although they are likely to benefit from
the enforcement actions of high-income countries,
where most collaborative agreements with global reach
are concluded.
How to harness public research for innovationUniversities and PROs play a key role in national inno-
vation systems. Beyond their mission to educate, they
account for substantial shares of total R&D spending.
They also perform most of the basic research carried
out in their countries. This is especially so in middle-
income countries; for example, the share of universities
and PROs in total basic research is close to 100 percent
for China, 90 percent for Mexico and 80 percent for the
Russian Federation.
Close interaction with public research helps firms to
monitor scientific advances that are likely to transform
technologies. It also facilitates joint problem solving and
opens up new avenues for research.
Public-private knowledge exchanges occur through a
number of channels. One is the creation of IP in the public
sector that is licensed to firms for commercial development.
Public policies have encouraged the commercialization of scientific knowledge…
The last three decades have seen the emergence of
targeted policy initiatives to incentivize university and PRO
patenting, and subsequent commercial development.
Almost all high-income countries now have institutional
frameworks to this effect. One general trend has been
for universities and PROs to take institutional ownership
of the inventions researchers generate, and to pursue
their commercialization through TTOs. More recently, a
number of middle- and low-income countries have also
explored how technology transfer and the development
of industry-university collaboration are best promoted.
… leading to rapid growth in patenting by universities and PROs
Accordingly, there has been a marked increase in patent
applications by universities and PROs – both in absolute
terms and as a share of total patents filed. Figure 6 depicts
this trend for international patent filings under the Patent
Cooperation Treaty (PCT) system.
High-income countries have been responsible for most
of the university and PRO filings under the PCT. However,
such filings have also grown rapidly in certain middle-
income countries. Among them, China leads in terms
of university applications, followed by Brazil, India and
South Africa. Compared to university patenting, the dis-
tribution of middle-income country PRO filings is more
concentrated. Chinese and Indian PROs alone account
for 78 percent of the total. They are followed by PROs
from Malaysia, South Africa and Brazil.
National patent statistics confirm the prominence of uni-
versity patenting in China; they also reveal a high share
of PRO patenting for India (see Figure 7).
eXeCUTIVe SUMMArY

15
Figure 6: University and PRO patenting is on the rise
World PRO and university PCT applications, absolute numbers (left) and as a percentage of total PCT applications (right), 1980-2010
See Figure 4.3
0
1
2
3
4
5
6
7
0
2'000
4'000
6'000
8'000
10'000
1980
1981
1982
1983
19
84
1985
1986
1987
1988
1989
1990
1991
1992
1993
19
94
1995
1996
1997
1998
1999
2000
2001
2002
2003
20
04
2005
2006
2007
2008
2009
2010
Sha
re in
tota
l PC
T ap
plic
atio
ns (%
)
Num
ber
of P
CT
appl
icat
ions
University PRO
University share PRO share
Figure 7: University and PRO patenting is prominent in China and India
University and PRO patent applications as a share of total national applications for selected countries, in percent, for different time spans
See Figure 4.10
0%
2%
4%
6%
8%
10%
12%
14%
16%
China
Spain
Mexico
Moroc
co
Israe
l UK
Brazil
India US
Rep. o
f Kor
ea
Italy
Japa
n
German
y
South
Africa
Fran
ce
University share PRO share
Indian PROs stand at 22 percent. Capped for better readability of the gure
eXeCUTIVe SUMMArY
16
Universities and PROs have also experienced growth in
licensing revenue. This growth has occurred from low
initial levels and is still fairly concentrated; only selected
institutions, few scientific fields and a small number
of patents account for the bulk of licensing revenue.
Compared to overall public research budgets, licensing
income remains small. In low- and middle-income coun-
tries, university and PRO patents are used even less for
technology transfer. However, recent trends suggest that
revenue flows are diversifying, in terms of both the number
of beneficiary institutions and the number of countries.
Policy reforms have multifaceted effects on research institutions, firms, the science system and the economy – yet important lessons are emerging
Reforms aimed at incentivizing university and PRO
patenting and licensing have multifaceted effects on
research institutions and firms but also, more broadly,
on the science system and on economic growth. The
evidence – mostly focusing on high-income countries –
yields the following broad conclusions:
• Patentingcanmakeanimportantdifferenceinwid-
ening opportunities for commercializing university
inventions. Turning academic ideas into innovation
often requires substantial private investment in de-
velopment.
• Thereareimportantsynergiesbetweenscientists’aca-
demic activity and their interactions with private firms.
Such interactions not only take place through the licens-
ing of patents, but also through R&D collaboration, con-
ference participation and scientific publishing. Indeed,
the evidence suggests that the various channels of
technology transfer complement each other. For ex-
ample, researchers may find that their patenting activity
usefully informs their scientific activity, and vice-versa.
• Studieshavepointedtoseveralsuccessfulelementsof
institutional design. Well-defined university regulations
on IP ownership and on the participation of research-
ers in technology transfer matter. Performance incen-
tives for researchers need to appropriately balance
entrepreneurial activity and scientific achievement.
Finally, TTOs operating at a sufficient scale and helping
to standardize relationships with licensees can lower
the transaction costs of technology transfer.
• Theevidenceismoreambiguousastothebestown-
ership model for public research. While the general
trend has been towards institutional ownership, it is
not clear whether this model is necessarily superior
to others.
• Settingupsuccessful frameworks for technology
transfer that deliver tangible benefits takes time and
resources. In particular, it not only requires legal
reforms, but also cultural change and the creation of
new institutions.
Legitimate concerns exist about the potentially negative
effects that patenting and other entrepreneurial activity
by researchers may have on scientific performance.
• Reducedknowledgesharingamongscientistsand
crowding-out of scientific research are often-cited
downsides. The evidence on these effects is ambigu-
ous, although it does not suggest radically negative
effects. Much depends on researchers’ performance
incentives. Moreover, interactions with the private
sector can lead to improved scientific performance.
• Anothersourceofconcern is thatuniversityand
PRO patenting may reduce the diversity of follow-on
research and access to essential research tools. A
few studies confirm this concern. However, most of
the evidence to this effect is case-specific and limited
to the life sciences.
eXeCUTIVe SUMMArY
17
Many of these conclusions are likely to apply to low- and
middle-income economies as they do to high-income
economies. However, the different environment in which
innovation takes place in these economies raises ad-
ditional questions.
One is the extent to which greater university and PRO
patenting in richer countries may reduce poorer countries’
access to key technologies and international scientific
cooperation. Another is whether the weaker absorptive
capacity of firms and more limited science-industry link-
ages would favor channels of technology transfer other
than IP-based licensing. Different stages of development
and different innovation systems require tailor-made
approaches to IP-based incentives for commercializing
public research.
Only limited guidance is available to policymakers on
these questions. At the same time, high-income countries
still struggle with many of the same challenges. There is
no perfect blueprint that lends itself to universal adoption.
This caveat also extends to the development of safe-
guards against the potentially negative consequences
of university and PRO patenting. Selected institutions
have pioneered such safeguards; however, it is too early
to fully assess their effectiveness.
ConclusionThe evidence presented in this Report is intended to in-
form policymakers. While some innovation trends are well
understood, others are not. The Report points to a num-
ber of areas where more statistical data and new investi-
gations could offer fresh insights relevant to policymaking.
Surely, the face of innovation will further evolve in the
coming years and decades. Some trends are bound to
continue – above all the shifting geography of innovation.
Others will come as a surprise. An unvarnished look at
today’s evidence and policy challenges – as attempted
in this Report – will hopefully stimulate thought on how
best to manage the future.
eXeCUTIVe SUMMArY
18
cHAPteR 1The changing nature of innovation and intellectual property
1.1Innovation as the driving force behind economic growth and development 23
1.2The shifting nature of innovation 27
1.2.1 Globalization of production and demand for innovation 29
1.2.2 Increased investment in innovation 33
1.2.3 Internationalization of science and innovation 36
1.2.4 The importance of non-R&D-based innovation 42
1.2.5 Greater collaboration in the process of innovation 43
1.3Shifting importance of IP 52
1.3.1 Demand and the changing geography of the IP system 52
1.3.2 Increased tradability of IP 60
1.3.3 New collaborative mechanisms and IP intermediaries 66
1.3.4 Emergence of new IP policies and practices 67
1.4Conclusions and directions for future research 68References 70
tAble oF contents
19
TAble oF ConTenTS
cHAPteR 2The economics of intellectual property – old insights and new evidence
2.1Understanding IP rights and their role in the innovation process 75
2.1.1 How IP protection shapes innovation incentives 77
2.1.2 Trade-offs in designing IP rights 80
2.1.3 How IP protection compares to other innovation policies 82
2.2Taking a closer look at the patent system 86
2.2.1 How patent protection affects firm performance 86
2.2.2 How patent strategies shift where innovation is cumulative 89
2.2.3 How patent rights shape the interplay between competition and innovation 92
2.2.4 The role patents play in technology markets and open innovation strategies 94
2.3Appreciating the role of patent institutions 97
2.3.1 What makes for sound patent institutions 97
2.3.2 How patenting trends have challenged patent offices 98
2.3.3 The choices patent institutions face 100
2.4Conclusions and directions for future research 103References 105
20
cHAPteR 3Balancing collaboration and competition3.1Collaborating to generate new IP 109
3.1.1 What the available data says about formal R&D collaboration 110
3.1.2 Why firms collaborate for strategic reasons 114
3.1.3 How collaboration can improve efficiency 115
3.1.4 The complications that arise in joint R&D undertakings 116
3.1.5 How collaboration differs in the case of open source software 118
3.2Collaborating to commercialize existing IP 120
3.2.1 Why complementarities require coordination 120
3.2.2 How firms collaborate in patent pools 121
3.2.3 Why patent pools are emerging in the life sciences 125
3.2.4 How firms cooperate to set standards 126
3.3Safeguarding competition 129
3.3.1 The type of collaborative R&D alliances that may be considered anticompetitive 130
3.3.2 How competition rules treat patent pools and standard-setting agreements 131
3.4Conclusions and directions for future research 132References 134Data Annex 136
TAble oF ConTenTS
21
cHAPteR 4Harnessing public research for innovation – the role of intellectual property4.1The evolving role of universities and PROs in national innovation systems 140
4.1.1 Public R&D is key, in particular for basic research 140
4.1.2 Public R&D stimulates private R&D and innovation 141
4.1.3 Fostering the impact of publicly-funded research on innovation 143
4.2Public research institutions’ IP comes of age 144
4.2.1 Developing policy frameworks for technology transfer 144
4.2.2 Measuring the increase in university and PRO patenting 146
4.2.3 University and PRO licensing growing but from low levels 153
4.3Assessment of impacts and challenges in high-income countries 156
4.3.1 Direction of impacts 156
4.3.2 Impacts and experiences in high-income countries 159
4.4IP-based technology transfer and the case of low- and middle-income countries 168
4.4.1 Impacts of high-income technology transfer legislation on low- and middle-income countries 169
4.4.2 Challenges to home-grown technology transfer in low- and middle-income countries 170
4.5New university policies act as safeguards 172
4.6Conclusions and directions for future research 174References 176Data annex 179Methodological annex 181 Acronyms 183
TAble oF ConTenTS

23
Chapter 1 the Changing faCe of innovation and intelleCtual property
cHAPteR 1tHe cHAngIng FAce oF InnoVAtIon And IntellectUAl PRoPeRtYInnovation is a central driver of economic growth and
development. Firms rely on innovation and related invest-
ments to improve their competitive edge in a globalizing
world with shorter product life cycles. Innovation also has
the potential to mitigate some of the emerging problems
related to health, energy and the environment faced by
both richer and poorer countries. Overcoming barriers to
innovation is hence a recurring and increasingly promi-
nent business and policy challenge.
At the same time, our understanding of innovative activity,
the process of innovation itself and the role of IP within
that process are in flux. Among the factors that have influ-
enced innovation over the last two decades are structural
shifts in the world economy, the steady globalization of
innovative activity, the rise in new innovation actors and
new ways of innovating.
This chapter assesses the changing face of innovation
and the corresponding new demands on the intellectual
property (IP) system. The first section sets out the central
role of innovation, while the second describes what has
been labeled a new “innovation paradigm”. The third
section discusses the implications of this for IP.
1.1Innovation as the driving force behind economic growth and development
Although there is not one uniquely accepted definition,
innovation is often defined as the conversion of knowl-
edge into new commercialized technologies, products
and processes, and how these are brought to market.1
Innovation often makes existing products and processes
obsolete, leading to firms’ entry, exit and associated en-
trepreneurship.
In recent decades, economists and policymakers have
increasingly focused on innovation and its diffusion as
critical contributors to economic growth and develop-
ment.2 Investments meant to foster innovation, such
as spending on research and development (R&D), are
found to generate positive local and cross-border im-
pacts, which play an important role in the accumulation
of knowledge. In other words, thanks to these so-called
“spillovers” the benefits of innovative activity are not only
restricted to firms or countries that invest in innovation.
While the importance of “creative destruction” was high-
lighted in the early 20th century, more recent economic
work stresses the role that various factors play in driving
long-run growth and productivity.3 These include not
only formal investment in innovation such as R&D, but
also learning-by-doing, human capital and institutions.
1 The Oslo Manual defines four types of innovation:
product innovation (new goods or services or
significant improvements to existing ones), process
innovation (changes in production or delivery
methods), organizational innovation (changes in
business practices, workplace organization or in a
firm’s external relations) and marketing innovation
(changes in product design, packaging, placement,
promotion or pricing) (OECD & Eurostat, 2005).
2 For some examples of the classic literature in
this field, see Edquist (1997); Freeman (1987);
Lundvall (1992); and Fagerberg et al. (2006).
3 See Schumpeter (1943). The endogenous growth
models and quality ladder models theorize that
innovation drives long-run aggregate productivity
and economic growth. See Grossman and Helpman
(1994); Romer (1986); Romer (2010); Grossman and
Helpman (1991); and Aghion and Howitt (1992).
24
Chapter 1 the Changing faCe of innovation and intelleCtual property
A voluminous empirical literature has examined the re-
lationship between innovative activity and productivity
growth at the firm-, industry- and country-level. However,
due to data limitations, earlier empirical work in this area
mostly relied on two imperfect measures of innovation,
namely R&D spending and patent counts. In recent years,
innovation surveys and accounting exercises relating to
the measurement of intangible assets have emerged as
new sources of data (see Boxes 1.1 and 1.2).
Most empirical studies on the relationship between in-
novation and productivity have focused solely on high-
income economies and the manufacturing sector. As
early as the mid-1990s, the economic literature suggested
that innovation accounted for 80 percent of productivity
growth in high-income economies; whereas productivity
growth, in turn, accounted for some 80 percent of gross
domestic product (GDP) growth.4 More recent studies
at the country-level demonstrate that innovation – as
measured by an increase in R&D expenditure – has a
significant positive effect on output and productivity.5
At the firm-level, there is emerging but increasingly solid
evidence that demonstrates the positive links between
R&D, innovation and productivity in high-income coun-
tries.6 Specifically, these studies imply a positive relation-
ship between innovative activity by firms and their sales,
employment and productivity.7 Innovative firms are able to
increase efficiency and overtake less efficient firms. Firms
that invest in knowledge are also more likely to introduce
new technological advances or processes, yielding in-
creased labor productivity. In addition, a new stream of
research stresses the role of investing in intangible assets
for increased output and multifactor productivity growth
(see Box 1.1).8 While it is assumed that process innovation
has a direct effect on a firm’s labor productivity, this is
harder to measure.9
Clearly, the causal factors determining the success
and impact of innovation at the firm-level are still under
investigation. An increase in a firm’s R&D expenditure
or the introduction of process innovation alone will not
automatically generate greater productivity or sales.
Many often connected factors inherent in the firm or its
environment contribute to and interact in improving a
firm’s performance.
4 See Freeman (1994).
5 For an overview, see Khan and Luintel
(2006) and newer studies at the firm level,
such as Criscuolo et al. (2010).
6 See, for instance, Crepon et al. (1998);
Griffith et al. (2006); Mairesse and
Mohnen (2010); and OECD (2010a).
7 See Evangelista (2010); OECD (2010a); OECD
(2009c); Guellec and van Pottelsberghe de la Potterie
(2007); and Benavente and Lauterbach (2008).
8 See OECD (2010b).
9 See Hall (2011).
25
Chapter 1 the Changing faCe of innovation and intelleCtual property
Furthermore, innovation-driven growth is no longer the
prerogative of high-income countries.13 The technology
gap between middle-income and high-income countries
has narrowed (see Section 1.2).14 In recent years, it has
been shown that catch-up growth – and more generally
the spread of technology across countries – can now hap-
pen faster than ever before. This has been exemplified by
countries such as the Republic of Korea and later China.15
Differences in innovative activity and related techno-
logical gaps between countries are a significant factor
in explaining cross-country variation in income and pro-
ductivity levels.16 According to several studies, roughly
half of cross-country differences in per capita income
and growth can be explained by differences in total fac-
tor productivity, a measure of an economy’s long-term
technological change or dynamism.17 In addition, the
variation in the growth rate of GDP per capita is shown
to increase with the distance from the technology frontier.
Countries with fewer technological and inventive capa-
bilities generally see lower and more diverse economic
growth than do richer countries.
As a result, reducing income gaps between economies
is directly linked to improved innovation performance,18
which is in part driven by spillovers from high-income to
other economies. In other words, total factor productiv-
ity depends to a large degree on the ability of countries,
industries or firms to adopt technologies and production
techniques of countries and firms with higher levels of
technological development.
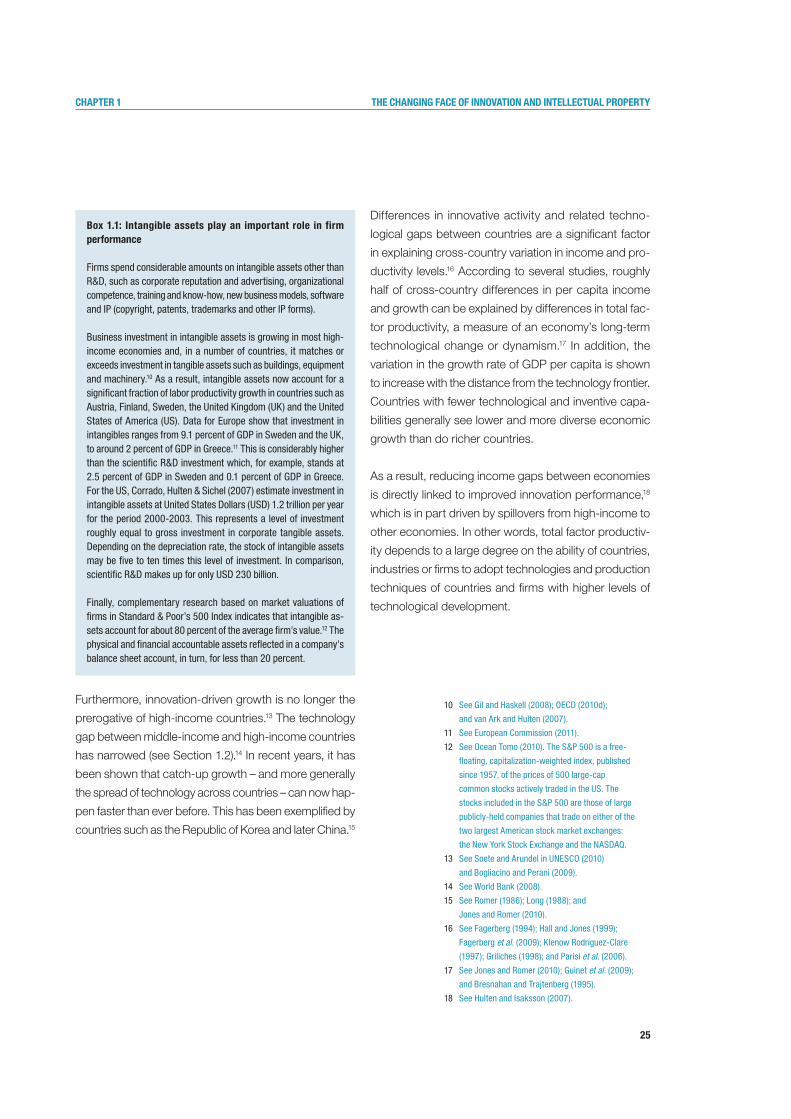
box 1.1: Intangible assets play an important role in firm performance
Firms spend considerable amounts on intangible assets other than R&D, such as corporate reputation and advertising, organizational competence, training and know-how, new business models, software and IP (copyright, patents, trademarks and other IP forms).
Business investment in intangible assets is growing in most high-income economies and, in a number of countries, it matches or exceeds investment in tangible assets such as buildings, equipment and machinery.10 As a result, intangible assets now account for a significant fraction of labor productivity growth in countries such as Austria, Finland, Sweden, the United Kingdom (UK) and the United States of America (US). Data for Europe show that investment in intangibles ranges from 9.1 percent of GDP in Sweden and the UK, to around 2 percent of GDP in Greece.11 This is considerably higher than the scientific R&D investment which, for example, stands at 2.5 percent of GDP in Sweden and 0.1 percent of GDP in Greece. For the US, Corrado, Hulten & Sichel (2007) estimate investment in intangible assets at United States Dollars (USD) 1.2 trillion per year for the period 2000-2003. This represents a level of investment roughly equal to gross investment in corporate tangible assets. Depending on the depreciation rate, the stock of intangible assets may be five to ten times this level of investment. In comparison, scientific R&D makes up for only USD 230 billion.
Finally, complementary research based on market valuations of firms in Standard & Poor’s 500 Index indicates that intangible as-sets account for about 80 percent of the average firm’s value.12 The physical and financial accountable assets reflected in a company's balance sheet account, in turn, for less than 20 percent.
10 See Gil and Haskell (2008); OECD (2010d);
and van Ark and Hulten (2007).
11 See European Commission (2011).
12 See Ocean Tomo (2010). The S&P 500 is a free-
floating, capitalization-weighted index, published
since 1957, of the prices of 500 large-cap
common stocks actively traded in the US. The
stocks included in the S&P 500 are those of large
publicly-held companies that trade on either of the
two largest American stock market exchanges:
the New York Stock Exchange and the NASDAQ.
13 See Soete and Arundel in UNESCO (2010)
and Bogliacino and Perani (2009).
14 See World Bank (2008).
15 See Romer (1986); Long (1988); and
Jones and Romer (2010).
16 See Fagerberg (1994); Hall and Jones (1999);
Fagerberg et al. (2009); Klenow Rodríguez-Clare
(1997); Griliches (1998); and Parisi et al. (2006).
17 See Jones and Romer (2010); Guinet et al. (2009);
and Bresnahan and Trajtenberg (1995).
18 See Hulten and Isaksson (2007).
26
Chapter 1 the Changing faCe of innovation and intelleCtual property
These spillovers are frequently driven by knowledge
acquired through channels such as foreign direct invest-
ment (FDI), trade, licensing, joint ventures, the presence
of multinationals, migration and/or collaboration with firms
from higher-income countries.19 Strategies for acquiring,
adapting, imitating and improving technologies and exist-
ing techniques in relation to local conditions are key for
innovation. Developing innovative capacity requires com-
plementary in-house innovation activity (see Box 2.2).20
In addition, certain framework conditions, adequate hu-
man capital and absorptive capacity are necessary at the
country- and firm-level in order to benefit from innovation
spillovers. The literature refers to the necessary presence
of functioning “national innovation systems” with linkages
between innovation actors and a government policy that
underpins innovation activity.21
On the whole, however, too little is known about how
innovation takes place in lesser developed economies,
how it diffuses and what its impacts are.
That does not mean that no evidence in this area ex-
ists. Surveys confirm that innovation – understood
broadly – occurs frequently in low- and middle-income
economies.22 The literature concludes that the impacts
of innovation can be proportionately much greater in
these economies than in high-income economies. In
particular, cumulative innovation – incremental innova-
tion where one builds on existing products, process-
es and knowledge (see Subsection 2.2.2) – is shown
to have a significant social and economic impact.23
As firms in less developed economies are, at times, far from
the technology frontier, they have dissimilar technological
requirements and innovate differently. Process innovation
and incremental product innovation play a more important
role in firm performance than does product innovation.
Improvements in maintenance, engineering or quality con-
trol, rather than fresh R&D investment, are often the drivers
of innovation. Recent examples in Africa or other low-
income economies such as Bangladesh or Rwanda show
that local firms or other organizations introduce novel prod-
uct or process innovation in fields such as finance (e-bank-
ing), telecommunications, medical technologies and others.
In conclusion, the relationship between innovation and
productivity in less developed economies is not clear-cut.
Studies do not always find that technological innovation
impacts on productivity, in particular where a narrow defi-
nition of product-based technological innovation is used.24
A few studies on China and certain Asian countries con-
ducted at the aggregate country-level even conclude that
factor accumulation, rather than productivity increases,
explains the majority of the recent growth.25
Firm-level studies conducted in lower- and middle-income
economies – mainly done for Asia and Latin America – do
in turn provide evidence for the strong positive relationship
between innovation and productivity, or innovation and
exports, as long as innovation is viewed more broadly
than technological product innovation. The literature also
concludes that firms in less developed economies that
invest in knowledge are better able to introduce new
technological advances, and that firms which innovate
have higher labor productivity than those that do not.
19 In the context of developing countries, particularly for
those in the early stages of development, technology
transfer from foreign high-income economies and
the spillover effects from foreign investment have
been considered the most important sources of
innovation, since most such countries lack the capital
and the skills to conduct state-of-the-art research.
20 See Cohen and Levinthal (1990).
21 See Jones and Romer (2010).
22 For full references and a discussion,
see Crespi and Zuñiga (2010).
23 See Fagerberg et al. (2010).
24 See the many country-specific studies of
Micheline Goedhuys and her co-authors at
http://ideas.repec.org/f/pgo205.html. 25 See Anton et al. (2006); Young (1993);
and Young (1995). This might, however,
have to do with measurement issues
related to embodied technologies.

27
Chapter 1 the Changing faCe of innovation and intelleCtual property
1.2The shifting nature of innovation
While there is consensus on the importance of innovation,
our understanding of innovative activity and the process
of innovation itself continue to change.
First, the way innovation is perceived and understood
has evolved over the last two decades. Previously,
economists and policymakers focused on R&D-based
technological product innovation, largely produced
in-house and mostly in manufacturing industries. This
type of innovation is performed by a highly educated
labor force in R&D-intensive companies with strong ties
to leading centers of excellence in the scientific world.26
The process leading to such innovation was conceptu-
alized as closed, internal and localized. Technological
breakthroughs were necessarily “radical” and took place
at the “global knowledge frontier”, without allowing for
the possibility of local variations or adaptations of existing
technologies. This also implied the existence of leading
and lagging countries – i.e., the “periphery” versus the
“core” – with low- or middle-income economies naturally
catching up to more advanced ones. According to this
view, firms from poorer countries were passive adopters
of foreign technologies.
Today, innovation capability has been seen less in terms
of the ability to discover new technological, state-of-
the-art inventions. The literature now emphasizes the
ability to exploit new technological combinations, the
notion of incremental innovation and “innovation without
research”.27 Furthermore, non-R&D-innovative expen-
diture, often part of later phases of development and
testing, is an important and necessary component of
reaping the rewards of technological innovation. Such
non-technological innovation activity is often related
to process, organizational, marketing, brand or design
innovation, technical specifications, employee training,
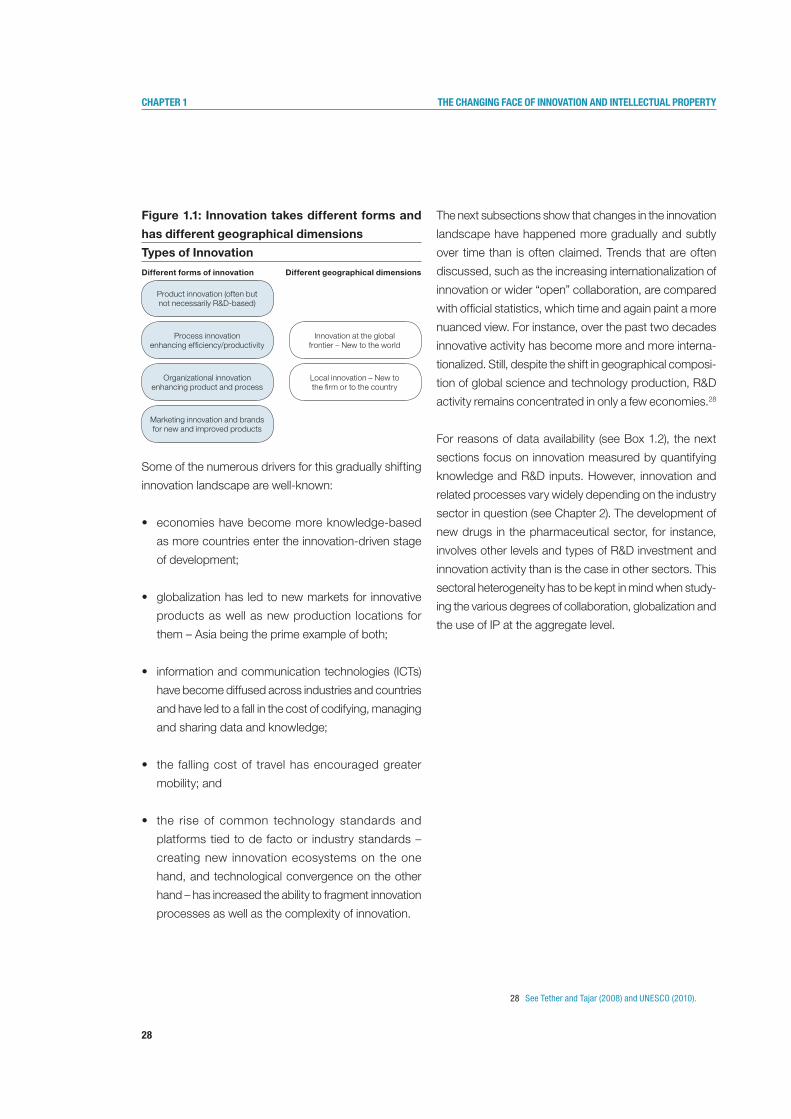
or logistics and distribution (see Figure 1.1, left column,
and Subsection 1.2.4).
There is also greater interest in understanding how inno-
vation takes place in low- and middle-income countries,
noting that incremental forms of innovation can impact
on development. This evolution in thought also recog-
nizes that existing notions of innovation are too focused
on frontier technologies and original innovation. While
innovation can take place at the global frontier, local in-
novation that is new to a firm or a country can be equally
important (see Figure 1.1, right column).
Second, the process of innovation has undergone sig-
nificant change. As part of a new innovation paradigm,
investment in innovation-related activity has consistently
intensified at the firm, country and global level, both in
terms of levels and shares of other investment, adding
new innovation actors from outside high-income econo-
mies. This shift has also led to a much more complex
structure of knowledge production activity, with innovative
activity more dispersed geographically and collaboration
on the rise, often in response to technological complexity.
26 See Fagerberg et al. (2010).
27 See David and Foray (2002).
28
Chapter 1 the Changing faCe of innovation and intelleCtual property
Figure 1.1: Innovation takes different forms and
has different geographical dimensions
Types of Innovation
Different forms of innovation Different geographical dimensions
Some of the numerous drivers for this gradually shifting
innovation landscape are well-known:
• economieshavebecomemoreknowledge-based
as more countries enter the innovation-driven stage
of development;
• globalizationhas ledtonewmarketsfor innovative
products as well as new production locations for
them – Asia being the prime example of both;
• informationandcommunicationtechnologies(ICTs)
have become diffused across industries and countries
and have led to a fall in the cost of codifying, managing
and sharing data and knowledge;
• the fallingcostof travelhasencouragedgreater
mobility; and
• the rise of common technology standards and
platforms tied to de facto or industry standards –
creating new innovation ecosystems on the one
hand, and technological convergence on the other
hand – has increased the ability to fragment innovation
processes as well as the complexity of innovation.
The next subsections show that changes in the innovation
landscape have happened more gradually and subtly
over time than is often claimed. Trends that are often
discussed, such as the increasing internationalization of
innovation or wider “open” collaboration, are compared
with official statistics, which time and again paint a more
nuanced view. For instance, over the past two decades
innovative activity has become more and more interna-
tionalized. Still, despite the shift in geographical composi-
tion of global science and technology production, R&D
activity remains concentrated in only a few economies.28
For reasons of data availability (see Box 1.2), the next
sections focus on innovation measured by quantifying
knowledge and R&D inputs. However, innovation and
related processes vary widely depending on the industry
sector in question (see Chapter 2). The development of
new drugs in the pharmaceutical sector, for instance,
involves other levels and types of R&D investment and
innovation activity than is the case in other sectors. This
sectoral heterogeneity has to be kept in mind when study-
ing the various degrees of collaboration, globalization and
the use of IP at the aggregate level.
Product innovation (often but not necessarily R&D-based)
Process innovation enhancing efficiency/productivity
Innovation at the global frontier – New to the world
Organizational innovation enhancing product and process
Local innovation – New to the firm or to the country
Marketing innovation and brands for new and improved products
28 See Tether and Tajar (2008) and UNESCO (2010).
29
Chapter 1 the Changing faCe of innovation and intelleCtual property
1.2.1Globalization of production and demand for innovation
The way research and production activities are orga-
nized has changed over the last two decades. This can
be partly attributed to greater integration and structural
changes in the global economy; the emergence of new
actors; and the ability of global firms to source scientific
capabilities in different locations. The demand for in-
novative products and processes has also become in-
ternationalized.
Structural changes in the global economy:
greater integration
Increasingly, multinational enterprises (MNEs) source
input and technology from suppliers worldwide. This
reflects a fragmentation of the production process in the
manufacturing and services industries, with increases
in task-based manufacturing, intermediate trade and
outsourcing of services. As a result, a greater number of
countries participate in global production and innovation
networks.31 Innovation networks have created a potential
for technological and organizational learning by manu-
facturers and exporters, leading to industrial upgrading.32
box 1.2: Measuring innovation remains challenging
Direct official measures that quantify innovation output are extremely scarce. For example, there are no official statistics on the amount of innovative activity – as defined as the number of new products, processes, or other innovations (see Section 1.1) – for any given in-novation actor or, let alone, any given country. This is particularly true when broadening the notion of innovation to include non-technological or local types of innovation. Most existing measures also struggle to appropriately capture the innovation output of a wider spectrum of innovation actors as mentioned above, for example the services sector, public entities, etc.
In the absence of such innovation metrics, science and technology (S&T) indicators or IP statistics have been used in the past as an approximate measure of innovation. These most commonly include data on R&D expenditure, R&D personnel, scientific and technical journal articles, patent-related data, and data on high-technology exports. Even these data are available for many but not all countries.29 Moreover, these S&T indicators provide, at best, information on innovation input and throughput such as R&D expenditure, number of scientists, intermediate innovation output such as scientific publications or patents, or certain forms of technology-related commercial activity such as data on high-technology exports, or data on royalty and license fees.
In recent years the generation of data from so-called firm-level innovation surveys has improved the situation. Innovation surveys started with the European Community Innovation Survey (CIS) in the early 1990s, and are now being conducted in about 50-60 countries – mostly in Europe but also in a number of Latin American, Asian, African and other countries including, more recently, the US.30 These surveys are a rich data source for analytical work. However, a number of problems exist: (i) innovation outside the business sector is not captured in these enterprise surveys; (ii) the quality of responses varies greatly and respondents have a tendency to over-rate their innovative activity; (iii) country coverage is still limited; and (iv) survey results can only be compared to a limited extent across years and countries.
29 In terms of availability, even seemingly straightforward
indicators are scarcely available for more than a third
of WIPO Member States. As an example, of the 214
territories/countries covered by the UNESCO Institute
for Statistics, data for Gross Domestic Expenditure
on Research and Development (GERD) in 2007 were
only available for about 64 countries (mostly OECD
or other high-income countries). For lower-income
countries, these data are either unavailable or
outdated (for example, for Algeria from 2005). No data
are available for least developed countries (LDCs).
There are typically even fewer data available for the
other above-mentioned indicators. For instance, about
56 countries reported total R&D personnel for 2006.
30 Firm-level innovation surveys seek to identify the
characteristics of innovative enterprise activity.
After inviting firms to answer certain basic questions
(on industry affiliation, turnover, R&D spending),
firms were asked to identify whether they are an
“innovator” and, if so, firms are asked to respond
to questions regarding specific aspects of their
innovation, as well as the factors that hamper their
innovation. Finally, these surveys aim to assess
the effect of innovation on sales, productivity,
employment and other related factors.
31 For a recent overview and study, see
Ivarsson and Alvstam (2010).
32 See UNIDO (2009).
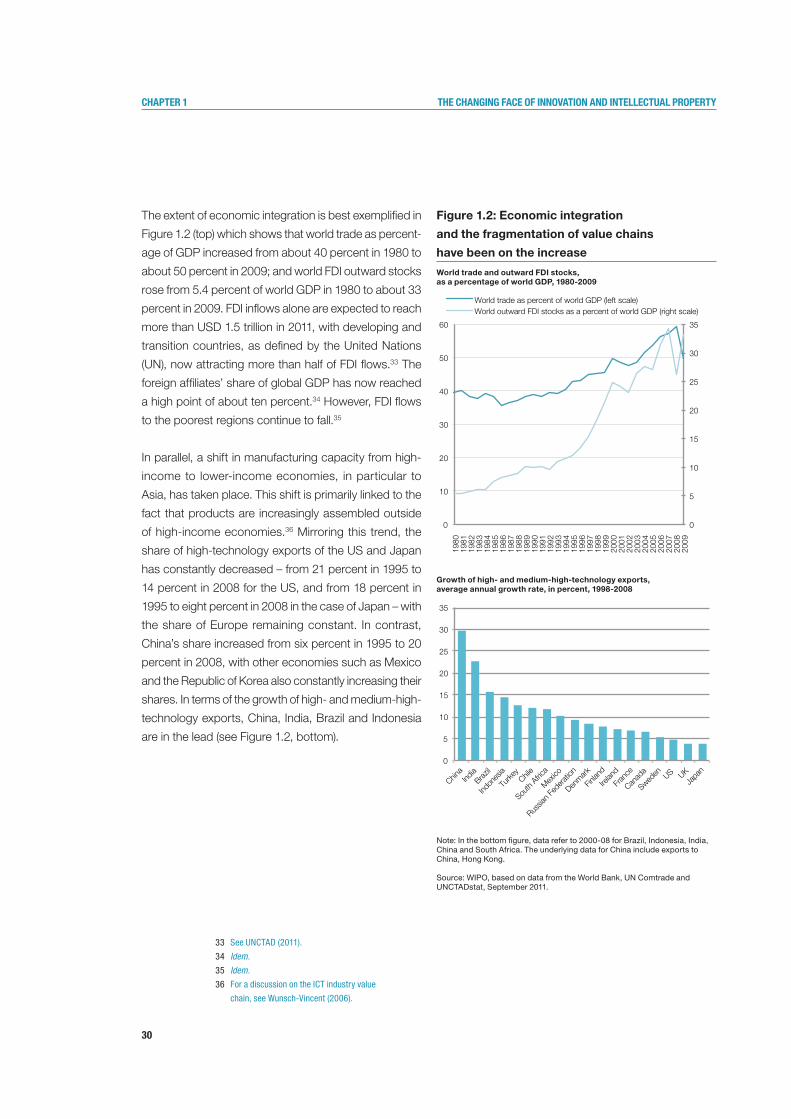
30
Chapter 1 the Changing faCe of innovation and intelleCtual property
The extent of economic integration is best exemplified in
Figure 1.2 (top) which shows that world trade as percent-
age of GDP increased from about 40 percent in 1980 to
about 50 percent in 2009; and world FDI outward stocks
rose from 5.4 percent of world GDP in 1980 to about 33
percent in 2009. FDI inflows alone are expected to reach
more than USD 1.5 trillion in 2011, with developing and
transition countries, as defined by the United Nations
(UN), now attracting more than half of FDI flows.33 The
foreign affiliates’ share of global GDP has now reached
a high point of about ten percent.34 However, FDI flows
to the poorest regions continue to fall.35
In parallel, a shift in manufacturing capacity from high-
income to lower-income economies, in particular to
Asia, has taken place. This shift is primarily linked to the
fact that products are increasingly assembled outside
of high-income economies.36 Mirroring this trend, the
share of high-technology exports of the US and Japan
has constantly decreased – from 21 percent in 1995 to
14 percent in 2008 for the US, and from 18 percent in
1995 to eight percent in 2008 in the case of Japan – with
the share of Europe remaining constant. In contrast,
China’s share increased from six percent in 1995 to 20
percent in 2008, with other economies such as Mexico
and the Republic of Korea also constantly increasing their
shares. In terms of the growth of high- and medium-high-
technology exports, China, India, Brazil and Indonesia
are in the lead (see Figure 1.2, bottom).
Figure 1.2: Economic integration
and the fragmentation of value chains
have been on the increase
World trade and outward FDI stocks,as a percentage of world GDP, 1980-2009
Growth of high- and medium-high-technology exports, average annual growth rate, in percent, 1998-2008
Note: In the bottom figure, data refer to 2000-08 for Brazil, Indonesia, India, China and South Africa. The underlying data for China include exports to China, Hong Kong.
Source: WIPO, based on data from the World Bank, UN Comtrade and UNCTADstat, September 2011.
33 See UNCTAD (2011).
34 Idem.
35 Idem.
36 For a discussion on the ICT industry value
chain, see Wunsch-Vincent (2006).
0
5
10
15
20
25
30
35
0
10
20
30
40
50
60
1980
19
81
1982
19
83
1984
19
85
1986
19
87
1988
19
89
1990
19
91
1992
19
93
1994
19
95
1996
19
97
1998
19
99
2000
20
01
2002
20
03
2004
20
05
2006
20
07
2008
20
09
World trade as percent of world GDP (left scale) World outward FDI stocks as a percent of world GDP (right scale)
0
5
10
15
20
25
30
35
China
India
Brazil
Indon
esia
Turke
y Chil
e
South
Africa
Mexico
Russia
n Fed
eratio
n
Denmark
Finlan
d
Irelan
d
Fran
ce
Canad
a
Sweden
US
UK
Japa
n
31
Chapter 1 the Changing faCe of innovation and intelleCtual property
Furthermore, the output of knowledge- and technology-
intensive industries (KTI) is also increasing and becoming
more geographically diffuse.37 In particular, the global
output of knowledge- and technology-intensive indus-
tries as a share of global GDP increased to close to 30
percent of global GDP in 2007, with knowledge-intensive
services accounting for the greatest share at 26 percent,
and high-technology manufacturing industries accounting
for 4 percent. ICT industries, composed of several KTI as
defined above service and high-technology manufactur-
ing industries, accounted for seven percent of global GDP
in 2007. The share is greatest in countries such as the
US (38 percent), the European Union (EU) (30 percent)
and Japan (28 percent). Other countries, such as China
(23 percent) or regions in Africa (19 percent), have also
increased their knowledge- and technology-intensive
industry output as a share of GDP.
Structural changes in the global economy: more
balanced world income and demand for innovation
Firms and citizens in particular middle-income economies
have not only emerged as substantial contributors to
technology production, but have also created significant
demand for products and innovation themselves.
For the first time since the 1970s, the last decade saw a
trend towards convergence in per capita income.38 The
number of converging economies increased rapidly, with
growth being strongest in a few large middle-income
economies but with growth also increasing more gener-
ally in, for example, Africa – averaging 4.4 percent growth
between 2000 and 2007. Whereas in 1980, about 70
percent of world GDP (measured in purchasing power
parities, PPP) was concentrated in high-income coun-
tries, that share fell to 56 percent in 2009, with the share
of upper middle-income economies making up for the
biggest increase – from about 22 percent to about 31
percent – and the low-income country group increas-
ing only marginally (see Figure 1.3, at top). This partial
convergence has been spurred further by the economic
crisis, with GDP growth holding up more strongly outside
of high-income economies.
37 National Science Board (2010). These data are based
on calculations by the National Science Foundation
following the OECD’s classification of knowledge-
intensive service and high-technology manufacturing
industries and data provided by IHS Global Insight.
The OECD has identified 10 categories of service and
manufacturing industries—collectively referred to as
KTI industries—that have a particularly strong link
to science and technology. Five knowledge-intensive
service industries incorporate high technologies either
in their services or in the delivery of their services.
They include financial, business, and communications
services (including computer software development
and R&D), which are generally commercially traded.
They also include education and health services, which
are primarily government provided and location bound.
The five high-technology manufacturing industries
include aerospace, pharmaceuticals, computers and
office machinery, communications equipment, and
scientific (medical, precision, and optical) instruments.
38 OECD (2010e).
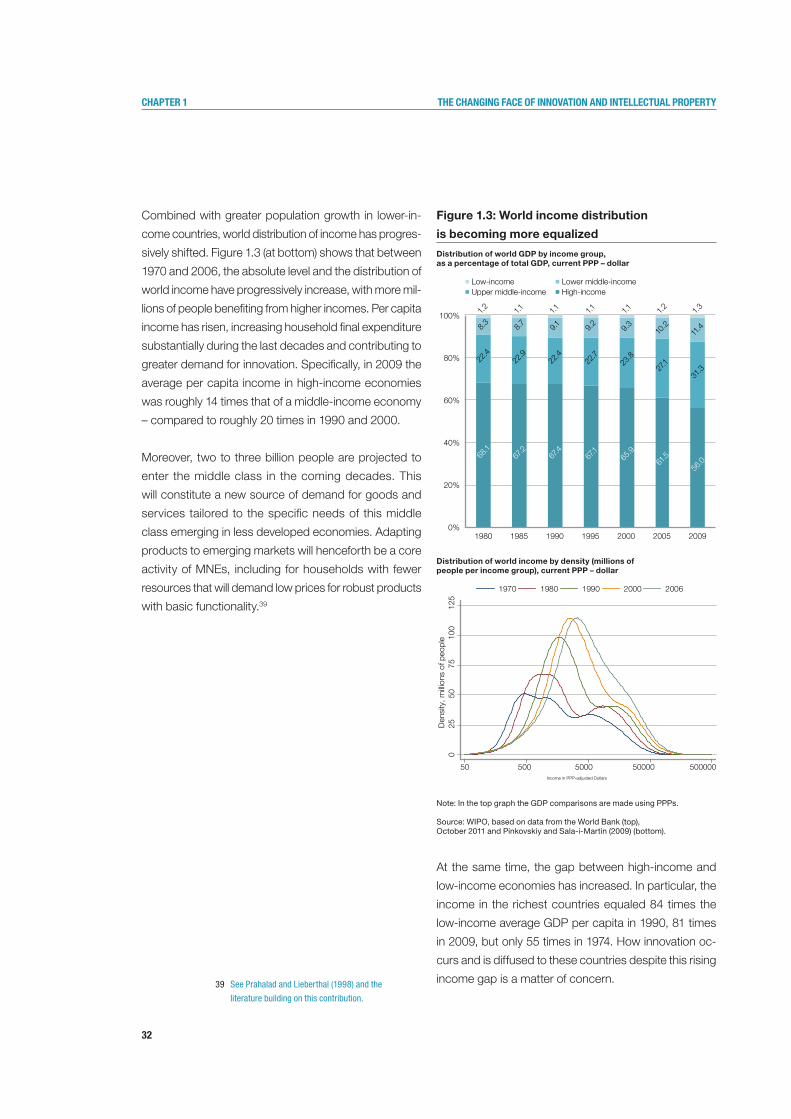
32
Chapter 1 the Changing faCe of innovation and intelleCtual property
Combined with greater population growth in lower-in-
come countries, world distribution of income has progres-
sively shifted. Figure 1.3 (at bottom) shows that between
1970 and 2006, the absolute level and the distribution of
world income have progressively increase, with more mil-
lions of people benefiting from higher incomes. Per capita
income has risen, increasing household final expenditure
substantially during the last decades and contributing to
greater demand for innovation. Specifically, in 2009 the
average per capita income in high-income economies
was roughly 14 times that of a middle-income economy
– compared to roughly 20 times in 1990 and 2000.
Moreover, two to three billion people are projected to
enter the middle class in the coming decades. This
will constitute a new source of demand for goods and
services tailored to the specific needs of this middle
class emerging in less developed economies. Adapting
products to emerging markets will henceforth be a core
activity of MNEs, including for households with fewer
resources that will demand low prices for robust products
with basic functionality.39
Figure 1.3: World income distribution
is becoming more equalized Distribution of world GDP by income group,as a percentage of total GDP, current PPP – dollar
Distribution of world income by density (millions of people per income group), current PPP – dollar
Note: In the top graph the GDP comparisons are made using PPPs.
Source: WIPO, based on data from the World Bank (top),October 2011 and Pinkovskiy and Sala-i-Martin (2009) (bottom).
At the same time, the gap between high-income and
low-income economies has increased. In particular, the
income in the richest countries equaled 84 times the
low-income average GDP per capita in 1990, 81 times
in 2009, but only 55 times in 1974. How innovation oc-
curs and is diffused to these countries despite this rising
income gap is a matter of concern.
68.1
67.2
67.4
67.1
65.9
61.5
56.0
22.4
22.9
22.4
22.7
23.8
27.1
31.3
8.3
8.7
9.1
9.2
9.3
10.2
11.4
1.2
1.1
1.1
1.1
1.1
1.2
1.3
0%
20%
40%
60%
80%
100%
1980 1985 1990 1995 2000 2005 2009
Low-income Lower middle-income Upper middle-income High-income
025
5075
100
125
Den
sity
, mill
ions
of p
eop
le
50 500 5000 50000 500000
Income in PPP-adjusted Dollars
1970 1980 1990 2000 2006
39 See Prahalad and Lieberthal (1998) and the
literature building on this contribution.
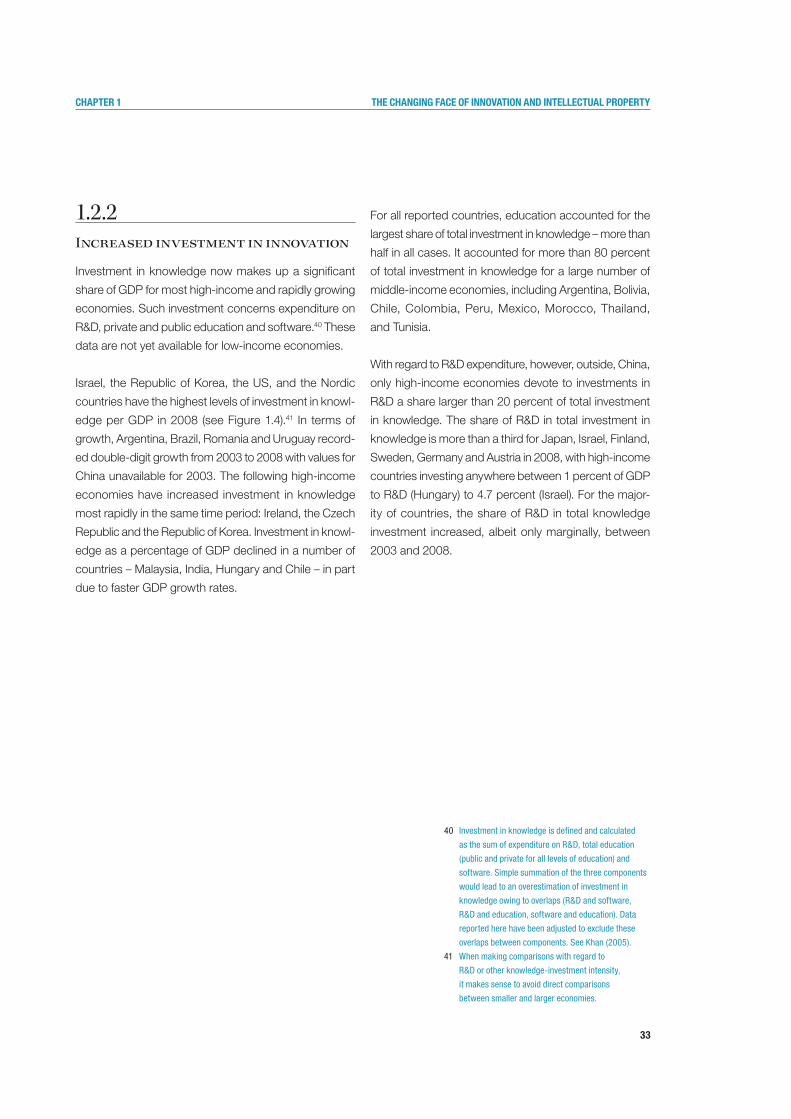
33
Chapter 1 the Changing faCe of innovation and intelleCtual property
1.2.2Increased investment in innovation
Investment in knowledge now makes up a significant
share of GDP for most high-income and rapidly growing
economies. Such investment concerns expenditure on
R&D, private and public education and software.40 These
data are not yet available for low-income economies.
Israel, the Republic of Korea, the US, and the Nordic
countries have the highest levels of investment in knowl-
edge per GDP in 2008 (see Figure 1.4).41 In terms of
growth, Argentina, Brazil, Romania and Uruguay record-
ed double-digit growth from 2003 to 2008 with values for
China unavailable for 2003. The following high-income
economies have increased investment in knowledge
most rapidly in the same time period: Ireland, the Czech
Republic and the Republic of Korea. Investment in knowl-
edge as a percentage of GDP declined in a number of
countries – Malaysia, India, Hungary and Chile – in part
due to faster GDP growth rates.
For all reported countries, education accounted for the
largest share of total investment in knowledge – more than
half in all cases. It accounted for more than 80 percent
of total investment in knowledge for a large number of
middle-income economies, including Argentina, Bolivia,
Chile, Colombia, Peru, Mexico, Morocco, Thailand,
and Tunisia.
With regard to R&D expenditure, however, outside, China,
only high-income economies devote to investments in
R&D a share larger than 20 percent of total investment
in knowledge. The share of R&D in total investment in
knowledge is more than a third for Japan, Israel, Finland,
Sweden, Germany and Austria in 2008, with high-income
countries investing anywhere between 1 percent of GDP
to R&D (Hungary) to 4.7 percent (Israel). For the major-
ity of countries, the share of R&D in total knowledge
investment increased, albeit only marginally, between
2003 and 2008.
40 Investment in knowledge is defined and calculated
as the sum of expenditure on R&D, total education
(public and private for all levels of education) and
software. Simple summation of the three components
would lead to an overestimation of investment in
knowledge owing to overlaps (R&D and software,
R&D and education, software and education). Data
reported here have been adjusted to exclude these
overlaps between components. See Khan (2005).
41 When making comparisons with regard to
R&D or other knowledge-investment intensity,
it makes sense to avoid direct comparisons
between smaller and larger economies.
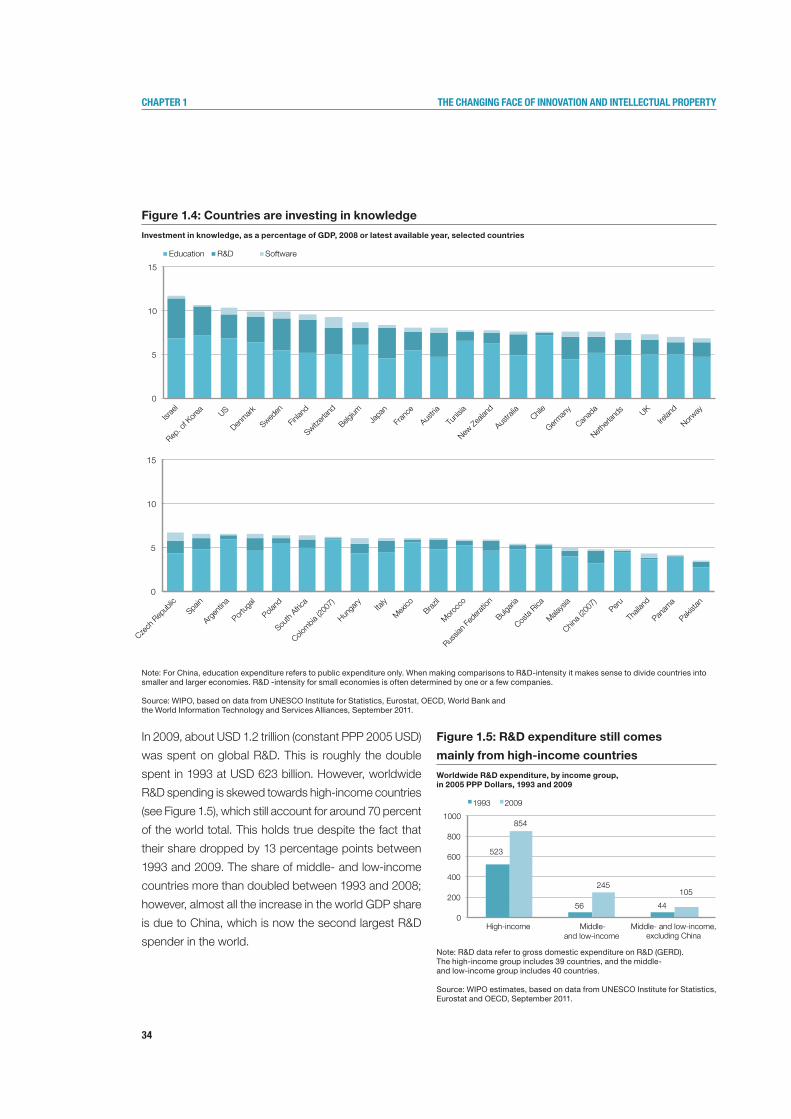
34
Chapter 1 the Changing faCe of innovation and intelleCtual property
Figure 1.4: Countries are investing in knowledge
Investment in knowledge, as a percentage of GDP, 2008 or latest available year, selected countries
Note: For China, education expenditure refers to public expenditure only. When making comparisons to R&D-intensity it makes sense to divide countries into smaller and larger economies. R&D -intensity for small economies is often determined by one or a few companies.
Source: WIPO, based on data from UNESCO Institute for Statistics, Eurostat, OECD, World Bank and the World Information Technology and Services Alliances, September 2011.
In 2009, about USD 1.2 trillion (constant PPP 2005 USD)
was spent on global R&D. This is roughly the double
spent in 1993 at USD 623 billion. However, worldwide
R&D spending is skewed towards high-income countries
(see Figure 1.5), which still account for around 70 percent
of the world total. This holds true despite the fact that
their share dropped by 13 percentage points between
1993 and 2009. The share of middle- and low-income
countries more than doubled between 1993 and 2008;
however, almost all the increase in the world GDP share
is due to China, which is now the second largest R&D
spender in the world.
Figure 1.5: R&D expenditure still comes
mainly from high-income countries
Worldwide R&D expenditure, by income group, in 2005 PPP Dollars, 1993 and 2009
Note: R&D data refer to gross domestic expenditure on R&D (GERD).The high-income group includes 39 countries, and the middle-and low-income group includes 40 countries.
Source: WIPO estimates, based on data from UNESCO Institute for Statistics, Eurostat and OECD, September 2011.
523
56 44
854
245 105
0
200
400
600
800
1000
High-income Middle-and low-income
Middle- and low-income, excluding China
1993 2009
0
5
10
15
Israe
l
Rep. o
f Kor
ea
US
Denmark
Sweden
Finlan
d
Switzerl
and
Belgium
Japa
n
Fran
ce
Austria
Tunis
ia
New Z
ealan
d
Austra
lia
Chile
German
y
Canad
a
Netherl
ands
UK
Irelan
d
Norway
Education R&D Software
0
5
10
15
Czech
Rep
ublic
Spain
Argen
tina
Portug
al
Poland
South
Africa
Colombia
(200
7)
Hunga
ry Ita
ly
Mexico
Brazil
Moroc
co
Bulgari
a
Russia
n Fed
eratio
n
Costa
Rica
Malays
ia
China (
2007
) Peru
Thail
and
Panam
a
Pakist
an
Education R&D Software
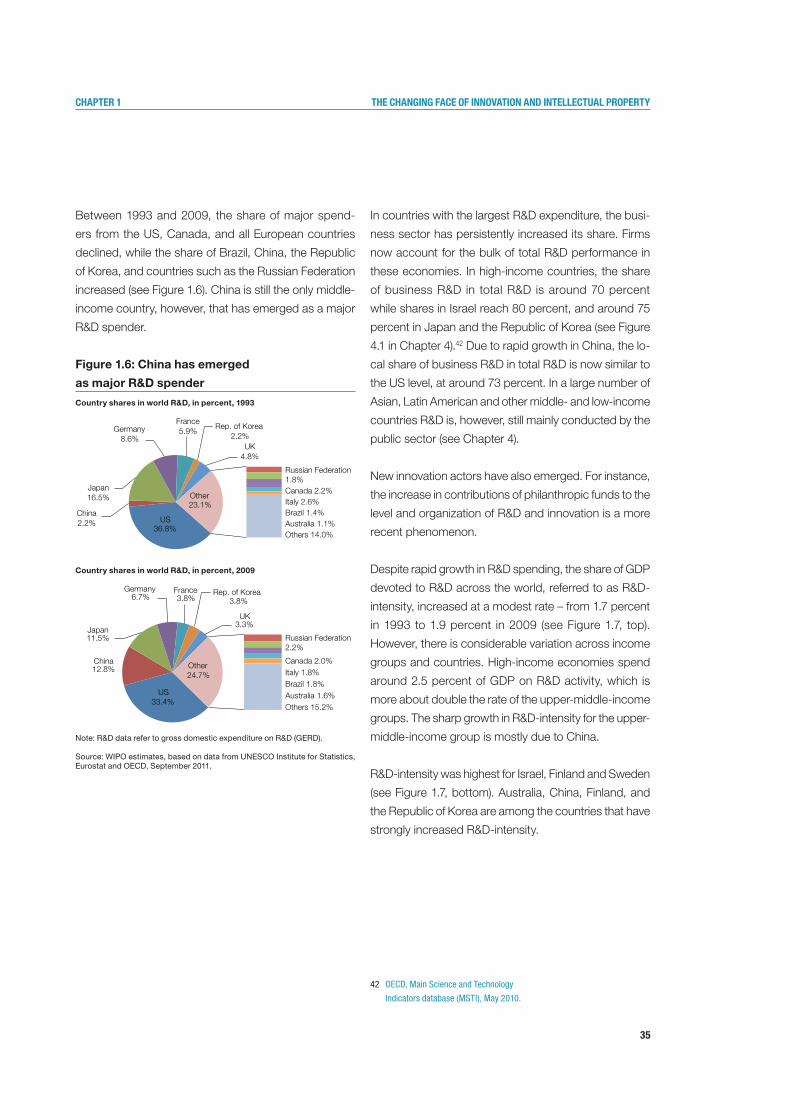
35
Chapter 1 the Changing faCe of innovation and intelleCtual property
Between 1993 and 2009, the share of major spend-
ers from the US, Canada, and all European countries
declined, while the share of Brazil, China, the Republic
of Korea, and countries such as the Russian Federation
increased (see Figure 1.6). China is still the only middle-
income country, however, that has emerged as a major
R&D spender.
Figure 1.6: China has emerged
as major R&D spender
Country shares in world R&D, in percent, 1993
Country shares in world R&D, in percent, 2009
Note: R&D data refer to gross domestic expenditure on R&D (GERD).
Source: WIPO estimates, based on data from UNESCO Institute for Statistics, Eurostat and OECD, September 2011.
In countries with the largest R&D expenditure, the busi-
ness sector has persistently increased its share. Firms
now account for the bulk of total R&D performance in
these economies. In high-income countries, the share
of business R&D in total R&D is around 70 percent
while shares in Israel reach 80 percent, and around 75
percent in Japan and the Republic of Korea (see Figure
4.1 in Chapter 4).42 Due to rapid growth in China, the lo-
cal share of business R&D in total R&D is now similar to
the US level, at around 73 percent. In a large number of
Asian, Latin American and other middle- and low-income
countries R&D is, however, still mainly conducted by the
public sector (see Chapter 4).
New innovation actors have also emerged. For instance,
the increase in contributions of philanthropic funds to the
level and organization of R&D and innovation is a more
recent phenomenon.
Despite rapid growth in R&D spending, the share of GDP
devoted to R&D across the world, referred to as R&D-
intensity, increased at a modest rate – from 1.7 percent
in 1993 to 1.9 percent in 2009 (see Figure 1.7, top).
However, there is considerable variation across income
groups and countries. High-income economies spend
around 2.5 percent of GDP on R&D activity, which is
more about double the rate of the upper-middle-income
groups. The sharp growth in R&D-intensity for the upper-
middle-income group is mostly due to China.
R&D-intensity was highest for Israel, Finland and Sweden
(see Figure 1.7, bottom). Australia, China, Finland, and
the Republic of Korea are among the countries that have
strongly increased R&D-intensity.
US 36.8%
China 2.2%
Japan 16.5%
Germany 8.6%
France 5.9%
Rep. of Korea 2.2%
UK 4.8%
Russian Federation1.8% Canada 2.2% Italy 2.6% Brazil 1.4% Australia 1.1% Others 14.0%
Other23.1%
US 33.4%
China 12.8%
Japan 11.5%
Germany 6.7%
France 3.8%
Rep. of Korea 3.8%
UK 3.3%
Russian Federation2.2%
Canada 2.0% Italy 1.8% Brazil 1.8% Australia 1.6% Others 15.2%
Other24.7%
42 OECD, Main Science and Technology
Indicators database (MSTI), May 2010.
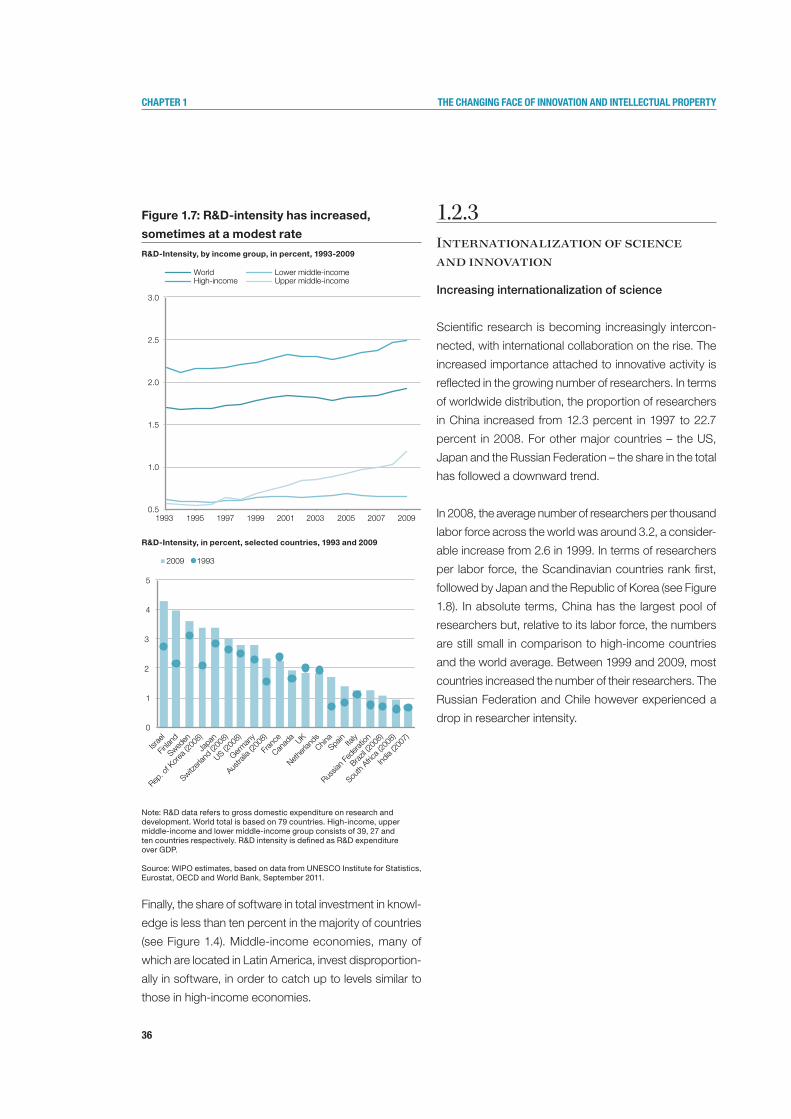
36
Chapter 1 the Changing faCe of innovation and intelleCtual property
Figure 1.7: R&D-intensity has increased,
sometimes at a modest rate
R&D-Intensity, by income group, in percent, 1993-2009
R&D-Intensity, in percent, selected countries, 1993 and 2009
Note: R&D data refers to gross domestic expenditure on research and development. World total is based on 79 countries. High-income, upper middle-income and lower middle-income group consists of 39, 27 and ten countries respectively. R&D intensity is defined as R&D expenditure over GDP.
Source: WIPO estimates, based on data from UNESCO Institute for Statistics, Eurostat, OECD and World Bank, September 2011.
Finally, the share of software in total investment in knowl-
edge is less than ten percent in the majority of countries
(see Figure 1.4). Middle-income economies, many of
which are located in Latin America, invest disproportion-
ally in software, in order to catch up to levels similar to
those in high-income economies.
1.2.3Internationalization of science and innovation
Increasing internationalization of science
Scientific research is becoming increasingly intercon-
nected, with international collaboration on the rise. The
increased importance attached to innovative activity is
reflected in the growing number of researchers. In terms
of worldwide distribution, the proportion of researchers
in China increased from 12.3 percent in 1997 to 22.7
percent in 2008. For other major countries – the US,
Japan and the Russian Federation – the share in the total
has followed a downward trend.
In 2008, the average number of researchers per thousand
labor force across the world was around 3.2, a consider-
able increase from 2.6 in 1999. In terms of researchers
per labor force, the Scandinavian countries rank first,
followed by Japan and the Republic of Korea (see Figure
1.8). In absolute terms, China has the largest pool of
researchers but, relative to its labor force, the numbers
are still small in comparison to high-income countries
and the world average. Between 1999 and 2009, most
countries increased the number of their researchers. The
Russian Federation and Chile however experienced a
drop in researcher intensity.
0.5
1.0
1.5
2.0
2.5
3.0
1993 1995 1997 1999 2001 2003 2005 2007 2009
World High-income
Lower middle-income Upper middle-income
0
1
2
3
4
5
Israe
l
Finlan
d
Sweden
Rep. o
f Kor
ea (2
008)
Japa
n
Switzerl
and
(2008
)
US (200
8)
German
y
Austra
lia (2
008)
Fran
ce
Canad
a UK
Netherl
ands
China
Spain
Italy
Russia
n Fed
eratio
n
Brazil (
2008
)
South
Africa (
2008
)
India
(2007
)
2009 1993
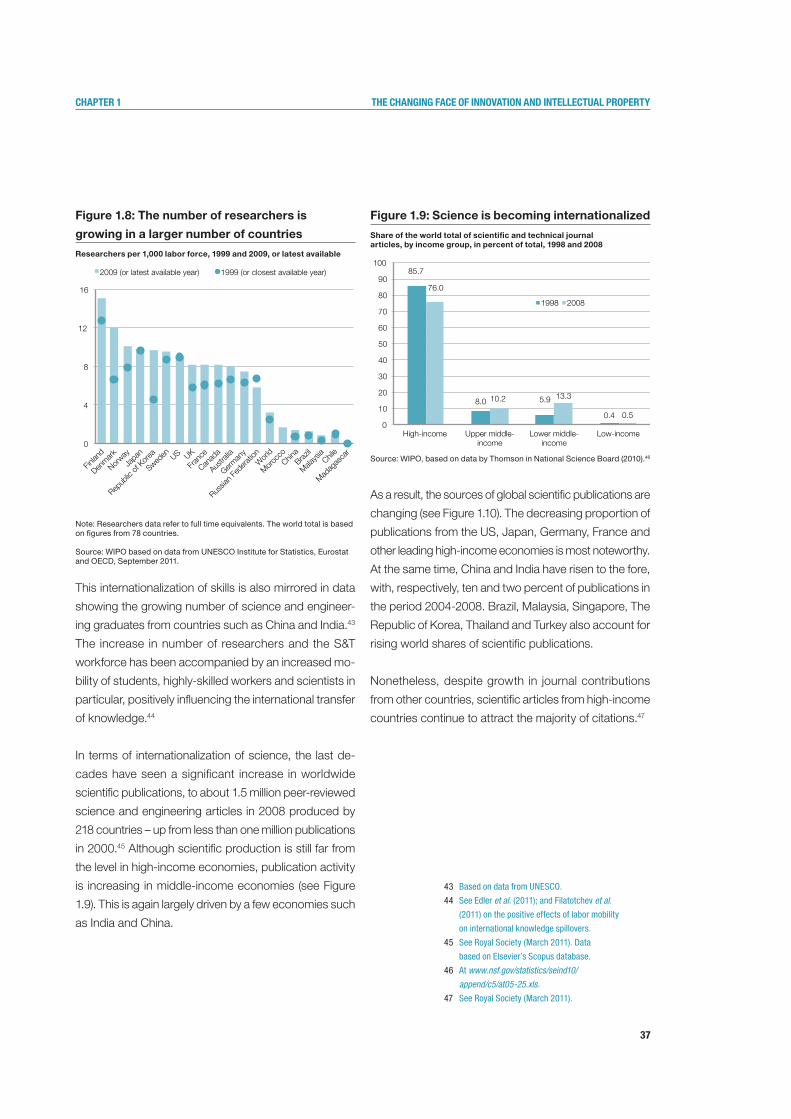
37
Chapter 1 the Changing faCe of innovation and intelleCtual property
Figure 1.8: The number of researchers is
growing in a larger number of countries
Researchers per 1,000 labor force, 1999 and 2009, or latest available
Note: Researchers data refer to full time equivalents. The world total is based on figures from 78 countries.
Source: WIPO based on data from UNESCO Institute for Statistics, Eurostat and OECD, September 2011.
This internationalization of skills is also mirrored in data
showing the growing number of science and engineer-
ing graduates from countries such as China and India.43
The increase in number of researchers and the S&T
workforce has been accompanied by an increased mo-
bility of students, highly-skilled workers and scientists in
particular, positively influencing the international transfer
of knowledge.44
In terms of internationalization of science, the last de-
cades have seen a significant increase in worldwide
scientific publications, to about 1.5 million peer-reviewed
science and engineering articles in 2008 produced by
218 countries – up from less than one million publications
in 2000.45 Although scientific production is still far from
the level in high-income economies, publication activity
is increasing in middle-income economies (see Figure
1.9). This is again largely driven by a few economies such
as India and China.
Figure 1.9: Science is becoming internationalized
Share of the world total of scientific and technical journal articles, by income group, in percent of total, 1998 and 2008
Source: WIPO, based on data by Thomson in National Science Board (2010).46
As a result, the sources of global scientific publications are
changing (see Figure 1.10). The decreasing proportion of
publications from the US, Japan, Germany, France and
other leading high-income economies is most noteworthy.
At the same time, China and India have risen to the fore,
with, respectively, ten and two percent of publications in
the period 2004-2008. Brazil, Malaysia, Singapore, The
Republic of Korea, Thailand and Turkey also account for
rising world shares of scientific publications.
Nonetheless, despite growth in journal contributions
from other countries, scientific articles from high-income
countries continue to attract the majority of citations.47
0
4
8
12
16
Finlan
d
Denmark
Norway
Japa
n
Repub
lic of
Kor
ea
Sweden
US
UK
Fran
ce
Canad
a
Austra
lia
German
y
Russia
n Fed
eratio
n
Wor
ld
Moroc
co
China
Brazil
Malays
ia Chil
e
Madag
asca
r
2009 (or latest available year) 1999 (or closest available year) 85.7
8.0 5.9
0.4
76.0
10.2 13.3
0.5 0
10
20
30
40
50
60
70
80
90
100
High-income Upper middle-income
Lower middle-income
Low-income
1998 2008
43 Based on data from UNESCO.
44 See Edler et al. (2011); and Filatotchev et al. (2011) on the positive effects of labor mobility
on international knowledge spillovers.
45 See Royal Society (March 2011). Data
based on Elsevier’s Scopus database.
46 At www.nsf.gov/statistics/seind10/append/c5/at05-25.xls.
47 See Royal Society (March 2011).
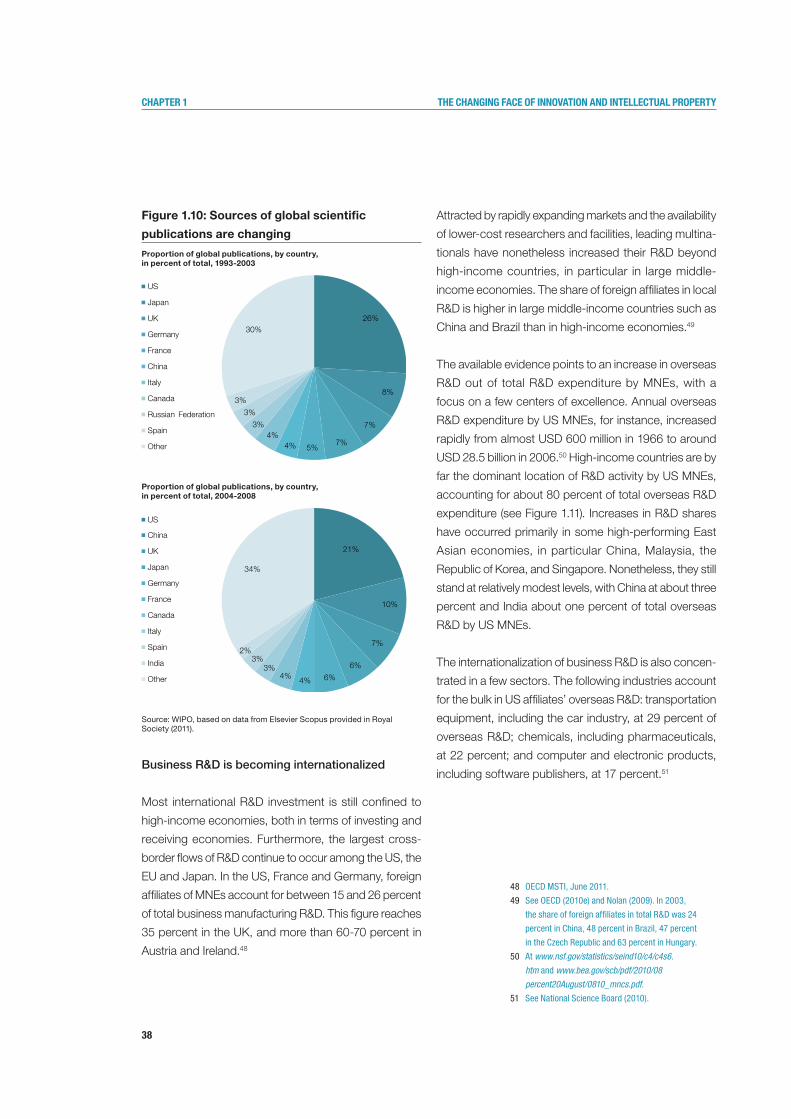
38
Chapter 1 the Changing faCe of innovation and intelleCtual property
Figure 1.10: Sources of global scientific
publications are changing
Proportion of global publications, by country, in percent of total, 1993-2003
Proportion of global publications, by country, in percent of total, 2004-2008
Source: WIPO, based on data from Elsevier Scopus provided in Royal Society (2011).
Business R&D is becoming internationalized
Most international R&D investment is still confined to
high-income economies, both in terms of investing and
receiving economies. Furthermore, the largest cross-
border flows of R&D continue to occur among the US, the
EU and Japan. In the US, France and Germany, foreign
affiliates of MNEs account for between 15 and 26 percent
of total business manufacturing R&D. This figure reaches
35 percent in the UK, and more than 60-70 percent in
Austria and Ireland.48
Attracted by rapidly expanding markets and the availability
of lower-cost researchers and facilities, leading multina-
tionals have nonetheless increased their R&D beyond
high-income countries, in particular in large middle-
income economies. The share of foreign affiliates in local
R&D is higher in large middle-income countries such as
China and Brazil than in high-income economies.49
The available evidence points to an increase in overseas
R&D out of total R&D expenditure by MNEs, with a
focus on a few centers of excellence. Annual overseas
R&D expenditure by US MNEs, for instance, increased
rapidly from almost USD 600 million in 1966 to around
USD 28.5 billion in 2006.50 High-income countries are by
far the dominant location of R&D activity by US MNEs,
accounting for about 80 percent of total overseas R&D
expenditure (see Figure 1.11). Increases in R&D shares
have occurred primarily in some high-performing East
Asian economies, in particular China, Malaysia, the
Republic of Korea, and Singapore. Nonetheless, they still
stand at relatively modest levels, with China at about three
percent and India about one percent of total overseas
R&D by US MNEs.
The internationalization of business R&D is also concen-
trated in a few sectors. The following industries account
for the bulk in US affiliates’ overseas R&D: transportation
equipment, including the car industry, at 29 percent of
overseas R&D; chemicals, including pharmaceuticals,
at 22 percent; and computer and electronic products,
including software publishers, at 17 percent.51
21%
10%
7%
6%
6% 4% 4% 3%
3% 2%
34%
US
China
UK
Japan
Germany
France
Canada
Italy
Spain
India
Other
26%
8%
7%
7% 5% 4%
4% 3%
3%
3%
30%
US
Japan
UK
Germany
France
China
Italy
Canada
Russian Federation
Spain
Other
48 OECD MSTI, June 2011.
49 See OECD (2010e) and Nolan (2009). In 2003,
the share of foreign affiliates in total R&D was 24
percent in China, 48 percent in Brazil, 47 percent
in the Czech Republic and 63 percent in Hungary.
50 At www.nsf.gov/statistics/seind10/c4/c4s6.htm and www.bea.gov/scb/pdf/2010/08 percent20August/0810_mncs.pdf.
51 See National Science Board (2010).
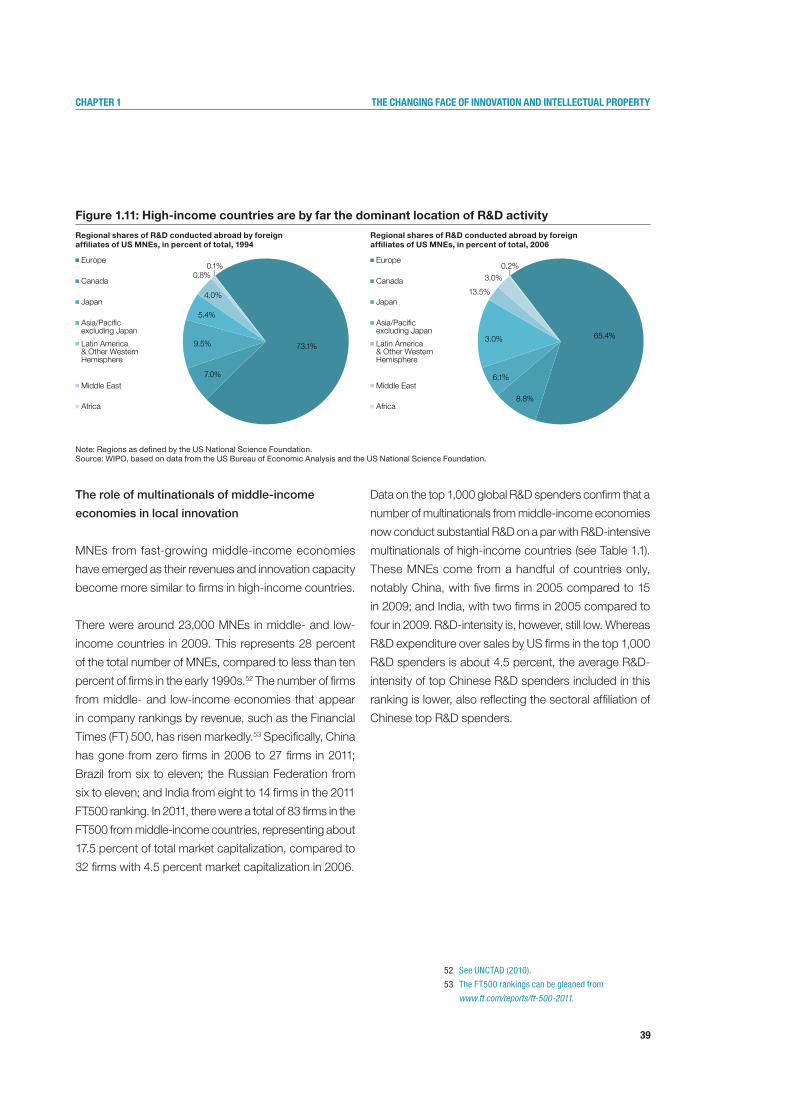
39
Chapter 1 the Changing faCe of innovation and intelleCtual property
Figure 1.11: High-income countries are by far the dominant location of R&D activity
Regional shares of R&D conducted abroad by foreign affiliates of US MNEs, in percent of total, 1994
Note: Regions as defined by the US National Science Foundation.Source: WIPO, based on data from the US Bureau of Economic Analysis and the US National Science Foundation.
The role of multinationals of middle-income
economies in local innovation
MNEs from fast-growing middle-income economies
have emerged as their revenues and innovation capacity
become more similar to firms in high-income countries.
There were around 23,000 MNEs in middle- and low-
income countries in 2009. This represents 28 percent
of the total number of MNEs, compared to less than ten
percent of firms in the early 1990s.52 The number of firms
from middle- and low-income economies that appear
in company rankings by revenue, such as the Financial
Times (FT) 500, has risen markedly.53 Specifically, China
has gone from zero firms in 2006 to 27 firms in 2011;
Brazil from six to eleven; the Russian Federation from
six to eleven; and India from eight to 14 firms in the 2011
FT500 ranking. In 2011, there were a total of 83 firms in the
FT500 from middle-income countries, representing about
17.5 percent of total market capitalization, compared to
32 firms with 4.5 percent market capitalization in 2006.
Data on the top 1,000 global R&D spenders confirm that a
number of multinationals from middle-income economies
now conduct substantial R&D on a par with R&D-intensive
multinationals of high-income countries (see Table 1.1).
These MNEs come from a handful of countries only,
notably China, with five firms in 2005 compared to 15
in 2009; and India, with two firms in 2005 compared to
four in 2009. R&D-intensity is, however, still low. Whereas
R&D expenditure over sales by US firms in the top 1,000
R&D spenders is about 4.5 percent, the average R&D-
intensity of top Chinese R&D spenders included in this
ranking is lower, also reflecting the sectoral affiliation of
Chinese top R&D spenders.
73.1%
7.0%
9.5%
5.4%
4.0%
0.8% 0.1%
Europe
Canada
Japan
Asia/Paci�c excluding Japan
Latin America & Other Western Hemisphere
Middle East
Africa
65.4%
8.8%
6.1%
13.5%
3.0%
3.0%
0.2% Europe
Canada
Japan
Asia/Paci�c excluding Japan
Latin America & Other Western Hemisphere
Middle East
Africa
Regional shares of R&D conducted abroad by foreign affiliates of US MNEs, in percent of total, 2006
52 See UNCTAD (2010).
53 The FT500 rankings can be gleaned from
www.ft.com/reports/ft-500-2011.
40
Chapter 1 the Changing faCe of innovation and intelleCtual property
FDI outflows from firms other than those in high-income
economies are also growing, and stand at about 29
percent of total FDI in 2010. This is mainly driven by
Chile, China, Egypt, Malaysia, Mexico, the Russian
Federation, South Africa, Thailand and Turkey.54 In 2010,
six developing and transition economies – as defined
by the UN – were among the top 20 investors. Flows of
outward FDI from lower- or middle-income economies
rose from about USD 6 billion in 1990 to USD 388 billion
in 2010, about 29 percent of total outward flows.55 These
outward investments guarantee proximity to high-income
markets and advanced innovation systems which can be
exploited by cooperating with local suppliers, customers,
universities and other actors.
Once more, this FDI outflow and related knowledge
flows are still limited to a small group of economies with
a relatively well-developed knowledge infrastructure.
Apart from the rise in outward investment by China and
the Russian Federation, no other low- or middle-income
country has recently emerged as a significant outward
FDI investor. Brazil, South Africa, India and fast-growing
South-Asian economies were already outward investors
by the 1980s.56 If one eliminates a number of fast-growing
middle-income countries, the percentage of outward
FDI from lower- or middle-income countries as a share
of global outward FDI declines to around 2.4 percent for
the period 1993-2007.57
In relation to the growing innovation capacity of MNEs
of less developed countries, discussions have recently
focused on new concepts such as “frugal”, “reverse” or
“trickle-up” innovation. These types of innovation focus
on needs and requirements for low-cost products in
lower-income countries. At times, these new products
or processes can also succeed in penetrating markets in
high-income economies.58 Local firms reinvent systems
of production and distribution in the process, and also
experiment with new business models while leveraging
their familiarity with local customer needs.59 Examples
cited in this context include: the activities of Indian ICT
providers in the software outsourcing market; the de-
velopment by Indian firm Tata Motors of a car costing
USD 2,000; and the sale by GE on the US market of an
ultra-portable electrocardiograph machine originally built
by GE Healthcare for doctors in India and China.
Analysis of this potential new development must move
beyond anecdotal examples to better enable economists
and policymakers to gauge its true economic ramifications.
54 See UNCTAD (2011).
55 See Athreye and Kapur (2009).
56 See Narula (2010).
57 Idem.
58 See Prahalad and Lieberthal (1998).
59 See, for instance, Ray and Ray (2010).
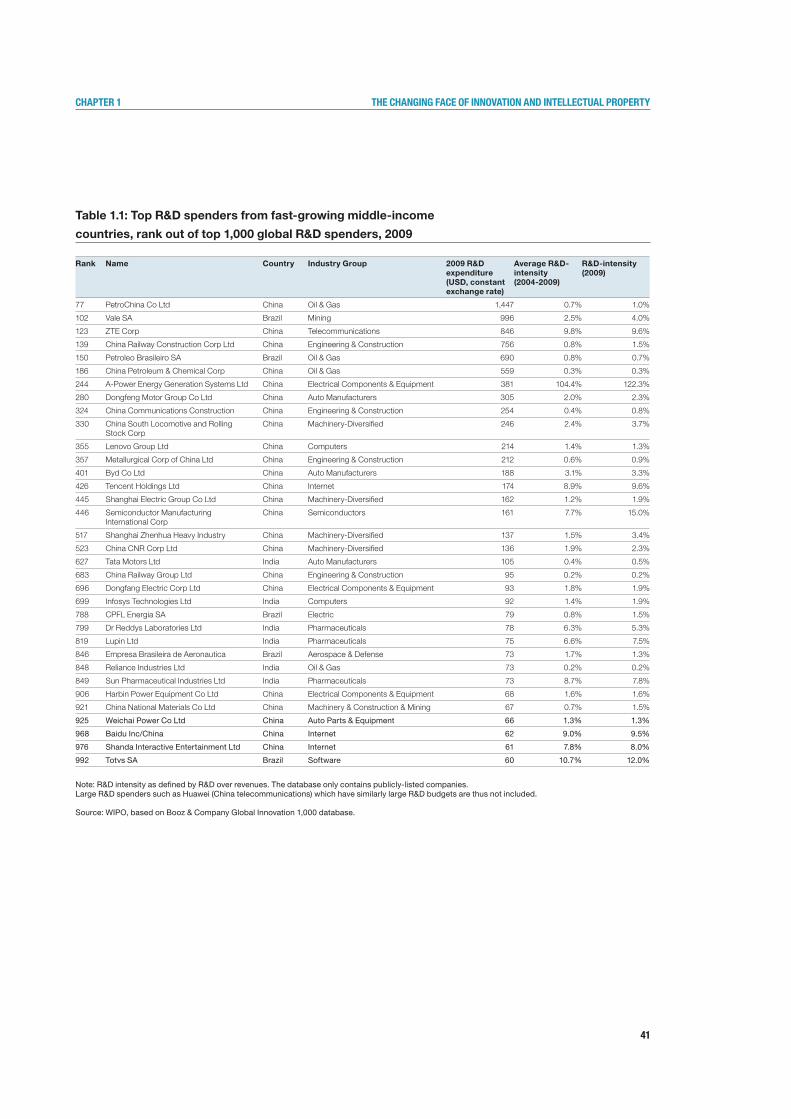
41
Chapter 1 the Changing faCe of innovation and intelleCtual property
Table 1.1: Top R&D spenders from fast-growing middle-income
countries, rank out of top 1,000 global R&D spenders, 2009
Note: R&D intensity as defined by R&D over revenues. The database only contains publicly-listed companies. Large R&D spenders such as Huawei (China telecommunications) which have similarly large R&D budgets are thus not included.
Source: WIPO, based on Booz & Company Global Innovation 1,000 database.
Rank Name Country Industry Group 2009 R&D expenditure (USD, constant exchange rate)
Average R&D-intensity(2004-2009)
R&D-intensity(2009)
77 PetroChina Co Ltd China Oil & Gas 1,447 0.7% 1.0%
102 Vale SA Brazil Mining 996 2.5% 4.0%
123 ZTE Corp China Telecommunications 846 9.8% 9.6%
139 China Railway Construction Corp Ltd China Engineering & Construction 756 0.8% 1.5%
150 Petroleo Brasileiro SA Brazil Oil & Gas 690 0.8% 0.7%
186 China Petroleum & Chemical Corp China Oil & Gas 559 0.3% 0.3%
244 A-Power Energy Generation Systems Ltd China Electrical Components & Equipment 381 104.4% 122.3%
280 Dongfeng Motor Group Co Ltd China Auto Manufacturers 305 2.0% 2.3%
324 China Communications Construction China Engineering & Construction 254 0.4% 0.8%
330 China South Locomotive and Rolling Stock Corp
China Machinery-Diversified 246 2.4% 3.7%
355 Lenovo Group Ltd China Computers 214 1.4% 1.3%
357 Metallurgical Corp of China Ltd China Engineering & Construction 212 0.6% 0.9%
401 Byd Co Ltd China Auto Manufacturers 188 3.1% 3.3%
426 Tencent Holdings Ltd China Internet 174 8.9% 9.6%
445 Shanghai Electric Group Co Ltd China Machinery-Diversified 162 1.2% 1.9%
446 Semiconductor Manufacturing International Corp
China Semiconductors 161 7.7% 15.0%
517 Shanghai Zhenhua Heavy Industry China Machinery-Diversified 137 1.5% 3.4%
523 China CNR Corp Ltd China Machinery-Diversified 136 1.9% 2.3%
627 Tata Motors Ltd India Auto Manufacturers 105 0.4% 0.5%
683 China Railway Group Ltd China Engineering & Construction 95 0.2% 0.2%
696 Dongfang Electric Corp Ltd China Electrical Components & Equipment 93 1.8% 1.9%
699 Infosys Technologies Ltd India Computers 92 1.4% 1.9%
788 CPFL Energia SA Brazil Electric 79 0.8% 1.5%
799 Dr Reddys Laboratories Ltd India Pharmaceuticals 78 6.3% 5.3%
819 Lupin Ltd India Pharmaceuticals 75 6.6% 7.5%
846 Empresa Brasileira de Aeronautica Brazil Aerospace & Defense 73 1.7% 1.3%
848 Reliance Industries Ltd India Oil & Gas 73 0.2% 0.2%
849 Sun Pharmaceutical Industries Ltd India Pharmaceuticals 73 8.7% 7.8%
906 Harbin Power Equipment Co Ltd China Electrical Components & Equipment 68 1.6% 1.6%
921 China National Materials Co Ltd China Machinery & Construction & Mining 67 0.7% 1.5%
925 Weichai Power Co Ltd China Auto Parts & Equipment 66 1.3% 1.3%
968 Baidu Inc/China China Internet 62 9.0% 9.5%
976 Shanda Interactive Entertainment Ltd China Internet 61 7.8% 8.0%
992 Totvs SA Brazil Software 60 10.7% 12.0%
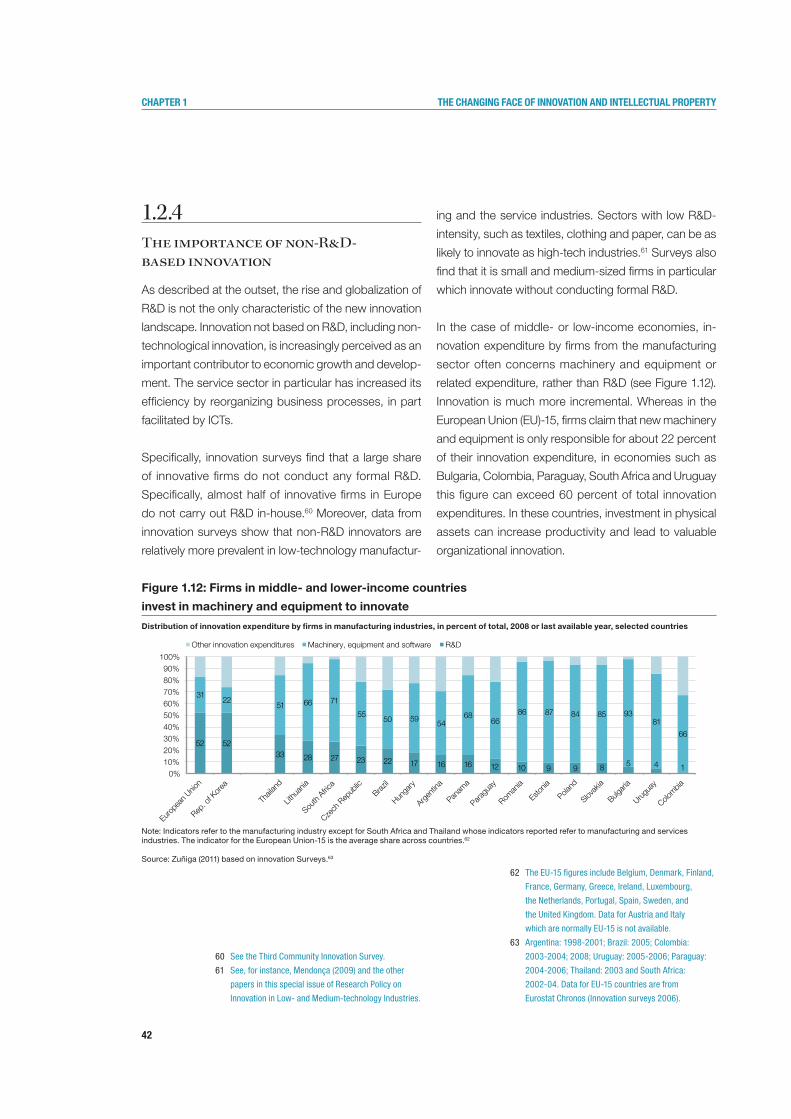
42
Chapter 1 the Changing faCe of innovation and intelleCtual property
1.2.4The importance of non-R&D-based innovation
As described at the outset, the rise and globalization of
R&D is not the only characteristic of the new innovation
landscape. Innovation not based on R&D, including non-
technological innovation, is increasingly perceived as an
important contributor to economic growth and develop-
ment. The service sector in particular has increased its
efficiency by reorganizing business processes, in part
facilitated by ICTs.
Specifically, innovation surveys find that a large share
of innovative firms do not conduct any formal R&D.
Specifically, almost half of innovative firms in Europe
do not carry out R&D in-house.60 Moreover, data from
innovation surveys show that non-R&D innovators are
relatively more prevalent in low-technology manufactur-
ing and the service industries. Sectors with low R&D-
intensity, such as textiles, clothing and paper, can be as
likely to innovate as high-tech industries.61 Surveys also
find that it is small and medium-sized firms in particular
which innovate without conducting formal R&D.
In the case of middle- or low-income economies, in-
novation expenditure by firms from the manufacturing
sector often concerns machinery and equipment or
related expenditure, rather than R&D (see Figure 1.12).
Innovation is much more incremental. Whereas in the
European Union (EU)-15, firms claim that new machinery
and equipment is only responsible for about 22 percent
of their innovation expenditure, in economies such as
Bulgaria, Colombia, Paraguay, South Africa and Uruguay
this figure can exceed 60 percent of total innovation
expenditures. In these countries, investment in physical
assets can increase productivity and lead to valuable
organizational innovation.
60 See the Third Community Innovation Survey.
61 See, for instance, Mendonça (2009) and the other
papers in this special issue of Research Policy on
Innovation in Low- and Medium-technology Industries.
Figure 1.12: Firms in middle- and lower-income countries
invest in machinery and equipment to innovate
Distribution of innovation expenditure by firms in manufacturing industries, in percent of total, 2008 or last available year, selected countries
Note: Indicators refer to the manufacturing industry except for South Africa and Thailand whose indicators reported refer to manufacturing and services industries. The indicator for the European Union-15 is the average share across countries.62
Source: Zuñiga (2011) based on innovation Surveys.63
62 The EU-15 figures include Belgium, Denmark, Finland,
France, Germany, Greece, Ireland, Luxembourg,
the Netherlands, Portugal, Spain, Sweden, and
the United Kingdom. Data for Austria and Italy
which are normally EU-15 is not available.
63 Argentina: 1998-2001; Brazil: 2005; Colombia:
2003-2004; 2008; Uruguay: 2005-2006; Paraguay:
2004-2006; Thailand: 2003 and South Africa:
2002-04. Data for EU-15 countries are from
Eurostat Chronos (Innovation surveys 2006).
52 52 33 28 27 23 22 17 16 16 12 10 9 9 8 5 4 1
31 22
51 66 71
55 50 59
54 68
66 86 87 84 85 93
81
66
0% 10% 20% 30% 40% 50% 60% 70% 80% 90%
100%
Europ
ean U
nion
Rep. o
f Kor
ea
Thail
and
Lithu
ania
South
Africa
Czech
Rep
ublic
Brazil
Hunga
ry
Argen
tina
Panam
a
Paragu
ay
Roman
ia
Estonia
Poland
Slovak
ia
Bulgari
a
Urugu
ay
Colombia
Other innovation expenditures Machinery, equipment and software R&D
43
Chapter 1 the Changing faCe of innovation and intelleCtual property
Beyond the non-R&D innovation expenditure discussed
above, research suggests that process and organizational
innovation can be a prominent driver of improved firm
performance. In fact, this is perhaps the most important
form of non-technological innovation, particularly in the
service sector.64 Furthermore, the introduction of innova-
tive and new technologies frequently requires enhanced
skills as well as complementary organizational changes
in administration and structure. Technological and or-
ganizational innovation are thus often complementary.
Nevertheless, the existing economic literature acknowl-
edges that measuring the positive contribution of process
and organizational innovation to productivity is much
harder (see Section 1.1).65 One reason for the lack of
evidence in this area is that the interactions between and
complementary nature of technological and non-techno-
logical innovation are hard to measure and fully assess.
1.2.5Greater collaboration in the process of innovation
Innovation has always taken place in the context of
institutional and other linkages between various innova-
tion actors.
Yet another transformation in the much discussed new
innovation paradigm is the increasingly collaborative na-
ture of innovative processes. According to this view, firms
increasingly seek valuable knowledge and skills beyond
their own boundaries, in order to enlarge their capabilities
and enhance their assets (see Chapter 3). Joint innova-
tion activity involves formal cooperation modes such
as R&D consortia, research ventures, IP-based forms
of collaboration, co-production, co-marketing or more
informal modes of cooperation. Lastly, collaboration also
occurs between universities, public research organiza-
tions and firms (see Chapter 4).
Such collaboration has been facilitated as innovation pro-
cesses and activity have become more easily fragmented.
Moreover, the expansion of markets for technologies that
allow for knowledge exchange via patent licenses and
other IP-based forms of exchange have been a driver
of collaboration.
Collaboration is at the heart of innovation,
but measurement remains difficult
The statistics available for assessing frequency, type
and impact of collaboration are limited. They are mostly
based on data relating to R&D, publications, patents or
innovation surveys, all of which have their limitations. A
significant share of collaborative activity also remains
unmeasured and/or is kept secret. Importantly, existing
data say little about the quality dimension and impact of
cooperation. As highlighted above, collaboration covers
a wide field and involves different degrees of involvement,
from sharing information through to conducting joint R&D
and product development. Related impacts of coopera-
tion might also materialize over time.64 See, for instance, Evangelista and Vezzani (2010).
65 See Hall (2011).
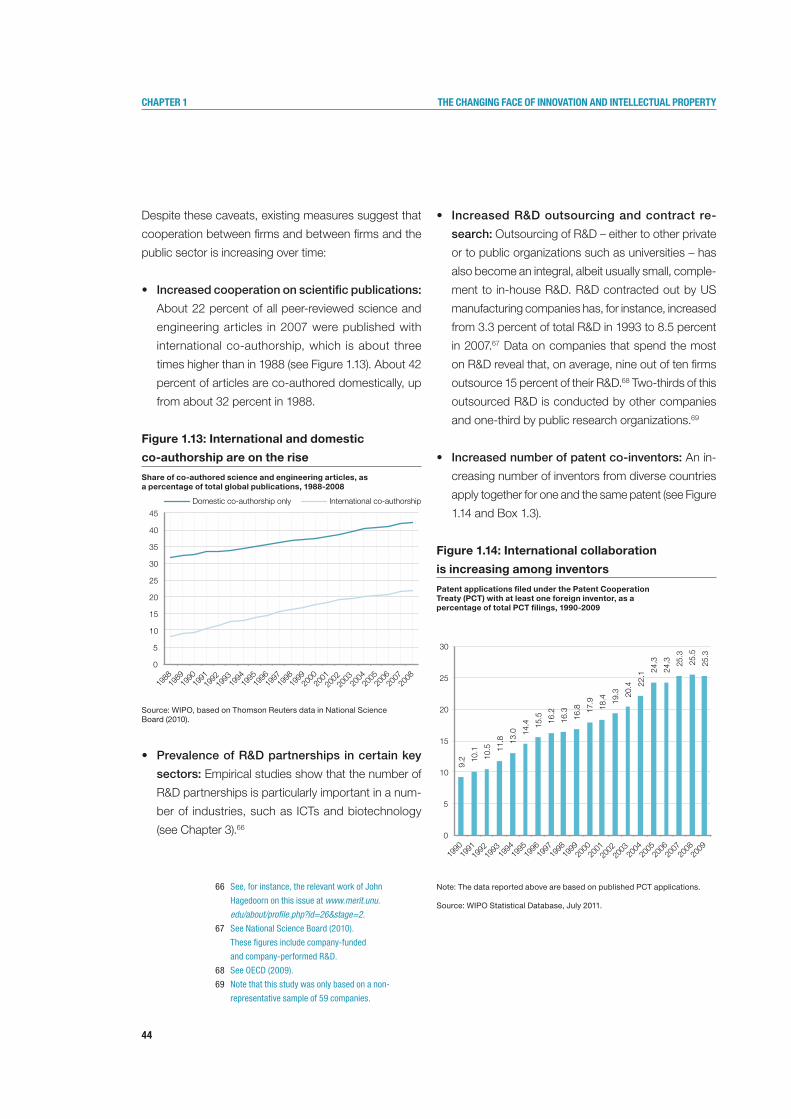
44
Chapter 1 the Changing faCe of innovation and intelleCtual property
Despite these caveats, existing measures suggest that
cooperation between firms and between firms and the
public sector is increasing over time:
• Increasedcooperationonscientificpublications:
About 22 percent of all peer-reviewed science and
engineering articles in 2007 were published with
international co-authorship, which is about three
times higher than in 1988 (see Figure 1.13). About 42
percent of articles are co-authored domestically, up
from about 32 percent in 1988.
Figure 1.13: International and domestic
co-authorship are on the rise
Share of co-authored science and engineering articles, as a percentage of total global publications, 1988-2008
Source: WIPO, based on Thomson Reuters data in National Science Board (2010).
• PrevalenceofR&Dpartnershipsincertainkey
sectors: Empirical studies show that the number of
R&D partnerships is particularly important in a num-
ber of industries, such as ICTs and biotechnology
(see Chapter 3).66
• IncreasedR&Doutsourcingandcontract re-
search: Outsourcing of R&D – either to other private
or to public organizations such as universities – has
also become an integral, albeit usually small, comple-
ment to in-house R&D. R&D contracted out by US
manufacturing companies has, for instance, increased
from 3.3 percent of total R&D in 1993 to 8.5 percent
in 2007.67 Data on companies that spend the most
on R&D reveal that, on average, nine out of ten firms
outsource 15 percent of their R&D.68 Two-thirds of this
outsourced R&D is conducted by other companies
and one-third by public research organizations.69
• Increasednumberofpatentco-inventors: An in-
creasing number of inventors from diverse countries
apply together for one and the same patent (see Figure
1.14 and Box 1.3).
Figure 1.14: International collaboration
is increasing among inventors
Patent applications filed under the Patent Cooperation Treaty (PCT) with at least one foreign inventor, as a percentage of total PCT filings, 1990-2009
Note: The data reported above are based on published PCT applications.
Source: WIPO Statistical Database, July 2011.
9.2 10
.1
10.5
11.8
13.0
14.4
15.5
16.2
16.3
16.8
17.9
18.4
19.3
20.4
22.1
24.3
24.3
25.3
25.5
25.3
0
5
10
15
20
25
30
1990
1991
1992
1993
19
94
1995
1996
1997
1998
1999
2000
2001
2002
2003
20
04
2005
2006
2007
2008
2009
0
5
10
15
20
25
30
35
40
45
1988
1989
1990
1991
1992
1993
19
94
1995
1996
1997
1998
1999
2000
2001
2002
2003
20
04
2005
2006
2007
2008
Domestic co-authorship only International co-authorship
66 See, for instance, the relevant work of John
Hagedoorn on this issue at www.merit.unu.edu/about/profile.php?id=26&stage=2.
67 See National Science Board (2010).
These figures include company-funded
and company-performed R&D.
68 See OECD (2009).
69 Note that this study was only based on a non-
representative sample of 59 companies.
45
Chapter 1 the Changing faCe of innovation and intelleCtual property
• Increasednationaland internationalcollaboration
in innovation: Innovation surveys show that more
R&D-intensive firms collaborate more than those that
conduct less R&D. In Chile, for instance, 74 percent
of the most R&D-intensive innovative firms collabo-
rate – defined as firms that innovate and have the
highest ratio of R&D expenditure over sales – while
only 60 percent of other R&D performers and only
35 percent of innovative firms that do not conduct
R&D collaborate (see Figure 1.15). Collaboration in
les developed economies tends to proceed on a dif-
ferent basis in such R&D constrained environments,
such as the need to simply adapt products for local
consumption. Surveys also show that the propensity
to collaborate on innovation with partners abroad
varies widely between countries (see Figure 1.16).
box 1.3: Caveats in the use of data on co-patenting as an indicator of international collaboration
Patent data showing the frequency of co-inventions, i.e., patents with several inventors listed as applicants, are frequently used to demonstrate that international collaboration among inventors is increasing.70
One of the advantages of patent data is their wide availability for many countries. One can use national patent data or data generated by the PCT System to showcase joint patent applicants with different national backgrounds.
To identify forms of “international” collaboration one assesses the nationality and/or residence of multiple inventors assigned to a particular patent. With increased global mobility and inventors with multiple or changed nationalities and residences, applying this procedure to identify true cross-border collaboration is not straightforward. If based solely on an inventor’s nationality as shown in patent databases, the following circumstances, for instance, could lead to the erroneous conclusion that cross-border cooperation had occurred where it actually had not: intra-organizational collabora-tion between two inventors of different nationalities who are in the same location for the duration of the project; collaboration between two inventors who reside in two different countries but work in the same country; an inventor who moves to a different country after a project has ended with the new residence appearing on the patent due to formal administrative delays.
In a recent paper by Bergek and Bruzelius (2010), the relevance of considering patents with multiple inventors from different countries as an indicator of international R&D collaboration has thus been questioned. Focusing on Swiss energy and automation firm ABB, the study shows that half of this firm’s patents which, according to existing methods, would be treated as if they were the result of international collaboration, are truly not. The other half would erroneously be qualified as “international collaboration” for the reasons listed above.
70 See, for instance, OECD (2010c) and WIPO (2010).
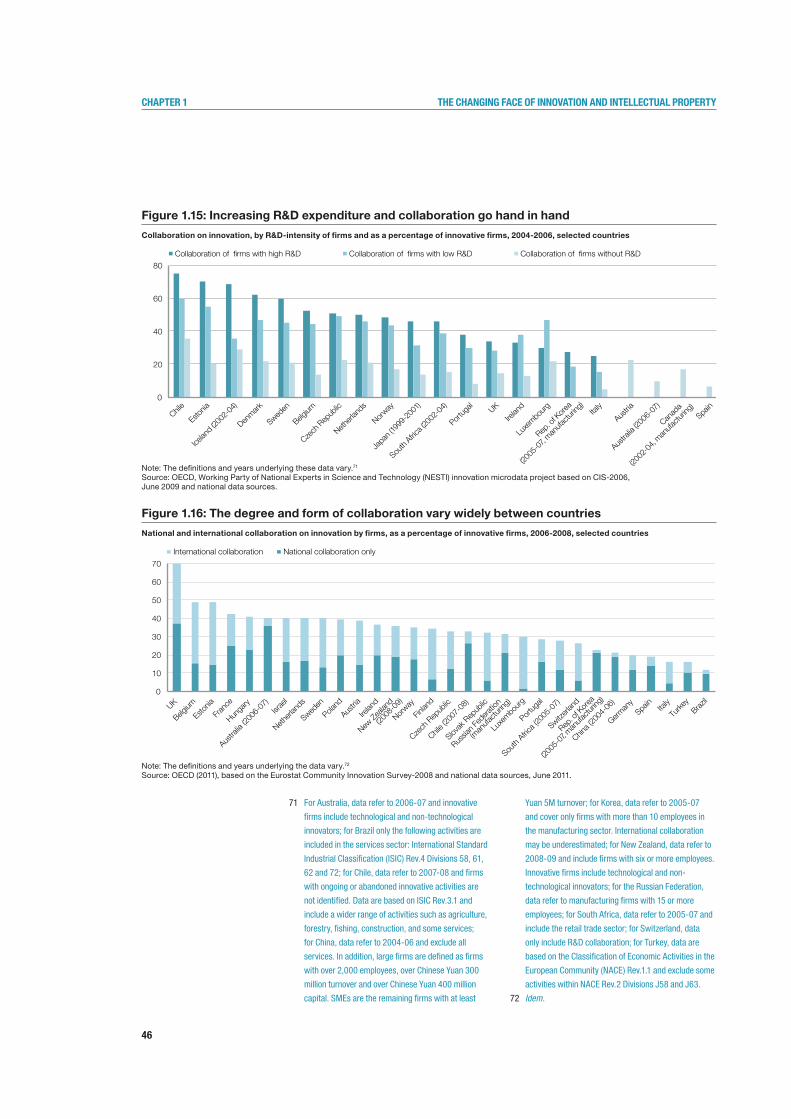
46
Chapter 1 the Changing faCe of innovation and intelleCtual property
Figure 1.15: Increasing R&D expenditure and collaboration go hand in hand
Collaboration on innovation, by R&D-intensity of firms and as a percentage of innovative firms, 2004-2006, selected countries
Note: The definitions and years underlying these data vary.71
Source: OECD, Working Party of National Experts in Science and Technology (NESTI) innovation microdata project based on CIS-2006, June 2009 and national data sources.
Figure 1.16: The degree and form of collaboration vary widely between countries
National and international collaboration on innovation by firms, as a percentage of innovative firms, 2006-2008, selected countries
Note: The definitions and years underlying the data vary.72
Source: OECD (2011), based on the Eurostat Community Innovation Survey-2008 and national data sources, June 2011.
0
20
40
60
80
Collaboration of rms with high R&D Collaboration of rms with low R&D Collaboration of rms without R&D
Chile
Estonia
Icelan
d (20
02-0
4)
Denmark
Sweden
Belgium
Czech
Rep
ublic
Netherl
ands
Norway
Japa
n (19
99-2
001)
South
Africa (
2002
-04)
Portug
al UK
Irelan
d
Luxe
mbourg
Rep. o
f Kor
ea
(2005
-07,
manufa
cturin
g) Ita
ly
Austria
Canad
a
(2002
-04,
manufa
cturin
g)
Austra
lia (2
006-
07)
Spain
0
10
20
30
40
50
60
70
UK
Belgium
Estonia
Fran
ce
Hunga
ry
Austra
lia (2
006-
07)
Israe
l
Netherl
ands
Sweden
Poland
Austria
Irelan
d
New Z
ealan
d
(2008
-09)
Norway
Finlan
d
Czech
Rep
ublic
Chile (
2007
-08)
Slovak
Rep
ublic
Russia
n Fed
eratio
n
(man
ufactu
ring)
Luxe
mbour
g
Portug
al
South
Africa (
2005
-07)
Switzerl
and
Rep. o
f Kor
ea
(2005
-07, m
anufa
cturin
g)
China (
2004
-06)
German
y
Spain
Italy
Turke
y
Brazil
International collaboration National collaboration only
71 For Australia, data refer to 2006-07 and innovative
firms include technological and non-technological
innovators; for Brazil only the following activities are
included in the services sector: International Standard
Industrial Classification (ISIC) Rev.4 Divisions 58, 61,
62 and 72; for Chile, data refer to 2007-08 and firms
with ongoing or abandoned innovative activities are
not identified. Data are based on ISIC Rev.3.1 and
include a wider range of activities such as agriculture,
forestry, fishing, construction, and some services;
for China, data refer to 2004-06 and exclude all
services. In addition, large firms are defined as firms
with over 2,000 employees, over Chinese Yuan 300
million turnover and over Chinese Yuan 400 million
capital. SMEs are the remaining firms with at least
Yuan 5M turnover; for Korea, data refer to 2005-07
and cover only firms with more than 10 employees in
the manufacturing sector. International collaboration
may be underestimated; for New Zealand, data refer to
2008-09 and include firms with six or more employees.
Innovative firms include technological and non-
technological innovators; for the Russian Federation,
data refer to manufacturing firms with 15 or more
employees; for South Africa, data refer to 2005-07 and
include the retail trade sector; for Switzerland, data
only include R&D collaboration; for Turkey, data are
based on the Classification of Economic Activities in the
European Community (NACE) Rev.1.1 and exclude some
activities within NACE Rev.2 Divisions J58 and J63.
72 Idem.
47
Chapter 1 the Changing faCe of innovation and intelleCtual property
To sum up, the above and other similar statistics show
that collaboration of various forms is indeed at the heart
of innovation. Yet, these and other data also demonstrate
that collaboration, in particular formalized forms such as
R&D joint ventures or other technology alliances, are far
from the norm.73 To the contrary, there are good reasons
why the extent of formal collaboration remains limited
(see Chapter 3) and why other innovation strategies, for
example the acquisition of other firms and their technolo-
gies, are important in practice.
Importantly, geographical proximity still matters when
forming innovation-related partnerships as, despite
increased internationalization, innovative activity is often
conducted in clusters.
What is “open innovation” and how important
is it really?
Complementing the above trend towards increased col-
laboration, recent contributions in the innovation literature
discuss the emerging phenomenon of “open innovation”.74
Chesbrough et al. (2006) defines open innovation as “the
use of purposive inflows and outflows of knowledge to
accelerate internal innovation and to expand the markets
for external use of innovation, respectively”. Increasingly,
companies are said to “openly” innovate by enlarging the
process to include customers, suppliers, competitors,
universities and research institutes, and others, as they
rely on outside ideas for new products and processes.
The business literature also refers to “crowd-sourcing”,
which allows firms and other organizations to find solu-
tions to business and other challenges by seeking the
expertise of a large number of potential “solvers”, custom-
ers, suppliers and the like.
Table 1.2 describes four forms of open innovation, some
of which involve pecuniary compensation for ideas and
others that do not. Two of these forms are associated
with inbound and two with outbound open innovation.
• Inboundopeninnovation is the practice of leveraging
the technologies and discoveries of others. It requires
the opening up to, and establishment of interorgani-
zational relationships with, external entities. It aims to
access others’ technical and scientific competencies.
Proprietary technologies are transferred to the initiating
entity for commercial exploitation.
• Outboundopeninnovation is the practice of es-
tablishing relationships with external organizations
to which proprietary technologies are transferred for
commercial exploitation.
73 See Tether (2002).
74 OECD (2009); Chesbrough (2003);
and Dahlander and Gann (2010).
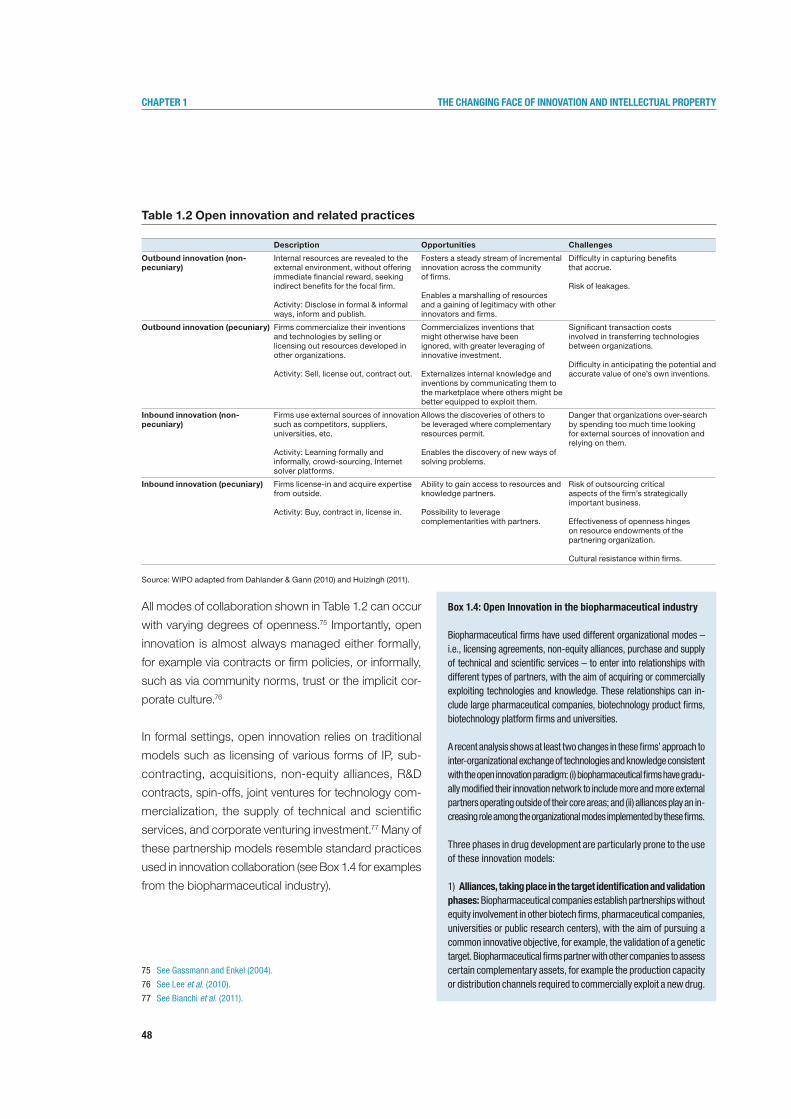
48
Chapter 1 the Changing faCe of innovation and intelleCtual property
Table 1.2 Open innovation and related practices
Source: WIPO adapted from Dahlander & Gann (2010) and Huizingh (2011).
All modes of collaboration shown in Table 1.2 can occur
with varying degrees of openness.75 Importantly, open
innovation is almost always managed either formally,
for example via contracts or firm policies, or informally,
such as via community norms, trust or the implicit cor-
porate culture.76
In formal settings, open innovation relies on traditional
models such as licensing of various forms of IP, sub-
contracting, acquisitions, non-equity alliances, R&D
contracts, spin-offs, joint ventures for technology com-
mercialization, the supply of technical and scientific
services, and corporate venturing investment.77 Many of
these partnership models resemble standard practices
used in innovation collaboration (see Box 1.4 for examples
from the biopharmaceutical industry).
Description Opportunities Challenges
Outbound innovation (non-pecuniary)
Internal resources are revealed to the external environment, without offering immediate financial reward, seeking indirect benefits for the focal firm.
Activity: Disclose in formal & informal ways, inform and publish.
Fosters a steady stream of incremental innovation across the community of firms.
Enables a marshalling of resources and a gaining of legitimacy with other innovators and firms.
Difficulty in capturing benefits that accrue.
Risk of leakages.
Outbound innovation (pecuniary) Firms commercialize their inventions and technologies by selling or licensing out resources developed in other organizations.
Activity: Sell, license out, contract out.
Commercializes inventions that might otherwise have been ignored, with greater leveraging of innovative investment.
Externalizes internal knowledge and inventions by communicating them to the marketplace where others might be better equipped to exploit them.
Significant transaction costs involved in transferring technologies between organizations.
Difficulty in anticipating the potential and accurate value of one’s own inventions.
Inbound innovation (non-pecuniary)
Firms use external sources of innovation such as competitors, suppliers, universities, etc.
Activity: Learning formally and informally, crowd-sourcing, Internet solver platforms.
Allows the discoveries of others to be leveraged where complementary resources permit.
Enables the discovery of new ways of solving problems.
Danger that organizations over-search by spending too much time looking for external sources of innovation and relying on them.
Inbound innovation (pecuniary) Firms license-in and acquire expertise from outside.
Activity: Buy, contract in, license in.
Ability to gain access to resources and knowledge partners.
Possibility to leverage complementarities with partners.
Risk of outsourcing critical aspects of the firm’s strategically important business.
Effectiveness of openness hinges on resource endowments of the partnering organization.
Cultural resistance within firms.
75 See Gassmann and Enkel (2004).
76 See Lee et al. (2010).
77 See Bianchi et al. (2011).
box 1.4: open Innovation in the biopharmaceutical industry
Biopharmaceutical firms have used different organizational modes – i.e., licensing agreements, non-equity alliances, purchase and supply of technical and scientific services – to enter into relationships with different types of partners, with the aim of acquiring or commercially exploiting technologies and knowledge. These relationships can in-clude large pharmaceutical companies, biotechnology product firms, biotechnology platform firms and universities.
A recent analysis shows at least two changes in these firms’ approach to inter-organizational exchange of technologies and knowledge consistent with the open innovation paradigm: (i) biopharmaceutical firms have gradu-ally modified their innovation network to include more and more external partners operating outside of their core areas; and (ii) alliances play an in-creasing role among the organizational modes implemented by these firms.
Three phases in drug development are particularly prone to the use of these innovation models:
1) Alliances, taking place in the target identification and validation phases: Biopharmaceutical companies establish partnerships without equity involvement in other biotech firms, pharmaceutical companies, universities or public research centers), with the aim of pursuing a common innovative objective, for example, the validation of a genetic target. Biopharmaceutical firms partner with other companies to assess certain complementary assets, for example the production capacity or distribution channels required to commercially exploit a new drug.
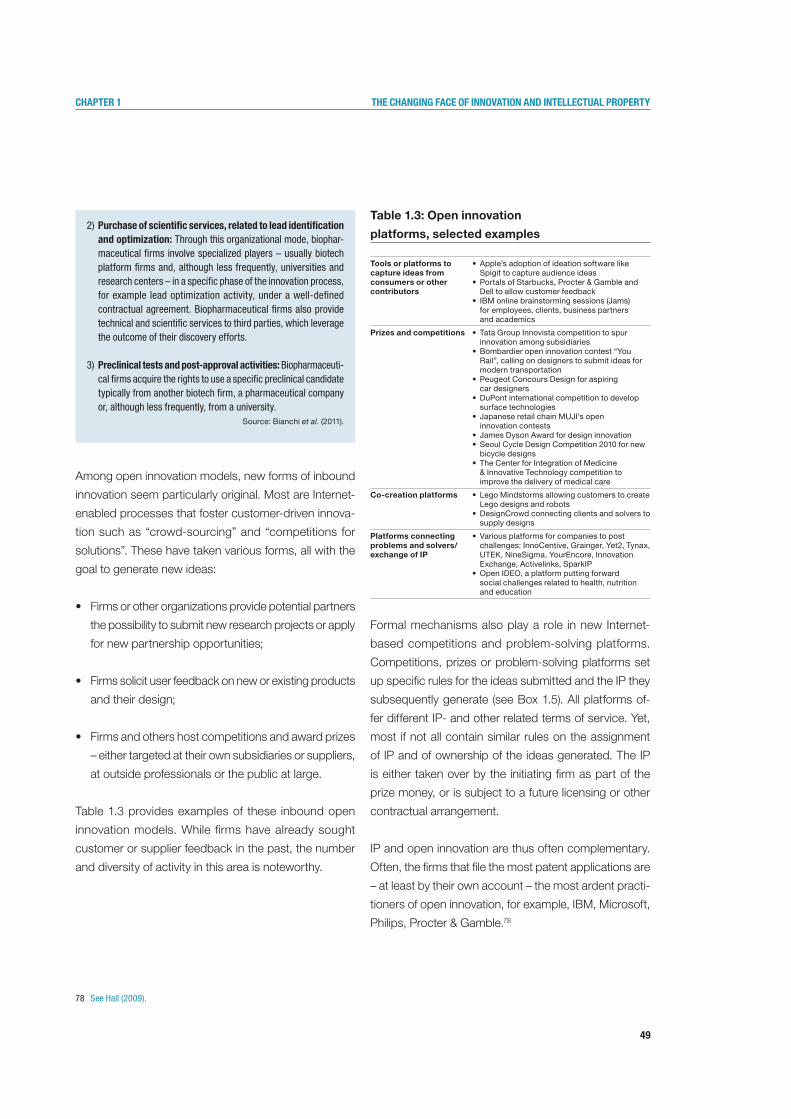
49
Chapter 1 the Changing faCe of innovation and intelleCtual property
Among open innovation models, new forms of inbound
innovation seem particularly original. Most are Internet-
enabled processes that foster customer-driven innova-
tion such as “crowd-sourcing” and “competitions for
solutions”. These have taken various forms, all with the
goal to generate new ideas:
• Firmsorotherorganizationsprovidepotentialpartners
the possibility to submit new research projects or apply
for new partnership opportunities;
• Firmssolicituserfeedbackonneworexistingproducts
and their design;
• Firmsandothershostcompetitionsandawardprizes
– either targeted at their own subsidiaries or suppliers,
at outside professionals or the public at large.
Table 1.3 provides examples of these inbound open
innovation models. While firms have already sought
customer or supplier feedback in the past, the number
and diversity of activity in this area is noteworthy.
Table 1.3: Open innovation
platforms, selected examples
Formal mechanisms also play a role in new Internet-
based competitions and problem-solving platforms.
Competitions, prizes or problem-solving platforms set
up specific rules for the ideas submitted and the IP they
subsequently generate (see Box 1.5). All platforms of-
fer different IP- and other related terms of service. Yet,
most if not all contain similar rules on the assignment
of IP and of ownership of the ideas generated. The IP
is either taken over by the initiating firm as part of the
prize money, or is subject to a future licensing or other
contractual arrangement.
IP and open innovation are thus often complementary.
Often, the firms that file the most patent applications are
– at least by their own account – the most ardent practi-
tioners of open innovation, for example, IBM, Microsoft,
Philips, Procter & Gamble.78
78 See Hall (2009).
2) Purchase of scientific services, related to lead identification and optimization: Through this organizational mode, biophar-maceutical firms involve specialized players – usually biotech platform firms and, although less frequently, universities and research centers – in a specific phase of the innovation process, for example lead optimization activity, under a well-defined contractual agreement. Biopharmaceutical firms also provide technical and scientific services to third parties, which leverage the outcome of their discovery efforts.
3) Preclinical tests and post-approval activities: Biopharmaceuti-cal firms acquire the rights to use a specific preclinical candidate typically from another biotech firm, a pharmaceutical company or, although less frequently, from a university.
Source: Bianchi et al. (2011).
Tools or platforms to capture ideas from consumers or other contributors
• Apple’sadoptionofideationsoftwarelikeSpigit to capture audience ideas
• PortalsofStarbucks,Procter&GambleandDell to allow customer feedback
• IBMonlinebrainstormingsessions(Jams)for employees, clients, business partners and academics
Prizes and competitions • TataGroupInnovistacompetitiontospurinnovation among subsidiaries
• Bombardieropeninnovationcontest“YouRail”, calling on designers to submit ideas for modern transportation
• PeugeotConcoursDesignforaspiringcar designers
• DuPontinternationalcompetitiontodevelopsurface technologies
• JapaneseretailchainMUJI’sopeninnovation contests
• JamesDysonAwardfordesigninnovation• SeoulCycleDesignCompetition2010fornew
bicycle designs• TheCenterforIntegrationofMedicine
& Innovative Technology competition to improve the delivery of medical care
Co-creation platforms • LegoMindstormsallowingcustomerstocreateLego designs and robots
• DesignCrowdconnectingclientsandsolverstosupply designs
Platforms connecting problems and solvers/exchange of IP
• Variousplatformsforcompaniestopostchallenges:InnoCentive,Grainger,Yet2,Tynax,UTEK,NineSigma,YourEncore,InnovationExchange, Activelinks, SparkIP
• OpenIDEO,aplatformputtingforwardsocial challenges related to health, nutrition and education

50
Chapter 1 the Changing faCe of innovation and intelleCtual property
Various phenomena have emerged in recent years based
on Internet-enabled collaboration, sometimes without a
market context, according to which individuals develop
innovative solutions for the public domain. In this context,
open source software, where individual software pro-
grammers invest time and resources in solving particular
problems without apparent direct remuneration, has
captured the most attention (see Chapter 3).
New inbound innovation models are also increasingly
used for other not-for-profit objectives or to solve chal-
lenges that lie between purely commercial and non-
commercial interests. Firms, universities, new entre-
preneurial platforms and governments have used such
contests and platforms to generate solutions to societal
challenges ranging from education, access to health,
access to water and other issues.
In the same spirit, collaborative efforts between the
public, the non-profit and private sectors are under way
which aim at inventions and innovation that the market
alone might not be able to generate. New R&D funding
mechanisms for solutions to rare diseases or other social
challenges have attracted increasing interest.80
These activities have piqued the interest of scholars and
practitioners alike, including in the quest to determine
whether such innovative methods could be a new source
of innovation.
As in the case of more traditional collaboration models,
assessing the true scale and importance of open in-
novation is hindered by definitional and measurement
challenges. Drawing a clear distinction between long-
standing collaborative practices and truly new practices is
difficult. Indeed, long-time existing practices, for example
the identification of research partners in foreign markets,
are now often relabeled by firms as part of their “open
innovation” strategies.
The available data (in part discussed in the previous
subsection) confirm an increased interest in leveraging
external sources of knowledge to complement firms’
internal activities.81 When asked how much open innova-
tion they are conducting, large MNEs – in particular in
the IT, consumer product and, more recently, pharma-
ceutical sectors – claim substantial involvement in these
new areas.82 To some extent, the increased journalistic
and academic attention devoted to open innovation
contributes to this perceived increase. Firms are eager
to portray themselves as active participants in and to
show their willingness to be a part of new innovation
management processes.
box 1.5: The attribution of ideas in open innovation contests, competitions and platforms
A review of the terms of service of InnoCentive yields the following IP-related rules:
• Individualsolverswhoopttoworkonaspecificproblemfeaturedon the platform must often sign a non-disclosure agreement before receiving the relevant information allowing them to begin searching for a solution.
• Firmsalreadyawareofaparticularsolver’sexistingIParenotobligated to pay for a solution proposing that IP. Firms should specify that “novel” solutions are required.
• Onceasolveracceptsthechallengeaward,theIPistransferredto the seeker. If the solver already holds a patent on the solution selected, the right to use that patent is transferred to the seeking entity. The solver is responsible for determining his/her ability to transfer the IP and is obligated to cooperate to ensure that the seeker obtains all rights, titles and interests in the solution and any work product related to the challenge.
• Thesolvermust,onrequest,obtainasignedandnotarizeddocument from his or her employer waiving any and all rights to IP contained in the solution.
• Solutionsnotacquiredbyseekersareguaranteednottoshowup in a seeker’s IP portfolio at a later stage.
Source: Terms of Use, InnoCentive.79
79 See www.innocentive.com/ar/contract/view.
80 Finally, the rise of Internet platforms is important,
with attention focusing on phenomena such
as user-created content on platforms such as
Wikipedia and YouTube and new institutional forms
such as Creative Commons, mostly relating to the
production of creative works and journalism.
81 See Chesbrough and Crowther (2006).
82 See OECD (2009).
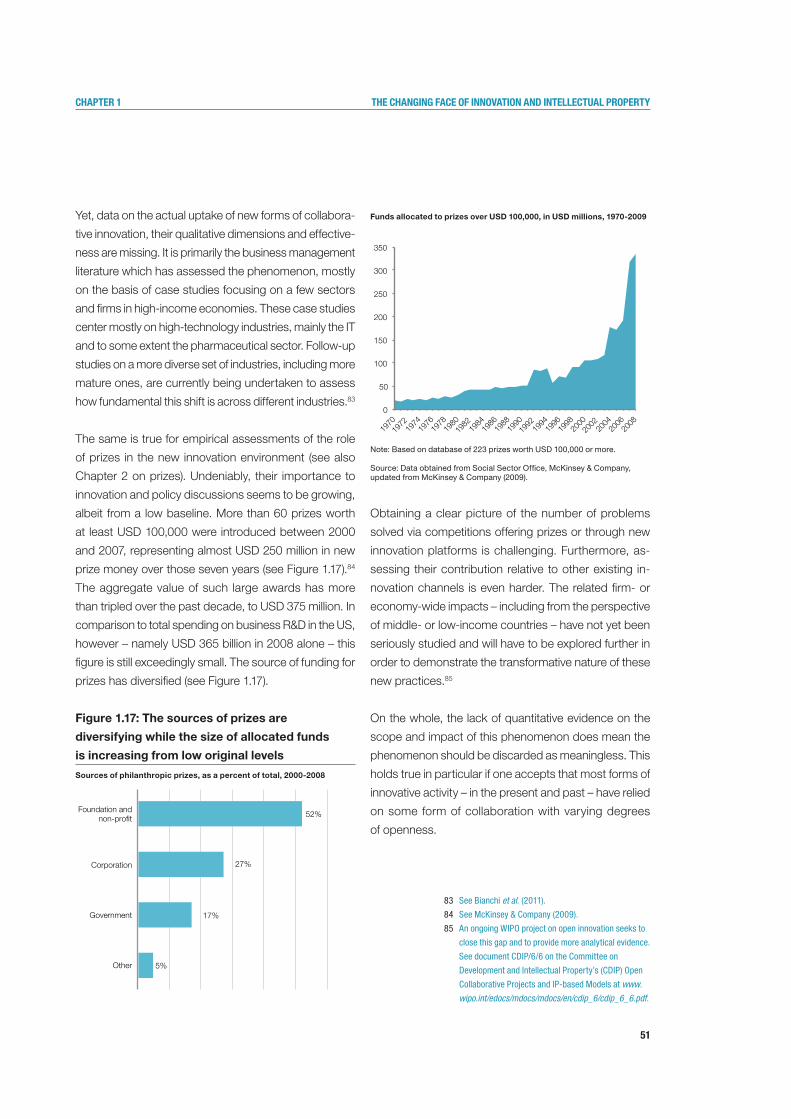
51
Chapter 1 the Changing faCe of innovation and intelleCtual property
Yet, data on the actual uptake of new forms of collabora-
tive innovation, their qualitative dimensions and effective-
ness are missing. It is primarily the business management
literature which has assessed the phenomenon, mostly
on the basis of case studies focusing on a few sectors
and firms in high-income economies. These case studies
center mostly on high-technology industries, mainly the IT
and to some extent the pharmaceutical sector. Follow-up
studies on a more diverse set of industries, including more
mature ones, are currently being undertaken to assess
how fundamental this shift is across different industries.83
The same is true for empirical assessments of the role
of prizes in the new innovation environment (see also
Chapter 2 on prizes). Undeniably, their importance to
innovation and policy discussions seems to be growing,
albeit from a low baseline. More than 60 prizes worth
at least USD 100,000 were introduced between 2000
and 2007, representing almost USD 250 million in new
prize money over those seven years (see Figure 1.17).84
The aggregate value of such large awards has more
than tripled over the past decade, to USD 375 million. In
comparison to total spending on business R&D in the US,
however – namely USD 365 billion in 2008 alone – this
figure is still exceedingly small. The source of funding for
prizes has diversified (see Figure 1.17).
Figure 1.17: The sources of prizes are
diversifying while the size of allocated funds
is increasing from low original levels
Sources of philanthropic prizes, as a percent of total, 2000-2008
Funds allocated to prizes over USD 100,000, in USD millions, 1970-2009
Note: Based on database of 223 prizes worth USD 100,000 or more.
Source: Data obtained from Social Sector Office, McKinsey & Company, updated from McKinsey & Company (2009).
Obtaining a clear picture of the number of problems
solved via competitions offering prizes or through new
innovation platforms is challenging. Furthermore, as-
sessing their contribution relative to other existing in-
novation channels is even harder. The related firm- or
economy-wide impacts – including from the perspective
of middle- or low-income countries – have not yet been
seriously studied and will have to be explored further in
order to demonstrate the transformative nature of these
new practices.85
On the whole, the lack of quantitative evidence on the
scope and impact of this phenomenon does mean the
phenomenon should be discarded as meaningless. This
holds true in particular if one accepts that most forms of
innovative activity – in the present and past – have relied
on some form of collaboration with varying degrees
of openness.
83 See Bianchi et al. (2011).
84 See McKinsey & Company (2009).
85 An ongoing WIPO project on open innovation seeks to
close this gap and to provide more analytical evidence.
See document CDIP/6/6 on the Committee on
Development and Intellectual Property’s (CDIP) Open
Collaborative Projects and IP-based Models at www.wipo.int/edocs/mdocs/mdocs/en/cdip_6/cdip_6_6.pdf.
5%
17%
27%
52%
Other
Government
Corporation
Foundation andnon-pro�t
0
50
100
150
200
250
300
350
1970
1972
19
74
1976
1978
1980
1982
19
84
1986
1988
1990
1992
19
94
1996
1998
2000
2002
20
04
2006
2008
52
Chapter 1 the Changing faCe of innovation and intelleCtual property
1.3Shifting importance of IP
IP not only drives change in the field of innovation but
is itself also impacted by the changing innovation sys-
tem. In the new innovation landscape, IP is a vehicle for
knowledge transfer and protection, facilitating vertical
disintegration of knowledge-based industries. New types
of firms – and in particular new types of intermediaries –
thrive as a result of their intangible IP assets. Invariably,
the nature of innovation also impacts the demands on
the IP system.
1.3.1Demand and the changing geography of the IP system
A few years ago, patenting and other forms of IP activity
were mostly seen as belonging to the domain of corporate
legal departments, with patents used mainly in-house.
Today, an increasing number of companies treat IP as
a central business asset that is managed strategically
and valued and leveraged with a view to generating
returns through active licensing.86 Patents in particular
are increasingly used as collateral for bank loans by
patent holders, and as investment assets by financial
institutions.87 Small enterprises, newly-established or
research-oriented firms depend on IP to generate rev-
enue and use IP to obtain financing, including venture
capital investments (see Chapter 2).88 Beyond patents,
business models and firm strategies tend to rely on
complementary protection of trademarks, designs and
copyright, although this trend and the complementarity
to patent use are harder to quantify.
At the same time, there has been a shift in the IP land-
scape with new countries emerging as important players
and greater emphasis placed on international protection
of inventions. This has also invariably led to a growing
demand for IP.
Growing demand for IP rights
Over the last two decades, the use of the IP system has
intensified to unprecedented levels.
Demand for patents increased across the world from
around 800,000 patent applications in the early 1980s to
1.8 million by 2009, with the greatest increase in demand
occurring as of the mid-1990s. Growth in patent applica-
tions was stable until the 1970s, followed by acceleration,
first in Japan and then in the US. Growth in fast-growing
middle-income countries such as China and India picked
up from the mid-1990s onwards (see Figure 1.18, at top).86 See Arora et al. (2001); Gambardella
et al. (2007); and Lichtenthaler (2009).
87 See Kamiyama (2005) and Otsuyama (2003).
88 See WIPO (2011d).
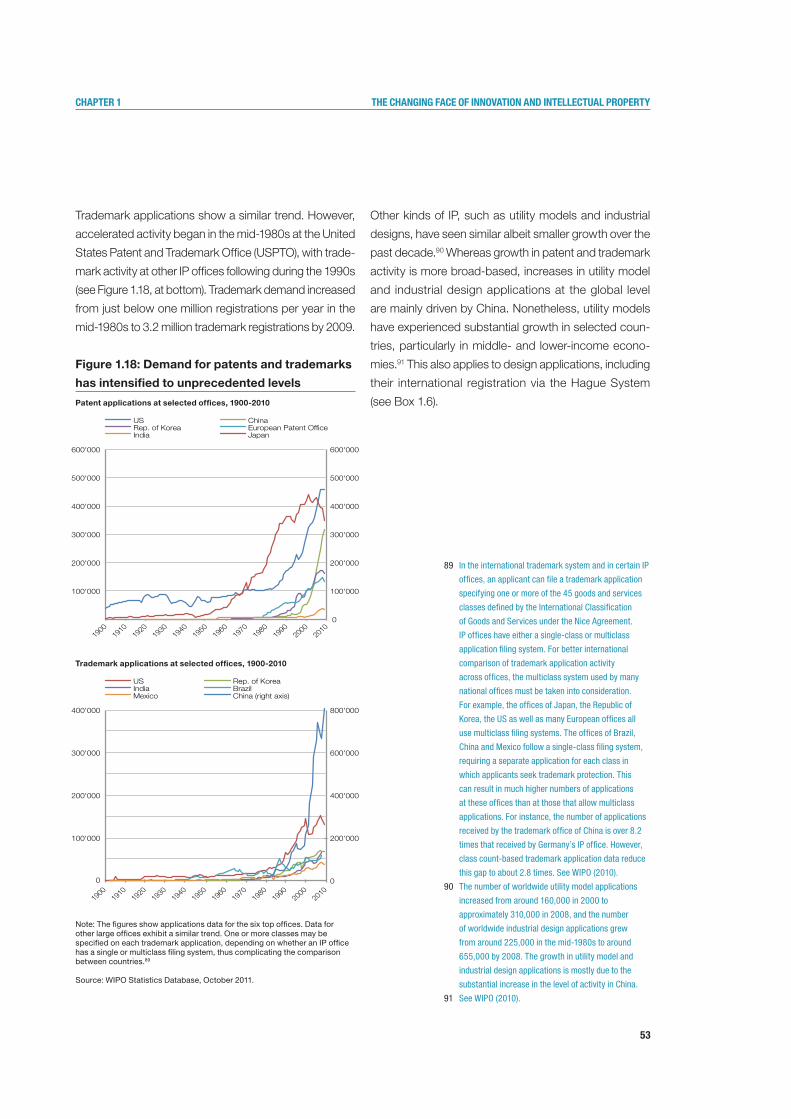
53
Chapter 1 the Changing faCe of innovation and intelleCtual property
Trademark applications show a similar trend. However,
accelerated activity began in the mid-1980s at the United
States Patent and Trademark Office (USPTO), with trade-
mark activity at other IP offices following during the 1990s
(see Figure 1.18, at bottom). Trademark demand increased
from just below one million registrations per year in the
mid-1980s to 3.2 million trademark registrations by 2009.
Figure 1.18: Demand for patents and trademarks
has intensified to unprecedented levels
Patent applications at selected offices, 1900-2010
Trademark applications at selected offices, 1900-2010
Note: The figures show applications data for the six top offices. Data for other large offices exhibit a similar trend. One or more classes may be specified on each trademark application, depending on whether an IP office has a single or multiclass filing system, thus complicating the comparison between countries.89
Source: WIPO Statistics Database, October 2011.
Other kinds of IP, such as utility models and industrial
designs, have seen similar albeit smaller growth over the
past decade.90 Whereas growth in patent and trademark
activity is more broad-based, increases in utility model
and industrial design applications at the global level
are mainly driven by China. Nonetheless, utility models
have experienced substantial growth in selected coun-
tries, particularly in middle- and lower-income econo-
mies.91 This also applies to design applications, including
their international registration via the Hague System
(see Box 1.6).
0
100'000
200'000
300'000
400'000
500'000
600'000
100'000
200'000
300'000
400'000
500'000
600'000
1900
19
10
1920
19
30
1940
19
50
1960
19
70
1980
19
90
2000
20
10
US China Rep. of Korea European Patent Of ce India Japan
0
200'000
400'000
600'000
800'000
0
100'000
200'000
300'000
400'000
1900
1910
1920
1930
1940
1950
1960
1970
1980
1990
2000
2010
US Rep. of Korea India Brazil Mexico China (right axis)
89 In the international trademark system and in certain IP
offices, an applicant can file a trademark application
specifying one or more of the 45 goods and services
classes defined by the International Classification
of Goods and Services under the Nice Agreement.
IP offices have either a single-class or multiclass
application filing system. For better international
comparison of trademark application activity
across offices, the multiclass system used by many
national offices must be taken into consideration.
For example, the offices of Japan, the Republic of
Korea, the US as well as many European offices all
use multiclass filing systems. The offices of Brazil,
China and Mexico follow a single-class filing system,
requiring a separate application for each class in
which applicants seek trademark protection. This
can result in much higher numbers of applications
at these offices than at those that allow multiclass
applications. For instance, the number of applications
received by the trademark office of China is over 8.2
times that received by Germany’s IP office. However,
class count-based trademark application data reduce
this gap to about 2.8 times. See WIPO (2010).
90 The number of worldwide utility model applications
increased from around 160,000 in 2000 to
approximately 310,000 in 2008, and the number
of worldwide industrial design applications grew
from around 225,000 in the mid-1980s to around
655,000 by 2008. The growth in utility model and
industrial design applications is mostly due to the
substantial increase in the level of activity in China.
91 See WIPO (2010).
0
100'000
200'000
300'000
400'000
500'000
600'000
100'000
200'000
300'000
400'000
500'000
600'000
1900
19
10
1920
19
30
1940
19
50
1960
19
70
1980
19
90
2000
20
10
US China Rep. of Korea European Patent Of ce India Japan
0
200'000
400'000
600'000
800'000
0
100'000
200'000
300'000
400'000
1900
1910
1920
1930
1940
1950
1960
1970
1980
1990
2000
2010
US Rep. of Korea India Brazil Mexico China (right axis)

54
Chapter 1 the Changing faCe of innovation and intelleCtual property
Figure 1.19: Positive trend in industrial design
applications after a decade of stagnation
Number of and year-on-year growth in industrial design applications, 1985-2009
Note: The world total is a WIPO estimate covering around 120 IP offices.
Source: Forthcoming World Intellectual Property Indicators Report, WIPO (2011d).
The economic literature has largely focused on un-
derstanding the surge in patent applications, which
is due to a number of factors. These include a greater
reliance on intangible assets and the internationaliza-
tion of innovation activity. Among the factors identified
as causing this surge are the following, which partly
describe the same trends:
1) Increased investment in R&D and changes in the
propensity to patent: The significant growth in world-
wide R&D expenditure and the shift towards more applied
R&D worldwide have led to more patentable inventions.96
Furthermore, increasing levels of R&D activity in new
technology fields drove increased patenting activity.
Growth in R&D expenditure and demand for patents both
show an upward trend, but the growth rate of world R&D
outstripped that of patent applications between 1977
and 2007. The number of patents per business R&D
expenditure has thus decreased.97 There are exceptions
at the country-level, most notably in the US which has
filed more patents over time per dollar spent on R&D.
box 1.6: design is important for product innovation
Design seems to be increasingly important in helping turn technological inventions into innovative new commercial products, i.e., facilitating the journey of technology or an invention from development through to the marketplace.92 The latest estimates for the UK put spending on new engineering and architectural design at Great Britain Pounds (GBP) 44 billion, or 30 percent of all intangible investments.93 This represents one and a half times the estimated expenditure by firms on training and five times the spending on R&D. A new study for the UK also shows that the majority of IP investment is on assets protected by copyright and design rights.94
Industrial design rights can be applied to a wide variety of industrial and handicraft products, emphasizing the importance of design in innovation. The most popular industrial design classes are packages for the transport of goods and food products; clocks and watches; furniture, housewares and electrical appliances; vehicles and architectural structures; fashion and textile designs; and leisure goods. New classes for graphic logos are also increasingly filed in design registrations.
The number of industrial design applications filed worldwide in 2009 stood at approximately 640,000 (see Figure 1.19). This is the sixteenth consecutive year of growth, following a decade of stagna-tion. This rise in global applications can primarily be attributed to the exponential increase in industrial design applications in China. WIPO recorded 2,216 international registrations (+31.8 percent) via the Hague System in 2010, for a total of 11,238 designs (+26.7 percent).95
Despite these parallel increases in the importance of product design and in applications for design rights, the interaction between the two, i.e., whether the existence of design rights fosters better design, is ill-understood. Information on the share of designs covered by design rights is also not available.
0.0% 3.6%
7.0% 11.4%
6.7%
17.5%
10.3%
16.1%
6.8% 4.0%
0
100'000
200'000
300'000
400'000
500'000
600'000
700'000
2000 2001 2002 2003 2004 2005 2006 2007 2008 2009
Year-on-year growth (in percent)
Industrial design applications
92 See HM Treasury (2005).
93 See Gil and Haskell (2008).
94 See UK Intellectual Property Office (2011).
95 See WIPO (2011a).
96 See Kortum and Lerner (1999).
97 See WIPO (2011b).
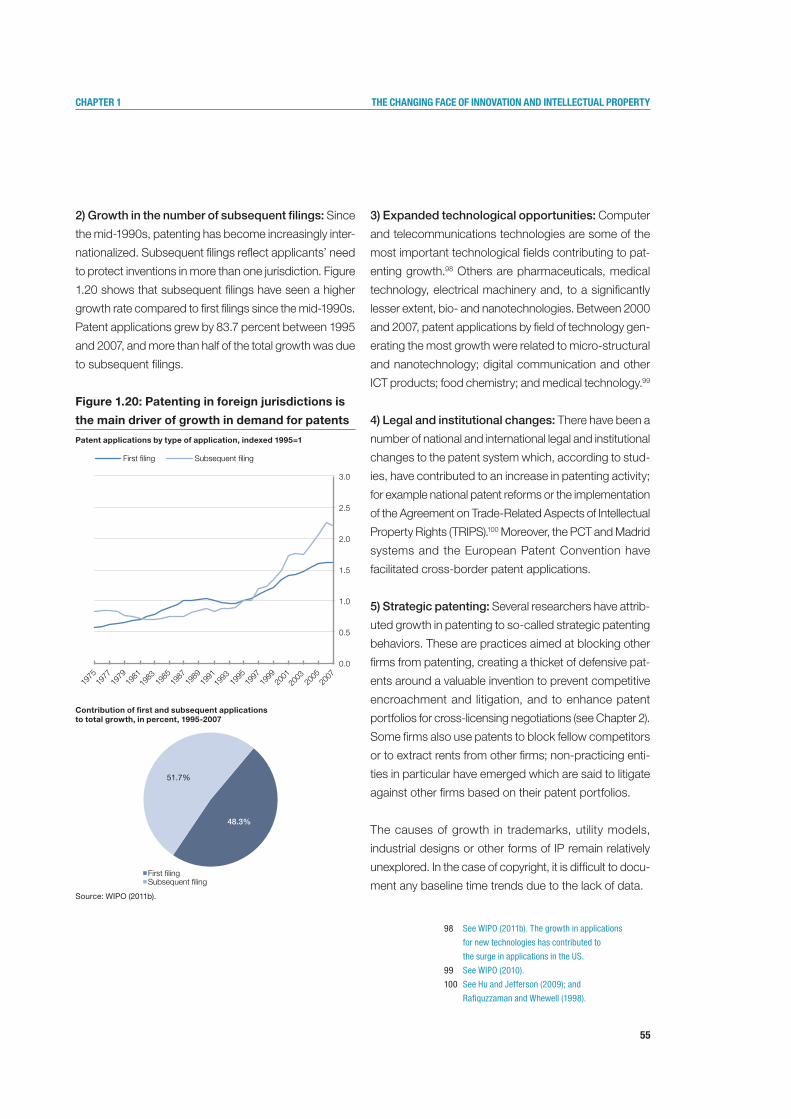
55
Chapter 1 the Changing faCe of innovation and intelleCtual property
2) Growth in the number of subsequent filings: Since
the mid-1990s, patenting has become increasingly inter-
nationalized. Subsequent filings reflect applicants’ need
to protect inventions in more than one jurisdiction. Figure
1.20 shows that subsequent filings have seen a higher
growth rate compared to first filings since the mid-1990s.
Patent applications grew by 83.7 percent between 1995
and 2007, and more than half of the total growth was due
to subsequent filings.
Figure 1.20: Patenting in foreign jurisdictions is
the main driver of growth in demand for patents
Patent applications by type of application, indexed 1995=1
Contribution of first and subsequent applications to total growth, in percent, 1995-2007
Source: WIPO (2011b).
3) Expanded technological opportunities: Computer
and telecommunications technologies are some of the
most important technological fields contributing to pat-
enting growth.98 Others are pharmaceuticals, medical
technology, electrical machinery and, to a significantly
lesser extent, bio- and nanotechnologies. Between 2000
and 2007, patent applications by field of technology gen-
erating the most growth were related to micro-structural
and nanotechnology; digital communication and other
ICT products; food chemistry; and medical technology.99
4) Legal and institutional changes: There have been a
number of national and international legal and institutional
changes to the patent system which, according to stud-
ies, have contributed to an increase in patenting activity;
for example national patent reforms or the implementation
of the Agreement on Trade-Related Aspects of Intellectual
Property Rights (TRIPS).100 Moreover, the PCT and Madrid
systems and the European Patent Convention have
facilitated cross-border patent applications.
5) Strategic patenting: Several researchers have attrib-
uted growth in patenting to so-called strategic patenting
behaviors. These are practices aimed at blocking other
firms from patenting, creating a thicket of defensive pat-
ents around a valuable invention to prevent competitive
encroachment and litigation, and to enhance patent
portfolios for cross-licensing negotiations (see Chapter 2).
Some firms also use patents to block fellow competitors
or to extract rents from other firms; non-practicing enti-
ties in particular have emerged which are said to litigate
against other firms based on their patent portfolios.
The causes of growth in trademarks, utility models,
industrial designs or other forms of IP remain relatively
unexplored. In the case of copyright, it is difficult to docu-
ment any baseline time trends due to the lack of data.
98 See WIPO (2011b). The growth in applications
for new technologies has contributed to
the surge in applications in the US.
99 See WIPO (2010).
100 See Hu and Jefferson (2009); and
Rafiquzzaman and Whewell (1998).
48.3%
51.7%
First ling Subsequent ling
0.0
0.5
1.0
1.5
2.0
2.5
3.0
1975
1977
1979
1981
1983
19
85
1987
1989
1991
1993
19
95
1997
1999
2001
2003
20
05
2007
First ling Subsequent ling
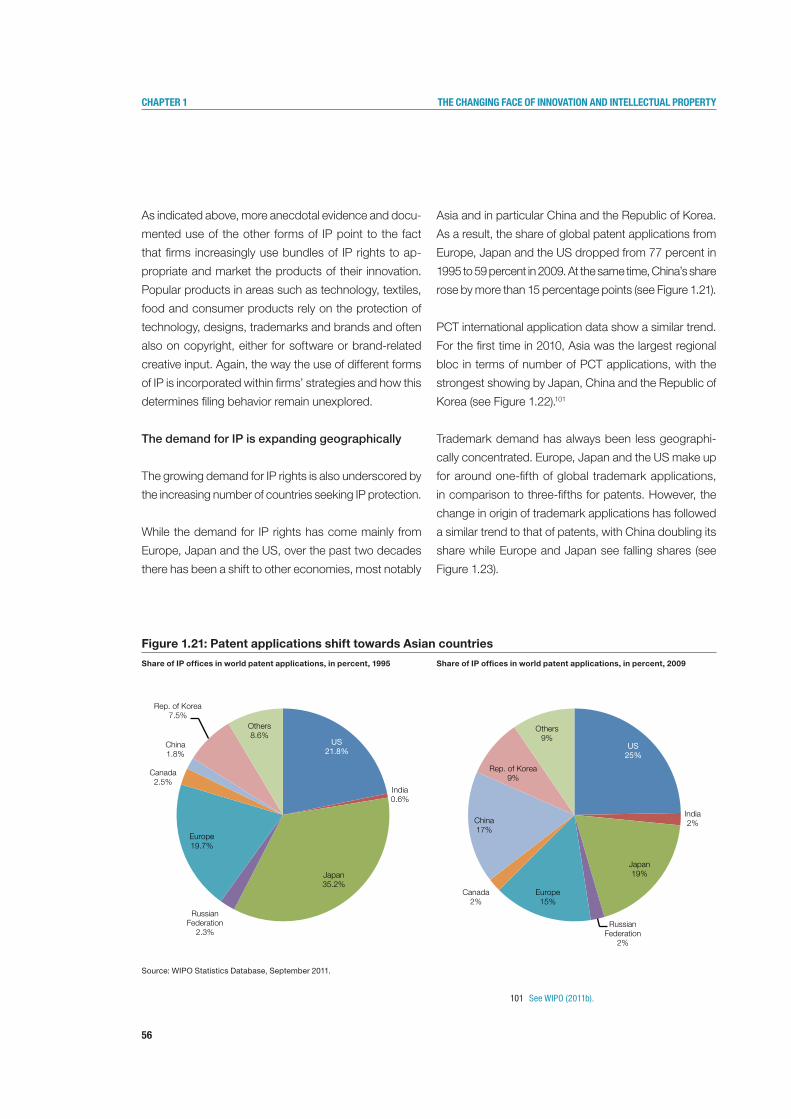
56
Chapter 1 the Changing faCe of innovation and intelleCtual property
Figure 1.21: Patent applications shift towards Asian countries
Share of IP offices in world patent applications, in percent, 1995
Source: WIPO Statistics Database, September 2011.
Share of IP offices in world patent applications, in percent, 2009
As indicated above, more anecdotal evidence and docu-
mented use of the other forms of IP point to the fact
that firms increasingly use bundles of IP rights to ap-
propriate and market the products of their innovation.
Popular products in areas such as technology, textiles,
food and consumer products rely on the protection of
technology, designs, trademarks and brands and often
also on copyright, either for software or brand-related
creative input. Again, the way the use of different forms
of IP is incorporated within firms’ strategies and how this
determines filing behavior remain unexplored.
The demand for IP is expanding geographically
The growing demand for IP rights is also underscored by
the increasing number of countries seeking IP protection.
While the demand for IP rights has come mainly from
Europe, Japan and the US, over the past two decades
there has been a shift to other economies, most notably
Asia and in particular China and the Republic of Korea.
As a result, the share of global patent applications from
Europe, Japan and the US dropped from 77 percent in
1995 to 59 percent in 2009. At the same time, China’s share
rose by more than 15 percentage points (see Figure 1.21).
PCT international application data show a similar trend.
For the first time in 2010, Asia was the largest regional
bloc in terms of number of PCT applications, with the
strongest showing by Japan, China and the Republic of
Korea (see Figure 1.22).101
Trademark demand has always been less geographi-
cally concentrated. Europe, Japan and the US make up
for around one-fifth of global trademark applications,
in comparison to three-fifths for patents. However, the
change in origin of trademark applications has followed
a similar trend to that of patents, with China doubling its
share while Europe and Japan see falling shares (see
Figure 1.23).
US 25%
India 2%
Japan 19%
Russian Federation
2%
Europe 15%
Canada 2%
China 17%
Rep. of Korea 9%
Others 9% US
21.8%
India 0.6%
Japan 35.2%
Russian Federation
2.3%
Europe 19.7%
Canada 2.5%
China 1.8%
Rep. of Korea 7.5%
Others 8.6%
101 See WIPO (2011b).
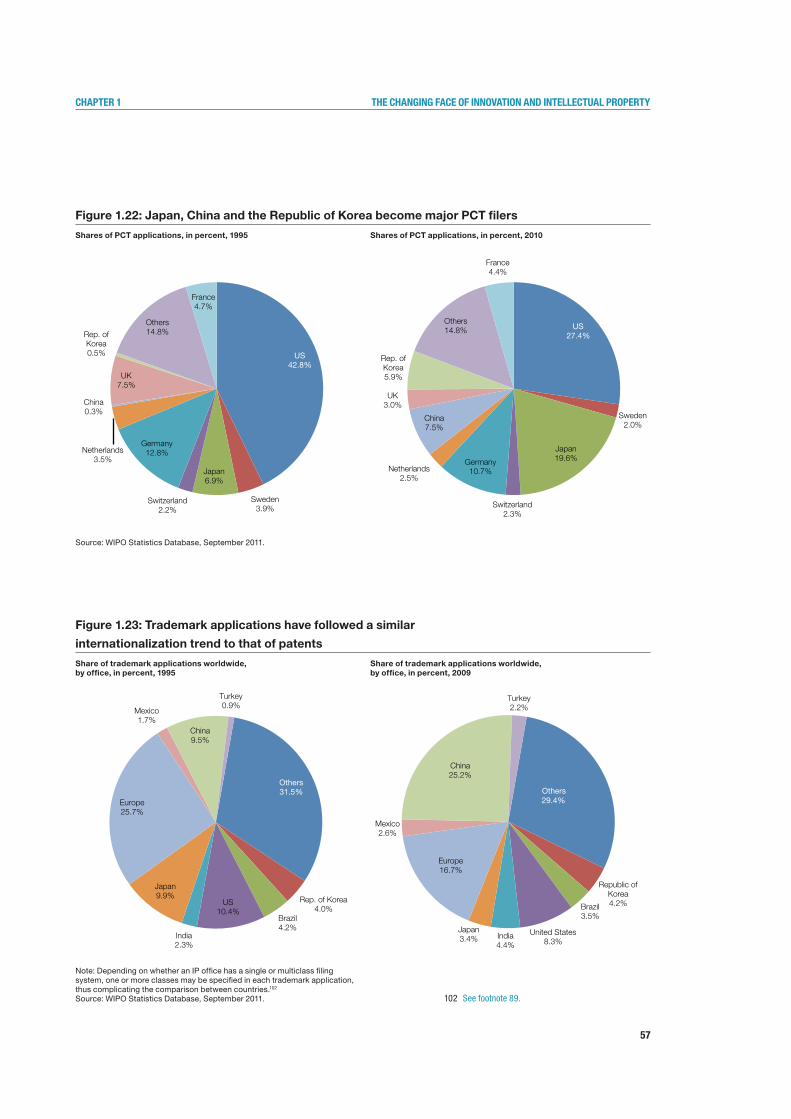
57
Chapter 1 the Changing faCe of innovation and intelleCtual property
US 42.8%
Sweden 3.9%
Japan 6.9%
Switzerland 2.2%
Germany 12.8% Netherlands
3.5%
China 0.3%
UK 7.5%
Rep. of Korea 0.5%
Others 14.8%
France 4.7%
US 27.4%
Sweden 2.0%
Japan 19.6%
Switzerland 2.3%
Germany 10.7% Netherlands
2.5%
China 7.5%
UK 3.0%
Rep. of Korea 5.9%
Others 14.8%
France 4.4%
Others 31.5%
Rep. of Korea 4.0%
Brazil 4.2%
US 10.4%
India 2.3%
Japan 9.9%
Europe 25.7%
Mexico 1.7%
China 9.5%
Turkey 0.9%
Figure 1.22: Japan, China and the Republic of Korea become major PCT filers
Shares of PCT applications, in percent, 1995
Source: WIPO Statistics Database, September 2011.
Shares of PCT applications, in percent, 2010
Figure 1.23: Trademark applications have followed a similar
internationalization trend to that of patents
Share of trademark applications worldwide, by office, in percent, 1995
Note: Depending on whether an IP office has a single or multiclass filing system, one or more classes may be specified in each trademark application, thus complicating the comparison between countries.102
Source: WIPO Statistics Database, September 2011.
Share of trademark applications worldwide, by office, in percent, 2009
102 See footnote 89.
Others 29.4%
Republic of Korea 4.2% Brazil
3.5%
United States 8.3%
India 4.4%
Japan 3.4%
Europe 16.7%
Mexico 2.6%
China 25.2%
Turkey 2.2%
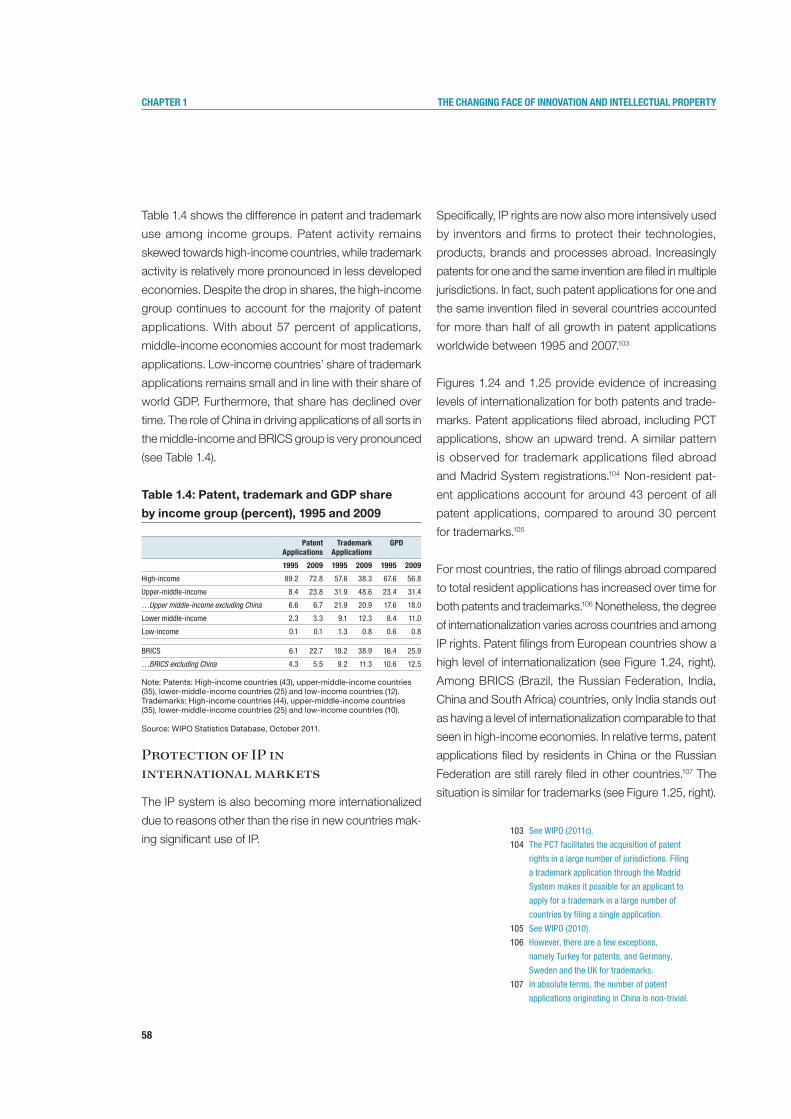
58
Chapter 1 the Changing faCe of innovation and intelleCtual property
Table 1.4 shows the difference in patent and trademark
use among income groups. Patent activity remains
skewed towards high-income countries, while trademark
activity is relatively more pronounced in less developed
economies. Despite the drop in shares, the high-income
group continues to account for the majority of patent
applications. With about 57 percent of applications,
middle-income economies account for most trademark
applications. Low-income countries’ share of trademark
applications remains small and in line with their share of
world GDP. Furthermore, that share has declined over
time. The role of China in driving applications of all sorts in
the middle-income and BRICS group is very pronounced
(see Table 1.4).
Table 1.4: Patent, trademark and GDP share
by income group (percent), 1995 and 2009
Note: Patents: High-income countries (43), upper-middle-income countries (35), lower-middle-income countries (25) and low-income countries (12). Trademarks: High-income countries (44), upper-middle-income countries (35), lower-middle-income countries (25) and low-income countries (10).
Source: WIPO Statistics Database, October 2011.
Protection of IP in international markets
The IP system is also becoming more internationalized
due to reasons other than the rise in new countries mak-
ing significant use of IP.
Specifically, IP rights are now also more intensively used
by inventors and firms to protect their technologies,
products, brands and processes abroad. Increasingly
patents for one and the same invention are filed in multiple
jurisdictions. In fact, such patent applications for one and
the same invention filed in several countries accounted
for more than half of all growth in patent applications
worldwide between 1995 and 2007.103
Figures 1.24 and 1.25 provide evidence of increasing
levels of internationalization for both patents and trade-
marks. Patent applications filed abroad, including PCT
applications, show an upward trend. A similar pattern
is observed for trademark applications filed abroad
and Madrid System registrations.104 Non-resident pat-
ent applications account for around 43 percent of all
patent applications, compared to around 30 percent
for trademarks.105
For most countries, the ratio of filings abroad compared
to total resident applications has increased over time for
both patents and trademarks.106 Nonetheless, the degree
of internationalization varies across countries and among
IP rights. Patent filings from European countries show a
high level of internationalization (see Figure 1.24, right).
Among BRICS (Brazil, the Russian Federation, India,
China and South Africa) countries, only India stands out
as having a level of internationalization comparable to that
seen in high-income economies. In relative terms, patent
applications filed by residents in China or the Russian
Federation are still rarely filed in other countries.107 The
situation is similar for trademarks (see Figure 1.25, right).
Patent Applications
Trademark Applications
GPd
1995 2009 1995 2009 1995 2009
High-income 89.2 72.8 57.6 38.3 67.6 56.8
Upper-middle-income 8.4 23.8 31.9 48.6 23.4 31.4
…Upper middle-income excluding China 6.6 6.7 21.9 20.9 17.6 18.0
Lower middle-income 2.3 3.3 9.1 12.3 8.4 11.0
Low-income 0.1 0.1 1.3 0.8 0.6 0.8
BRICS 6.1 22.7 19.2 38.9 16.4 25.9
…BRICS excluding China 4.3 5.5 9.2 11.3 10.6 12.5
103 See WIPO (2011c).
104 The PCT facilitates the acquisition of patent
rights in a large number of jurisdictions. Filing
a trademark application through the Madrid
System makes it possible for an applicant to
apply for a trademark in a large number of
countries by filing a single application.
105 See WIPO (2010).
106 However, there are a few exceptions,
namely Turkey for patents, and Germany,
Sweden and the UK for trademarks.
107 In absolute terms, the number of patent
applications originating in China is non-trivial.
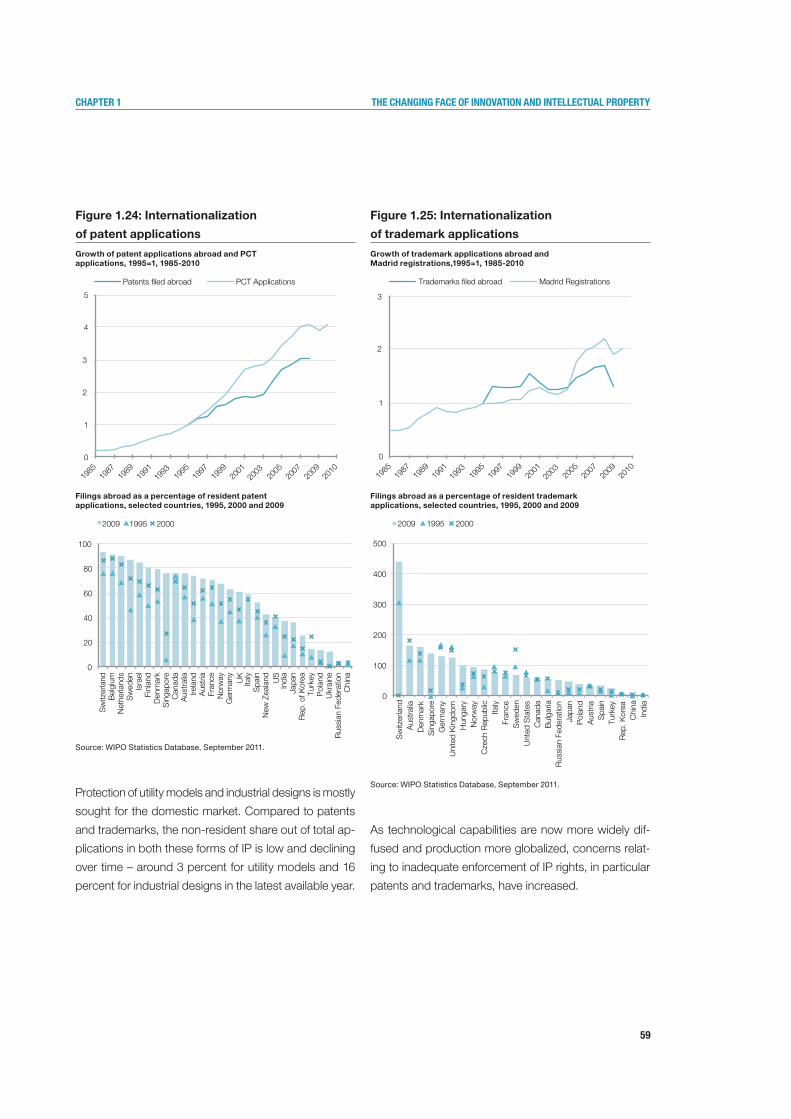
59
Chapter 1 the Changing faCe of innovation and intelleCtual property
Figure 1.24: Internationalization
of patent applications
Growth of patent applications abroad and PCT applications, 1995=1, 1985-2010
Filings abroad as a percentage of resident patent applications, selected countries, 1995, 2000 and 2009
Source: WIPO Statistics Database, September 2011.
Protection of utility models and industrial designs is mostly
sought for the domestic market. Compared to patents
and trademarks, the non-resident share out of total ap-
plications in both these forms of IP is low and declining
over time – around 3 percent for utility models and 16
percent for industrial designs in the latest available year.
Figure 1.25: Internationalization
of trademark applications
Growth of trademark applications abroad and Madrid registrations,1995=1, 1985-2010
Filings abroad as a percentage of resident trademark applications, selected countries, 1995, 2000 and 2009
Source: WIPO Statistics Database, September 2011.
As technological capabilities are now more widely dif-
fused and production more globalized, concerns relat-
ing to inadequate enforcement of IP rights, in particular
patents and trademarks, have increased.
0
1
2
3
4
5
1985
1987
1989
1991
1993
19
95
1997
1999
2001
2003
20
05
2007
2009
2010
Patents led abroad PCT Applications
0
1
2
3
1985
1987
1989
1991
1993
19
95
1997
1999
2001
2003
20
05
2007
2009
2010
Trademarks led abroad Madrid Registrations
0
20
40
60
80
100
Sw
itzer
land
B
elgi
um
Net
herla
nds
Sw
eden
Is
rael
Fi
nlan
d D
enm
ark
Sin
gapo
re
Can
ada
Aus
tral
ia
Irela
nd
Aus
tria
Fr
ance
N
orw
ay
Ger
man
y U
K
Italy
S
pain
N
ew Z
eala
nd
US
In
dia
Japa
n R
ep. o
f Kor
ea
Turk
ey
Pol
and
Ukr
aine
Chi
na
2009 1995 2000
Rus
sian
Fed
erat
ion
0
100
200
300
400
500
Sw
itzer
land
A
ustr
alia
D
enm
ark
Sin
gapo
re
Ger
man
y U
nite
d K
ingd
om
Hun
gary
N
orw
ay
Cze
ch R
epub
lic
Italy
Fr
ance
S
wed
en
Unt
ed S
tate
s C
anad
a B
ulga
ria
Rus
sian
Fed
erat
ion
Japa
n P
olan
d A
ustr
ia
Spa
in
Turk
ey
Rep
. Kor
ea
Chi
na
Indi
a
2009 1995 2000
60
Chapter 1 the Changing faCe of innovation and intelleCtual property
1.3.2Increased tradability of IP
The last decades have seen an increase in licensing
and other IP-based collaborative mechanisms such as
patent pools. New intermediaries and IP marketplaces
have also emerged.108
Following Arora et al. (2001), the literature increasingly
refers to the rise in “technology markets”, “knowledge
markets” or “secondary markets for IP” to describe
this trend. These IP-based markets are said to allow
for trade in ideas and to facilitate vertical disintegration
of knowledge-based industries (see Subsection 1.2.1).
Firms are putting better systems in place to capture and
analyze ideas both from within and without. This also en-
ables them to capture value from IP not utilized internally.
Moreover, a new type of firm has emerged which thrives
solely on the creation and management of IP assets.
Increasedinternationaltradeinknowledge
Existing data suggest that high-income countries make
up for a large share of the international trade in knowl-
edge and ideas, but that middle-income economies are
catching up.
The most widely reported form of disembodied technol-
ogy trade occurs through international receipts and pay-
ments for the use of intangible assets as measured by the
payment of royalties and license fees (RLF).109 The use of
RLF data as an approximate measure of the international
trade in knowledge is not without its problems. One key
issue is how to isolate disembodied technology trade
from transfer pricing issues (see Box 1.7). Nonetheless,
RLF data are the most pertinent proxy for assessing the
international trade in disembodied knowledge.
box 1.7: The limitations of royalty and license fee data
Madeuf (1984) presents the limitations of using RLF data to infer the occurrence of technology transfer. One key problem is how to isolate technology revenue from transfer pricing. For some countries where detailed data are available, payments mostly consist of intra-firm payments, i.e., payments between subsidiaries and company headquarters – for example, 66 percent of all US receipts in 2009 and 73 percent of all US payments in 2009.110 Given the intangible and fungible nature of IP assets between a company’s headquarters and various subsidiaries, these data are subject to transfer pricing problems and related tax considerations that might be unrelated to international technology transfer between countries. Data on affiliate trade for Germany and several other European countries suggest, however, that intra-firm RLF payments made up for a lesser share, namely about 45 percent of all technology services trade from 2006-2008. Hence, for other countries this measurement problem might be a lesser one.
108 See Guellec et al. (2010); Howells et al. (2004); and Jarosz et al. (2010).
109 The International Monetary Fund (IMF) defines RLF
as including “international payments and receipts
for the authorized use of intangible, non-produced,
non-financial assets and proprietary rights…
and with the use, through licensing agreements,
of produced originals or prototypes…”.
110 See Koncz-Bruner and Flatness
(2010); and Robbins (2009).
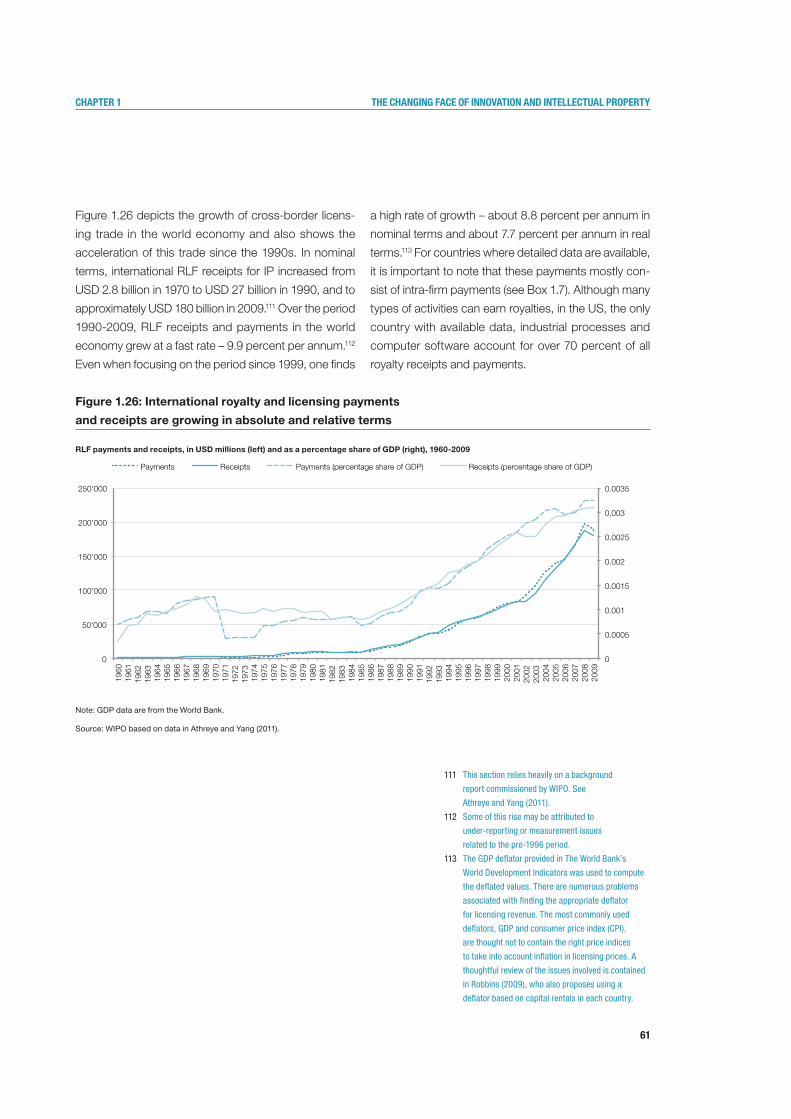
61
Chapter 1 the Changing faCe of innovation and intelleCtual property
Figure 1.26 depicts the growth of cross-border licens-
ing trade in the world economy and also shows the
acceleration of this trade since the 1990s. In nominal
terms, international RLF receipts for IP increased from
USD 2.8 billion in 1970 to USD 27 billion in 1990, and to
approximately USD 180 billion in 2009.111 Over the period
1990-2009, RLF receipts and payments in the world
economy grew at a fast rate – 9.9 percent per annum.112
Even when focusing on the period since 1999, one finds
a high rate of growth – about 8.8 percent per annum in
nominal terms and about 7.7 percent per annum in real
terms.113 For countries where detailed data are available,
it is important to note that these payments mostly con-
sist of intra-firm payments (see Box 1.7). Although many
types of activities can earn royalties, in the US, the only
country with available data, industrial processes and
computer software account for over 70 percent of all
royalty receipts and payments.
Figure 1.26: International royalty and licensing payments
and receipts are growing in absolute and relative terms
RLF payments and receipts, in USD millions (left) and as a percentage share of GDP (right), 1960-2009
Note: GDP data are from the World Bank.
Source:WIPObasedondatainAthreyeandYang(2011).
111 This section relies heavily on a background
report commissioned by WIPO. See
Athreye and Yang (2011).
112 Some of this rise may be attributed to
under-reporting or measurement issues
related to the pre-1996 period.
113 The GDP deflator provided in The World Bank’s
World Development Indicators was used to compute
the deflated values. There are numerous problems
associated with finding the appropriate deflator
for licensing revenue. The most commonly used
deflators, GDP and consumer price index (CPI),
are thought not to contain the right price indices
to take into account inflation in licensing prices. A
thoughtful review of the issues involved is contained
in Robbins (2009), who also proposes using a
deflator based on capital rentals in each country.
0
0.0005
0.001
0.0015
0.002
0.0025
0.003
0.0035
0
50'000
100'000
150'000
200'000
250'000
1960
19
61
1962
19
63
1964
19
65
1966
19
67
1968
19
69
1970
19
71
1972
19
73
1974
19
75
1976
19
77
1978
19
79
1980
19
81
1982
19
83
1984
19
85
1986
19
87
1988
19
89
1990
19
91
1992
19
93
1994
19
95
1996
19
97
1998
19
99
2000
20
01
2002
20
03
2004
20
05
2006
20
07
2008
20
09
Payments Receipts Payments (percentage share of GDP) Receipts (percentage share of GDP)
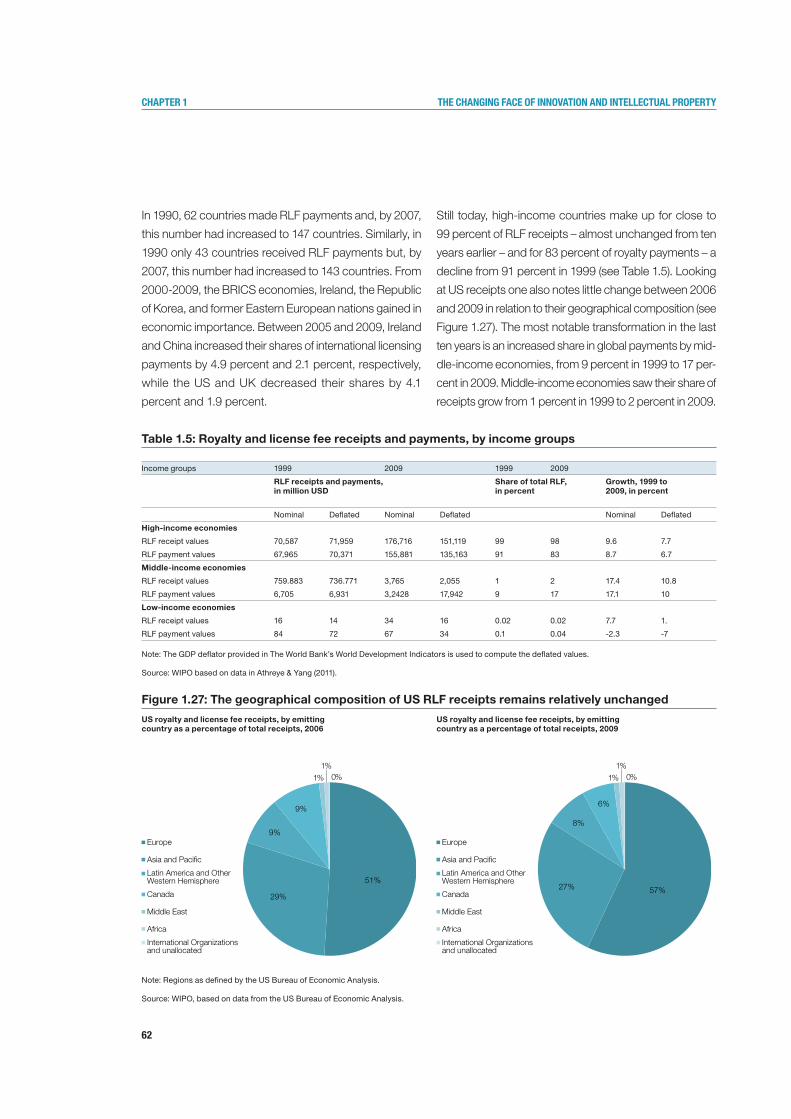
62
Chapter 1 the Changing faCe of innovation and intelleCtual property
Figure 1.27: The geographical composition of US RLF receipts remains relatively unchanged
US royalty and license fee receipts, by emitting country as a percentage of total receipts, 2006
Note: Regions as defined by the US Bureau of Economic Analysis.
Source: WIPO, based on data from the US Bureau of Economic Analysis.
US royalty and license fee receipts, by emitting country as a percentage of total receipts, 2009
In 1990, 62 countries made RLF payments and, by 2007,
this number had increased to 147 countries. Similarly, in
1990 only 43 countries received RLF payments but, by
2007, this number had increased to 143 countries. From
2000-2009, the BRICS economies, Ireland, the Republic
of Korea, and former Eastern European nations gained in
economic importance. Between 2005 and 2009, Ireland
and China increased their shares of international licensing
payments by 4.9 percent and 2.1 percent, respectively,
while the US and UK decreased their shares by 4.1
percent and 1.9 percent.
Still today, high-income countries make up for close to
99 percent of RLF receipts – almost unchanged from ten
years earlier – and for 83 percent of royalty payments – a
decline from 91 percent in 1999 (see Table 1.5). Looking
at US receipts one also notes little change between 2006
and 2009 in relation to their geographical composition (see
Figure 1.27). The most notable transformation in the last
ten years is an increased share in global payments by mid-
dle-income economies, from 9 percent in 1999 to 17 per-
cent in 2009. Middle-income economies saw their share of
receipts grow from 1 percent in 1999 to 2 percent in 2009.
Income groups 1999 2009 1999 2009
RLF receipts and payments, in million USD
Share of total RLF, in percent
Growth, 1999 to 2009, in percent
Nominal Deflated Nominal Deflated Nominal Deflated
High-income economies
RLF receipt values 70,587 71,959 176,716 151,119 99 98 9.6 7.7
RLF payment values 67,965 70,371 155,881 135,163 91 83 8.7 6.7
Middle-income economies
RLF receipt values 759.883 736.771 3,765 2,055 1 2 17.4 10.8
RLF payment values 6,705 6,931 3,2428 17,942 9 17 17.1 10
Low-income economies
RLF receipt values 16 14 34 16 0.02 0.02 7.7 1.
RLF payment values 84 72 67 34 0.1 0.04 -2.3 -7
Table 1.5: Royalty and license fee receipts and payments, by income groups
Note: The GDP deflator provided in The World Bank’s World Development Indicators is used to compute the deflated values.
Source:WIPObasedondatainAthreye&Yang(2011).
51%
29%
9%
9%
1%
1% 0%
Europe
Asia and Paci�c
Latin America and OtherWestern Hemisphere
Canada
Middle East
Africa
International Organizations and unallocated
57% 27%
8%
6%
Europe
Asia and Paci�c
Latin America and OtherWestern Hemisphere
Canada
Middle East
Africa
International Organizations and unallocated
1%
1% 0%
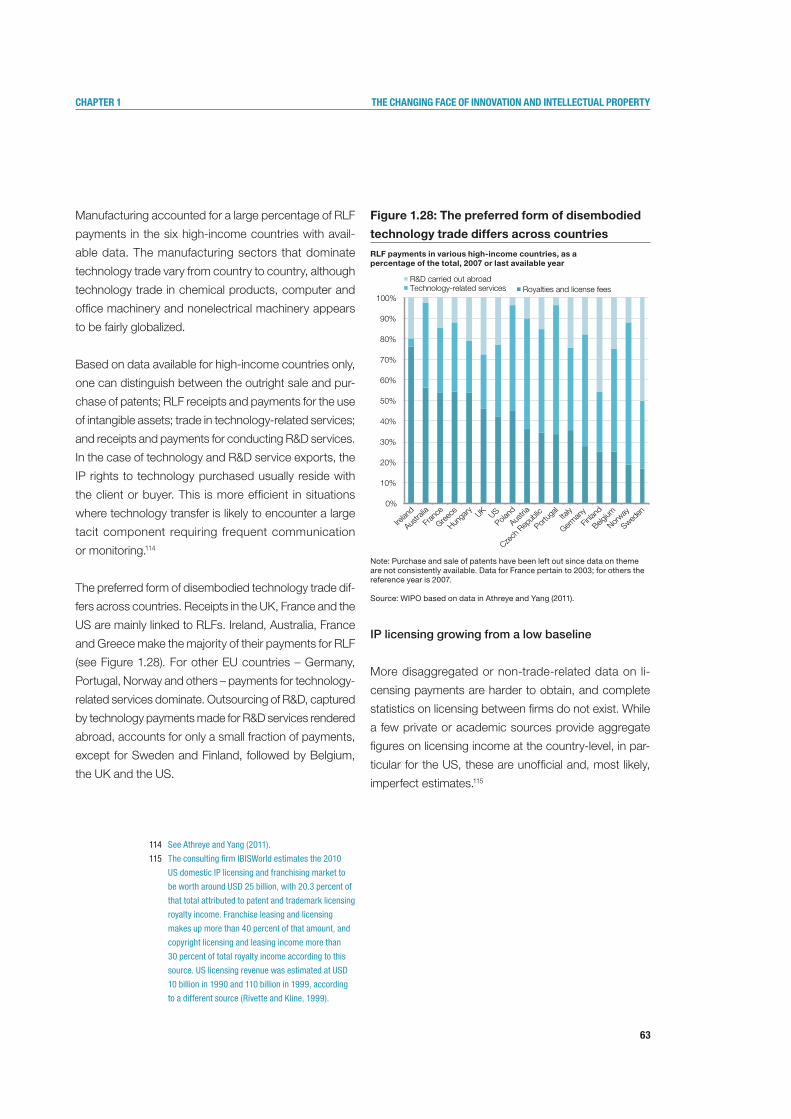
63
Chapter 1 the Changing faCe of innovation and intelleCtual property
Manufacturing accounted for a large percentage of RLF
payments in the six high-income countries with avail-
able data. The manufacturing sectors that dominate
technology trade vary from country to country, although
technology trade in chemical products, computer and
office machinery and nonelectrical machinery appears
to be fairly globalized.
Based on data available for high-income countries only,
one can distinguish between the outright sale and pur-
chase of patents; RLF receipts and payments for the use
of intangible assets; trade in technology-related services;
and receipts and payments for conducting R&D services.
In the case of technology and R&D service exports, the
IP rights to technology purchased usually reside with
the client or buyer. This is more efficient in situations
where technology transfer is likely to encounter a large
tacit component requiring frequent communication
or monitoring.114
The preferred form of disembodied technology trade dif-
fers across countries. Receipts in the UK, France and the
US are mainly linked to RLFs. Ireland, Australia, France
and Greece make the majority of their payments for RLF
(see Figure 1.28). For other EU countries – Germany,
Portugal, Norway and others – payments for technology-
related services dominate. Outsourcing of R&D, captured
by technology payments made for R&D services rendered
abroad, accounts for only a small fraction of payments,
except for Sweden and Finland, followed by Belgium,
the UK and the US.
Figure 1.28: The preferred form of disembodied
technology trade differs across countries
RLF payments in various high-income countries, as a percentage of the total, 2007 or last available year
Note: Purchase and sale of patents have been left out since data on theme are not consistently available. Data for France pertain to 2003; for others the reference year is 2007.
Source:WIPObasedondatainAthreyeandYang(2011).
IP licensing growing from a low baseline
More disaggregated or non-trade-related data on li-
censing payments are harder to obtain, and complete
statistics on licensing between firms do not exist. While
a few private or academic sources provide aggregate
figures on licensing income at the country-level, in par-
ticular for the US, these are unofficial and, most likely,
imperfect estimates.115
0%
10%
20%
30%
40%
50%
60%
70%
80%
90%
100%
Irelan
d
Austra
lia
Franc
e
Greece
Hunga
ry UK US
Poland
Austria
Czech
Rep
ublic
Portug
al Ita
ly
German
y
Finlan
d
Belgium
Norway
Sweden
R&D carried out abroad Technology-related services Royalties and license fees
114 See Athreye and Yang (2011).
115 The consulting firm IBISWorld estimates the 2010
US domestic IP licensing and franchising market to
be worth around USD 25 billion, with 20.3 percent of
that total attributed to patent and trademark licensing
royalty income. Franchise leasing and licensing
makes up more than 40 percent of that amount, and
copyright licensing and leasing income more than
30 percent of total royalty income according to this
source. US licensing revenue was estimated at USD
10 billion in 1990 and 110 billion in 1999, according
to a different source (Rivette and Kline, 1999).
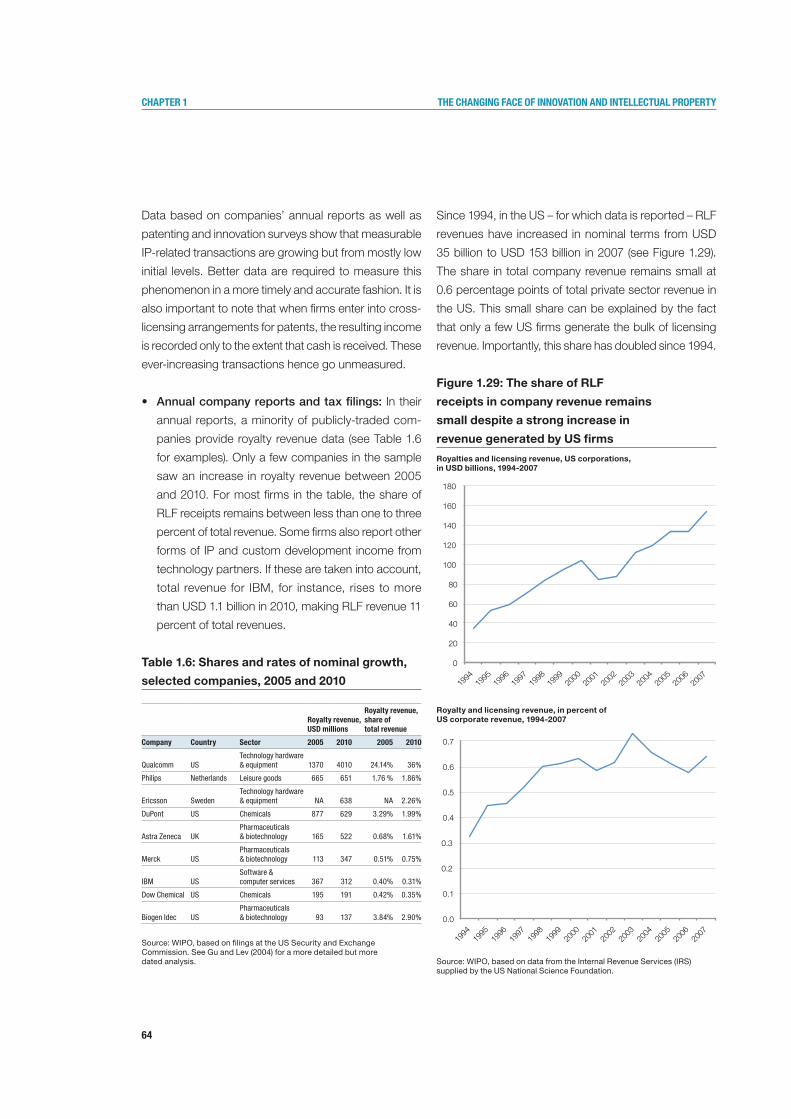
64
Chapter 1 the Changing faCe of innovation and intelleCtual property
Data based on companies’ annual reports as well as
patenting and innovation surveys show that measurable
IP-related transactions are growing but from mostly low
initial levels. Better data are required to measure this
phenomenon in a more timely and accurate fashion. It is
also important to note that when firms enter into cross-
licensing arrangements for patents, the resulting income
is recorded only to the extent that cash is received. These
ever-increasing transactions hence go unmeasured.
• Annual company reports and tax filings: In their
annual reports, a minority of publicly-traded com-
panies provide royalty revenue data (see Table 1.6
for examples). Only a few companies in the sample
saw an increase in royalty revenue between 2005
and 2010. For most firms in the table, the share of
RLF receipts remains between less than one to three
percent of total revenue. Some firms also report other
forms of IP and custom development income from
technology partners. If these are taken into account,
total revenue for IBM, for instance, rises to more
than USD 1.1 billion in 2010, making RLF revenue 11
percent of total revenues.
Table 1.6: Shares and rates of nominal growth,
selected companies, 2005 and 2010
Source: WIPO, based on filings at the US Security and Exchange Commission. See Gu and Lev (2004) for a more detailed but more dated analysis.
Since 1994, in the US – for which data is reported – RLF
revenues have increased in nominal terms from USD
35 billion to USD 153 billion in 2007 (see Figure 1.29).
The share in total company revenue remains small at
0.6 percentage points of total private sector revenue in
the US. This small share can be explained by the fact
that only a few US firms generate the bulk of licensing
revenue. Importantly, this share has doubled since 1994.
Figure 1.29: The share of RLF
receipts in company revenue remains
small despite a strong increase in
revenue generated by US firms
Royalties and licensing revenue, US corporations, in USD billions, 1994-2007
Royalty and licensing revenue, in percent of US corporate revenue, 1994-2007
Source: WIPO, based on data from the Internal Revenue Services (IRS) supplied by the US National Science Foundation.
royalty revenue, USd millions
royalty revenue, share of total revenue
Company Country Sector 2005 2010 2005 2010
Qualcomm USTechnology hardware & equipment 1370 4010 24.14% 36%
Philips Netherlands Leisure goods 665 651 1.76 % 1.86%
Ericsson SwedenTechnology hardware & equipment NA 638 NA 2.26%
DuPont US Chemicals 877 629 3.29% 1.99%
Astra Zeneca UKPharmaceuticals & biotechnology 165 522 0.68% 1.61%
Merck USPharmaceuticals & biotechnology 113 347 0.51% 0.75%
IBM USSoftware & computer services 367 312 0.40% 0.31%
Dow Chemical US Chemicals 195 191 0.42% 0.35%
Biogen Idec USPharmaceuticals & biotechnology 93 137 3.84% 2.90%
0
20
40
60
80
100
120
140
160
180
1994
1995
1996
1997
1998
1999
2000
2001
2002
2003
2004
2005
2006
2007
0.0
0.1
0.2
0.3
0.4
0.5
0.6
0.7
1994
1995
1996
1997
1998
1999
2000
2001
2002
2003
2004
2005
2006
2007
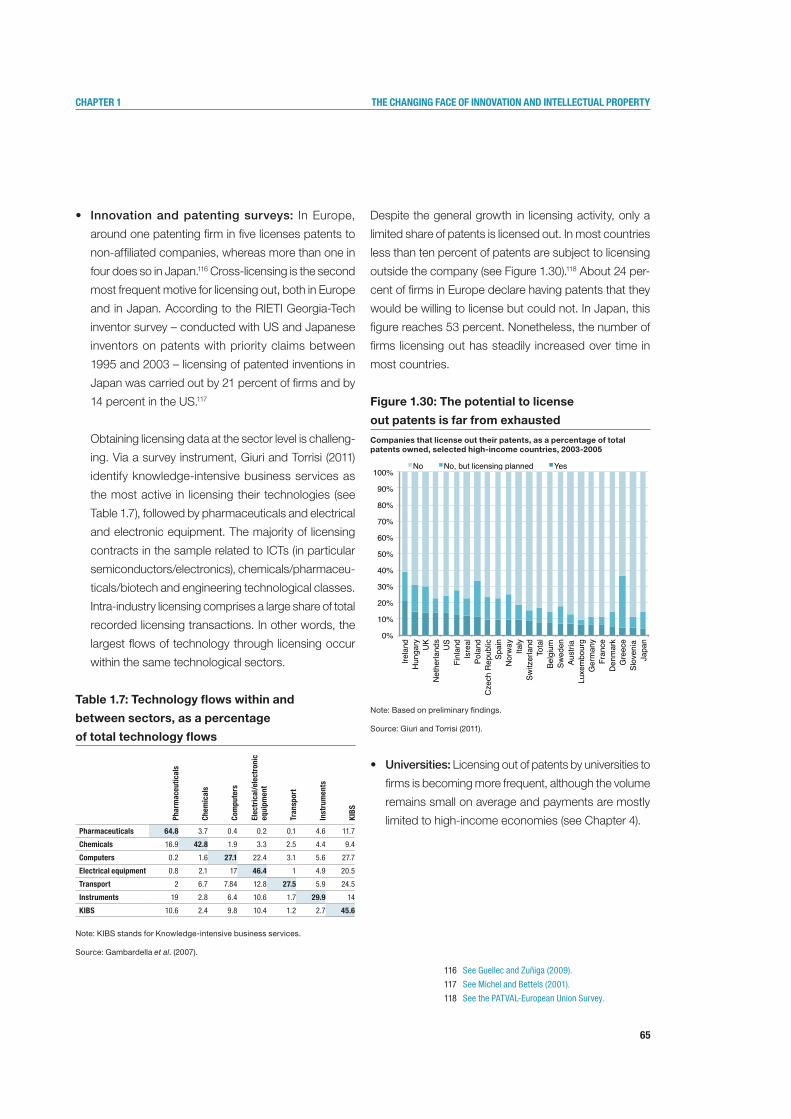
65
Chapter 1 the Changing faCe of innovation and intelleCtual property
• Innovation and patenting surveys: In Europe,
around one patenting firm in five licenses patents to
non-affiliated companies, whereas more than one in
four does so in Japan.116 Cross-licensing is the second
most frequent motive for licensing out, both in Europe
and in Japan. According to the RIETI Georgia-Tech
inventor survey – conducted with US and Japanese
inventors on patents with priority claims between
1995 and 2003 – licensing of patented inventions in
Japan was carried out by 21 percent of firms and by
14 percent in the US.117
Obtaining licensing data at the sector level is challeng-
ing. Via a survey instrument, Giuri and Torrisi (2011)
identify knowledge-intensive business services as
the most active in licensing their technologies (see
Table 1.7), followed by pharmaceuticals and electrical
and electronic equipment. The majority of licensing
contracts in the sample related to ICTs (in particular
semiconductors/electronics), chemicals/pharmaceu-
ticals/biotech and engineering technological classes.
Intra-industry licensing comprises a large share of total
recorded licensing transactions. In other words, the
largest flows of technology through licensing occur
within the same technological sectors.
Table 1.7: Technology flows within and
between sectors, as a percentage
of total technology flows
Note: KIBS stands for Knowledge-intensive business services.
Source: Gambardella et al. (2007).
Despite the general growth in licensing activity, only a
limited share of patents is licensed out. In most countries
less than ten percent of patents are subject to licensing
outside the company (see Figure 1.30).118 About 24 per-
cent of firms in Europe declare having patents that they
would be willing to license but could not. In Japan, this
figure reaches 53 percent. Nonetheless, the number of
firms licensing out has steadily increased over time in
most countries.
Figure 1.30: The potential to license
out patents is far from exhausted
Companies that license out their patents, as a percentage of total patents owned, selected high-income countries, 2003-2005
Note: Based on preliminary findings.
Source: Giuri and Torrisi (2011).
• Universities: Licensing out of patents by universities to
firms is becoming more frequent, although the volume
remains small on average and payments are mostly
limited to high-income economies (see Chapter 4).
116 See Guellec and Zuñiga (2009).
117 See Michel and Bettels (2001).
118 See the PATVAL-European Union Survey.
0%
10%
20%
30%
40%
50%
60%
70%
80%
90%
100%
Irela
ndH
unga
ry UK
Net
herla
nds
US
Finl
and
Isre
alPo
land
Cze
ch R
epub
licSp
ain
Nor
way
Italy
Switz
erla
ndTo
tal
Belg
ium
Swed
enAu
stria
Luxe
mbo
urg
Ger
man
yFr
ance
Den
mar
kG
reec
eSl
oven
iaJa
pan
No No, but licensing planned Yes
Phar
mac
eutic
als
Chem
ical
s
Com
pute
rs
elec
tric
al/e
lect
roni
ceq
uipm
ent
Tran
spor
t
Inst
rum
ents
KIbS
Pharmaceuticals 64.8 3.7 0.4 0.2 0.1 4.6 11.7
Chemicals 16.9 42.8 1.9 3.3 2.5 4.4 9.4
Computers 0.2 1.6 27.1 22.4 3.1 5.6 27.7
electrical equipment 0.8 2.1 17 46.4 1 4.9 20.5
Transport 2 6.7 7.84 12.8 27.5 5.9 24.5
Instruments 19 2.8 6.4 10.6 1.7 29.9 14
KIbS 10.6 2.4 9.8 10.4 1.2 2.7 45.6
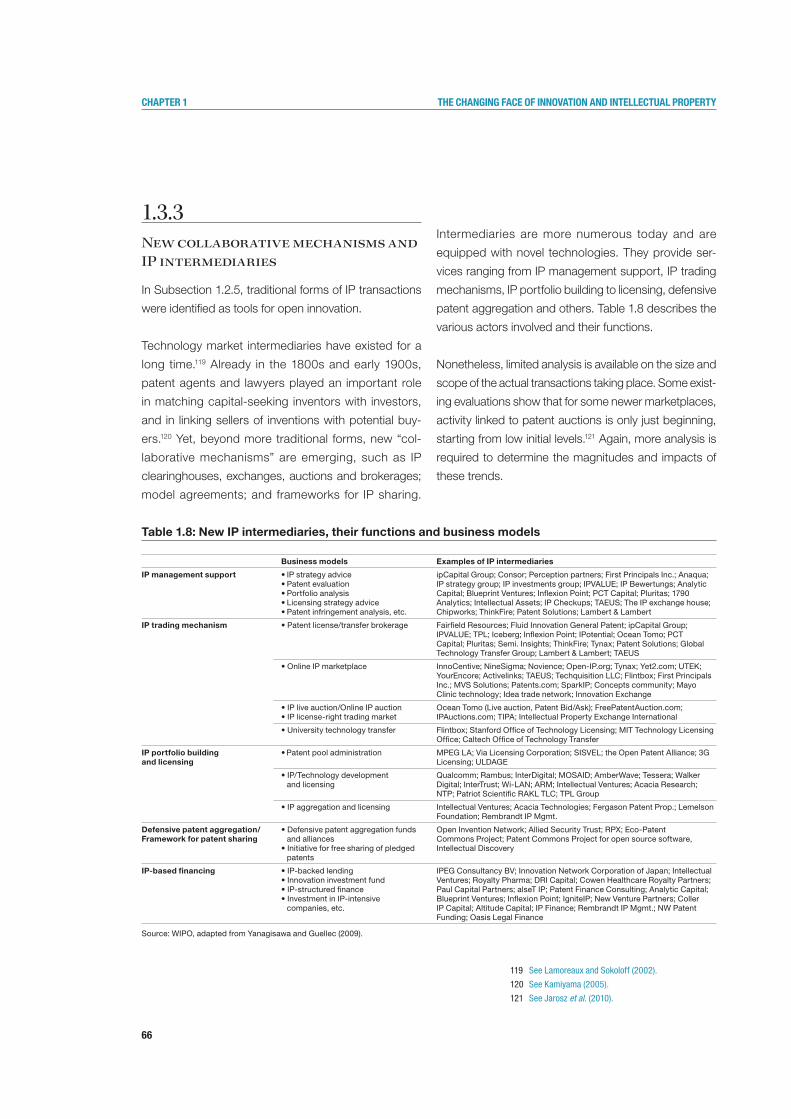
66
Chapter 1 the Changing faCe of innovation and intelleCtual property
1.3.3New collaborative mechanisms and IP intermediaries
In Subsection 1.2.5, traditional forms of IP transactions
were identified as tools for open innovation.
Technology market intermediaries have existed for a
long time.119 Already in the 1800s and early 1900s,
patent agents and lawyers played an important role
in matching capital-seeking inventors with investors,
and in linking sellers of inventions with potential buy-
ers.120 Yet, beyond more traditional forms, new “col-
laborative mechanisms” are emerging, such as IP
clearinghouses, exchanges, auctions and brokerages;
model agreements; and frameworks for IP sharing.
Intermediaries are more numerous today and are
equipped with novel technologies. They provide ser-
vices ranging from IP management support, IP trading
mechanisms, IP portfolio building to licensing, defensive
patent aggregation and others. Table 1.8 describes the
various actors involved and their functions.
Nonetheless, limited analysis is available on the size and
scope of the actual transactions taking place. Some exist-
ing evaluations show that for some newer marketplaces,
activity linked to patent auctions is only just beginning,
starting from low initial levels.121 Again, more analysis is
required to determine the magnitudes and impacts of
these trends.
119 See Lamoreaux and Sokoloff (2002).
120 See Kamiyama (2005).
121 See Jarosz et al. (2010).
Table 1.8: New IP intermediaries, their functions and business models
Source:WIPO,adaptedfromYanagisawaandGuellec(2009).
Business models Examples of IP intermediaries
IP management support •IPstrategyadvice •Patentevaluation •Portfolioanalysis •Licensingstrategyadvice •Patentinfringementanalysis,etc.
ipCapital Group; Consor; Perception partners; First Principals Inc.; Anaqua; IPstrategygroup;IPinvestmentsgroup;IPVALUE;IPBewertungs;AnalyticCapital;BlueprintVentures;InflexionPoint;PCTCapital;Pluritas;1790Analytics; Intellectual Assets; IP Checkups; TAEUS; The IP exchange house; Chipworks; ThinkFire; Patent Solutions; Lambert & Lambert
IP trading mechanism •Patentlicense/transferbrokerage Fairfield Resources; Fluid Innovation General Patent; ipCapital Group; IPVALUE;TPL;Iceberg;InflexionPoint;IPotential;OceanTomo;PCTCapital; Pluritas; Semi. Insights; ThinkFire; Tynax; Patent Solutions; Global Technology Transfer Group; Lambert & Lambert; TAEUS
•OnlineIPmarketplace InnoCentive;NineSigma;Novience;Open‐IP.org;Tynax;Yet2.com;UTEK;YourEncore;Activelinks;TAEUS;TechquisitionLLC;Flintbox;FirstPrincipalsInc.;MVSSolutions;Patents.com;SparkIP;Conceptscommunity;MayoClinic technology; Idea trade network; Innovation Exchange
•IPliveauction/OnlineIPauction •IPlicense-righttradingmarket
Ocean Tomo (Live auction, Patent Bid/Ask); FreePatentAuction.com; IPAuctions.com; TIPA; Intellectual Property Exchange International
•Universitytechnologytransfer Flintbox; Stanford Office of Technology Licensing; MIT Technology Licensing Office; Caltech Office of Technology Transfer
IP portfolio buildingand licensing
•Patentpooladministration MPEGLA;ViaLicensingCorporation;SISVEL;theOpenPatentAlliance;3GLicensing; ULDAGE
•IP/Technologydevelopmentand licensing
Qualcomm; Rambus; InterDigital; MOSAID; AmberWave; Tessera; Walker Digital;InterTrust;Wi‐LAN;ARM;IntellectualVentures;AcaciaResearch;NTP; Patriot Scientific RAKL TLC; TPL Group
•IPaggregationandlicensing IntellectualVentures;AcaciaTechnologies;FergasonPatentProp.;LemelsonFoundation; Rembrandt IP Mgmt.
Defensive patent aggregation/ Framework for patent sharing
•Defensivepatentaggregationfundsand alliances
•Initiativeforfreesharingofpledgedpatents
Open Invention Network; Allied Security Trust; RPX; Eco-Patent Commons Project; Patent Commons Project for open source software, Intellectual Discovery
IP-based financing •IP-backedlending•Innovationinvestmentfund•IP-structuredfinance•InvestmentinIP-intensive
companies, etc.
IPEGConsultancyBV;InnovationNetworkCorporationofJapan;IntellectualVentures;RoyaltyPharma;DRICapital;CowenHealthcareRoyaltyPartners;Paul Capital Partners; alseT IP; Patent Finance Consulting; Analytic Capital; BlueprintVentures;InflexionPoint;IgniteIP;NewVenturePartners;CollerIP Capital; Altitude Capital; IP Finance; Rembrandt IP Mgmt.; NW Patent Funding; Oasis Legal Finance
67
Chapter 1 the Changing faCe of innovation and intelleCtual property
1.3.4Emergence of new IP policies and practices
To conclude, beyond the increased use of knowledge
markets and new IP intermediaries, firms and other orga-
nizations are also trialing new IP policies and practices.
For instance, firms increasingly say that they organize
licensing activity and strategic alliances around an IP
strategy that seeks to share technologies rather than to
use IP solely as a defense mechanism. For a number of
firms this represents a true change in business mentality
and implies that new IP strategies are at work – moving
away from the secrecy and inward-looking processes
considered to be essential steps prior to applying for IP.
Companies, universities and governments are also in-
novating in the area of IP policy. A few select categories
are listed here:
• Publicationwithoutpatenting: Some firms opt to
publish details on inventions that they do not plan to
patent, often also called technical disclosures (see for
example IBM’s Technical Disclosure Bulletin or the
IP.com Prior Art Database).122 On the one hand, this lifts
the veil of secrecy on potentially important technologies.
On the other hand, it also serves the strategic aim to
prevent other companies and individuals from seeking
patents on the ideas, so-called defensive publishing.
• DifferentformsofIPdonations: Companies can
decide to release parts of their IP to the public, to fellow
companies or innovators. Firms seem to have started
this practice during the mid-1990s. More recently, firms
have released business method patents to the public
or donated IP to smaller companies. Still other firms
provide royalty-free licenses for patents in the areas of
food or health products. Reasons for this can be that
the IP is not economically valuable to them, or that the
invention requires further development efforts that the
patenting firm is not willing to undertake. The extent to
which these practices might be designed to preserve
market share, establish or maintain standards or to
crowd out competitors deserves further study.
• Collaborationwithuniversities: When dealing with
universities, companies are also increasingly inventive
with regard to their IP policies, fostering cooperation on
the one hand while ensuring control on the other (see
Chapter 4). For instance, contracts often specify that
the firm retains the right to require a royalty-free license
on any university patent emerging from the research it
has funded. University researchers are granted access
to the company’s internal IP, for example antibody
libraries and research tools, and, in certain cases,
are allowed to publish in addition to obtaining external
funding (see Pfizer’s new model for drug development,
Philips’ university partnerships, etc.). Researchers
may receive extra payments if gains from develop-
ing the technology exceed original expectations.
122 www.redbooks.ibm.com
68
Chapter 1 the Changing faCe of innovation and intelleCtual property
• Contributionstopatentpools: In the last few years, a
number of patent pools have been created to address
health, environmental and other social challenges
(see Chapter 3). The Pool for Open Innovation against
Neglected Tropical Diseases, for instance, facilitates
access to IP and technologies for researchers in
this area.123 Willing pharmaceutical companies or
universities contribute relevant patents to the pool.
The Medicines Patent Pool for AIDS medications,
established with the support of UNITAID in 2010, was
created to share IP through a patent pool designed to
make treatments more widely affordable to the poor.124
The Eco-Patent Commons allows ICT-related firms to
make environmentally-related patents available to the
public (see Box 2.4).125 Participating firms must sign
a non-assertion pledge which allows third parties
royalty-free access to the protected technologies.
While these patent pools are all fairly recent, so called-
patent commons which support the development of
open source software developers have existed for
quite some time.126
These new IP practices can be read as a testament to
firms’ and other organizations’ increased experimentation
with new IP practices. Yet, often, firms may have recourse
to these IP releases for reasons related to tax relief (as
in the case of donations), overall company strategy and
public relations efforts.127 All in all, the mechanics and
impacts of these IP practices require further study.
1.4Conclusions and directions for future research
Innovation is a driver of economic growth and develop-
ment. Importantly, innovative capability is no longer seen
only in terms of the ability to develop new inventions.
Recombining existing inventions and non-technological
innovation also counts.
With increased internationalization, the way innovation
activity is organized has changed. Lower- and middle-
income economies contribute increasingly to technology
production and innovation. Another transformation is
the more collaborative nature of innovative processes.
Firms are trialing different forms of “open innovation”
models to leverage external sources of knowledge. That
said, Chapter 1 shows that drawing a clear distinction
between long-standing collaborative practices and new
models – and their respective impacts – remains difficult.
In this changing context, IP both drives the changing
nature of innovation and is – at the same time – impacted
by these changes. Increasingly IP is treated as a central
asset which is managed strategically and leveraged to
generate returns. In parallel, there has been a shift in the
IP landscape, with new countries emerging and greater
emphasis placed on the international protection of inven-
tions – all leading to a growing demand for the different IP
forms, although patent activity remains skewed towards
high-income countries, while trademark activity is rela-
tively more pronounced in less developed economies.
123 http://ntdpool.org/.124 www.medicinespatentpool.org/.125 www.wbcsd.org/web/projects/ecopatent/
Eco_patent_UpdatedJune2010.pdf.126 www.patentcommons.org.
127 See Layton and Bloch (2004);
and Hall and Helmers (2011).
69
Chapter 1 the Changing faCe of innovation and intelleCtual property
The last decades have also seen the emergence of IP-
based knowledge markets, which place greater emphasis
on licensing and other IP-based collaborative mecha-
nisms such as patent pools and new IP intermediaries.
High-income countries still make up for a large share of
the international trade in knowledge, but middle-income
economies are catching up. Measurable IP-related trans-
actions are growing, but from mostly low initial levels,
pointing to further growth potential. Beyond traditional
forms of IP licensing, new “collaborative mechanisms”
have emerged. Finally, firms and other organizations are
also trialing new IP policies and practices, often aimed
at sharing technologies but also sometimes with a view
to blocking competitors.
Areas for future research
In the light of this chapter, the following areas emerge as
promising fields of research:
• Research leadingtoabetterunderstandingofthe
role of intangible assets in firm performance and
economic growth is warranted. In this context, the
positive contribution of process and organizational
innovation to productivity requires further study as
currently the interactions between technological and
non-technological innovation are ill-understood.
• Thedataforassessingthefrequency,type,thequality
dimension and impacts of collaboration for innova-
tion remain too limited. In this context, assessing the
true importance of open innovation is hindered by
definitional and measurement issues. In particular,
the contribution of new innovation platforms and
monetary prizes – relative to other existing innova-
tion channels – requires further research. Also this
chapter points to new inbound innovation models,
new IP policies and practices – for example donations
to patent pools – and other public-private efforts for
not-for-profit objectives which require closer scrutiny
as to their scale and effectiveness.
• Toolittleisknownabouthowinnovationtakesplace
in low- and middle-income countries, how it diffuses
and what its impacts are. Concepts such as “frugal”
and “local” innovation and associated impacts deserve
further study.
• Whereasthedemandforpatentshasbecomein-
creasingly internationalized, only a few countries are
responsible for the great majority of patent filings.
Understanding the causes and impacts of this frag-
mented patenting activity deserves study. Similarly,
the different propensities and motivations of firms
to use different forms of IP remain ill-understood,
in particular with regard to specific country income
brackets. Aside from patents, other forms of IP and
their role within the innovation process deserve further
study. Finally, new metrics are needed for assessing
the depth and range of knowledge markets, of new IP
intermediaries but also to assess which barriers exist
to their further development.
70
Chapter 1 the Changing faCe of innovation and intelleCtual property
ReFeRencesAghion, P. & Howitt, P. (1992). A Model of Growth Through Creative Destruction. Econometrica, 60, 323-351.
Anton, J., Greene, H. & Yao, D. (2006). Policy Implications of Weak Patent Rights. In A. B. Jaffe, J. Lerner & S. Stern (Eds.), Innovation Policy and the Economy(Vol.6).NationalBureauofEconomicResearch,Inc.,1-26.
Arora, A., Fosfuri, A. & Gambardella, A. (2001). Markets for Technology: Economics of Innovation and Corporate Strategy. Cambridge, MA: MIT Press.
Athreye, S. & Kapur, S. (2009). Introduction: The Internationalization of Chinese and Indian Firms – Trends, Motivations and Strategy. Industrial and Corporate Change, 18(2), 209-221.
Athreye S., & Yang, Y. (2011). Disembodied knowledge flows in the world economy. WIPO Economics Research Working Papers, Geneva: World Intellectual Property Organization.
Benavente, J.M. & Lauterbach, R. (2008). Technological Innovation and Employment: Complements or Substitutes? European Journal of Development Research, 20(2), 318-329.
Bergek, A. & Bruzelius, M. (2010). Are Patents with Multiple Inventors from Different Countries a Good Indicator of International R&D Collaboration? The Case of ABB. Research Policy, 39(10), 1321-1334.
Bianchi, M., Cavaliere, A., Chiaroni, D., Frattini, F. & Chiesa, V. (2011). Organisational Modes for Open Innovation in the Bio-pharmaceutical Industry: An Exploratory Analysis. Technovation, 31(1), 22-33.
Bogliacino, F. & Perani, G. (2009). Innovation in Developing Countries. The Evidence from Innovation Surveys. Paper presented at the FIRB conference on Research and Entrepreneurship in the Knowledge-based Economy. Retrieved from http://portale.unibocconi.it/wps/allegatiCTP/Bogliacino_final.pdf
Bresnahan, T.F. & Trajtenberg, M. (1995). General Purpose Technologies "Engines of Growth?". National Bureau of Economic Research Working Paper Series, No. 4148.
Chesbrough, H. (2003). Open Innovation: The New Imperative for Creating and Profiting from Technology. Boston, MA: Harvard Business School Press.
Cohen, W.M. & Levinthal, D.A. (1990). Absorptive Capacity: A New Perspective on Learning and Innovation. Administrative Science Quarterly, 35(1), 128-152.
Corrado, C.A., Hulten, C.R. & Sichel, D.E. (2007). Intangible Capital and Economic Growth. Research Technology Management.
Crepon, B., Duguet, E. & Mairesse, J. (1998). Research, Innovation and Productivity: An Econometric Analysis at the Firm Level. Economics of Innovation and New Technoolgy, 7(2), 115-158.
Crespi, G. & Zuñiga, P. (2010). Innovation and Productivity: Evidence from Six Latin American Countries. IDB Working Paper Series, No. IDB-WP-218.
Criscuolo, C., Haskel, J.E. & Slaughter, M.J. (2010). Global Engagement and the Innovation Activities of Firms. International Journal of Industrial Organization, 28(2), 191-202.
Dahlander, L. & Gann, D.M. (2010). How Open is Innovation? Research Policy, 39(6), 699-709.
David, P. A., & Foray, D. (2002). Economic Fundamentals of the Knowledge Society. SIEPR discussion paper, 01-14.
Edler, J., Fier, H. & Grimpe, C. (2011). International Scientist Mobility and the Locus of Knowledge and Technology Transfer. Research Policy, 40(6), 791-805.
Edquist, C. (1997). Systems of Innovation: Technologies, Institutions and Organizations. London: Pinter.
European Commission. (2011). Business Sector Investment in R&D. Innovation Union Competitiveness Report 2011. Brussels: European Commission.
Evangelista, R. & Vezzani, A. (2010). The Economic Impact of Technological and Organizational Innovations. A Firm-level Analysis. Research Policy, 39(10), 1253-1263.
Fagerberg, J. (1994). Technology and International Differences in Growth Rates. Journal of Economic Literature, 32(3), 1147-1175.
Fagerberg, J., Mowery, D.C. & Nelson, R.R. (2006). The Oxford Handbook of Innovation. Oxford: Oxford University Press.
Fagerberg, J., Srholec, M. & Verspagen, B. (2009). Innovation and Economic Development. UNU Merit Working Paper Series, No. 2009-032.
Fagerberg, J., Scrholec, M., & Verspagen, B. (2010). Innovation and Economic Development. In B. H. Hall & N. Rosenberg (Eds.), Handbook of the Economics of Innovation (Vol. 2). Amsterdam: North Holland, 833-872.
Filatotchev, I., Liu, X., Lu, J. & Wright, M. (2011). Knowledge Spillovers Through Human Mobility Across National Borders: Evidence from Zhongguancun Science Park in China. Research Policy, 40(3), 453-462.
Freeman, C. (1987). Technology Policy and Economic Performance: Lessons from Japan. London: Pinter.
Freeman, C. (1994). Innovation and Growth. In M. Dodgson & R. Rothwell (Eds.), The Handbook of Industrial Innovation. Cheltenham, U.K.: Elgar, 78-93.
Gambardella, A., Giuri, P. & Luzzi, A. (2007). The Market for Patents in Europe. Research Policy, 36(8), 1163-1183.
Gil, V. & Haskell, J. (2008). Industry-Level Expenditure on Intangible Assets in the UK. London: Business, Enterprise and Regulatory Reform.
Giuri, P. & Torrisi, S. (2011). The Economic Uses of Patents. Paper presented attheFinalConferenceoftheInnoS&Tproject“InnovativeS&TIndicatorsforEmpirical Models and Policies: Combining Patent Data and Surveys".
Griffith, R., Huergo, E., Mairesse, J. & Peters, B. (2006). Innovation and Productivity Across Four European Countries. Oxford Review of Economic Policy, 22(4), 483-498.
Griliches, Z. (1998). R&D and Productivity: The Econometric Evidence. Chicago: University of Chicago Press.
Grossman, G.M. & Helpman, E. (1994). Endogenous Innovation in the Theory of Growth. The Journal of Economic Perspectives, 8(1), 23-44.
Gu, F. & Lev, B. (2004). The Information Content of Royalty Income. Accounting Horizons, 18(1), 1-12.
Guellec, D., Madies, T. & Prager, J.-C. (2010). Les marchés de brevets dans l'économie de la connaissance. Paris.
Guellec, D. & van Pottelsberghe de la Potterie, B. (2007). The Economics of the European Patent System: IP Policy for Innovation and Competition. Oxford: Oxford University Press.
Guellec, D. & Zuñiga, M.P. (2009). Who Licenses Out Patents and Why?: Lessons from a Business Survey. Paris: OECD.
Guinet, J., Hutschenreiter, G. & Keenan, M. (2009). Innovation Strategies forGrowth:InsightsfromOECDCountries.InC.A.P.Braga,V.Chandra,D.Erocal and P.C. Padoan (Eds.), Innovation and Growth: Chasing a Moving Frontier. Paris: Organisation for Economic Co-operation and Development.
Hall, B.H. (2009). Open Innovation and Intellectual Property Rights – The Two-edged Sword. Japan.
Hall, B. H. (2011). Innovation and Productivity. National Bureau of Economic Research Working Paper Series, w17178.
Hall, B.H. & Helmers, C. (2011). Innovation and Diffusion of Clean/Green Technology: Can Patent Commons Help? National Bureau of Economic Research Working Paper Series, w16920.
Hall, R.E. & Jones, C.I. (1999). Why Do Some Countries Produce So Much More Output Per Worker than Others? The Quarterly Journal of Economics, 114(1), 83-116.
HM Treasury (2005). The Cox Review of Creativity in Business. London: Design Council.
Howells, J., James, A.D. & Malik, K. (2004). Sourcing External Technological Knowledge. International Journal of Technology Management, 27(2/3).

71
Chapter 1 the Changing faCe of innovation and intelleCtual property
Hu, A.G. & Jefferson, G.H. (2009). A Great Wall of Patents: What is Behind China's Recent Patent Explosion? Journal of Development Economics, 90(1), 57-68.
Huizingh, E.K.R.E. (2011). Open Innovation: State of the Art and Future Perspectives. Technovation, 31(1), 2-9.
Hulten, C.R. & Isaksson, A. (2007). Why Development Levels Differ: The Sources of Differential Economic Growth in a Panel of High and Low Income Countries. National Bureau of Economic Research Working Paper Series, No. 13469.
Ivarsson, I. & Alvstam, C.G. (2010). Supplier Upgrading in the Home-furnishingValueChain:AnEmpiricalStudyofIKEA’sSourcinginChinaandSouth East Asia. World Development, 38(11), 1575-1587.
Jarosz, J., Heider, R., Bazelon, C., Bieri, C., & Hess, P. (March 2010). Patent Auctions: How Far Have We Come? les Nouvelles, 11-30.
Jones, C.I. & Romer, P.M. (2010). The New Kaldor Facts: Ideas, Institutions, Population, and Human Capital. American Economic Journal: Macroeconomics, 2(1), 224-245.
Kamiyama, S. (2005). Intellectual Property as an Economic Asset: Key Issues in Valuation and Exploitation. Paper presented at Intellectual Property as an EconomicAsset:KeyIssuesinValuationandExploitation,Berlin.
Khan, M. (2005). Estimating the Level of Investment in Knowledge Across the OECD countries. In A. Bounfour & L. Edvinsson (Eds.), Intellectual Captial for Communities: Nations, Regions, and Cities. London: Butterworth-Heinemann.
Khan, M., & Luintel, K. B. (2006). Sources of Knowledge and Productivity: How Robust is the Relationship? OECD STI Working Papers, 2006/06.
Klenow, P.J. & Rodríguez-Clare, A. (1997). Economic Growth: A Review Essay. Journal of Monetary Economics, 40(3), 597-617.
Koncz-Bruner, J. & Flatness, A. (2010). U.S. International Services Cross-Border Trade in 2009 and Services Supplied Through Affiliates in 2008. Washington, D.C.: US Bureau of Economic Analysis.
Kortum, S. & Lerner, J. (1999). What is Behind the Recent Surge in Patenting? Research Policy, 28(1), 1-22.
Lamoreaux, N.R. & Sokoloff, K.L. (2002). Intermediaries in the U.S. Market for Technology, 1870-1920. National Bureau of Economic Research Working Paper Series, No. 9017.
Layton, R. & Bloch, P. (2004). IP Donations: A Policy Review. Washington, D.C.: International Intellectual Property Institute.
Lee, N., Nystén-Haarala, S. & Huhtilainen, L. (2010). Interfacing Intellectual Property Rights and Open Innovation. Lappeenranta University of Technology, Department of Industrial Management.
Lichtenthaler, U. (2009). The Role of Corporate Technology Strategy and Patent Portfolios in Low-, Medium- and High-technology Firms. Research Policy, 38(3), 559-569.
Long, J.B.D. (1988). Productivity Growth, Convergence, and Welfare: Comment. The American Economic Review, 78(5), 1138-1154.
Lundvall, B.A. (1992). National Systems of Innovation: Towards a Theory of Innovation and Interactive Learning. London: Pinter.
Mairesse, J. & Mohnen, P. (2010). Innovation Surveys for Econometric Analysis. Handbook of the Economics of Innovation. Amsterdam: Elsevier.
Mairesse, J. & Mohnen, P. (2010). Using Innovation Surveys for Econometric Analysis. National Bureau of Economic Research Working Paper Series, 15857.
McKinsey & Company. (2009).“AndtheWinneris…”:Capturing the Promise of Philanthropic Prizes. McKinsey & Company.
Mendonça, S. (2009).BraveOldWorld:Accountingfor“High-tech”Knowledgein“Low-tech”Industries.Research Policy, 38(3), 470-482.
Michel, J. & Bettels, B. (2001). Patent Citation Analysis – A Closer Look at the Basic Input Data from Patent Search Reports. Scientometrics, 21(1), 185-201.
Narula, R. (2010). Much Ado about Nothing, or Sirens of a Brave New World? MNE Activity from Developing Countries and Its Significance for Development. Maastricht: United Nations University, Maastricht Economic and Social Research and Training Centre on Innovation and Technology.
National Science Board (2010). Science and Engineering Indicators 2010. Arlington,VA:NationalScienceFoundation.
Ocean Tomo (2010). Ocean Tomo's Intangible Asset Market Value Study. Chicago: Ocean Tomo.
OECD (2009). Open Innovation in Global Networks. Paris: Organisation for Economic Co-operation and Development.
OECD (2010a). Innovation in Firms. Paris: Organisation for Economic Co-operation and Development.
OECD (2010b). Measuring Innovation – A New Perspective. Paris: Organisation for Economic Co-operation and Development.
OECD (2010c). The OECD Innovation Strategy: Getting a Head Start on Tomorrow. Paris: Organisation for Economic Co-operation and Development.
OECD (2010d). OECD Science, Technology and Industry Outlook 2010. Paris: Organisation for Economic Co-operation and Development.
OECD (2010 e). Perspectives on Global Development 2010. Paris: Organisation for Economic Co-operation and Development.
OECD (2011). OECD Science, Technology and Industry Scoreboard 2011. Paris: Organisation for Economic Co-operation and Development.
OECD & Eurostat (2005). Oslo Manual: Guidelines for Using and Interpreting Innovation Data. Paris: Organisation for Economic Co-operation and Development.
Otsuyama, H. (2003).PatentValuationandIntellectualAssetsManagement.In M. Samejima (Ed.), Patent Strategy Handbook. Tokyo: Chuokeizai-sha.
Parisi, M.L., Schiantarelli, F. & Sembenelli, A. (2006). Productivity, Innovation and R&D: Micro Evidence for Italy. European Economic Review, 50(8), 2037-2061.
Pinkovskiy, M., & Sala-i-Martin, X. (2009). Parametric Estimations of the World Distribution of Income. National Bureau of Economic Research Working Paper Series, 15433.
Prahalad, C.K. & Lieberthal, K. (1998). The End of Corporate Imperialism. Harvard Business Review, 76(1), 69-79.
Rafiquzzaman, M., & Whewell, L. (1998). Recent Jumps in Patenting Activities: Comparative Innovative Performance of Major Industrial Countries, Patterns and Explanations. Industry Canada Research Working Paper, 27.
Ray, P.K. & Ray, S. (2010). Resource Constrained Innovation for Emerging Economies: The Case of the Indian Telecommunications Industry. IEEE Transactions on Engineering Management, 57(1), 144-156.
Rivette, K.G. & Kline, D. (1999). Rembrandts in the Attic: Unlocking the Hidden Value of Patents. Harvard Business Press.
Robbins, C.A. (2009). Measuring Payments for the Supply and Use of Intellectual Property. In M. Reinsdorf & M.J. Slaughter (Eds.), International Trade in Services and Intangibles in the Era of Globalization. Chicago: University of Chicago Press.
Romer, P. (1986). Increasing Returns and Long-Run Growth. Journal of Political Economy, 94(5), 1002-1037.
Romer, P. (2010). Which Parts of Globalization Matter for Catch-up Growth? National Bureau of Economic Research Working Paper Series, 15755.
Royal Society (March 2011). Knowledge, Networks and Nations: Global Scientific Collaboration in the 21st Century. London.
Schumpeter, J.A. (1943). Capitalism, Socialism, and Democracy: Harper Perennial.
Tether, B.S. (2002). Who Co-operates for Innovation, and Why: An Empirical Analysis. Research Policy, 31(6), 947-967.
Tether, B.S. & Tajar, A. (2008). The Organisational-Cooperation Mode of Innovation and Its Prominence Amongst European Service Firms. Research Policy, 37(4), 720-739.
72
Chapter 1 the Changing faCe of innovation and intelleCtual property
UK Intellectual Property Office (2011). The Role of IP Rights in the UK Market Sector. London: UK Intellectual Property Office.
UNCTAD (2011). World Investment Report 2011. Geneva: United Nations Conference on Trade and Development.
UNESCO (2010). UNESCO Science Report 2010. Paris: United Nations Educational, Scientific and Cultural Organization.
UNIDO (2009). Industrial Development Report – Breaking in and Moving Up: New Industrial Challenges for the Bottom Billion and the Middle-Income Countries.Vienna:UnitedNationsIndustrialDevelopmentOrganization.
van Ark, B. & Hulten, C.R. (2007). Innovation, Intangibles and Economic Growth: Towards A Comprehensive Accounting of the Knowledge Economy: The Conference Board.
WIPO (2010). World Intellectual Property Indicators. Geneva: World Intellectual Property Organization.
WIPO (2011a). Hague System for the International Registration of Industrial Designs – Report for 2010. Geneva: World Intellectual Property Organization.
WIPO (2011b). PCT – The International Patent System – Yearly Review – Developments and Performance in 2010. Geneva: World Intellectual Property Organization.
WIPO (2011c). The Surge in Worldwide Patent Applications, PCT/WG/4/4. Study prepared for the Patent Cooperation Treaty (PCT) Working Group. Geneva: World Intellectual Property Organization.
WIPO (2011d). Patenting and the Crisis, WIPO Survey on Patenting Strategies in 2009 and 2010. Geneva: World Intellectual Property Organization.
WIPO (2011 e, forthcoming). World Intellectual Property Indicators. Geneva: World Intellectual Property Organization.
World Bank (2008). Global Economic Prospects 2008. Washington, D.C.: World Bank.
Wunsch-Vincent, S. (2006). China, Information Technologies and the Internet. In OECD (Ed.), OECD Information Technology Outlook. Paris: Organisation for Economic Co-operation and Development, 139-182.
Yanagisawa, T. & Guellec, D. (2009). The Emerging Patent Marketplace. Directorate for Science, Technology and Industry Working Paper 2009/9. Paris: Organisation for Economic Co-operation and Development.
Young, A. (1993).LessonsfromtheEastAsianNICs:AContrarianView.National Bureau of Economic Research Working Paper Series, No. 4482.
Young, A. (1995). The Tyranny of Numbers: Confronting the Statistical Realities of the East Asian Growth Experience. The Quarterly Journal of Economics, 110(3), 641-680.
Zuñiga, P. (2011). The state of patenting at research institutions in developing countries: Policy approaches and practices. WIPO Economics Research Working Papers, Geneva: World Intellectual Property Organization.


75
Chapter 2 the eConomiCs of intelleCtual property – old insights and new evidenCe
1 See Smith (1776).
Innovation holds the potential to improve human well-
being and generate economic prosperity. Understanding
why individuals and organizations innovate and how gov-
ernment policies affect innovative behavior are therefore
important. Throughout history, economists have studied
these questions and devised different theories to explain
incentives for innovation.
This chapter focuses on the role of the intellectual prop-
erty (IP) system in the innovation process and has two
main objectives. It first seeks to convey, from the stand-
point of economists, the key ideas behind the IP system,
including the main rationales for protecting IP rights as
well as their pros and cons compared to other innovation
policy instruments (Section 2.1).
The second objective is to explore how economists’
understanding of the IP system has changed, by taking
a closer look at the patent system which has received, by
far, the most scrutiny by researchers (Section 2.2). While
many old insights still apply, economists have gained new
empirical perspectives which have led to a more refined
view of how patent protection affects innovation. These
new perspectives partly reflect real world developments
– as reviewed in Chapter 1 – and also better data, which
enable richer investigations.
One important theme that emerges from the recent
literature is the key role patent institutions play in determin-
ing innovation outcomes. Since this theme is of special
relevance for IP policymaking, the chapter elaborates on
some of the challenges facing these institutions (Section
2.3). The concluding remarks summarize some of the key
messages emanating from the economic literature and
point to areas where more research could usefully guide
policymakers (Section 2.4).
2.1Understanding IP rights and their role in the innovation process
The importance of innovation in economic thinking can
be traced as far back as 1776. In his famous treatise on
the Wealth of Nations, Adam Smith notes that “the inven-
tion of all those machines by which labour is so much
facilitated and abridged seems to have been originally
owing to the division of labour.” He further observes that
“[a] great part of the machines […] were originally the
inventions of common workmen, who, being each of
them employed in some very simple operation, naturally
turned their thoughts towards finding out easier and
readier methods of performing it.”1
cHAPteR 2tHe economIcs oF IntellectUAl PRoPeRtY – old InsIgHts And neW eVIdence
76
Chapter 2 the eConomiCs of intelleCtual property – old insights and new evidenCe
But it was not until the second half of the 20th century
that scholars started to scrutinize the circumstances of
inventive activity more closely, rather than simply view-
ing it as a “natural turn of thought”. In 1962, Nobel-prize
winning economist Kenneth J. Arrow helped galvanize
economic thinking in this area by arguing that the inventive
process – viewed as the production of problem-solving
information – faces two fundamental difficulties.2 First, it
is a risky process: when embarking on a problem-solving
exercise, it is uncertain whether a solution can really be
found. Second, information related to problem-solving
possesses characteristics of what economists call a
public good: many people can simultaneously use it, and
the problem solver often cannot prevent reproduction of
the information. The latter characteristic is also known as
the appropriability dilemma of inventive activity.
In view of these two fundamental difficulties, Arrow
concluded that, left alone, markets would underinvest
in inventive activity relative to what would be socially
desirable. To avoid wasting resources should a problem-
solving effort fail, firms operating in competitive markets
may forgo inventive opportunities; and, if competitors
can immediately free ride on a successful solution, the
inventing firm may reap little financial reward.
In view of the innovative behavior observed in markets,
these conclusions may seem overly pessimistic. Much
invention occurs due to innate curiosity. Some inven-
tors thrive on inventive challenges that carry a high risk
of failure. Recognition from peers or society at large for
solving a complex problem is another important factor
driving creativity and inventiveness. In some cases, such
recognition may ultimately lead to a tangible reward in
the form of future job offers or access to the venture
capital market. Lerner and Tirole (2005), for example,
find that reputational benefits are a key factor motivat-
ing software programmers to participate in open source
software projects.
There are also mechanisms for reducing risks and ap-
propriating inventive efforts in private markets. The pool-
ing of inventive activity within larger firms diminishes the
uncertainty of inventive outcomes, as successes make
up for failures. Pooling can also be achieved through
financial markets, notably through venture capital funds.
In addition, firms can often overcome appropriability
problems by being first to introduce a new good or
service on the market; even a short lead time may be
sufficient to generate enough profits to make inventive
investment worthwhile. Creating consumer goodwill
through extensive marketing of new products can also
give firms a competitive edge, allowing them to finance
inventive activity. Indeed, surveys of firms over the past
decades have shown that, in many sectors, lead time
and marketing are some of the most important ways of
appropriating returns on inventive activity.3
However, problems of appropriability and risk in inno-
vative activity persist even where private markets offer
certain innovation incentives. To begin with, although
individuals may invent purely out of curiosity, they also
need to earn a living. Pushing the limits of the world’s
knowledge frontier requires talent, but often it also de-
mands years of experience, collaboration within larger
research teams and expensive equipment. In addition,
successful innovation in modern economies not only
requires smart inventions, but also substantial investment
in the subsequent development and commercialization
of new products. In many cases, market mechanisms
are bound to be insufficient for inducing innovation that
is in society’s best interest, thus providing a rationale for
government intervention.
2 See Arrow (1962). In the 1930s, Joseph Schumpeter
(1937, 1943) had already recognized that firms
with market power were in a better position
to innovate. However, his analysis focused
primarily on how firm size affects innovative
behavior and entrepreneurship; he had not yet
explored the special economic attributes of
information goods as was later done by Arrow.
3 Subsection 2.3.1 summarizes the
results of these surveys.
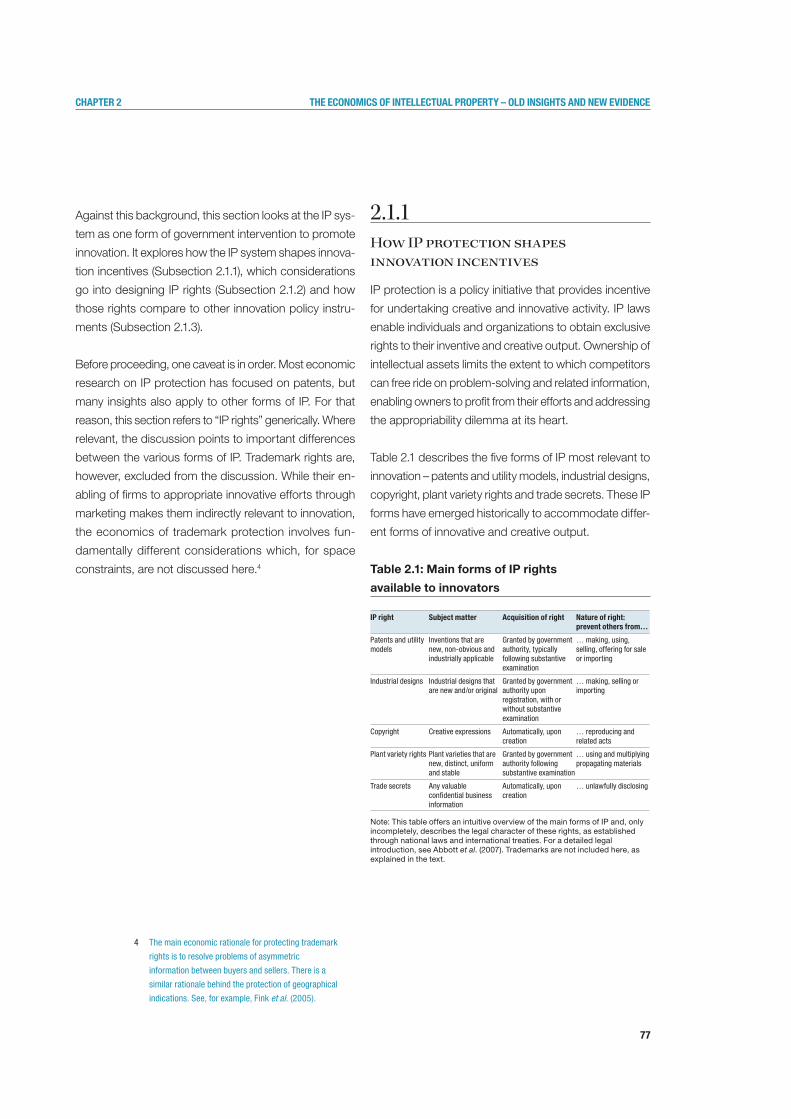
77
Chapter 2 the eConomiCs of intelleCtual property – old insights and new evidenCe
Against this background, this section looks at the IP sys-
tem as one form of government intervention to promote
innovation. It explores how the IP system shapes innova-
tion incentives (Subsection 2.1.1), which considerations
go into designing IP rights (Subsection 2.1.2) and how
those rights compare to other innovation policy instru-
ments (Subsection 2.1.3).
Before proceeding, one caveat is in order. Most economic
research on IP protection has focused on patents, but
many insights also apply to other forms of IP. For that
reason, this section refers to “IP rights” generically. Where
relevant, the discussion points to important differences
between the various forms of IP. Trademark rights are,
however, excluded from the discussion. While their en-
abling of firms to appropriate innovative efforts through
marketing makes them indirectly relevant to innovation,
the economics of trademark protection involves fun-
damentally different considerations which, for space
constraints, are not discussed here.4
2.1.1How IP protection shapes innovation incentives
IP protection is a policy initiative that provides incentive
for undertaking creative and innovative activity. IP laws
enable individuals and organizations to obtain exclusive
rights to their inventive and creative output. Ownership of
intellectual assets limits the extent to which competitors
can free ride on problem-solving and related information,
enabling owners to profit from their efforts and addressing
the appropriability dilemma at its heart.
Table 2.1 describes the five forms of IP most relevant to
innovation – patents and utility models, industrial designs,
copyright, plant variety rights and trade secrets. These IP
forms have emerged historically to accommodate differ-
ent forms of innovative and creative output.
Table 2.1: Main forms of IP rights
available to innovators
Note: This table offers an intuitive overview of the main forms of IP and, only incompletely, describes the legal character of these rights, as established through national laws and international treaties. For a detailed legal introduction, see Abbott et al. (2007). Trademarks are not included here, as explained in the text.
IP right Subject matter Acquisition of right nature of right: prevent others from…
Patents and utility models
Inventions that are new, non-obvious and industrially applicable
Granted by government authority, typically following substantive examination
… making, using, selling, offering for sale or importing
Industrial designs Industrial designs that are new and/or original
Granted by government authority upon registration, with or without substantive examination
… making, selling or importing
Copyright Creative expressions Automatically, upon creation
… reproducing and related acts
Plant variety rights Plant varieties that are new, distinct, uniform and stable
Granted by government authority following substantive examination
… using and multiplying propagating materials
Trade secrets Any valuable confidential business information
Automatically, upon creation
… unlawfully disclosing
4 The main economic rationale for protecting trademark
rights is to resolve problems of asymmetric
information between buyers and sellers. There is a
similar rationale behind the protection of geographical
indications. See, for example, Fink et al. (2005).
78
Chapter 2 the eConomiCs of intelleCtual property – old insights and new evidenCe
IP rights are an elegant means for governments to mobi-
lize market forces to guide innovative and creative activity.
They allow decisions on which innovative opportunities to
pursue to be taken in a decentralized way. To the extent
that individuals and firms operating at the knowledge
frontier are best-informed about the likely success of
innovative projects, the IP system promotes an efficient
allocation of resources for inventive and creative activity.
This has traditionally been the key economic rationale
for protecting IP rights. However, there are a number of
additional considerations, some of which strengthen the
case for exclusive rights, while others weaken it.
First, while IP rights do not directly solve the problem
of risk associated with inventive activity, they can im-
prove the functioning of financial markets in mobilizing
resources for risky innovation. In particular, the grant of
a patent at an early stage in the innovation process can
serve to reassure investors that a start-up firm is in a
position to generate profits if the invention is successfully
commercialized. In addition, it provides an independent
certification that an invention pushes the limits of the
knowledge frontier – something that investors may not
be able to assess on their own.5
Second, inventing sometimes means finding solutions
to stand-alone problems. More often, however, it is a
cumulative process, whereby researchers build on exist-
ing knowledge to develop new technologies or products.
The IP system plays an important role in the process of
cumulative innovation.6
Patent applicants must disclose the problem-solving
information underlying an invention in return for being
granted exclusive rights. This promotes timely disclosure
of new technological knowledge, and allows follow-on
inventors to build on that knowledge. In some cases,
problem-solving information can easily be discerned from
a new product on the market – as is naturally the case
for new designs and most creative expressions.7 In other
cases, however, reverse engineering may take substantial
time and effort, or it may be altogether impossible. In the
absence of patent rights, inventors would have every
incentive to keep their inventions secret. At the extreme,
valuable inventions would die with their inventors.
Even though patent laws provide for express exceptions
on using patented technologies for research purposes,
patents may nonetheless create a barrier for follow-on
innovators. Notably, certain technology fields are char-
acterized by complex patent landscapes, generating
uncertainty about whether potential new inventive output
could clash with existing proprietary rights. A related
problem arises where the commercialization of an inven-
tion requires use of third-party proprietary technology.
Other right holders may refuse to license their technolo-
gies or may demand royalties that render the innovation
unprofitable – leading to the so-called holdup problem.
Even where they are willing to license, coordinating the
participation of a large number of right holders may be
too costly.8
5 See, for example, Greenberg (2010) and
Dushnitski and Klueter (2011).
6 See, for example, Scotchmer (1991).
7 Computer software is an important exception.
The source code for a particular software can
be technologically protected from disclosure.
Copyright protection does not oblige the
owner to disclose the source code.
8 See, for example, Eisenberg (1996)
and Shapiro (2001).
79
Chapter 2 the eConomiCs of intelleCtual property – old insights and new evidenCe
Third, the IP system facilitates firm specialization in
different stages of the innovation process. As argued
in Chapter 1, the traditional view of research, develop-
ment and commercialization undertaken by a single
firm does not reflect innovation processes in modern
economies. For example, while a given firm may find it
is particularly good at figuring out how to extend the life
of batteries, other companies might be better at turning
the underlying inventions into components for different
consumer electronics. Similarly, a firm may know how
best to market a new kitchen utensil in its home market,
but prefer to partner with another firm in an unfamiliar
foreign market. Specialization allows firms to maximize an
inherent advantage, ultimately enhancing the economy-
wide productivity of the innovation process.
Economic theory holds that specialization occurs wher-
ever the transaction cost of providing specific goods or
services through the market is lower than the costs of
coordination within a single organization.9 Specialization in
the innovation process relies on markets for technology.
Compared to markets for standardized commodities,
technology markets face especially high transaction
costs – in the form of information, search, bargaining,
enforcement and related costs.10
To some extent, IP rights can reduce these costs. In the
absence of patent rights, for instance, firms would be re-
luctant to disclose secret but easy-to-copy technologies
to other firms when negotiating licensing contracts.11 As a
result, licensing agreements from which all parties stand
to benefit might never materialize. In addition, while inven-
tive and creative assets can, in principle, be transferred
through private contracts independent of any IP right, IP
titles offer a delineation of these assets combined with
an assurance of market exclusivity. IP rights thus convey
important information that can facilitate the drawing up
of contracts and reduce the uncertainty of contracting
parties as to the commercial value of the licensed assets.
Fourth, the grant of exclusive IP rights affords firms
market power, viewed by economists as the ability to set
prices above marginal production costs. In many cases,
market power emanating from an IP right is limited, as
companies face competition from similar products or
technologies. However, for radical innovation – say, a
pharmaceutical product treating a disease for which
no alternative treatment exists – market power can be
substantial. The ability of companies to generate profits
above competitive levels – also called economic rents – is
part of the economic logic of the IP system. Economic
rents allow companies to recoup their initial investment
in research and development (R&D). In other words,
economic rents are at the core of the solution to the
appropriability problem.
However, market power also implies a non-optimal al-
location of resources, moving markets away from the
economic ideal of perfect competition. Above-marginal
cost pricing can raise social concerns, as witnessed by
the debate on patents and access to medicines. It can
also slow the adoption of new technologies, with follow-
on effects on economic productivity. Finally, scholars
have long recognized that the existence of economic
rents may promote rent-seeking behavior with wasteful
or outright harmful consequences.12
9 See, for example, Coase (1937)
and Alchian and Demsetz (1972).
10 See Arora et al. (2001b)
and Arora and Gambardella (2010).
11 See Williamson (1981) and Arrow (1971).
12 See Tullock (1987) for a discussion
of the economics of rent-seeking.
80
Chapter 2 the eConomiCs of intelleCtual property – old insights and new evidenCe
The foregoing discussion reveals that IP rights have
multiple effects on innovative behavior. Understanding
their net effect ultimately requires empirical insight.
Generating credible empirical evidence is a difficult task,
however. Unlike in the natural sciences, economists
usually cannot conduct experiments, say, by randomly
assigning IP rights to companies or IP laws to countries.
Historical experience sometimes offers quasinatural ex-
periments, allowing for important insights – as illustrated
by research on innovation in the 19th century (see Box
2.1). However, it is not clear whether these insights still
apply to today’s more evolved innovation systems and
economic structures.
Notwithstanding these difficulties, economic research
has generated useful empirical evidence for evaluating
the impact of IP rights on innovation. Section 2.2 – as well
as Chapters 3 and 4 – will further review this evidence.
However, before doing so, it is instructive to explore the
implications of the above considerations for the design of
IP rights and how these rights compare with other public
policies aimed at promoting innovation.
2.1.2Trade-offs in designing IP rights
IP rights are not discrete policy instruments. National
policymakers face far-reaching choices on what can be
protected by different IP instruments, which rights are
conferred and the exceptions that may apply.13
As a first consideration, the effectiveness of different IP
instruments depends on firms’ absorptive and innovative
capacity (see Box 2.2). Economic research has further
shown that a firm’s ability to profit from its innovation
depends on access to complementary assets – such as
manufacturing capability, organizational know-how and
marketing skills.14 These factors vary considerably across
countries at different levels of economic development.
The design of IP rights needs to respond to the innovative
potential of local firms. For firms in countries at an early
stage of development, utility models may be more relevant
than patents for protecting inventive output.15 Several East
Asian countries relied heavily on utility models in their
early development stages – often protecting incremental,
non-patentable modifications of imported products.16
One study on the historical experience of the Republic of
Korea found that the experience firms gained by using the
utility model system prepared them for effectively using
the patent system, both nationally and internationally.17
However, other low- and middle-income countries with
utility model systems in place have not seen a similar
reliance on this form of IP. No systematic evidence is
available to guide policymakers on the circumstances
under which utility models work best.
13 As will be further discussed in Section
2.3, policymakers also face important
choices in the design of institutions that
administer and enforce patent rights.
14 See Teece (1986).
15 Utility models are sometimes also
known as petty patents.
16 See Suthersanen (2006).
17 See Lee (2010).
box 2.1: How did patent laws affect innovation in the 19th century?
In the mid-19th century, countries in northern Europe protected patents to varying degrees. A few – such as Denmark, the Netherlands and Switzerland – did not provide for patent protection during certain periods. Where protection was available, it varied from 3 to 15 years. Countries adopted patent laws in a relatively ad hoc manner, influenced more by legal traditions than economic considerations.
Economic historian Petra Moser (2005) analyzed whether this variation in national patent laws influenced innovation outcomes. In particular, she collected data on close to 15,000 inventions presented at the Crystal Palace World’s Fair in 1851 and the Centennial Exhibition in 1876; her dataset covered inventions from 13 northern European countries across 7 industries. She then asked whether patterns of innovation in countries that provided for patent protection differed from those that did not.
Her findings suggest that innovators in countries without patent laws focused on a small set of industries where innovation could be appropriated through secrecy or other means – most notably, scientific instruments. By contrast, innovation in countries with patent laws appeared to be more diversified. These findings suggest that innovation takes place even in the absence of patent protection; however, the existence of patent laws affects the direction of techni-cal change and thus determines countries’ industrial specialization.

81
Chapter 2 the eConomiCs of intelleCtual property – old insights and new evidenCe
box 2.2: Absorptive and innovative capacity
The terms absorptive and innovative capacity refer to the set of conditions that enable firms to learn about existing innovation from external sources and to generate innovation themselves. The factors that determine a firm’s capacity to absorb external information and to produce new ideas are related, but the concepts explain the differ-ent capabilities that firms require in order to successfully innovate.
Absorptive capacity was first used by economists Wesley Cohen and Daniel Levinthal in their seminal articles in 1989 and 1990 on the importance of firms undertaking R&D. They argue that conducting R&D generates two useful outcomes: new information and enhanced ability to assimilate and exploit existing information. When firms conduct R&D, they learn from the process and build technical skills. This, in turn, enables them to identify and assimilate R&D outcomes developed elsewhere, improve their technical knowledge and, later, their innovative capability, the ability to create new innovation.18
The ability to assimilate and learn from new knowledge is also relevant at the economy-wide level. Economies that are able to build sufficient absorptive capacity are more likely to benefit from exposure to foreign technologies and may, eventually, develop the ability to generate new technologies on their own.19
18 See Cohen and Levinthal (1989, 1990).
19 See the works of Nelson (1993), Kim (1997), Yu
(1998), the World Bank (2001) and Lall (2003).
20 See Nordhaus (1969).
21 See Scotchmer (2004) and Gilbert and Shapiro (1990).
22 For example, Jaffe (2000) argues that broader
patent protection should be afforded to the initial
invention in a line of cumulative inventions. See
also Green and Scotchmer (1995), Scotchmer
(1996) and O’Donoghue et al. (1998).
23 Lemley and Burk (2003) discuss how US
patenting standards differ across industries
and what motivates these differences.
In economic theory, the design of IP rights has been
treated as an optimization problem: governments ad-
just IP policy in order to maximize the net benefit that
accrues to society from new inventions, taking into ac-
count the possibly adverse effects exclusive rights have
on competition and follow-on innovation. Economist
William Nordhaus first applied the optimization approach
to setting the term of patent protection.20 It can also be
applied to the breadth of IP protection – as determined
by the claims set out in IP titles and their interpretation
by courts.21
In the actual design of IP rights, economic optimization
arguably has played little direct role. This partly reflects
the difficulty of empirically implementing an optimization
model. The societal value of inventions is typically un-
known before policies are set. In addition, fully capturing
all the benefits and costs, as outlined in Subsection 2.1.1,
seems elusive, even for the best-equipped economists.
Nonetheless, economic theory offers some useful guid-
ance for policymakers. First is that IP protection standards
should be differentiated according to the specific envi-
ronment in which innovation takes place. This is partly
reflected in actual IP policy by the fact that different IP
instruments exist for different subject matters (see Table
2.1). For example, while a new tablet computer may be
protected by patents, industrial designs and copyright,
each IP right protects a distinct innovative element –
whether it is the technology for operating a touch screen,
the aesthetic feature of the tablet’s design or the software
running on it.
There is also important scope for fine-tuning the breadth
of IP rights across different technology fields – partly
through laws and partly through the actions of IP offices
and courts. Economists have argued, for example, for
differentiated patent breadth depending on the extent to
which patented inventions in particular industries build
on each other.22 While some differentiation does indeed
occur in practice, it is not clear whether it always follows
economic considerations.23

82
Chapter 2 the eConomiCs of intelleCtual property – old insights and new evidenCe
The changing nature of innovation has challenged es-
tablished norms on what subject matters can be pro-
tected by different IP instruments, especially in the area
of patents. Historically, patents have been associated
with technological inventions; the Agreement on Trade-
Related Aspects of Intellectual Property Rights (TRIPS
Agreement), for example, refers to inventions “in all fields
of technology”. However, the rise of non-technological
inventions has raised questions about whether patents
should also be granted for software, business methods
or financial trading strategies, to name a few examples.
From an economic perspective, arguably it matters less
whether an invention is of a technological nature; what
is more important is whether patent rights make a differ-
ence in resolving appropriability problems and contribute
to the disclosure of knowledge that would otherwise
remain secret.
Finally, in designing differentiated IP standards, certain
trade-offs exist. Policymakers may not be sufficiently
informed about innovation conditions to optimally dif-
ferentiate IP policies. In addition, uniform IP standards
are easier to operate, and political economy pressures
to favor certain sectors are less likely to arise.
Moreover, policymakers need to be aware of how certain
forms of IP may be chosen over others. In particular,
firms face the choice of protecting inventions by patent
rights or through trade secrecy. Surveys suggest that
weak patent rights may prompt firms to rely more often
on secrecy.24 This enlarges opportunities for legitimate
imitation and technology diffusion; however, where imi-
tation is not possible, it may forestall the disclosure of
valuable knowledge.25
2.1.3How IP protection compares to other innovation policies
IP rights are a useful incentive mechanism when private
motivation to innovate aligns with society’s preferences
with regard to new technologies. But such an alignment
does not always exist. In addition, it is unclear whether
the IP system can incentivize invention that is far from
market application, for example basic science research.
So, what other means do governments have to promote
innovation, and how do they compare with the IP system?
In general, one can broadly distinguish three mechanisms
for promoting innovation. First, there is publicly-funded
innovation carried out by academic institutions and public
research organizations. Second, governments can fund
research undertaken by private firms – notably through
public procurement, research subsidies, soft loans, R&D
tax credits and innovation prizes. Third, the IP system is
the one mechanism that promotes privately executed
R&D which is financed through the marketplace rather
than government revenues.26
24 See Mansfield (1986), Levin et al. (1987) and Graham
and Sichelman (2008). These surveys show that
firms – across many industrial sectors, except for the
chemical and pharmaceutical sectors – relied more
heavily on trade secrets than on patents to protect
their innovation from rivals. They also show that firms
producing process – rather than product – innovation
rank trade secrets as more effective than patents
in protecting innovation. This preference is also
expressed where the likelihood of imitation is higher,
such as where patent protection is perceived to be
weak or the perceived value of innovation is high.
25 Lerner and Zhu (2007) show that a weakening of
copyright protection in the US has prompted software
developers increasingly to rely on patent rights.
However, it is not clear from their study how this
substitution of IP forms has affected innovation.
26 See, for example, David (1993).
83
Chapter 2 the eConomiCs of intelleCtual property – old insights and new evidenCe
It is important to recognize that the various instruments
of innovation policy can be complementary. For instance,
academic research sometimes results in patents and sub-
sequent licensing for commercial development. Similarly,
government support of privately undertaken research
may result in IP ownership. However, it is useful to inde-
pendently analyze and compare each policy instrument.
Table 2.2 offers an overview of the different mechanisms
and compares them along several dimensions. It shows
that the choice of policy instrument depends on the circum-
stances in which R&D is conducted. To begin with, basic
research that does not immediately lead to commercial ap-
plication is largely undertaken by academia and public re-
search organizations. These institutions also invest in more
generic research aimed at advancing specific societal inter-
ests – for example in the area of health. Other policy instru-
ments can also spur such generic research, although they
typically place a stronger emphasis on applied research.
Important differences exist in how R&D is financed.
Certain policy instruments – notably, prizes, R&D tax
credits and IP rights – require firms to initially fund R&D
activity on their own or through financial markets. These
instruments may therefore be less effective for large
and highly risky R&D projects and in economies with
underdeveloped financial markets (see Box 2.3). The
other instruments provide upfront public financing of
R&D, reducing ex-ante risk and avoiding the problems
of imperfect credit markets.27
A closely related consideration is whether a policy instru-
ment functions mainly as a “push” or a “pull” mechanism.
The key difference is that, in the case of a “push” mecha-
nism innovators are rewarded at the outset, whereas in
the latter case, the reward depends on the innovation’s
success. “Pull” mechanisms such as IP rights and prizes
may thus entail stronger performance incentives, as in-
novators face the pressure – or lure – of success when
engaging in R&D.
27 For a literature survey, see Hall and Lerner (2010).
box 2.3: barriers to innovation in Chile
Chile is a small open economy that mainly exports raw materials and agricultural commodities – such as copper, wine, fruits and fish. Nonetheless, the country has incipient technological capabili-ties in certain industries, notably those linked to the processing of natural resources. Indeed, responses to Chile’s national innovation survey reveal that 24.8 percent of firms had introduced some kind of innovation in the 2007-2008 period.
What barriers do Chilean firms encounter when they innovate? According to the same survey, high costs of innovative activity and difficulties in obtaining financing rank among the most important barriers. Firms also indicate “ease of copying by other firms” as a problem, but it only ranks 11th on the list of barriers. Accordingly, only 4.8 percent of innovating firms indicated that they had applied for patents – a figure far below similar shares for the United States (US) and European countries.
In response to these key barriers to innovation, one central element of Chile’s innovation policy has been the provision of innovation subsidies. Two innovation funds – the Fondo Nacional de Desarrollo Científico y Tecnológico and the Fondo de Fomento al Desarrollo Científico y Tecnológico – offer support to basic scientific research and early stage R&D activity.
Source: Benavente (2011).
84
Chapter 2 the eConomiCs of intelleCtual property – old insights and new evidenCe
As mentioned earlier, one attraction of the IP system is
that companies likely to be well-informed about techno-
logical opportunities select R&D projects themselves.
This is also the case for tax credits. In order to obtain
subsidies and soft loans, companies may initiate an R&D
project, but it is a government agency that ultimately
decides whether to support the project. In the case
of procurement and innovation prizes, governments
initiate and select R&D projects. This may give rise to
so-called information failures. First, governments may
be imperfectly informed about the success potential of
competing R&D projects, possibly leading to less than
ideal choices. Second, problems related to incomplete
contracting may arise; in particular, it may be difficult at
the outset to fully enumerate the conditions that deter-
mine whether a procurement contract or prize objective
has been fulfilled.
The categorization presented in Table 2.2 ignores impor-
tant choices in the design of individual policy instruments
that affect innovation performance. However, it points
to some of the key advantages and drawbacks of the
IP system relative to other innovation policies. First, for
governments, the IP system is cheap; it does not require
government spending to finance R&D. Second, R&D
decisions based on IP rights are decentralized, reducing
information failures. Tax credits offer the same advantage,
but do not by themselves solve the appropriability prob-
lem. In fact, for tax credits to be effective, firms need to
be able to appropriate innovation investment – including
through IP rights.
One drawback of the IP system is that it leads to exclu-
sive rights over research outcomes; this may reduce
competition and slow cumulative innovation. Innovation
prizes that result in public ownership of research results
are superior in this respect, and they preserve the “pull”
property of the IP system. However, they can suffer
from information failures, notably the difficulty of writing
complete contracts. This may explain why innovation
prizes have mainly been used for relatively small-scale
problems for which solutions are within reach, and
mainly by firms rather than governments (see subsection
1.2.5). Nonetheless, prizes may be especially suitable for
incentivizing socially desirable innovation for which no or
only small markets exist, precisely because of the lack of
market signals that may otherwise guide R&D decisions.28
A second drawback of IP rights – and prizes – is that they
require ex-ante private financing of R&D. In environments
where such financing is hard to come by, “push” instru-
ments such as subsidies and soft loans may be needed
to encourage innovation, especially where risk is involved.
In sum, no single policy instrument works best in all
circumstances. In considering which instrument to em-
ploy, policymakers need to take into account financing
conditions, risk levels, possible information failures,
performance incentives and other variables. Indeed,
since each policy instrument has both advantages and
drawbacks, the key challenge for policymakers is to mix
policies so that they effectively complement each other.
28 Much thought has been given in recent years
to designing innovation prizes in a way that
maximizes their effectiveness, especially in the
pharmaceutical sector. For example, see Love
and Hubbard (2009) and Sussex et al. (2011).
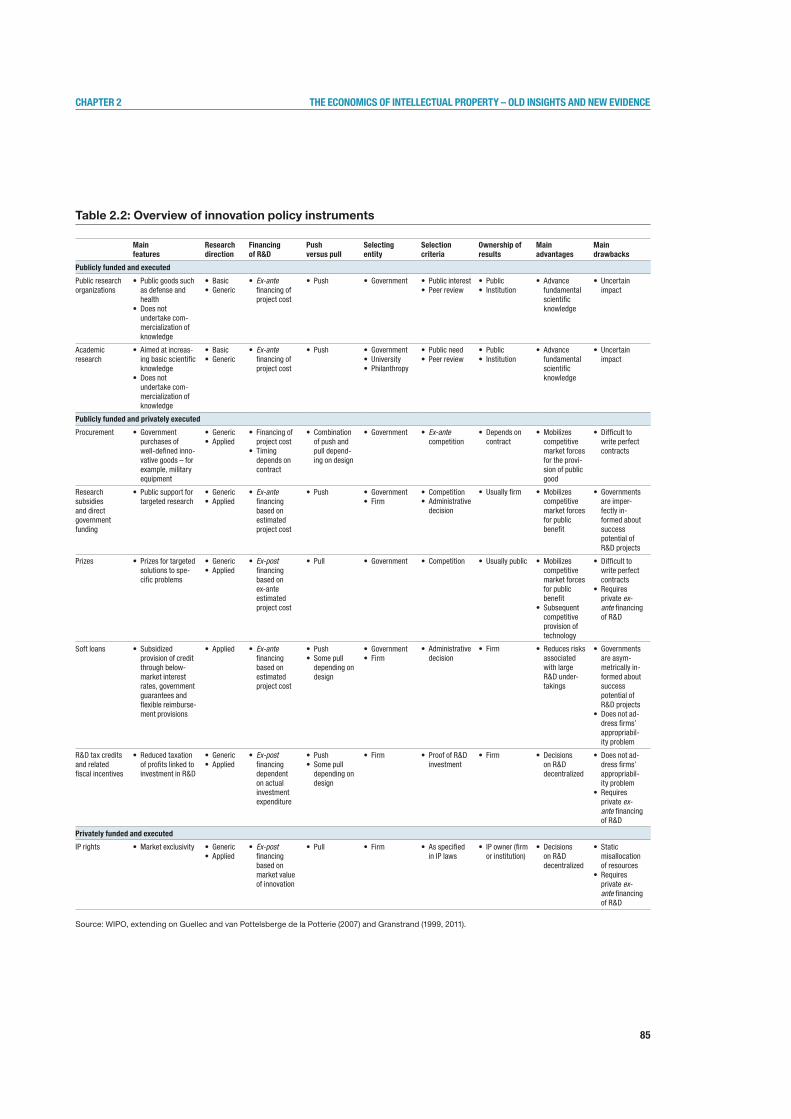
85
Chapter 2 the eConomiCs of intelleCtual property – old insights and new evidenCe
Table 2.2: Overview of innovation policy instruments
Source: WIPO, extending on Guellec and van Pottelsberge de la Potterie (2007) and Granstrand (1999, 2011).
Mainfeatures
researchdirection
Financingof r&d
Pushversus pull
Selectingentity
Selectioncriteria
ownership of results
Mainadvantages
Maindrawbacks
Publicly funded and executed
Public researchorganizations
• Publicgoodssuchas defense and health
• Doesnotundertake com-mercialization of knowledge
• Basic• Generic
• Ex-ante financing of project cost
• Push • Government • Publicinterest• Peerreview
• Public• Institution
• Advancefundamental scientific knowledge
• Uncertainimpact
Academic research
• Aimedatincreas-ing basic scientific knowledge
• Doesnotundertake com-mercialization of knowledge
• Basic• Generic
• Ex-ante financing of project cost
• Push • Government• University• Philanthropy
• Publicneed• Peerreview
• Public• Institution
• Advancefundamental scientific knowledge
• Uncertainimpact
Publicly funded and privately executed
Procurement • Governmentpurchases of well-defined inno-vative goods – for example, military equipment
• Generic• Applied
• Financingofproject cost
• Timingdepends on contract
• Combinationof push and pull depend-ing on design
• Government • Ex-ante competition
• Dependsoncontract
• Mobilizescompetitive market forces for the provi-sion of public good
• Difficulttowrite perfect contracts
Research subsidies and direct government funding
• Publicsupportfortargeted research
• Generic• Applied
• Ex-ante financing based on estimated project cost
• Push • Government• Firm
• Competition• Administrative
decision
• Usuallyfirm • Mobilizescompetitive market forces for public benefit
• Governmentsare imper-fectly in-formed about success potential of R&D projects
Prizes • Prizesfortargetedsolutions to spe-cific problems
• Generic• Applied
• Ex-post financing based on ex-ante estimated project cost
• Pull • Government • Competition • Usuallypublic • Mobilizescompetitive market forces for public benefit
• Subsequentcompetitive provision of technology
• Difficulttowrite perfect contracts
• Requiresprivate ex-ante financing of R&D
Soft loans • Subsidizedprovision of credit through below-market interest rates, government guarantees and flexible reimburse-ment provisions
• Applied • Ex-ante financing based on estimated project cost
• Push• Somepull
depending on design
• Government• Firm
• Administrative decision
• Firm • Reducesrisksassociated with large R&D under-takings
• Governmentsare asym-metrically in-formed about success potential of R&D projects
• Doesnotad-dress firms’ appropriabil-ity problem
R&D tax credits and related fiscal incentives
• Reducedtaxationof profits linked to investment in R&D
• Generic• Applied
• Ex-post financing dependent on actual investment expenditure
• Push• Somepull
depending on design
• Firm • ProofofR&Dinvestment
• Firm • Decisionson R&D decentralized
• Doesnotad-dress firms’ appropriabil-ity problem
• Requiresprivate ex-ante financing of R&D
Privately funded and executed
IP rights • Marketexclusivity • Generic• Applied
• Ex-post financing based on market value of innovation
• Pull • Firm • Asspecifiedin IP laws
• IPowner(firmor institution)
• Decisionson R&D decentralized
• Staticmisallocation of resources
• Requiresprivate ex-ante financing of R&D
86
Chapter 2 the eConomiCs of intelleCtual property – old insights and new evidenCe
2.2Taking a closer look at the patent system
The last three decades have seen use of the patent
system increase to historically unprecedented levels (see
Figure 1.18). They have also seen substantial increases
in real R&D investment and remarkable progress in
many areas of technology – most spectacularly in the
information and communications technology (ICT) field.
While these trends indicate that patenting has become
more central to strategies of innovative firms, they alone
do not reveal how effective the patent system has been
in promoting innovation and improving welfare.
Prompted by the increase in patenting activity, econo-
mists have scrutinized the role that patents play in the
innovation process. In addition, the construction of new
databases – often combining unit record data on patents
with firm-level information on innovative behavior and
economic performance – has enabled richer investiga-
tions into the effects of patent protection.
This section takes a closer look at the economics of
the patent system, focusing on more recent research. It
expands on several concepts and ideas introduced in
the previous section and confronts them with empirical
evidence. In particular, it discusses how effective the pat-
ent system is as an appropriation mechanism in different
sectors of the economy (Subsection 2.2.1), how more
widespread patenting affects the process of cumulative
innovation (Subsection 2.2.2), how patent rights shape the
interplay between competition and innovation (Subsection
2.2.3) and the role patents play in modern technology
markets and open innovation strategies (Subsection
2.2.4). The insights gained through more recent research
have led economists to refine their views on the role the
patent system plays in the innovation process.
2.2.1How patent protection affects firm performance
As a first step, it is helpful to review the evidence on
how patent protection affects the performance of firms.
Subsection 2.1.1 pointed to one key difficulty in generat-
ing empirical evidence: since patent systems have been
in place in most countries throughout recent history, no
obvious benchmarks exist against which the performance
of patenting firms can be compared. One way around this
problem is to directly survey firms about the importance
they place on patents as an appropriation mechanism
for innovative activity. Several such surveys have been
conducted, and Table 2.3 summarizes their main results.
As pointed out in Section 2.1, both lead time and sales
and service activities emerge as the most important
appropriation mechanisms. The importance of patents
varies across industries. In industries with short product
life cycles – for example, electronics – patents appear to
be of lesser importance; indeed, technologies may be
obsolete by the time patents are granted. By contrast,
patent protection is critically important in the chemical
and pharmaceutical industries. This results from the long
R&D process in these industries, combined with the fact
that chemical and pharmaceutical products are easily
imitated once introduced to the market. The surveys
summarized in Table 2.3 provide useful insights into the
role of patent protection, but the evidence is qualitative
in nature.
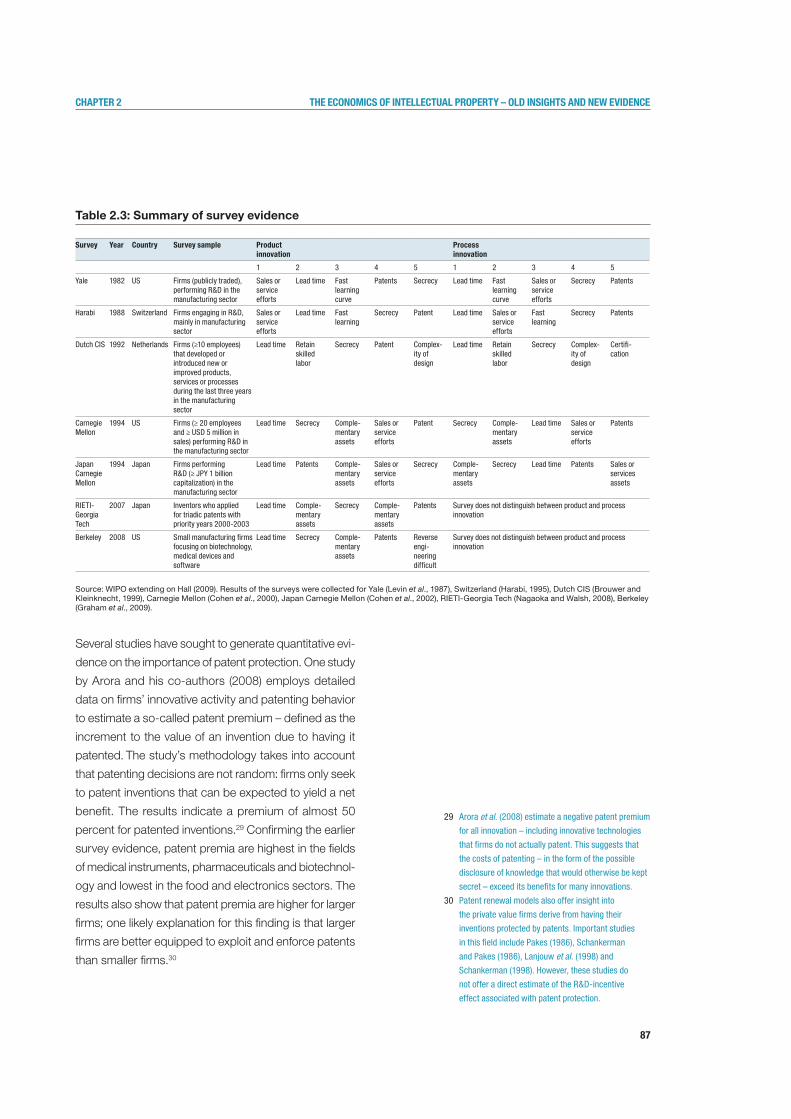
87
Chapter 2 the eConomiCs of intelleCtual property – old insights and new evidenCe
Table 2.3: Summary of survey evidence
Source:WIPOextendingonHall(2009).ResultsofthesurveyswerecollectedforYale(Levinet al., 1987), Switzerland (Harabi, 1995), Dutch CIS (Brouwer and Kleinknecht, 1999), Carnegie Mellon (Cohen et al., 2000), Japan Carnegie Mellon (Cohen et al., 2002), RIETI-Georgia Tech (Nagaoka and Walsh, 2008), Berkeley (Graham et al., 2009).
Several studies have sought to generate quantitative evi-
dence on the importance of patent protection. One study
by Arora and his co-authors (2008) employs detailed
data on firms’ innovative activity and patenting behavior
to estimate a so-called patent premium – defined as the
increment to the value of an invention due to having it
patented. The study’s methodology takes into account
that patenting decisions are not random: firms only seek
to patent inventions that can be expected to yield a net
benefit. The results indicate a premium of almost 50
percent for patented inventions.29 Confirming the earlier
survey evidence, patent premia are highest in the fields
of medical instruments, pharmaceuticals and biotechnol-
ogy and lowest in the food and electronics sectors. The
results also show that patent premia are higher for larger
firms; one likely explanation for this finding is that larger
firms are better equipped to exploit and enforce patents
than smaller firms.30
29 Arora et al. (2008) estimate a negative patent premium
for all innovation – including innovative technologies
that firms do not actually patent. This suggests that
the costs of patenting – in the form of the possible
disclosure of knowledge that would otherwise be kept
secret – exceed its benefits for many innovations.
30 Patent renewal models also offer insight into
the private value firms derive from having their
inventions protected by patents. Important studies
in this field include Pakes (1986), Schankerman
and Pakes (1986), Lanjouw et al. (1998) and
Schankerman (1998). However, these studies do
not offer a direct estimate of the R&D-incentive
effect associated with patent protection.
Survey Year Country Survey sample Product innovation
Process innovation
1 2 3 4 5 1 2 3 4 5
Yale 1982 US Firms (publicly traded), performing R&D in the manufacturing sector
Sales or service efforts
Lead time Fast learning curve
Patents Secrecy Lead time Fast learning curve
Sales or service efforts
Secrecy Patents
Harabi 1988 Switzerland Firms engaging in R&D, mainly in manufacturing sector
Sales or service efforts
Lead time Fast learning
Secrecy Patent Lead time Sales or service efforts
Fast learning
Secrecy Patents
Dutch CIS 1992 Netherlands Firms (≥10 employees) that developed or introduced new or improved products, services or processes during the last three years in the manufacturing sector
Lead time Retain skilled labor
Secrecy Patent Complex-ity of design
Lead time Retain skilled labor
Secrecy Complex-ity of design
Certifi-cation
Carnegie Mellon
1994 US Firms (≥ 20 employees and ≥ USD 5 million in sales) performing R&D in the manufacturing sector
Lead time Secrecy Comple-mentary assets
Sales or service efforts
Patent Secrecy Comple-mentary assets
Lead time Sales or service efforts
Patents
Japan Carnegie Mellon
1994 Japan Firms performing R&D (≥ JPY 1 billion capitalization) in the manufacturing sector
Lead time Patents Comple-mentary assets
Sales or service efforts
Secrecy Comple-mentary assets
Secrecy Lead time Patents Sales or services assets
RIETI-Georgia Tech
2007 Japan Inventors who applied for triadic patents with priority years 2000-2003
Lead time Comple-mentary assets
Secrecy Comple-mentary assets
Patents Survey does not distinguish between product and process innovation
Berkeley 2008 US Small manufacturing firms focusing on biotechnology, medical devices and software
Lead time Secrecy Comple-mentary assets
Patents Reverse engi-neering difficult
Survey does not distinguish between product and process innovation
88
Chapter 2 the eConomiCs of intelleCtual property – old insights and new evidenCe
Studies have also investigated whether the prospect of
securing patent rights leads firms to invest more in R&D.
A study by Qian (2007) focuses on the experience of 26
countries that introduced pharmaceutical patent protec-
tion in the period 1978-2002. The pharmaceutical sector
is especially suited for analyzing how patent protection
affects R&D behavior. The survey evidence summarized
in Table 2.3 reveals the importance of patent protection
in this sector, and the establishment of pharmaceutical
product patent protection typically represents a major
policy shift. The study finds no effect for patent protection
across all countries, but a positive effect in countries that
are more developed and have higher levels of education.
This finding highlights the fact that pre-existing innovative
capacity is an important factor in whether patent rights
matter (see Subsection 2.2.2).
A closely related study by Kyle and McGahan (2011)
draws similar conclusions. In addition, it finds that the in-
troduction of patent protection in lower-income countries
has not created incentives for R&D related to diseases
primarily affecting those countries. The study argues that
this result is due to the small size of these countries and
calls for complementary innovation policies to incentiv-
ize R&D specific to the needs of poorer societies (see
Subsection 2.2.3).31
A related question concerns whether differences in the
level of patent protection across countries affect firms’
decisions on where to locate R&D. Such differences
may be of minor importance for R&D directed at global
markets. However, R&D often has a local component
– for example, where firms adapt technologies to local
markets or focus on the preferences and needs of lo-
cal consumers.
Thursby and Thursby (2006) studied the importance of
IP protection in the decision-making process of R&D-
intensive multinational firms. In a survey of 250 such
firms, respondents identified IP protection as an important
factor in determining where to conduct R&D. However,
they still established R&D facilities in markets where IP
protection was perceived to be weak. Indeed, other fac-
tors – notably, the potential for market growth and the
quality of R&D personnel – emerge as important drivers
of location decisions. Further research work by Thursby
and Thursby (2011) highlights the fact that most “new-to-
the-world” research is conducted either in the US or in
other high-income countries where IP protection tends
to be strong. Again, however, IP protection does not
appear to be the main driver of this outcome; university
faculty expertise and ease of collaboration with universi-
ties emerge as the key factors which explain where firms
carry out cutting-edge research.
31 The evidence from other studies is more ambiguous,
although many use a less convincing policy
counterfactual. Park and Ginarte (1997) and Kanwar
and Evenson (2003) use an index that measures
overall strength of a country’s IP rights. They also
find that patent protection leads to greater R&D
expenditure for countries above certain levels of
development. Sakakibara and Branstetter (2001)
studied the effects on R&D of Japan’s 1988 patent
reform and find only a small impact on R&D activity.

89
Chapter 2 the eConomiCs of intelleCtual property – old insights and new evidenCe
Recognizing that patents can convey information about
the commercial potential of inventions, economists have
studied their role in mobilizing financial resources for
innovative firms. Indeed, studies have found that firms
that own patents are more likely to receive financing from
venture capitalists than those that do not. Recent surveys
conducted in the US show that this is the case for small
rather than large firms.32 Two important studies on ven-
ture capital financing of US semiconductor firms show
that not only do patent applications convey important
information to investors about the quality of inventions,
they also help firms to attract funds in the earlier stages of
financing.33 At the same time, the importance of patents
in facilitating access to finance differs by industry, with,
for example, patents playing a more prominent role in
health care-related technologies than ICTs.34
2.2.2How patent strategies shift where innovation is cumulative
To understand how patent protection affects innovation,
it is essential to look beyond the individual firm. Innovative
activity seldom happens in isolation; one firm’s solution to
a problem typically relies on insights gained from previous
innovation. Similarly, in competitive markets, firms inno-
vate simultaneously and develop technologies that may
complement each other. As pointed out in Subsection
2.1.1, patent rights influence how prior or complementary
knowledge can be accessed and commercialized.
The rapid increase in the number of patent filings has
raised concerns about patents hindering cumulative in-
novation. Indeed, patenting activity has grown especially
fast for so-called complex technologies. Economists
define complex technologies as those that consist of
numerous separately patentable inventions with possibly
widespread patent ownership; discrete technologies, by
contrast, describe products or processes made up of
only a few patentable inventions. Figure 2.1 depicts the
growth in patent applications worldwide for these two
technology categories. The top figure compares patent-
ing growth for first filings, approximating new inventions;
it shows consistently faster filing growth for complex
technologies since the early 1970s. The bottom figure
focuses on subsequent filings, made up mostly of filings
outside the applicants’ home country; it reveals equally
faster filing growth for complex technologies, though only
starting from the mid-1990s.
32 See Lemley (2000), Hsu and Ziedonis (2008),
Harhoff (2009), Graham and Sichelman (2008)
and Sichelman and Graham (2010).
33 Cockburn and MacGarvie (2009) examine how US
legislation enabling the patentability of software
in the mid-1990s has affected market entry of
new competitors. They use data on the financing
of entrants in 27 narrowly defined software
markets. One of their findings is that firms with
patents are more likely to be funded by venture
capitalists. See also Greenberg (2010).
34 See Graham et al. (2009). This study also
suggests that the role of patents differs
according to financing source.
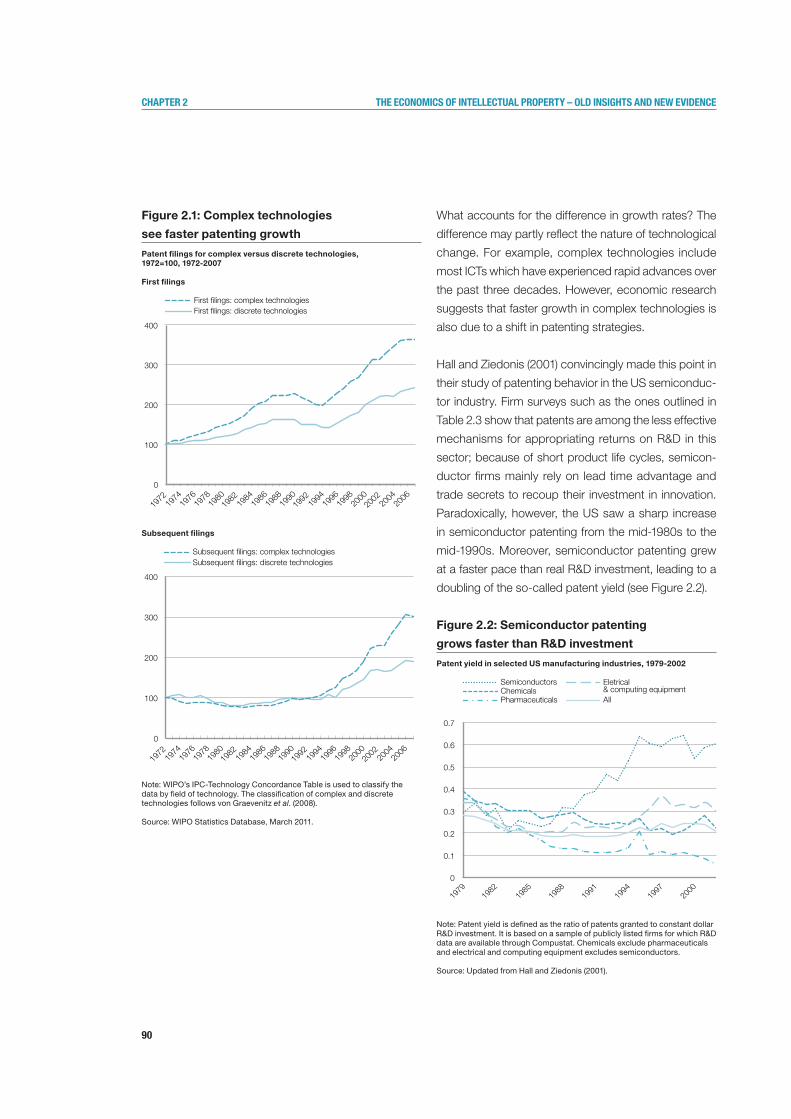
90
Chapter 2 the eConomiCs of intelleCtual property – old insights and new evidenCe
Figure 2.1: Complex technologies
see faster patenting growth
Patent filings for complex versus discrete technologies, 1972=100, 1972-2007
First filings
Subsequent filings
Note: WIPO’s IPC-Technology Concordance Table is used to classify the data by field of technology. The classification of complex and discrete technologies follows von Graevenitz et al. (2008).
Source: WIPO Statistics Database, March 2011.
What accounts for the difference in growth rates? The
difference may partly reflect the nature of technological
change. For example, complex technologies include
most ICTs which have experienced rapid advances over
the past three decades. However, economic research
suggests that faster growth in complex technologies is
also due to a shift in patenting strategies.
Hall and Ziedonis (2001) convincingly made this point in
their study of patenting behavior in the US semiconduc-
tor industry. Firm surveys such as the ones outlined in
Table 2.3 show that patents are among the less effective
mechanisms for appropriating returns on R&D in this
sector; because of short product life cycles, semicon-
ductor firms mainly rely on lead time advantage and
trade secrets to recoup their investment in innovation.
Paradoxically, however, the US saw a sharp increase
in semiconductor patenting from the mid-1980s to the
mid-1990s. Moreover, semiconductor patenting grew
at a faster pace than real R&D investment, leading to a
doubling of the so-called patent yield (see Figure 2.2).
Figure 2.2: Semiconductor patenting
grows faster than R&D investment
Patent yield in selected US manufacturing industries, 1979-2002
Note: Patent yield is defined as the ratio of patents granted to constant dollar R&D investment. It is based on a sample of publicly listed firms for which R&D data are available through Compustat. Chemicals exclude pharmaceuticals and electrical and computing equipment excludes semiconductors.
Source: Updated from Hall and Ziedonis (2001).
0
100
200
300
400
1972
19
74
1976
1978
1980
1982
19
84
1986
1988
1990
1992
19
94
1996
1998
2000
2002
20
04
2006
First lings: complex technologies First lings: discrete technologies
0
100
200
300
400
1972
19
74
1976
1978
1980
1982
19
84
1986
1988
1990
1992
19
94
1996
1998
2000
2002
20
04
2006
Subsequent lings: complex technologies Subsequent lings: discrete technologies
0
0.1
0.2
0.3
0.4
0.5
0.6
0.7
1979
1982
1985
1988
1991
1994
1997
2000
Semiconductors Chemicals Pharmaceuticals
Eletrical & computing equipment All
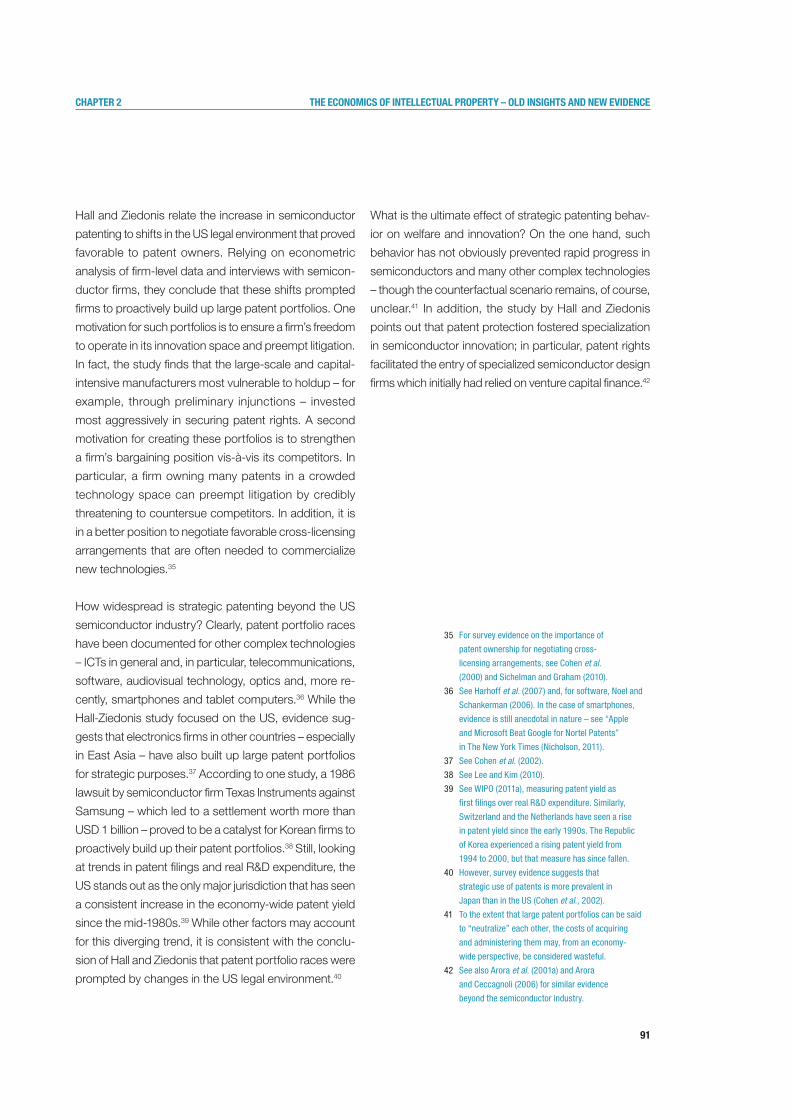
91
Chapter 2 the eConomiCs of intelleCtual property – old insights and new evidenCe
Hall and Ziedonis relate the increase in semiconductor
patenting to shifts in the US legal environment that proved
favorable to patent owners. Relying on econometric
analysis of firm-level data and interviews with semicon-
ductor firms, they conclude that these shifts prompted
firms to proactively build up large patent portfolios. One
motivation for such portfolios is to ensure a firm’s freedom
to operate in its innovation space and preempt litigation.
In fact, the study finds that the large-scale and capital-
intensive manufacturers most vulnerable to holdup – for
example, through preliminary injunctions – invested
most aggressively in securing patent rights. A second
motivation for creating these portfolios is to strengthen
a firm’s bargaining position vis-à-vis its competitors. In
particular, a firm owning many patents in a crowded
technology space can preempt litigation by credibly
threatening to countersue competitors. In addition, it is
in a better position to negotiate favorable cross-licensing
arrangements that are often needed to commercialize
new technologies.35
How widespread is strategic patenting beyond the US
semiconductor industry? Clearly, patent portfolio races
have been documented for other complex technologies
– ICTs in general and, in particular, telecommunications,
software, audiovisual technology, optics and, more re-
cently, smartphones and tablet computers.36 While the
Hall-Ziedonis study focused on the US, evidence sug-
gests that electronics firms in other countries – especially
in East Asia – have also built up large patent portfolios
for strategic purposes.37 According to one study, a 1986
lawsuit by semiconductor firm Texas Instruments against
Samsung – which led to a settlement worth more than
USD 1 billion – proved to be a catalyst for Korean firms to
proactively build up their patent portfolios.38 Still, looking
at trends in patent filings and real R&D expenditure, the
US stands out as the only major jurisdiction that has seen
a consistent increase in the economy-wide patent yield
since the mid-1980s.39 While other factors may account
for this diverging trend, it is consistent with the conclu-
sion of Hall and Ziedonis that patent portfolio races were
prompted by changes in the US legal environment.40
What is the ultimate effect of strategic patenting behav-
ior on welfare and innovation? On the one hand, such
behavior has not obviously prevented rapid progress in
semiconductors and many other complex technologies
– though the counterfactual scenario remains, of course,
unclear.41 In addition, the study by Hall and Ziedonis
points out that patent protection fostered specialization
in semiconductor innovation; in particular, patent rights
facilitated the entry of specialized semiconductor design
firms which initially had relied on venture capital finance.42
35 For survey evidence on the importance of
patent ownership for negotiating cross-
licensing arrangements, see Cohen et al. (2000) and Sichelman and Graham (2010).
36 See Harhoff et al. (2007) and, for software, Noel and
Schankerman (2006). In the case of smartphones,
evidence is still anecdotal in nature – see “Apple
and Microsoft Beat Google for Nortel Patents”
in The New York Times (Nicholson, 2011).
37 See Cohen et al. (2002).
38 See Lee and Kim (2010).
39 See WIPO (2011a), measuring patent yield as
first filings over real R&D expenditure. Similarly,
Switzerland and the Netherlands have seen a rise
in patent yield since the early 1990s. The Republic
of Korea experienced a rising patent yield from
1994 to 2000, but that measure has since fallen.
40 However, survey evidence suggests that
strategic use of patents is more prevalent in
Japan than in the US (Cohen et al., 2002).
41 To the extent that large patent portfolios can be said
to “neutralize” each other, the costs of acquiring
and administering them may, from an economy-
wide perspective, be considered wasteful.
42 See also Arora et al. (2001a) and Arora
and Ceccagnoli (2006) for similar evidence
beyond the semiconductor industry.
92
Chapter 2 the eConomiCs of intelleCtual property – old insights and new evidenCe
On the other hand, econometric evidence suggests that
dense webs of overlapping patent rights – so-called pat-
ent thickets – can indeed slow or even forestall cumula-
tive innovation processes.43 High transaction costs have
made it difficult for some – especially small – firms to ob-
tain the licenses necessary for prior and complementary
technologies; the latter include patented research tools
that, for example, are of special relevance to biotechnol-
ogy research.44 As will be further discussed in Chapter 3,
private collaborative arrangements can, to some extent,
preempt such adverse outcomes.
Finally, strategic patenting affects the nature and inten-
sity of competition in product markets, in turn affecting
innovation incentives. To understand precisely how first
requires a broader discussion of the interaction between
the forces of competition and innovation.
2.2.3How patent rights shape the interplay between competition and innovation
Competition in product markets affects innovative behav-
ior in different ways. Subsection 2.1.1 discussed one such
way: if firms cannot generate profits above competitive
levels, they cannot recoup their initial R&D investment.
Too much competition harms innovation. Indeed, this
relationship appears to hold empirically; studies show
that, across industries, more intense competition is as-
sociated with less innovation. However, this correlation
only holds above a certain threshold of competition.
Below that level, more intense competition is actually
associated with increasing innovation.45 This latter find-
ing has an intuitive explanation: if firms generate large
economic rents and face little competition that threatens
these rents, market pressure to innovate is weak. If, by
contrast, firms’ economic rents are threatened by rival
innovative efforts, their incentive to innovate on their own
is stronger.
Overall, there is thus an inverted-U-shaped relationship
between competition and innovation, whereby investment
in innovation first increases with the level of competition,
and then declines as competition intensifies beyond that
level. Although intuitive, formally incorporating these rela-
tionships into theoretical models of industrial organization
has turned out to be difficult. Only recently have econo-
mists developed models that generate the inverted-U
relationship observed in the data.46
How do patent rights influence the competition-innovation
relationship? On the one hand, one may argue that patent
rights foster a healthy competitive balance. They prevent
competition of the free-riding type that undermines
the appropriation of R&D investment. But they permit
competition between substitute products each of which
may be protected by different patent rights. In addition,
certain features of the patent system directly promote
competitive market forces: the disclosure requirement
enables firms to learn from the inventions of rivals; and
43 See Cockburn et al. (2010) for econometric evidence.
44 See Eisenberg (1996), Heller and Eisenberg
(1998), Murray and Stern (2006, 2007)
and Verbuere et al. (2006).
45 See Aghion et al. (2005).
46 Idem.
93
Chapter 2 the eConomiCs of intelleCtual property – old insights and new evidenCe
the limited protection term ensures that the economic
rent associated with a patent is time-bound, inducing
firms to stay ahead by constantly innovating.
On the other hand, patent ownership can, in certain situ-
ations, significantly curtail competition. While rare, patent
rights to key technologies for which few substitutes exist
can lead to concentrated market structures. In addition,
the emergence of patent thickets, as outlined in the
previous subsection, can negatively affect competition
by marginalizing those firms that do not have a suffi-
ciently large patent portfolio as a bargaining tool. Where
patent rights overly restrict competition, society loses
twice: through higher prices and less choice in product
markets; and through insufficient competitive pressure
on firms to innovate. In practice, it is difficult for policy-
makers to assess when such a situation arises. There is
little empirical guidance on what “dose” of competition
is optimal for innovation. Indeed, this will differ across
industries and depends on the characteristics of markets
and technologies.
Nonetheless, policymakers should be especially con-
cerned about two types of patenting practices. First,
certain patenting strategies primarily serve to slow the
innovative efforts of rival firms. For example, a firm may
seek a patent for a technology that it does not commer-
cialize, but may then sue rivals on the basis of that patent
to block entry into product markets.47 Indeed, a recent
inventor survey revealed that, for nearly one-fifth of pat-
ents filed at the European Patent Office (EPO), “blocking
competitors” was an important motivation for patenting.48
A related strategy involves filing patents with broad
claims for trivial inventions and threatening competitors
with litigation; even if the patent office eventually rejects
those patents, they may generate uncertainty among rival
firms who fear that their own innovative activity may clash
with future patent rights. Small firms and new market
entrants – often thought to be an especially important
source of innovation in the economy – may be especially
vulnerable to these types of blocking strategy, because
they may not have a large enough patent portfolio to
deter litigious rivals.
The rise in patenting of complex technologies has argu-
ably widened the scope for using patents anticompetitive-
ly. Identifying such practices is difficult. Patent documents
alone do not offer any insight into the strategic use of
patent rights.49 In addition, the line between a patent that
aims to ensure freedom-to-operate versus a predatory
patent may not be easily drawn, especially in industries
with dense patent thickets. As will be further explained
in Section 2.3, sound patent institutions can reduce
the potential for patents to be used anti-competitively.
In addition, there is an important role for competition
policy to play in containing outright predatory behavior
by patent owners.50
A second area of emerging concern relates to the ac-
tivities of so-called non-practicing entities (NPEs). These
entities are either individuals or firms that build up port-
folios of patent rights, but do not seek to develop or
commercialize any products based on technologies
they own. Instead, they monitor markets for potentially
infringing products and then enforce their patent rights by
approaching firms to negotiate licenses or by initiating liti-
gation. Many larger NPEs do not file patents themselves,
but buy unused patents from firms that do not actively use
them or that are forced by bankruptcy to auction them.
47 See Gilbert and Newbery (1982) for
a theoretical exposition.
48 See Giuri et al. (2007).
49 However, Harhoff et al. (2007) argue that acts of
predation will leave traces in patent data if those
acts involve patent opposition or outright litigation.
50 See Harhoff et al. (2007).
94
Chapter 2 the eConomiCs of intelleCtual property – old insights and new evidenCe
NPEs can be beneficial to society by helping to create
secondary markets for technology (see also the discus-
sion in Subsection 2.2.4). Such markets can foster inno-
vation incentives as they enable firms to reap a return on
research activity, even if the resulting research output is
not further developed and commercialized. Selling non-
essential patents may be especially attractive for small
companies or individual inventors that lack the resources
to effectively use or enforce them.51
Yet, critics of at least some NPEs argue that their activi-
ties are primarily rent-seeking and that any benefit to the
original patent owners is more than offset by the costs to
the innovators targeted by NPEs’ enforcement actions.52
A firm threatened with costly litigation may prefer to settle
and agree to pay a royalty, even if it feels that it has not
infringed a patent. Since NPEs do not manufacture and
thus do not risk infringing someone else’s patent, they
face no chance of counter-lawsuits. According to critics,
NPEs are thus harmful to society, as they increase the
risks associated with and cost of innovation.
Empirical research on NPEs is still in its infancy. One re-
cent study on litigation of financial patents in the US finds
that parties other than the inventor or the original patent
applicant play a significant role in litigation. Patent own-
ers initiating litigation fitted the profile of NPEs; they were
overwhelmingly individuals or small companies – unlike
the larger financial institutions that commercialize most
financial innovations. Indeed, the latter were dispropor-
tionately targeted in litigation. The study also finds that
financial patents were litigated at a rate of 27 to 39 times
greater than that of US patents as a whole.53 These find-
ings are specific to the US financial service industry and
do not shed light on how litigation has affected financial
innovation. However, they point to NPEs as a rising force
that innovating companies need to take into account.
As in the case of anti-competitive patenting strategies,
sound patent institutions can make a difference in con-
taining the possibly abusive behavior of NPEs that is
detrimental to innovation – as will be further discussed
in Section 2.3.54
2.2.4The role patents play in technology markets and open innovation strategies
Chapter 1 discussed the rise of so-called technology
markets, as reflected, for example, in more frequent pat-
ent licensing. At first, the existence of such markets may
seem surprising. Technologies are highly specialized and
non-standardized goods; matching sellers and buyers
can be difficult – not least because many firms keep
their technologies secret. Even where there is a match,
strategic behavior and high transaction costs can prevent
firms from entering into licensing contracts.55 What then
motivates firms to participate in technology markets and
why are they increasingly doing so?
Subsection 2.1.1 pointed to one important reason: tech-
nology markets allow firms to specialize. Firms may
be both more innovative and efficient by focusing on
selected research, development or manufacturing tasks
– outweighing the difficulties related to participating
in technology markets. In addition, so-called general
purpose technologies (GPTs) – technologies that find
application in a large number of product markets – are
often best developed by specialized firms who can sell
them to many downstream firms, thereby recovering
large upfront R&D outlays.56
51 See, for example, Geradin et al. (2011).
52 See, for example, Lemley and Shapiro (2007).
53 See Lerner (2010).
54 Some governments have also launched special
initiatives aimed at limiting the exposure of
innovating companies to NPE lawsuits. For example,
in 2010 the Korean government helped launch a
firm called Intellectual Discovery, which buys out
patents that might be asserted against Korean
firms. See “The Rise of the NPE” in Managing
Intellectual Property (Park and Hwang, 2010).
55 See, for example, Nelson and Winter
(1982), Teece (1988), Arora et al. (2001b)
and Arora and Gambardella (2010).
56 See Bresnahan and Gambardella (1998)
and Gambardella and McGahan (2010).
95
Chapter 2 the eConomiCs of intelleCtual property – old insights and new evidenCe
As discussed in Chapter 1, specialization is one important
element of open innovation strategies: firms license out
those technologies that are outside their core business;
and they license in technologies that amplify their com-
petitive advantage. Evidence confirms that firms that do
not have the complementary assets needed to bring their
inventions to market tend to license them to others for
commercialization.57 In addition, survey studies reveal that
licensing is one of the main reasons for seeking patents
in the US.58 In Europe, one in five companies licenses
patents to non-affiliated partners, while in Japan more
than one in four companies do so.59 Studies on GPTs,
in turn, have shown that licensing is more likely to occur
where downstream product markets are fragmented.60
There is also evidence that certain industries – notably,
the biotechnology, semiconductor and software sectors
– have seen an increase in specialized firms.61
Little is known, however, about the fundamental factors
that have driven greater specialization in more recent
history. One possible explanation is that smaller com-
panies with fewer bureaucratic structures may be bet-
ter positioned to find solutions to increasingly complex
technological problems. Another reason may be that
ICTs and new business models have made it easier for
specialized firms to participate in technology markets.
Subsection 1.3.3 described, for example, the entry of
new intermediaries with novel approaches to matching
technology sellers and buyers.
A second reason why firms participate in technology mar-
kets is to tap these markets for valuable knowledge. In-
house research is an essential element of innovation, but
firms advance their knowledge and draw inspiration from
the ideas of others. Economists have devised the concept
of knowledge spillovers to describe situations in which
knowledge flows from one firm or individual to another,
without the originator receiving any direct compensation.
From society’s viewpoint, knowledge spillovers are desir-
able, because they lead to the wide dissemination of new
ideas. However, if knowledge spills over to everyone as
soon as it is created, the classic appropriability dilemma
arises. A trade-off exists, for policymakers and firms.
Policymakers must balance incentives for creating knowl-
edge against the rapid diffusion of knowledge. The
patent system helps to strike this balance by granting
limited exclusive rights to inventors while, at the same
time, mandating the disclosure of information on inven-
tions to society. Inventor surveys reveal that published
patents are indeed an important knowledge source for
firms conducting R&D – more so in Japan than in the
US and Europe.62 No study has attempted to quantify
the associated knowledge spillovers and their economic
benefits. Such an exercise might indeed be elusive. Yet,
the patent literature represents a valuable source of
knowledge for creative minds anywhere in the world. In
addition, the easy availability of millions of patent docu-
ments to anyone connected to the Internet has arguably
created new catch-up opportunities for technologically
less developed economies.
Firms face a similar trade-off between guarding and
sharing knowledge. On the one hand, they need to earn
a return on their R&D investment, which calls for prevent-
ing knowledge from leaking to competitors. On the other
hand, absolute protection of ideas is not possible and,
more important, it may not even be desirable. Spillovers
are often a two-way street, involving give and take. For
example, economic research shows that innovating firms
have found it beneficial to collocate; being close to firms
operating in the same field brings learning benefits even
if it means sharing one’s own knowledge.63
57 Using the 1994 Carnegie Mellon survey on industrial
R&D in the US, Arora and Ceccagnoli (2006) found
that firms that do not have specialized complementary
assets for commercializing their inventions are more
likely to license out their inventions than those who do.
58 See Cohen et al. (2000) and Sichelman
and Graham (2010).
59 See Zuniga and Guellec (2009).
60 See Gambardella and Giarratana (2011)
and Arora and Gambardella (2010).
61 See Arora et al. (2001a), Hall and Ziedonis
(2001) and Harhoff et al. (2007).
62 See Nagaoka (2011) and Gambardella et al. (2011).
63 See Krugman (1991).

96
Chapter 2 the eConomiCs of intelleCtual property – old insights and new evidenCe
Generating spillovers is a second important element of
open innovation strategies: firms can be better innova-
tors by engaging with others – even if that involves some
sharing of proprietary knowledge. Indeed, patent rights
are at the heart of the trade-off between guarding and
sharing knowledge. They allow firms to flexibly control
which technologies to share, with whom and on what
terms. Economic research provides only limited guidance
on how different patent-based knowledge sharing activi-
ties – especially those associated with more recent open
innovation strategies – affect spillovers and innovation.
As described in Subsection 1.3.2, this is partly the result
of insufficient data; in particular, patent licenses are often
confidential and escape statistical measurement. Box 2.4
summarizes evidence on one open innovation initiative
in the area of green technologies, and finds systematic
differences between the technologies that firms are willing
to share and those they keep in-house.
Finally, a third important reason why firms participate in
technology markets and adopt open innovation strategies
is to access complementary skills and technologies. A
firm may find that it stands to gain by collaborating with
another firm or a university in developing a particular
technology. In other cases, a firm may require access
to proprietary technologies held by other firms in order
to commercialize a product – a frequent scenario in
technology fields in which patent thickets proliferate (see
Subsection 2.2.2). How technology markets operate
when firms cooperate with each other or with universities
will be discussed more fully in Chapters 3 and 4.
box 2.4: open Innovation and the eco-Patent Commons
Recognizing the need for promoting innovation and the diffusion of green technologies, in 2008 a number of multinational companies – including IBM, Sony and Nokia – created an “Eco-Patent Commons”. This initiative allows third parties royalty-free access to patented technologies, voluntarily pledged by firms from around the world. One key aim of the Commons is to encourage cooperation and collaboration between pledging firms and potential users to foster further joint innovation.
A recent study by Hall and Helmers (2011) analyzed the character-istics of the 238 patents pledged to the Commons. In particular, it compared patents pledged to: i) patents held by pledging firms that are not donated to the Commons; and ii) a randomly drawn set of patents in the same technology field.
Approximating patent value by indicators such as patent family size and patent citations received, the study finds that patents in the Com-mons are more valuable than the average patent held by pledging firms and than comparable patents protecting similar technologies. However, patents pledged do not seem to cover firms’ most radical inventions. In addition, they do not appear to be at the core of firms’ patent portfolios, possibly explaining their willingness to place them in the Commons. While these findings offer interesting insights into firms’ open innovation strategies, it is too early to assess how successful the Commons is at promoting further green innovation.
97
Chapter 2 the eConomiCs of intelleCtual property – old insights and new evidenCe
2.3Appreciating the role of patent institutions
Patent laws set the basic rules on what can be patented,
for how long and under what conditions. However, the
incentives created by the patent system are critically
dependent on how these rules are implemented. This
is largely the responsibility of patent offices and courts.
For a long time, economic research paid little attention
to these patent institutions. This, arguably, has changed
– partly because unprecedented levels of patenting have
put these institutions under considerable pressure.
This section seeks to highlight the important role played
by patent institutions. It first discusses the characteris-
tics of sound patent institutions. It then focuses on how
patenting trends over the past decades have challenged
many patent offices and what choices they face.
2.3.1What makes for sound patent institutions
Patent institutions best serve innovation when they
promote two broad principles: rigorous examination
leading to the grant of quality patents and balanced
dispute resolution.
Promoting the first principle has two important elements.
First, patent offices should grant patents only for those
inventions that strictly meet the standards of patentability
– namely, novelty, inventive step and industrial applica-
bility. This sounds straightforward, but for patent offices
it is not: the complexity of technology is constantly on
the rise and many entities in different parts of the world
create new knowledge that may be relevant prior art.
Second, patent documents should clearly delineate the
patent’s inventive claims and describe the invention in a
transparent way. Patents granted which meet both criteria
can be considered quality patents.64
The second principle recognizes that disputes over
patent rights invariably occur. But when they do, they
should be resolved in a way that balances the interests
of all parties involved. In particular, the parties should
have easy access to dispute resolution mechanisms, but
those mechanisms should minimize bad faith initiation of
disputes and remedies should be proportionate to any
damage suffered.
Why do these two principles matter? Poor-quality pat-
ents – including patents for trivial inventions or those with
overly broad or ambiguously drafted claims – can harm
innovation. At worst, they may lead firms to refrain from
certain research activities or from commercializing a new
technology for fear of violating patent rights; at best, they
burden innovating companies by leading to extra royalty
payments and legal costs.65 Poor-quality patents may also
increase the risk of anticompetitive uses of patent rights
(see Subsection 2.2.3). Vague descriptions of inventions
in patent documents, in turn, may curtail the spillover
benefits of patent disclosure.
64 Quality is here defined in terms of the rigor of
the examination process, not in terms of the
technical or commercial value of the invention.
65 See Choi (1998), Jaffe and Lerner (2004), Lemley
and Shapiro (2005) and Harhoff (2006).
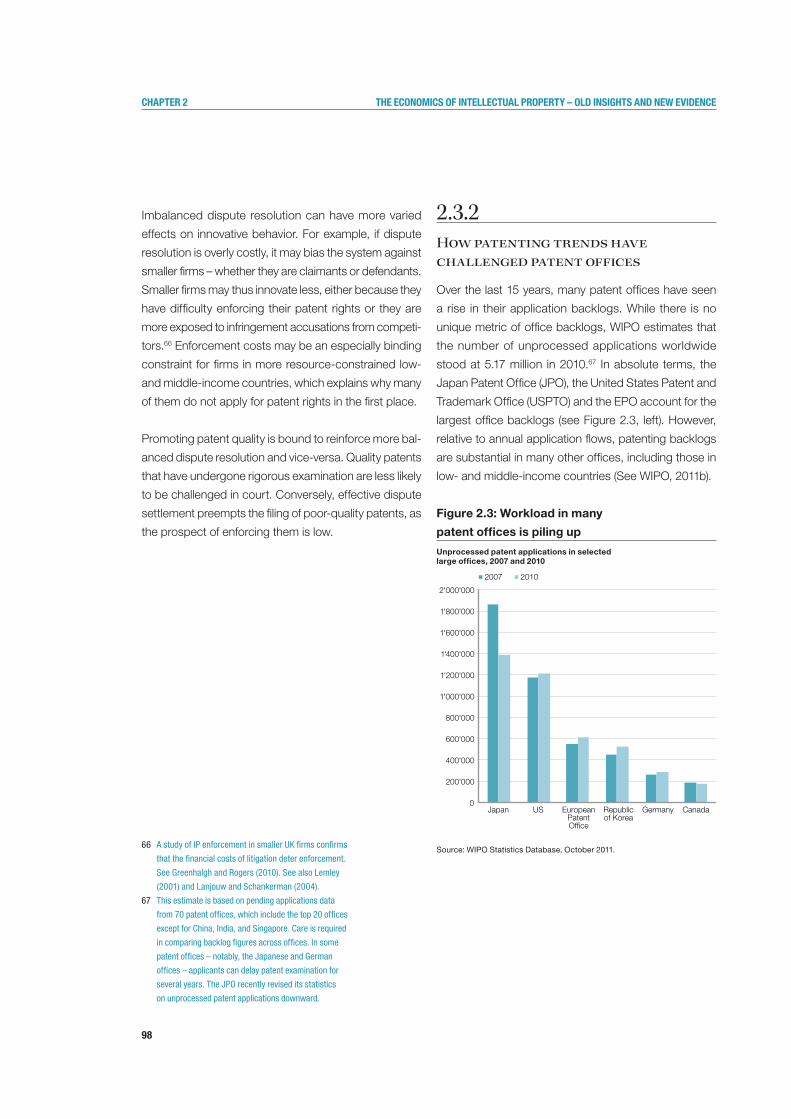
98
Chapter 2 the eConomiCs of intelleCtual property – old insights and new evidenCe
Imbalanced dispute resolution can have more varied
effects on innovative behavior. For example, if dispute
resolution is overly costly, it may bias the system against
smaller firms – whether they are claimants or defendants.
Smaller firms may thus innovate less, either because they
have difficulty enforcing their patent rights or they are
more exposed to infringement accusations from competi-
tors.66 Enforcement costs may be an especially binding
constraint for firms in more resource-constrained low-
and middle-income countries, which explains why many
of them do not apply for patent rights in the first place.
Promoting patent quality is bound to reinforce more bal-
anced dispute resolution and vice-versa. Quality patents
that have undergone rigorous examination are less likely
to be challenged in court. Conversely, effective dispute
settlement preempts the filing of poor-quality patents, as
the prospect of enforcing them is low.
2.3.2How patenting trends have challenged patent offices
Over the last 15 years, many patent offices have seen
a rise in their application backlogs. While there is no
unique metric of office backlogs, WIPO estimates that
the number of unprocessed applications worldwide
stood at 5.17 million in 2010.67 In absolute terms, the
Japan Patent Office (JPO), the United States Patent and
Trademark Office (USPTO) and the EPO account for the
largest office backlogs (see Figure 2.3, left). However,
relative to annual application flows, patenting backlogs
are substantial in many other offices, including those in
low- and middle-income countries (See WIPO, 2011b).
Figure 2.3: Workload in many
patent offices is piling up
Unprocessed patent applications in selected large offices, 2007 and 2010
Source: WIPO Statistics Database, October 2011.
0
200'000
400'000
600'000
800'000
1'000'000
1'200'000
1'400'000
1'600'000
1'800'000
2'000'000
Japan US EuropeanPatentOf�ce
Republicof Korea
Germany Canada
2007 2010
66 A study of IP enforcement in smaller UK firms confirms
that the financial costs of litigation deter enforcement.
See Greenhalgh and Rogers (2010). See also Lemley
(2001) and Lanjouw and Schankerman (2004).
67 This estimate is based on pending applications data
from 70 patent offices, which include the top 20 offices
except for China, India, and Singapore. Care is required
in comparing backlog figures across offices. In some
patent offices – notably, the Japanese and German
offices – applicants can delay patent examination for
several years. The JPO recently revised its statistics
on unprocessed patent applications downward.
99
Chapter 2 the eConomiCs of intelleCtual property – old insights and new evidenCe
Many offices have also seen a lengthening of patent
pendency times. For example, between 1996 and 2007,
average pendency times increased from 21.5 to 32
months at the USPTO and from 24.4 to 45.3 months
at the EPO.68
Rising office backlogs and lengthening pendency times
have coincided with rapid growth in the number of pat-
ent applications (see Subsection 1.3.1). However, fast
patenting growth is only one factor behind increased
office strain. Indeed, some offices have managed to
reduce backlogs and shorten pendency times despite
rapid patenting growth – mainly by expanding examina-
tion capacity.69
In addition, in those offices that have experienced grow-
ing backlogs and longer pendency times, other factors
have played a role, especially an increase in the size of
patent applications. At the EPO, for example, average
application size jumped from 14 to 30 pages between
1988 and 2005, while the average number of claims per
patent increased from 12 to 21.70 Growing technological
complexity appears to be one important driver of larger
patent applications.71 Examining more complex patents
takes longer – not least because patent examiners need
to learn about new technologies and the corresponding
legal rules. Such patents may also require more frequent
communication between applicants and examiners,
further prolonging examination.
What is the effect of longer pendency times? At least
some innovating companies are bound to suffer from
long delays in the patenting process. Subsection 2.2.1
discussed evidence that, for some entrepreneurs, the
grant of a patent makes a difference in attracting financ-
ing from venture capitalists, especially in early financing
stages. However, for more established firms, patenting
delays may be less problematic and could even be
beneficial. Indeed, many patent offices allow applicants
to request accelerated examination of patents, but few
applicants actually do so.72
Some firms – especially in industries with long product life
cycles and high uncertainty about market developments
– might welcome a longer patenting process to collect
more information about an invention’s technological and
commercial potential. Applicants can thus avoid paying
grant and renewal fee payments in case they decide to
drop the application. In addition, longer examination en-
ables applicants to submit new or amended patent claims
based on what they learn while developing an invention.
Even if some applicants gain, longer pendency times are
problematic for society as a whole, because they prolong
the period of uncertainty about which technologies may in
the future be proprietary. In addition, longer examination
may invite anticompetitive and rent-seeking behavior. In
particular, it creates incentives to file low-quality pat-
ents specifically intended to create uncertainty among
competitors. It may also encourage applicants to insert
claims that map onto the uses of technology they see
developing in the marketplace.
68 For the JPO, data are only available starting
in 2000, but the trend is the same: pendency
times increased from 26.9 months in 2000 to
32.4 months in 2007. As with backlog figures,
care is required in directly comparing pendency
times across offices. See WIPO (2011a).
69 See WIPO (2011a).
70 See van Zeebroeck et al. (2008) and
van Zeebroeck et al. (2009).
71 See Lanjouw and Schankerman (2001)
and van Zeebroeck et al. (2008).
72 To some extent, high costs and procedural
requirements may discourage the use
of accelerated examination.
100
Chapter 2 the eConomiCs of intelleCtual property – old insights and new evidenCe
Realizing their possible harmful effects, many patent offices
have sought to reduce pendency times. However, this is
not always easy. Offices only partly control the length of ex-
amination. Applicants decide how to draft applications and
how they communicate with offices.73 To the extent that they
benefit from longer examination – whatever the underlying
reasons may be – applicants may seek to strategically delay
the process; for example, they may introduce ambiguities
in patent claims that prompt future examiner enquiries.74
In addition, confronted with large, growing backlogs,
patent offices face the risk that quicker examination may
compromise patent quality. Numerous commentators
have argued that the pressure created by rising workloads
has caused deteriorating patent quality in some offices,
especially in the US.75 Indeed, improving the quality of
patents granted was a key objective behind the patent
reform legislation recently enacted in the US.76 More
generally, given the difficulty of objectively measuring
patent quality, it is hard to empirically assess how sys-
temic quality problems are and how quality differs across
offices. Finally, how backlogs affect patent quality is not
only important in high-income countries. As pointed out
above, many offices in low- and middle-income countries
have accumulated substantial backlogs in recent years.
They also typically have fewer resources to support
thorough examination, increasing the risk of granting
low-quality patents.77
2.3.3The choices patent institutions face
The choices facing patent institutions determine how
the system promotes the principles of patent quality and
balanced dispute resolution. What may seem like a minor
change in procedural rules or a management response
to operational demands may have far-reaching conse-
quences for patent system use. Relevant institutional
choices are often specific to countries’ legal systems
and their level of development. However, a number of
common choices exist. This final subsection points to
some of the most important ones.
First, to ensure quality examination, patent offices need
to be properly resourced. This raises the question of how
their operations should be funded. The two prevailing
models are: financing them out of general government
spending; or through the fees they collect. Difficult trade-
offs exist. Fee-based financing can establish incentives
for operational efficiency and insulates patent offices from
the ups and downs of public budgets. However, patent
offices that seek to maximize fee income may adjust
their operations in a way that conflicts with society’s best
interest. Above all, quickly processing patent applications
may maximize fee revenue, but that might come at the
expense of patent quality. In fee-financed offices, it is
therefore important to establish complementary perfor-
mance incentives that promote patent quality.
A closely related second institutional choice concerns the
level and structure of patenting fees. While fees charged
by offices are only one – and usually a small – component
of the legal costs applicants face, studies have clearly
shown that higher fees lead to lower patenting activity.78
Fees are thus an important regulatory instrument. As a
rule of thumb, fees should be sufficiently low to ensure
equitable access to the system, but not so low as to
encourage speculative applications.
73 For example, van Zeebroeck et al. (2008) argue that countries
that follow US drafting styles tend to have more voluminous
patent applications compared to filings at the EPO.
74 Mejer and van Pottelsberghe de la Potterie (2011)
conjecture that applicants who delay the patenting
process are the root cause of backlogs at the EPO.
75 See, for example, Jaffe and Lerner (2004) and Guellec
and van Pottelsberghe de la Potterie (2007).
76 See the statement of USPTO Director David Kappos before
the US House of Representatives, available at www.uspto.gov/news/speeches/2011/kappos_house_testimony.jsp.
77 Sampat (2010) discusses how resource constraints might
have affected pharmaceutical patents granted in India.
78 Using a panel dataset, Rassenfosse and van Pottelsberghe
de la Potterie (2011) estimate a demand elasticity for patents
of -0.3, implying that a 10 percent increase in the patenting
fee leads to a 3 percent fall in patent volumes.
101
Chapter 2 the eConomiCs of intelleCtual property – old insights and new evidenCe
One dilemma in establishing a fee policy is that it can only
serve one purpose. In particular, a set of fees that ensures
office cost recovery may not coincide with society’s best
interest – and vice-versa. For example, cost recovery
would call for high filing fees to support labor-intensive
examination work and low fees for renewing patents that
involve very little work for offices. However, low renewal
fees may not be in society’s best interest, as they prolong
protection for patents inventors no longer highly value.79
In fact, for the latter reason, economists have argued for
an escalating renewal fee structure.80
A third important institutional choice concerns the inter-
ests of third parties in the patenting process. Third parties
may provide useful information on relevant prior art that
bears on the patentability of an invention. In addition,
if the grant of a patent affects them, they may want to
challenge its validity before it leaves the patent office,
preempting more expensive court litigation down the
road. Many patent offices have therefore adopted mecha-
nisms allowing for third party information submission
and patent opposition (see Box 2.5 for one example).81
Such mechanisms can usefully promote patent quality.82
However, building on the principle of balanced dispute
resolution, they should be designed in such a way that
they open the door to legitimate third party interests,
but minimize the risk of bad faith challenges that unduly
burden patent applicants.
Strategic use of ICTs by patent offices is an increasingly
important fourth institutional choice. Most patent office
operations consist of the processing of information.
Modern ICTs can not only improve operational efficiency,
but also promote patent quality. This is especially the
case for prior art searches. Digital access to patent
and non-patent literature, combined with sophisticated
search algorithms – and, increasingly, automated trans-
lation – can reduce the risk that examiners might miss
important prior art.83 In addition, the timely provision of
patent information in digital form enlarges the potential for
knowledge spillovers, as discussed in Subsection 2.2.4.
79 Gans et al. (2004) provide a theoretical
exposition of this argument.
80 See Schankerman and Pakes (1986), Lanjouw,
Pakes and Putnam (1998), Scotchmer (1999)
and Cornelli and Schankerman (1999).
81 See WIPO (2009) for an overview of the patent
opposition system and a summary of some countries’
laws and practices. Rotstein and Dent (2009)
and Graham et al. (2003) compare the third party
opposition systems of the EPO, USPTO and JPO.
82 Hall et al. (2004), for example, discuss the
quality benefits of post-grant opposition.
83 Michels and Bertels (2001) show significant
differences in the results of prior art
searches across the major offices, partly
attributable to language barriers.
box 2.5: Crowd-sourcing patent examination
No matter how qualified and dedicated patent examiners are, they may miss out on important prior art. For example, there are instances where the state of the art progresses at a faster pace than examiners can match. In addition, examiners may only have incomplete access to non-patented prior art, especially in new areas of patenting. In such cases, it is useful to enlist the help of the public to identify information related to inventions under review. A new crowd-sourcing initiative – called Peer-to-Patent – makes use of social networking software to assist patent offices in their examination work.
The original Peer-to-Patent initiative – launched by the New York Law School and the USPTO as a pilot program in June 2007 – focused on using members of the open source community to help identify relevant prior art in the areas of computer architecture, software and information security. Community members were able to review and rate documents they considered important in determining the patentability of particular inventions. Patent examiners could later use these documents in examination if they were deemed relevant. A review of the pilot program was positive, and the project has now been extended to cover subject areas beyond the initial three technology areas.
Given the success of the pilot program in the US, patent offices in Australia, Japan, the Republic of Korea and the United Kingdom (UK) have each launched similar initiatives to assess the feasibility of this mechanism in their countries.
Source: Wong and Kreps (2009).
102
Chapter 2 the eConomiCs of intelleCtual property – old insights and new evidenCe
A fifth important institutional choice concerns international
cooperation. As noted in Subsection 1.3.1, around one-
half of the increase in patent filings worldwide from 1995
to 2007 was due to subsequent patent filings, most of
which represented international filings. In practice, this
means that national patent offices increasingly look at
the same patents. International cooperation – as already
practiced through the Patent Cooperation Treaty (PCT)
– can help in reducing duplication of work. In addition,
combining the resources of more than one office can
help promote patent quality.
International cooperation can take place at different levels
of ambition – from the simple exchange of information to
the recognition of foreign grant decisions. In between,
there are many options. Deciding on the appropriate level
of cooperation involves many considerations – including
how offices trust the work of their foreign counterparts,
how compatible domestic patenting standards are with
those abroad, how cooperation affects filing behavior
and office workload, and the learning benefits that may
be lost by not examining patents domestically.
Finally, one of the most challenging choices is the design
of enforcement institutions. Litigation is invariably a costly
activity – for litigants and courts. Balanced and timely
dispute resolution requires substantial resources and
skilled judges. Specialized patent courts can improve ef-
ficiency and promote consistent rulings, but they may not
be an option in smaller and less developed economies.
Institutional innovation that provides for alternative dispute
resolution short of outright litigation may be helpful in
preempting costly litigation. For example, some patent
offices offer administrative dispute resolution, mediation
or advice on questions of patent validity and infringement
– including some offices in middle-income countries.84
Patent opposition – as outlined above – is another form
of early dispute resolution.
There are other important considerations in designing
enforcement institutions – for example, whether judges
should decide on patent infringement and validity at the
same time or in separate cases, and how courts should
be financed. No comparative research exists that offers
general guidance on which approaches work best. A
better understanding of enforcement institutions and
their effects on patenting behavior are, arguably, priority
areas for future research.
84 The UK Intellectual Property Office offers a
patent validity search service that provides firms
with information on whether a patent granted is
vulnerable to legal challenge see www.ipo.gov.uk/types/patent/p-other/p-infringe/p-validity.htm.
103
Chapter 2 the eConomiCs of intelleCtual property – old insights and new evidenCe
2.4Conclusions and directions for future research
Understanding how IP protection affects innovative
behavior has been a fertile field in economic research.
Important insights gained long ago arguably still shape
how economists view the IP system today. Above all,
compared to other innovation policies, IP protection
stands out in that it mobilizes decentralized market forces
to guide R&D investment. This works especially well
where private motivation to innovate aligns with society’s
technological needs, where solutions to technological
problems are within sight, and where firms can finance
upfront R&D investment.
However, difficult trade-offs exist in designing IP rights,
not least because IP protection has multifaceted effects
on innovative behavior and market competition. As tech-
nologies advance and business models shift, optimally
balancing these trade-offs represents a continual high-
stakes challenge.
In more recent history, economists have refined their view
of the IP system – partly as a result of new research and
partly due to real world developments. The patent sys-
tem has received special attention, in at least two ways:
• Thebuild-upofstrategicpatentingportfoliosincom-
plex technologies has raised concerns about patent
rights slowing or even forestalling cumulative innova-
tion processes. Entrepreneurs facing dense webs of
overlapping patent rights – or patent thickets – may
forgo research activities or shelve plans for commer-
cializing promising technologies.
• Patentsplayanimportantroleinmoderntechnology
markets. They enable firms to specialize, allowing
them to be more innovative and efficient at the same
time. In addition, they allow firms to flexibly control
which knowledge to guard and which to share so as
to maximize knowledge spillovers – a key element of
open innovation strategies. Finally, the widespread
availability of patent information has created vast op-
portunities for technological learning and catch-up by
less developed economies.
The effectiveness of the patent system in promoting
innovation is critically dependent on how the rules set
by laws are implemented in practice. Patent institutions
have moved to the center stage of the modern innovation
system. They perform the essential tasks of ensuring
the quality of patents granted and providing balanced
dispute resolution. Unprecedented levels of patenting
in many high- and middle-income countries have put
these institutions under considerable pressure. The
choices they make have far-reaching consequences on
incentives to innovate.
104
Chapter 2 the eConomiCs of intelleCtual property – old insights and new evidenCe
Areas for future research
Even though economic research has come a long way
since the galvanizing work by Kenneth Arrow some 50
years ago, there are many questions for which future
research could offer better guidance to policymakers:
• Mostacademicstudieshavefocusedonhigh-income
countries. While they can in many ways inform policy-
makers throughout the world, the varying innovative
and absorptive capacity of middle- and low-income
countries suggests that IP protection operates dif-
ferently in these economies. A better understanding
of the conditions under which different IP forms can
incentivize R&D and promote the formation of technol-
ogy markets is therefore crucial.
• Onlylimitedguidanceisavailableonhowthedifferent
patent-based knowledge sharing activities – especially
those associated with more recent open innovation
models – affect knowledge spillovers and innovation
outcomes. A related question concerns the extent
to which greater openness in the innovation process
has created greater opportunities for technological
catch-up by firms in less developed economies.
• Furtherresearchisneededonhowthechoicesofpat-
ent institutions affect innovation incentives, especially
in the area of rights enforcement.

105
Chapter 2 the eConomiCs of intelleCtual property – old insights and new evidenCe
ReFeRencesAbbott, F.M., Cottier, T. & Gurry, F. (2007). International Intellectual Property in an Integrated World Economy. Nashua: The Book Cellar, LLC.
Aghion, P., Bloom, N., Blundell, R., Griffith, R. & Howitt, P. (2005). Competition and Innovation: An Inverted-U Relationship. Quarterly Journal of Economics, 120(2), 701-728.
Alchian, A.A. & Demsetz, H. (1972). Production, Information Costs, and Economic Organization. The American Economic Review, 62(5), 777-795.
Arora, A. & Ceccagnoli, M. (2006). Patent Protection, Complementary Assets, and Firms' Incentives for Technology Licensing. Management Science, 52(2), 293-308.
Arora, A., Ceccagnoli, M. & Cohen, W.M. (2008). R&D and the Patent Premium. International Journal of Industrial Organization, 26(5), 1153-1179.
Arora, A., Fosfuri, A. & Gambardella, A. (2001a). Markets for Technology and Their Implications for Corporate Strategy. Industrial and Corporate Change, 10(2), 419-451.
Arora, A., Fosfuri, A. & Gambardella, A. (2001b). Markets for Technology: Economics of Innovation and Corporate Strategy. Cambridge, MA: MIT Press.
Arora, A. & Gambardella, A. (2010). Ideas for Rent: An Overview of Markets for Technology. Industrial and Corporate Change, 19(3), 775-803.
Arrow, K. (1962). Economic Welfare and the Allocation of Resources for Invention. In R.R. Nelson (Ed.), The Rate and Direction of Inventive Activity: Economic and Social Factors. Princeton, NJ: Princeton University Press, 609-626.
Arrow, K. (1971). Essays in the Theory of Risk-Bearing. Chicago: Markham Publishing Company.
Benavente, J.M. (2011). The Economics of IP in the Context of a Middle Income Country. Unpublished manuscript. Geneva: World Intellectual Property Organization.
Bresnahan, T.F. & Gambardella, A. (1998). The Division of Inventive Labor and the Extent of the Market. In E. Helpman (Ed.), General Purpose Technologies and Economic Growth. Cambridge, MA: MIT Press, 253-282.
Brouwer, E. & Kleinknecht, A. (1999). Innovative Output, and a Firm's Propensity to Patent.: An Exploration of CIS Micro Data. Research Policy, 28(6), 615-624.
Choi, J.P. (1998). Patent Litigation as an Information-Transmission Mechanism. The American Economic Review, 88(5), 1249-1263.
Coase, R.H. (1937). The Nature of the Firm. Economica, 4(16), 386-405.
Cockburn, I.M. & MacGarvie, M.J. (2009). Patents, Thickets and the Financing of Early-stage Firms: Evidence from the Software Industry. Journal of Economics and Management Strategy, 18(3), 729-773.
Cockburn, I.M., MacGarvie, M.J. & Müller, E. (2010). Patent Thickets, Licensing and Innovative Performance. Industrial and Corporate Change, 19(3), 899-925.
Cohen, W.M., Goto, A., Nagata, A., Nelson, R.R. & Walsh, J.P. (2002). R&D Spillovers, Patents and the Incentives to Innovate in Japan and the United States. Research Policy, 31(8-9), 1349-1367.
Cohen, W.M. & Levinthal, D.A. (1989). Innovation and Learning: The Two Faces of R&D. The Economic Journal, 99, 569-596.
Cohen, W.M. & Levinthal, D.A. (1990). Absorptive Capacity: A New Perspective on Learning and Innovation. Administrative Science Quarterly, Special Issue: Technology, Organizations, and Innovation, 35(1), 128-152.
Cohen, W.M., Nelson, R.R. & Walsh, J.P. (2000). Protecting Their Intellectual Assets: Appropriability Conditions and Why U.S. Manufacturing Firms Patent (or Not). National Bureau of Economic Research Working Paper, No. 7552.
Cornelli, F. & Schankerman, M. (1999). Patent Renewals and R&D Incentives. The RAND Journal of Economics, 30(2), 197-213.
David, P.A. (1993). Knowledge, Property and the System Dynamics of Technological Change. Paper presented at the Proceedings of the World Bank Annual Conference on Development Economics, 1992.
Dushnitski, G. & Klueter, T. (2011). Is There an eBay for Ideas? Insights from Online Knowledge Marketplaces. European Management Review, 8(1), 17-32.
Eisenberg, R.S. (1996). Intellectual Property Issues in Genomics. Trends in Biotechnology, 14(8), 302-307.
Fink, C., Smarzynska Javorcik, B. & Spatareanu, M. (2005). Income-Related Biases in International Trade: What Do Trademark Registration Data Tell Us? Review of World Economics, 141(1), 79-103.
Gambardella, A. & Giarratana, M.S. (2011). General Technological Capabilities, Product Market Fragmentation, and Markets for Technology: Evidence from the Software Security Industry. Bocconi University Working Paper.
Gambardella, A., Harhoff, D. & Nagaoka, S. (2011). The Social Value of Patent Disclosure. Unpublished manuscript. Munich: Ludwig-Maximilians Universität.
Gambardella, A. & McGahan, A.M. (2010). Business-model Innovation: General Purpose Technologies and Their Implications for Industry Structure. Long Range Planning, 43(2-3), 262-271.
Gans, J.S., King, S.P. & Lampe, R. (2004). Patent Renewal Fees and Self-funding Patent Offices. Topics in Theoretical Economics, 4(1).
Geradin, D., Layne-Farrar, A. & Padilla, A.J. (2011). Elves or Trolls? The Role of Nonpracticing Patent Owners in the Innovation Economy. Industrial and Corporate Change, forthcoming.
Gilbert, R. & Shapiro, C. (1990). Optimal Patent Length and Breadth. The RAND Journal of Economics, 21(1), 106-112.
Gilbert, R.J. & Newbery, D. (1982). Preemptive Patenting and the Persistence of Monopoly. American Economic Review, 72, 514-526.
Giuri, P., Mariani, M., Brusoni, S., Crespi, G., Francoz, D., Gambardella et al. (2007). Inventors and Invention Processes in Europe: Results from the PatVal-EUSurvey.Research Policy, 36(8), 1107-1127.
Graham, S., Hall, B., Harhoff, D. & Mowery, D. (2003). Patent Quality Control: A Comparison of U.S. Patent Re-examination and European Patent Oppositions. In W.M. Cohen & S.A. Merrill (Eds.), Patents in the Knowledge-Based Economy(Vol.74-119).Washington,D.C.:NationalAcademyofSciences, 74-119.
Graham, S. & Sichelman, T. (2008). Why Do Start-ups Patent? Berkeley Technology Law Journal, 23(1), 1071-1090.
Graham, S.J.H., Merges, R.P., Samuelson, P. & Sichelman, T. (2009). Entrepreneurs and the Patent System. Berkeley Technology Law Journal, 24(4), 1258-1328.
Granstrand, O. (1999). The Economics and Management of Intellectual Property. Cheltenham: Edward Elgar Publishing Limited.
Granstrand, O. (2011). The Economics of IP in the Context of a Shifting Innovation Paradigm. Unpublished manuscript. Geneva: World Intellectual Property Organization.
Green, J. & Scotchmer, S. (1995). On the Division of Profit in Sequential Innovation. The RAND Journal of Economics, 26, 20-33.
Greenberg, G. (2010). Small Firms, Big Patents? Estimating Patent Value Using Data on Israeli Start-ups Financing Rounds. Paper presented at the 4th Israeli Strategy Conference.
Greenhalgh, C. & Rogers, M. (2010). Innovation, Intellectual Property and Economic Growth. Princeton and Oxford: Princeton University Press.
Guellec, D. & van Pottelsberghe de la Potterie, B. (2007). The Economics of the European Patent System: IP Policy for Innovation and Competition. Oxford: Oxford University Press.
Hall, B.H. (2009). The Use and Value of IP Rights. Paper presented at the UK IPMinisterialForumontheEconomicValueofIntellectualProperty.
Hall, B.H., Graham, S., Harhoff, D. & Mowery, D. (2004). Prospects for Improving U.S. Patent Quality via Postgrant Opposition. In A.B. Jaffe, J. Lerner & S. Stern (Eds.), Innovation Policy and the Economy(Vol.4).Cambridge, MA: MIT Press, 115-144.
Hall, B.H. & Helmers, C. (2011). Innovation and Diffusion of Clean/Green Technology: Can Patent Commons Help? National Bureau of Economic Research Working Paper Series, No. w16920.
106
Chapter 2 the eConomiCs of intelleCtual property – old insights and new evidenCe
Hall, B.H. & Lerner, J. (2010). The Financing of R&D and Innovation. In B.H. Hall & N. Rosenberg (Eds.), Handbook of the Economics of Innovation. Amsterdam: Elsevier-North Holland.
Hall, B.H., & Ziedonis, R.H. (2001). The Patent Paradox Revisited: An Empirical Study of Patenting in the U.S. Semiconductor Industry, 1979-1995. The RAND Journal of Economics, 32(1), 101-128.
Harabi, N. (1995). Appropriability of Technical Innovations: An Empirical Analysis. Research Policy, 24(6), 981-992.
Harhoff, D. (2006). Patent Quantity and Quality: Trends and Policy Implications. In B. Kahin & D. Foray (Eds.), Advancing Knowledge and the Knowledge Economy. Cambridge and London: MIT Press, 331-350.
Harhoff, D. (2009). The Role of Patents and Licenses in Securing External Finance for Innovation. European Investment Bank Papers, 14(2), 74-96.
Harhoff, D., Hall, B.H., von Graevenitz, G., Hoisl, K. & Wagner, S. (2007). The Strategic Use of Patents and Its Implications for Enterprise and Competition Policies. Report Commissioned by European Commission (Tender ENTR/05/82). Brussels: European Commission.
Heller, M. & Eisenberg, R. (1998). Can Patents Deter Innovation? The Anticommons in Biomedical Research. Science, 280, 698-701.
Hsu, D. & Ziedonis, R.H. (2008). Patents as Quality Signals for Entrepreneurial Ventures. Unpublished manuscript.
Jaffe, A.B. (2000). The US Patent System in Transition: Policy Innovation and the Innovation Process. Research Policy, 29(4-5), 531-557.
Jaffe, A.B. & Lerner, J. (2004). Innovation and Its Discontents: How Our Broken Patent System is Endangering Innovation and Progress, and What to Do about It. Princeton: Princeton University Press.
Kanwar, S. & Evenson, R.E. (2003). Does Intellectual Property Protection Spur Technical Change? Oxford Economic Papers, 55, 235-264.
Kim, L. (1997). Imitation to Innovation: The Dynamics of Korea's Technological Learning. Boston: Harvard Business Press.
Krugman, P. (1991). Increasing Returns and Economic Geography. Journal of Political Economy, 99(3), 483-499.
Kyle, M. & McGahan, A.M. (2011). Investments in Pharmaceuticals before and after TRIPS. Review of Economics and Statistics, forthcoming.
Lall, S. (2003). Indicators of the Relative Importance of IPRs in Developing Countries. Research Policy, 32(9), 1657-1680.
Lanjouw, J.O., Pakes, A. & Putnam, J. (1998). How to Count Patents and ValueIntellectualProperty:TheUsesofPatentRenewalandApplicationData. The Journal of Industrial Economics, 46(4), 405-432.
Lanjouw, J.O. & Schankerman, M. (2001). Characteristics of Patent Litigation: A Window on Competition. The RAND Journal of Economics, 32(1), 129-151.
Lanjouw, J.O. & Schankerman, M. (2004). Protecting Intellectual Property Rights: Are Small Firms Handicapped? The Journal of Law and Economics, 47(1), 45-74.
Lee, K. (2010). Intellectual Property Rights and Innovation in Economic Development in Korea. Paper presented at the KDI International Conference on Intellectual Property for Economic Development: Issues and Policy Implications.
Lee, K. & Kim, Y.-K. (2010). IPR and Technological Catch-up in Korea. In H. Odagiri, A. Goto, A. Sunami & R.R. Nelson (Eds.), Intellectual Property Rights, Development, and Catch Up: An International Comparative Study. Oxford: Oxford University Press.
Lemley, M.A. (2000).ReconceivingPatentsintheAgeofVentureCapital.Journal of Small and Emerging Business Law, 4(1), 137-148.
Lemley, M.A. (2001). Rational Ignorance at the Patent Office. Northwestern University Law Review, 95, 1495.
Lemley, M.A. & Burk, D.L. (2003). Policy Levers in Patent Law. Virginia Law Review, 89, 1575.
Lemley, M.A. & Shapiro, C. (2005). Probabilistic Patents. Journal of Economic Perspectives, 19(2), 75-98.
Lemley, M.A. & Shapiro, C. (2007). Patent Holdup and Royalty Stacking. Texas Law Review, 85.
Lerner, J. (2010). The Litigation of Financial Innovations. Journal of Law and Economics, 53(4), 807-831.
Lerner, J. & Tirole, J. (2005). The Economics of Technology Sharing: Open Source and Beyond. The Journal of Economic Perspectives, 19(2), 99-120.
Lerner, J. & Zhu, F. (2007). What is the Impact of Software Patent Shift? Evidence from Lotus v. Borland. International Journal of Industrial Organization, 25(3), 511-529.
Levin, R.C., Klevorick, A.K., Nelson, R.R., Winter, S.G., Gilbert, R. & Griliches, Z. (1987). Appropriating the Returns from Industrial Research and Development. Brookings Papers on Economic Activity, 1987(3), 783-831.
Love, J. & Hubbard, T. (2009). Prizes for Innovation of New Medicines and Vaccines.Annals of Health Law, 18(2), 155-186.
Mansfield, E. (1986). Patents and Innovation: An Empirical Study. Management Science, 32(2), 173-181.
Mejer, M. & van Pottelsberghe de la Potterie, B. (2011). Patent Backlogs at UPSTO and EPO: Systemic Failure vs Deliberate Delays. World Patent Information, 33(2), 122-127.
Michel, J. & Bettels, B. (2001). Patent Citation Analysis – A Closer Look at the Basic Input Data from Patent Search Reports. Scientometrics, 21(1), 185-201.
Moser, P. (2005). How Do Patent Laws Influence Innovation? Evidence from Nineteenth-Century World's Fairs. American Economic Review, 95(4), 1214-1236.
Murray, F. & Stern, S. (2006). When Ideas Are Not Free: The Impact of Patents on Scientific Research. Innovation Policy and the Economy, 7, 33–69.
Murray, F. & Stern, S. (2007). Do Formal Intellectual Property Rights Hinder the Free Flow of Scientific Knowledge?: An Empirical Test of the Anti-commons Hypothesis. Journal of Economic Behavior & Organization, 63(4), 648-687.
Nagaoka, S. (2011). Assessing the Basic Roles of the Patent System in Incentivizing Innovation: Some Evidence from Inventor Surveys in Japan and in the US. Unpublished manuscript. Geneva: World Intellectual Property Organization.
Nagaoka, S. & Walsh, J. (2008). The Objectives, the Process and the Performance of R&D Projects in the US and Japan: Major Findings from the RIETI-Georgia Tech Inventor Survey. RIETI Discussion Paper.
Nelson, R.R. (Ed.) (1993). National Innovation Systems: A Comparative Analysis.NewYork:OxfordUniversityPress.
Nelson, R.R. & Winter, S.G. (1982). An Evolutionary Theory of Economic Change. Cambridge, Massachusetts and London: Belknap Press of Harvard University Press.
Nicholson, C.V. (2011). Apple and Microsoft Beat Google for Nortel Patents. The New York Times. Retrieved from http://dealbook.nytimes.com/2011/07/01/apple-and-microsoft-beat-google-for-nortel-patents/
Noel, M. & Schankerman, M. (2006) Strategic Patenting and Software Innovation.Vol.740.Centre for Economic Performance Discussion Paper. London: London School of Economics and Political Science.
Nordhaus, W. (1969). Invention, Growth, and Welfare: A Theoretical Treatment of Technological Change. Cambridge: MIT Press.
O'Donoghue, T., Scotchmer, S. & Thisse, J.-F. (1998). Patent Breadth, Patent Life, and the Pace of Technological Progress. Journal of Economics & Management Strategy, 7(1), 1-32.
Pakes, A. (1986).PatentsasOptions:SomeEstimatesoftheValueofHolding European Patent Stocks. Econometrica, 54(4), 755-784.
Park, G.S. Hwang, S.D. (2010). The Rise of the NPE. Managing Intellectual Property. Retrieved from www.managingip.com/Article/2740039/The-rise-of-the-NPE.html

107
Chapter 2 the eConomiCs of intelleCtual property – old insights and new evidenCe
Park, W. & Ginarte, J.C. (1997). Intellectual Property Rights and Economic Growth. Contemporary Economic Policy, 15, 51-61.
Qian, Y. (2007). Do National Patent Laws Stimulate Domestic Innovation in a Global Patenting Environment? A Cross-country Analysis of Pharmaceutical Patent Protection, 1978-2002. Review of Economics and Statistics, 89(3).
de Rassenfosse, G. & van Pottelsberghe de la Potterie, B. (2011). On the Price Elasticity of Demand for Patents. Oxford Bulletin of Economics and Statistics, forthcoming.
Rotstein, F. & Dent, C. (2009). Third-Party Patent Challenges in Europe, the United States and Australia: A Comparative Analysis. The Journal of World Intellectual Property, 12(5), 467-500.
Sakakibara, M. & Branstetter, L. (2001). Do Stronger Patents Induce More Innovation? Evidence from 1988 Japanese Patent Law Reforms. The RAND Journal of Economics, 32(1), 77-100.
Sampat, B.N. (2010). Institutional Innovation or Institutional Imitation? The Impacts of TRIPS on India's Patent Law and Practice. Paper presented at the WIPO Seminar Series on "The Economics of Intellectual Property" on December 13, 2010.
Schankerman, M. (1998).HowValuableisPatentProtection?EstimatesbyTechnology Field. The RAND Journal of Economics, 29(1), 77-107.
Schankerman, M. & Pakes, A. (1986).EstimatesoftheValueofPatentRights in European Countries during the Post-1950 Period. The Economic Journal, 96(384), 1052-1076.
Schumpeter, J. (1937). Preface to to the Japanese Edition. Theorie der Wirtschaftlichen Entwicklung.ReprintedinR.V.Clemence(Ed.),Essays on Entrepreneurs, Innovations, Business Cycles and the Evolution of Capitalism. New Brunswick, N.J.: Transaction Publishers (1989), 165-168.
Schumpeter, J. (1943). Capitalism, Socialism and Democracy. New York:Harper.
Scotchmer, S. (1991). Standing on the Shoulders of Giants: Cumulative Research and the Patent Law. The Journal of Economic Perspectives, 5(1), 29-41.
Scotchmer, S. (1996). Protecting Early Innovators: Should Second-generation Products be Patentable? The RAND Journal of Economics, 27(2), 322-331.
Scotchmer, S. (1999). On the Optimality of the Patent Renewal System. The RAND Journal of Economics, 30, 181-196.
Scotchmer, S. (2004). Innovation and Incentives. Cambridge: MIT Press.
Shapiro, C. (2001). Navigating the Patent Thicket: Cross Licenses, Patent Pools, and Standard Setting. Innovation Policy and the Economy, 1(119-150).
Sichelman, T. & Graham, S. (2010). Patenting by Entrepreneurs: An Empirical Study. Michigan Telecommunications and Technology Law Review, 17, 111-180.
Smith, A. (1776). An Inquiry into the Nature and Causes of the Wealth of Nations. London: W. Strahan and T. Cadell.
Sussex, J., Towse, A. & Devlin, N. (2011).OperationalisingValueBasedPricing of Medicines: A Taxonomy of Approaches. OHE Research Paper.
Suthersanen, U. (2006). Utility Models and Innovation in Developing Countries. Geneva: ICTSD-UNCTAD.
Teece, D.J. (1986). Profiting from Technological Innovation: Implications for Integration, Collaboration, Licensing and Public Policy. Research Policy, 15(6), 285-305.
Teece, D.J. (1988). Technological Change and the Nature of the Firm. In G. Dosi, C. Freeman, R.R. Nelson, G. Silverberg & L. Soete (Eds.), Technical Change and Economic Theory. London: Pinter, 256-281.
Thursby, J. & Thursby, M. (2006). Where is the New Science in Corporate R&D? Science, 314(5805), 1547-1548.
Thursby, J. & Thursby, M. (2011). Protection of Intellectual Property and R&D Location. Unpublished manuscript. Geneva: World Intellectual Property Organization.
Thursby, M. & Thursby, J. (2006) Here or There? A Survey on the Factors in Multinational R&D Location. Report to the Government-University-Industry Research Roundtable. Washington, D.C.: National Academies Press.
Tullock, G. (Ed.) (1987)NewPalgraveDictionaryofEconomics(Vol.4).
van Zeebroeck, N., Stevnsborg, N., van Pottelsberghe de la Potterie, B., Guellec, D. & Archontopolos, E. (2008). Patent Inflation in Europe. World Patent Information, 30, 43-52.
van Zeebroeck, N., van Pottelsberghe de la Potterie, B. & Guellec, D. (2009).ClaimingMore:theIncreasedVoluminosityofPatentApplicationsand its Determinants. Research Policy, 38(6), 1006-1020.
Verbeure, B., van Zimmeren, E., Matthijs, G. & Van Overwalle, G. (2006). Patent Pools and Diagnostic Testing. Trends in Biotechnology, 24(3), 115-120.
Williamson, O.E. (1981). The Modern Corporation: Origins, Evolution, Attributes. Journal of Economic Literature, 19(4), 1537-1568.
WIPO (2009). Opposition Systems. SCP/14/5. Document prepared for the Standing Committee on the Law of Patents (SCP), Fourteenth Session, January 25 to 29, 2010. Geneva: World Intellectual Property Organization.
WIPO (2011a). The Surge in Worldwide Patent Applications. PCT/WG/4/4. Study prepared for the Patent Cooperation Treaty (PCT) Working Group. Geneva: World Intellectual Property Organization.
WIPO (2011b, forthcoming). World Intellectual Property Indicators. Geneva: World Intellectual Property Organization.
Wong, C. & Kreps, J. (2009). Collaborative Approach: Peer-to-Patent and the Open Source Movement. International Free and Open Source Software Law Review, 1(1), 15-26.
World Bank. (2001). Intellectual Property: Balancing Incentives with Competitive Access. Global Economic Prospects. Washington, D.C.: World Bank, 129-150.
Yu, T.F.-L. (1998). Adaptive Entrepreneurship and the Economic Development of Hong Kong. World Development, 26(5), 897-911.
Zuñiga, M.P. & Guellec, D. (2009). Who Licenses out Patents and Why?: Lessons from a Business Survey. OECD Science, Technology and Industry Working Papers 2009/5.


109
Chapter 3 BalanCing CollaBoration and Competition
cHAPteR 3bAlAncIng collAboRAtIon And comPetItIon
Greater collaboration between firms in the innovation
process is seen as one important element of the chang-
ing face of innovation. Survey evidence indicates that
the great majority of research and development (R&D)-
intensive firms pursue some form of collaboration. Joining
forces with others is also at the heart of modern open
innovation approaches – even if the significance of such
approaches is still uncertain (see Chapter 1).
Private collaboration has the potential to improve societal
welfare by most effectively utilizing the core competencies
of individual firms. However, collaboration also creates a
tension on two levels:
• Tensionduetothecompetinginterestsofcollabo-
rators. Firms must weigh the efficiency gains from
sharing efforts and knowledge against the risks that
partners may act opportunistically.
• Tensionbetweenproducersof intellectualproperty
(IP) and the public good. Policymakers are eager to
encourage the efficient introduction of new technolo-
gies, favoring cooperation; however, they must guard
against harmful anticompetitive practices.
Drawing on the economic literature, this chapter explores
these tensions and their implications for business deci-
sions and policymaking. It first focuses on collaboration
between firms in the production of IP (Section 3.1) and in
the commercialization of IP (Section 3.2). Then, the chap-
ter reviews how anticompetitive practices are addressed
in the competition policy frameworks of certain jurisdic-
tions (Section 3.3). The concluding remarks summarize
some of the key messages emerging from the economic
literature and point to areas where more research could
usefully guide policymakers (Section 3.4).
3.1Collaborating to generate new IP
Firms may collaborate at different stages in the innovation
process (see Subsection 1.2.5). Conceptually, it is helpful
to distinguish between collaboration in producing IP and
collaboration in commercializing IP. This section focuses
on the former and considers the following two forms of
formal R&D collaboration:
• Contractualpartnerships–Theseoftentakeplacein
the context of a defined project and may involve the
sharing of personnel and costs such as laboratories,
offices or equipment. These arrangements are usu-
ally of a smaller scale and finite time span. Given their
project-specific nature, collaboration objectives are
usually relatively specific. For generating new IP, this
is by far the most common mode of collaboration.
• Equity-basedjointventures–Theseinvolvetwoor
more parent organizations creating and funding a
third entity. Companies may establish such collabora-
tion agreements specifically to make the entity more
independent in governance. This form of collaboration
represents a larger commitment and requires higher
coordination costs. Although it makes the option of
changing partners far less flexible, the entity’s actual
goals can be more flexibly defined at the organizational
rather than the project level.

110
Chapter 3 BalanCing CollaBoration and Competition
These two forms of formal collaboration – generally re-
ferred to as R&D alliances – do not always result in new
IP. But frequently they do and provisions setting out who
owns joint research output and how it is shared are often
a central element of collaboration agreements.
Following a review of the available data on these forms
of collaboration, the discussion explores what motivates
firms to collaborate and the complications that arise in joint
R&D undertakings. It also briefly reviews the phenomenon
of open source software, which departs in important
ways from more traditional collaboration approaches.
3.1.1What the available data say about formal R&D collaboration
There is no perfect way to trace contractual R&D partner-
ships and joint ventures. Aside from a few exceptions,
firms do not need to officially report information on their
collaborative arrangements. Company annual reports
may offer a window onto their collaborative activity, but
the information available is typically incomplete and
limited to larger firms.
Several non-official databases exist that track announce-
ments of new R&D alliances. Figure 3.1 depicts the trend
in new agreements over the 1990-2005 period for differ-
ent industries, as suggested by three such databases.
Two empirical patterns stand out. First, the formation of
R&D alliances appears to have peaked in the mid-1990s.
Second, the information and communications technol-
ogy (ICT) industry accounts for the greatest number of
agreements for most years, although one data source
suggests that the biotechnology industry emerged as the
top collaborating industry in the early 2000s. In addition
to these industries, the chemical industry also exhibits
substantial numbers of collaborative agreements across
all three sources.

111
Chapter 3 BalanCing CollaBoration and Competition
Figure 3.1: Did R&D alliances peak in the mid-1990s?
Number of R&D alliances (standardized), 1990-2005
(a) Comparison of the MERIT/CATI, CORE and SDC R&D alliance databases
(b) SDC R&D alliance database by technology sector
(c) MERIT-CATI R&D alliance database by technology sector
Notes: Following Schilling (2009), panel (a) standardizes R&D alliance counts to allow for easier comparisons between the three different databases. As explained in the Data Annex to this chapter, the data collection methodologies of the three different databases differs in important ways. For easier presentation, panel (b) scales down the total count of R&D alliances by a factor of two. In panels (b) and (c), the technology sectors for the SDC and MERIT-CATI databases have been harmonized with a view to improve comparability.
Source: Schilling (2009).
0
500
1000
1500
2000
2500
3000
3500
1990 1991 1992 1993 1994 1995 1996 1997 1998 1999 2000 2001 2002 2003 2004 2005
IT Chemicals (including pharmaceuticals) Biotechnology Transportation Equipment Total
-2.5
-2
-1.5
-1
-0.5
0
0.5
1
1.5
2
2.5
3
1990 1991 1992 1993 1994 1995 1996 1997 1998 1999 2000 2001 2002 2003 2004 2005
SDC CORE MERIT-CATI
0
100
200
300
400
500
600
700
800
900
1990 1991 1992 1993 1994 1995 1996 1997 1998 1999 2000 2001 2002 2003 2004 2005
IT Biotechnology Transportation Equipment Chemistry New materials Total
0
500
1000
1500
2000
2500
3000
3500
1990 1991 1992 1993 1994 1995 1996 1997 1998 1999 2000 2001 2002 2003 2004 2005
IT Chemicals (including pharmaceuticals) Biotechnology Transportation Equipment Total
-2.5
-2
-1.5
-1
-0.5
0
0.5
1
1.5
2
2.5
3
1990 1991 1992 1993 1994 1995 1996 1997 1998 1999 2000 2001 2002 2003 2004 2005
SDC CORE MERIT-CATI
0
100
200
300
400
500
600
700
800
900
1990 1991 1992 1993 1994 1995 1996 1997 1998 1999 2000 2001 2002 2003 2004 2005
IT Biotechnology Transportation Equipment Chemistry New materials Total

112
Chapter 3 BalanCing CollaBoration and Competition
Notwithstanding these similarities, several empirical
patterns differ markedly across the three data sources
for which there is no obvious explanation. In addition,
relying on announcements of new R&D alliances to trace
collaborative behavior introduces several biases that may
lead to a distorted picture of actual collaboration (see Box
3.1). Another problem of simple alliance counts is that
every agreement receives the same weight; in practice,
the scope and underlying commercial value of alliances
vary substantially. The above empirical insights thus need
to be treated with caution.
A more indirect way of capturing R&D collaboration is
to look at co-patenting behavior. Many joint R&D under-
takings will result in subsequent patenting, and patent
databases can help to identify those patents that have
two or more firms as applicants. An analysis of patent
filings at the United States Patent and Trademark Office
(USPTO) during the years 1989-1998 shows that co-
patenting was most frequent in the chemical, ICT and
instrumentation industries.1
Figure 3.2 depicts the technology breakdown of pat-
ents with two or more applicants filed under the Patent
Cooperation Treaty (PCT) system for the period 1990-
2010. Filings under the PCT system are not directly
comparable to filings at national offices, as they only
cover patents for which applicants seek protection in
several countries. However, for the same reason, patents
under the PCT are associated with more valuable inven-
tions. The simple breakdown by technology – rather than
industry – shows some similarity to findings in the US;
co-patenting was most frequent in organic fine chemistry,
computer technology and electrical machinery, followed
by pharmaceuticals and basic material chemistry.
box 3.1: Challenges in collecting consistent and comparable data on collaborative agreements
While new open innovation approaches have highlighted the im-portance of collaboration, it is not a new phenomenon (Chapter 1). Indeed, it is difficult to conclude from the available data that there has been a continuous rise in collaborative agreements over the last decades. However, measurement challenges abound.
In principle, three different types of data could offer empirical insights into collaborative behavior: counts of R&D alliances, in-novation surveys and co-patenting behavior. Unfortunately, none of these captures collaborative behavior perfectly, and data collection methods often introduce biases that may even lead to a misleading picture of such behavior.
R&D alliance counts are the most direct way of measuring private collaboration. The available collections – such as the SDC Platinum and MERIT/CATI databases – use a variety of sources to trace R&D alliances, including company annual reports and media announce-ments (see the Data Annex to this chapter). They invariably miss out on collaboration that is not announced or that does not receive media coverage. In addition, they predominantly cover English-language publications, thus introducing an important geographical bias. Schil-ling (2009) further discusses the reliability of these data collections.
Innovation surveys offer, in principle, a more rigorous approach to measurement. For example, European Community innovation sur-veys have collected some information on collaborative behavior and provide important insights into how collaboration varies depending on firm size (see also Subsection 1.3.3). However, innovation survey data often do not distinguish between formal and informal forms of collaborating; in addition, they cannot be easily compared across countries and over time.
Finally, co-patenting data offer an indirect way of capturing collabora-tive R&D activity between firms. The bibliographical data published in patent documents offer, in principle, rich information on jointly owned inventions. However, not all contractual R&D partnerships and joint ventures may result in subsequent patenting, and co-patenting may not be linked to any formal R&D collaboration. Indeed, the relationship between formal collaboration and subsequent patenting is likely to differ significantly across industries and countries.
1 See Hagedoorn (2003). De Backer et al. (2008)
report similar findings for patents filed at the
European Patent Office. In addition, they show that
“pharmaceuticals-biotechnology” and “chemical
materials” have seen substantial increases in the
share of patent filings with multiple applicants.
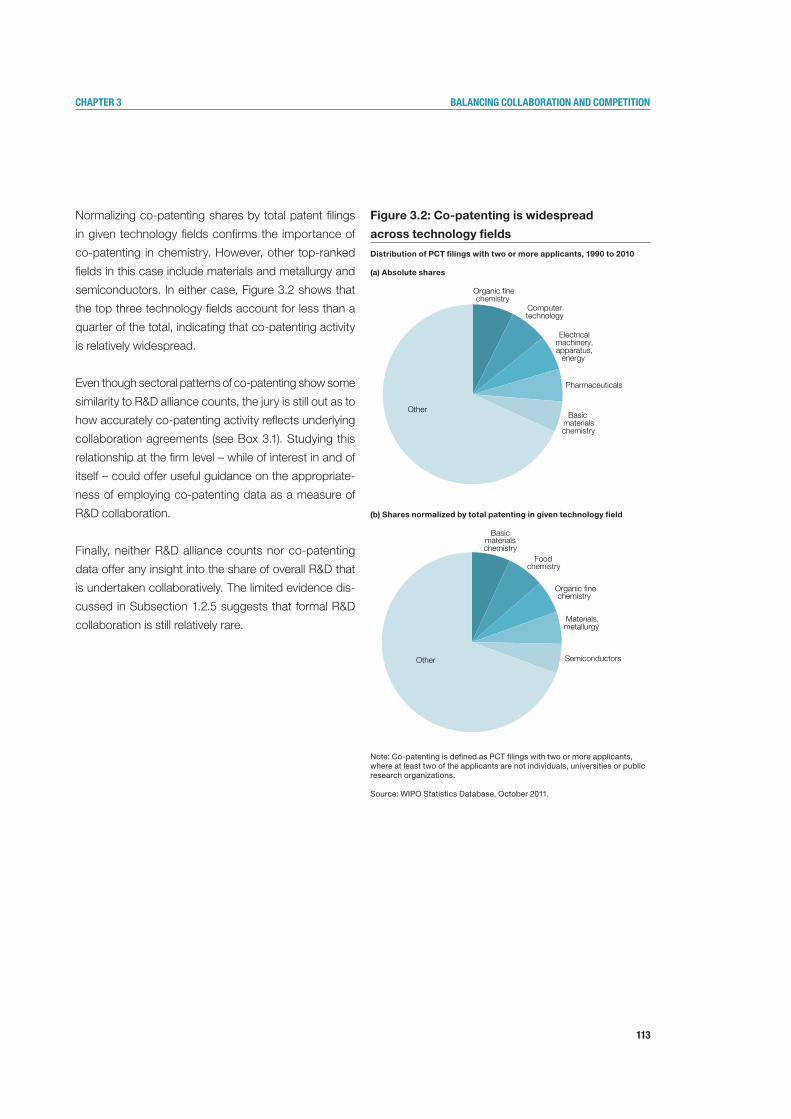
113
Chapter 3 BalanCing CollaBoration and Competition
Normalizing co-patenting shares by total patent filings
in given technology fields confirms the importance of
co-patenting in chemistry. However, other top-ranked
fields in this case include materials and metallurgy and
semiconductors. In either case, Figure 3.2 shows that
the top three technology fields account for less than a
quarter of the total, indicating that co-patenting activity
is relatively widespread.
Even though sectoral patterns of co-patenting show some
similarity to R&D alliance counts, the jury is still out as to
how accurately co-patenting activity reflects underlying
collaboration agreements (see Box 3.1). Studying this
relationship at the firm level – while of interest in and of
itself – could offer useful guidance on the appropriate-
ness of employing co-patenting data as a measure of
R&D collaboration.
Finally, neither R&D alliance counts nor co-patenting
data offer any insight into the share of overall R&D that
is undertaken collaboratively. The limited evidence dis-
cussed in Subsection 1.2.5 suggests that formal R&D
collaboration is still relatively rare.
Figure 3.2: Co-patenting is widespread
across technology fields
Distribution of PCT filings with two or more applicants, 1990 to 2010
(a) Absolute shares
(b) Shares normalized by total patenting in given technology field
Note: Co-patenting is defined as PCT filings with two or more applicants, where at least two of the applicants are not individuals, universities or public research organizations.
Source: WIPO Statistics Database, October 2011.
Organic ne chemistry
Computer technology
Electrical machinery, apparatus,
energy
Pharmaceuticals
Basic materials chemistry
Other
Basic materials chemistry
Food chemistry
Organic �ne chemistry
Materials, metallurgy
Semiconductors Other
114
Chapter 3 BalanCing CollaBoration and Competition
3.1.2Why firms collaborate for strategic reasons
Collaboration may be strategically motivated. Alliances
can provide a window onto the activities of competitors,
giving firms information that could shape their R&D in-
vestment or product strategies. While alliance partners
are typically careful to guard proprietary information
– especially from competitors – it is difficult to obscure
all sensitive information without choking off information
flows completely. Such secrecy is hard to maintain with
alliance partners and makes alliances useful for monitor-
ing R&D activity.
In highly concentrated industries, firms might find the
leakage of strategic information beneficial. Information
shared within an alliance can provide useful signaling,
and such disclosures may allow for tacit coordination.
Indirect cooperation might include avoiding direct market
competition, adopting common standards and coordi-
nating product releases – particularly where product
complementarities are strong.
Indeed, product complementarities can give firms com-
pelling reasons to cooperate. Such interdependencies
impact how technology producers think about invest-
ment. For example, it may not make sense to invest in
technology for an external disk drive that enables faster
writing than cable connection speeds would ever allow.
Collaborating with technology developers of complemen-
tary products can help to coordinate investment sched-
ules and promote interoperability in new product releases.
In some cases, firms may build alliances with partners
they see as possessing complementary assets or skills
that are important when technology under development
reaches the commercialization phase. If producers of
ideas anticipate that subsequent commercialization will
require partnerships with those holding scarce, comple-
mentary assets, they may pursue collaboration to estab-
lish favored positions or agreements with potential allies.2
Alliances can be a means for improving efficiency, but
they can also open the door to anticompetitive behavior.
When joint ventures provide higher profits than non-
cooperative arrangements, the threat of a breakup can
be used as an enforcing mechanism to sustain tacit
collusion in product markets.3 Alliances can also be ve-
hicles by which two firms can coordinate a lowering of
R&D investment such that both delay the introduction
of new technologies in order to extend higher prices on
existing technologies.4
2 See Teece (1986).
3 See Martin (1996).
4 See Cabral (2000).

115
Chapter 3 BalanCing CollaBoration and Competition
3.1.3How collaboration can improve efficiency
In addition to strategic motives, firms seek to collaborate
to improve R&D efficiency – notably by benefiting from
others’ experience, dividing efforts, sharing risks and
coordinating with producers of complementary goods.
This subsection discusses each of these efficiency mo-
tives in turn.
First, as discussed in Subsection 2.2.2, knowledge is
often cumulative, and obtaining the foundational knowl-
edge required to pursue cutting-edge innovation is costly.
Benefiting from the experience of others can be much
cheaper than obtaining the same experience firsthand.
The time required to attain a PhD and to become a
seasoned scientist or technologist is lengthening as the
“burden of knowledge” grows.5 Firms with complemen-
tary expertise can benefit by sharing. Collaborating with
other firms can be a way to leverage others’ experience
without being locked into a commitment to build up
knowledge internally. This option is particularly useful
when exploring new markets, geographical regions
or technologies.6
Sometimes, firms are interested not only in leveraging
the capabilities and accumulated knowledge of part-
ner firms, but also in learning from them. Collaborative
arrangements may explicitly be put into place to fa-
cilitate knowledge spillovers between partners (see also
Subsection 2.2.4).
Second, teaming up to divide efforts can provide ef-
ficiency gains where two firms want to explore the
same area. In particular, cost sharing is an important
reason for joining forces. R&D investment such as the
cost of laboratories, instrumentation, testing equipment
and technical specialists can be substantial. In some
industries, such as those producing semiconductors
and telecommunications equipment, the cost of a single
R&D project can require investment that is so high that
it is beyond the reach of most companies.7 In the more
typical case of smaller-scale R&D operations, effective
facilities require not only direct laboratory equipment
but also ancillary services – for example, administrative
support, maintenance staff that can handle specialized
equipment or hazardous materials, testing technicians
and others. Collaborating with another player with similar
needs helps to spread these costs.
Third, R&D is a risky, exploratory process; not all efforts
result in ideas that can be commercialized (see also
Chapter 2). In areas like pharmaceuticals, the develop-
ment of successful products only emerges out of many
unfruitful attempts. Collaborating with others during the
exploration phase spreads development risk over multiple
firms, making it feasible to undertake riskier projects.
R&D project portfolios are similar to financial security
analogues: firms pursue multiple projects with the under-
standing that some will fail, but that high-value projects
will compensate for that. However, unlike the losses
associated with poor security performance, unfruitful
projects have a silver lining: researchers learn something
about the problem and can use that knowledge to more
accurately target successful outcomes. While the cost
of this learning must be borne once, the lessons learned
can have multiple uses if shared.8
5 See Jones (2009).
6 See Veugelers (1998).
7 See Hagedoorn (1993).
8 For more basic research, such lessons can
sometimes also be applied to projects unrelated to
the objectives of the project initially commissioned.
116
Chapter 3 BalanCing CollaBoration and Competition
Fourth, for firms with complementary offerings or R&D,
cooperation can yield efficiency gains. In addition to
the benefits of sharing knowledge and investment bur-
dens, firms can coordinate by aligning their develop-
ment programs. For example, cooperation on interface
development can provide assurances with regard to
interoperability as well as coordination in releasing new,
improved technologies.
Collaboration for the development of new ideas can be
doubly beneficial. First, the problem of underinvestment
in R&D due to the appropriability dilemma introduced
in Chapter 2 can be partially addressed through cost
sharing; firms are more likely to invest sufficiently if the
burden can be shared through partnerships. Second,
joint activities facilitate knowledge spillovers, which is
beneficial from a social welfare perspective. Some econo-
mists have advanced these twin benefits as reasons why
joint R&D may warrant more favorable consideration by
competition authorities (see also Section 3.3).9
3.1.4The complications that arise in joint R&D undertakings
The preceding subsection described four rationales
for collaboration based on efficiency gains: benefitting
from the experience of others; dividing efforts; sharing
risk; and coordinating with producers of complementary
goods. For each of these rationales, conflicts of interests
may arise.
First, in the case of disclosure, conflicts of interest may
arise because individual firms seek to maximize their
learning gains and minimize spillover leakages. It can
be difficult to ascertain which information a partner
firm chooses to withhold.10 Empirical studies measuring
joint venture failure rates have linked conflict of inter-
est to collaboration viability; where partners compete
in product markets, the failure rate of joint ventures
increases markedly.11
In the second case – dividing efforts – monitoring R&D
efforts can be difficult, in particular evaluating whether
researchers are working hard or moving slowly. Conflicts
of interest may arise because, while both parties benefit
from the outcome of the joint effort, each has an incen-
tive to let the other party do most of the work. This can
be particularly pronounced where many partners are
involved. Since it is difficult to both monitor R&D efforts
and link each partner’s contribution to the results of a
joint venture, partners may exert less effort and free-ride
on the work of others (see Box 3.2 for an example).12
9 See, for example, Grossman and Shapiro
(1986) and Ordover and Willig (1985).
10 See Teece (1986).
11 See Harrigan (1988) and Kogut (1988).
12 See Deroian and Gannon (2006) and
Goyal and Moraga-Gonzalez (2001).
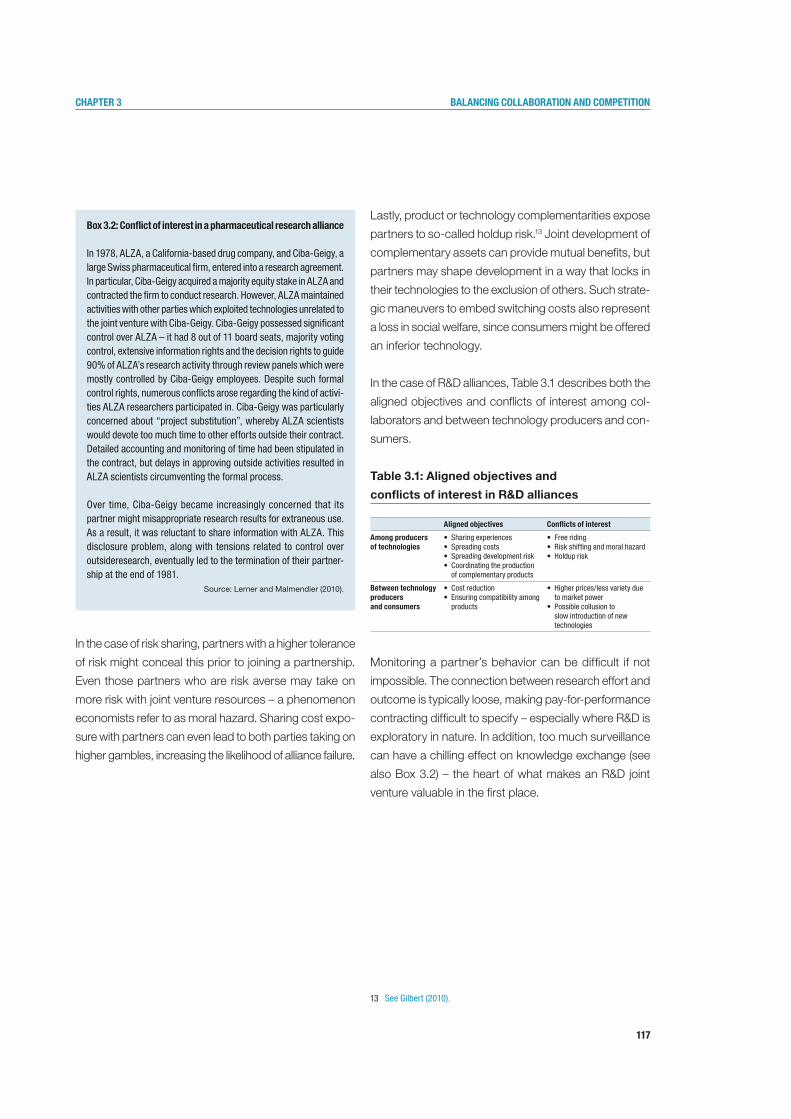
117
Chapter 3 BalanCing CollaBoration and Competition
13 See Gilbert (2010).
In the case of risk sharing, partners with a higher tolerance
of risk might conceal this prior to joining a partnership.
Even those partners who are risk averse may take on
more risk with joint venture resources – a phenomenon
economists refer to as moral hazard. Sharing cost expo-
sure with partners can even lead to both parties taking on
higher gambles, increasing the likelihood of alliance failure.
Lastly, product or technology complementarities expose
partners to so-called holdup risk.13 Joint development of
complementary assets can provide mutual benefits, but
partners may shape development in a way that locks in
their technologies to the exclusion of others. Such strate-
gic maneuvers to embed switching costs also represent
a loss in social welfare, since consumers might be offered
an inferior technology.
In the case of R&D alliances, Table 3.1 describes both the
aligned objectives and conflicts of interest among col-
laborators and between technology producers and con-
sumers.
Table 3.1: Aligned objectives and
conflicts of interest in R&D alliances
Monitoring a partner’s behavior can be difficult if not
impossible. The connection between research effort and
outcome is typically loose, making pay-for-performance
contracting difficult to specify – especially where R&D is
exploratory in nature. In addition, too much surveillance
can have a chilling effect on knowledge exchange (see
also Box 3.2) – the heart of what makes an R&D joint
venture valuable in the first place.
box 3.2: Conflict of interest in a pharmaceutical research alliance
In 1978, ALZA, a California-based drug company, and Ciba-Geigy, a large Swiss pharmaceutical firm, entered into a research agreement. In particular, Ciba-Geigy acquired a majority equity stake in ALZA and contracted the firm to conduct research. However, ALZA maintained activities with other parties which exploited technologies unrelated to the joint venture with Ciba-Geigy. Ciba-Geigy possessed significant control over ALZA – it had 8 out of 11 board seats, majority voting control, extensive information rights and the decision rights to guide 90% of ALZA’s research activity through review panels which were mostly controlled by Ciba-Geigy employees. Despite such formal control rights, numerous conflicts arose regarding the kind of activi-ties ALZA researchers participated in. Ciba-Geigy was particularly concerned about “project substitution”, whereby ALZA scientists would devote too much time to other efforts outside their contract. Detailed accounting and monitoring of time had been stipulated in the contract, but delays in approving outside activities resulted in ALZA scientists circumventing the formal process.
Over time, Ciba-Geigy became increasingly concerned that its partner might misappropriate research results for extraneous use. As a result, it was reluctant to share information with ALZA. This disclosure problem, along with tensions related to control over outsideresearch, eventually led to the termination of their partner-ship at the end of 1981.
Source: Lerner and Malmendier (2010).
Aligned objectives Conflicts of interest
Among producers of technologies
• Sharingexperiences• Spreadingcosts• Spreadingdevelopmentrisk• Coordinatingtheproduction
of complementary products
• Freeriding• Riskshiftingandmoralhazard• Holduprisk
between technology producers and consumers
• Costreduction• Ensuringcompatibilityamong
products
• Higherprices/lessvarietydueto market power
• Possiblecollusiontoslow introduction of new technologies
118
Chapter 3 BalanCing CollaBoration and Competition
To the extent that contractual joint collaboration can be
troublesome, firms may choose to create a third indepen-
dent entity for which parents hold equity stakes. By using
this arrangement, incentives are better aligned since both
partners have a stake in the success of the third entity.
Joint management and oversight make monitoring easier,
and the ongoing relationship facilitates enforcement of
good behavior. When contracting becomes more hazard-
ous, independent management can be a more effective
governance mechanism. One study that examines the
organizational choice between contracting and equity
joint ventures across national boundaries, finds that
contracting risks are higher where enforcement of IP
rights is more difficult.14
However, the equity form of organization is not without
its own costs. Forming a separate entity is expensive,
and the cost of “excessive bureaucracy” may outweigh
the contracting hazards.15 In addition, conflicts of interest
may arise where joint venture activities affect the profits
of one or more of its members.
3.1.5How collaboration differs in the case of open source software
The previous subsection discussed the complications
arising in R&D alliances, implicitly assuming that partner-
ing firms rely on IP exclusivity to appropriate their R&D
investments. However, does exclusivity always have to
play such a central role in R&D collaboration? Open
source software development provides an important
instance that appears to challenge this position.
Open source software development involves developers
– either individuals or firms, from a variety of locations
and organizations – voluntarily sharing code to develop
and refine computer programs which are then distributed
at no or low direct cost.16 What makes open source so
revolutionary is that it challenges the assumption that
IP exclusivity is necessary to motivate the production
of new and useful ideas – in clear contradiction to the
appropriability dilemma highlighted by Kenneth Arrow
(see Section 2.1). In addition, open source software de-
velopment has shown that collaboration for innovation
can happen without IP exclusivity.
14 See Oxley (1999).
15 See Oxley (1997, 1999). The appropriateness of
these organizational choices has been linked to
performance outcomes. Sampson (2004) examines
joint R&D activity with varying levels of opportunism
risk. She uses transaction cost economics to predict
that collaboration with higher risks for opportunism
should adopt equity joint venture structures.
Alternatively, straightforward collaboration may most
efficiently be managed using contracts. Sampson
finds that those alliances that fail to align governance
mechanisms with the threat of opportunism
underperform compared to those that do align.
16 See Lerner and Schankerman (2010) for a detailed
treatment of the economics of open source software.
119
Chapter 3 BalanCing CollaBoration and Competition
Open source software development has undoubtedly
grown in influence. The number of such projects has
increased rapidly: the website SourceForge.net, which
provides free services to open source software devel-
opers, has grown from a handful of projects ten years
ago to over 250,000 today.17 Open source is attracting
attention in the public sector as well. Government com-
missions and agencies have proposed – and in some
cases implemented – a variety of measures to encour-
age open source developers, including R&D support,
encouragement of open source adoption, explicit open
source preferences in government procurement, and
even obligations regarding software choices.18
Systematic evidence on the effects of open source devel-
opment on firm performance, consumers and economic
growth is still in its infancy. Existing studies suggest that
both producers and users of open source products often
blend participation in open source and proprietary soft-
ware. In the case of producers, it is common for firms to
develop both proprietary and open source programs.19
Such mixing is likely to create cost savings, whether
in product development or marketing. Firms may also
participate in open source software projects strategi-
cally to upset dominant players. Similarly, adopters of
open source software use open source and proprietary
products side by side. Users vary a great deal, both in
their software needs and in how they evaluate costs.
Although proprietary software may cost more upfront,
the costs of switching, interoperability and support
services can be greater for open source products. The
comingling of proprietary and open source programs in
both production and use suggests a complementarity
between the approaches.
What drives participation in open source software
projects? Unlike in other open innovation models (see
Subsection 1.2.5), compensation for innovative open
source efforts is not critical to success. At the same time,
Lerner and Tirole (2005) argue that contributions to open
source efforts are not inexplicable acts of altruism but
can be explained by other incentives. For example, par-
ticipating in open source projects can enhance the skills
of contributors, and these improvements may translate
into productivity gains in paid work. Open source projects
may also provide some intrinsic benefit if such projects are
more interesting than routine employer-assigned tasks.
Finally, open source participation could give coders a
chance to showcase their talents to future employers.
Finally, the spread of open source software develop-
ment evokes the question whether similar practices are
transferable to other industries. Indeed, models of the
open source type have been applied to other innovative
activity.20 However, their uptake appears less spectacu-
lar than for software. One explanation may be that the
success of open source software is closely linked to the
special circumstances of software development: projects
can be broken into small, manageable and independent
modules; input by geographically dispersed developers
can be easily shared; upfront capital costs are limited;
and new products do not face lengthy regulatory approval
processes.21 Nonetheless, additional opportunities for
open source types of collaboration may well arise in the
future as technology and the nature of innovation evolve.
17 http://sourceforge.net/about (accessed March 21, 2011).
18 See Lewis (2007).
19 See Lerner and Schankerman
(2010) and Lyons (2005).
20 See, for example, Maurer (2007).
21 See Lerner and Tirole (2005).
120
Chapter 3 BalanCing CollaBoration and Competition
3.2Collaborating to commercialize existing IP
Collaboration between firms extends beyond the joint
production of IP. In many cases, firms only join forces
when or even after they commercialize their technolo-
gies. This section focuses on such cooperation. It first
describes what motivates firms to collaborate during the
commercialization phase and the conflicts of interest that
may arise between them. It then discusses two specific
forms of collaboration: patent pools and standard-setting
organizations (SSOs).
3.2.1Why complementarities require coordination
Innovative activity typically builds on previous innovation,
and takes place simultaneously with similar innovative ef-
forts by competing firms (see Subsection 2.2.2). In such
an environment, so-called patent thickets may emerge:
relevant IP rights are distributed over a fragmented base
of IP holders, and those who wish to introduce products
using such technologies face the high cost of negotiating
with multiple parties. If each technology is essential, a
negotiation failure with any of the IP holders is equivalent
to a failure with all. New products are blocked, all IP hold-
ers lose an opportunity to commercialize and society
misses out on new technology. Even in the case where
an enterprising entrepreneur could strike a deal with each
separate IP right holder, he or she is likely to overpay if
the number of IP holders that could claim infringement
is sufficiently large. Economists refer to this form of
overcharging as “royalty stacking”.22
One potential solution for IP owners is to offer a license
for their collective IP as a package. On the face of it, this
form of collaboration would seem to benefit everyone.
Suppliers can unlock the value of their IP holdings at a
higher profit, and consumers benefit from new technol-
ogy. However, as in the case of IP-generating collabora-
tion, conflicts of interest invariably arise making it difficult
for IP holders to agree on a deal; challenges also exist in
balancing the interests of IP producers with the public
good. Table 3.2 describes the aligned objectives and
conflicts of interest in these two cases.
22 See Lerner and Tirole (2007).
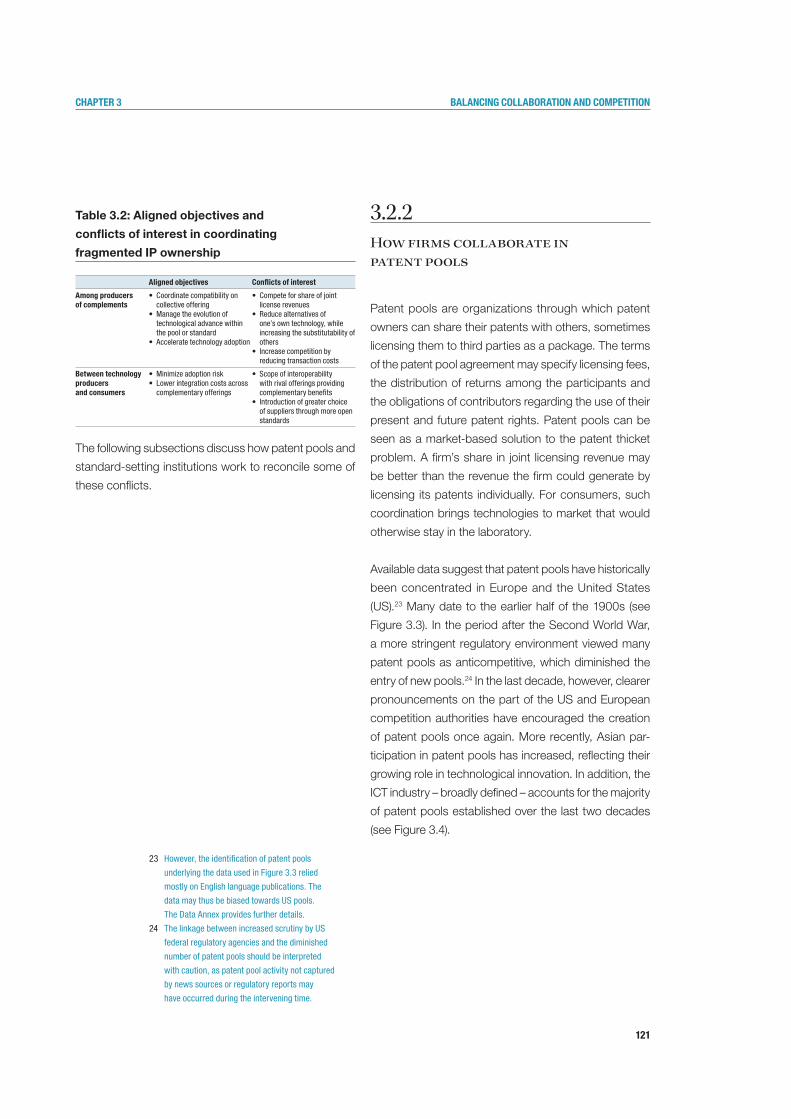
121
Chapter 3 BalanCing CollaBoration and Competition
Table 3.2: Aligned objectives and
conflicts of interest in coordinating
fragmented IP ownership
The following subsections discuss how patent pools and
standard-setting institutions work to reconcile some of
these conflicts.
3.2.2 How firms collaborate in patent pools
Patent pools are organizations through which patent
owners can share their patents with others, sometimes
licensing them to third parties as a package. The terms
of the patent pool agreement may specify licensing fees,
the distribution of returns among the participants and
the obligations of contributors regarding the use of their
present and future patent rights. Patent pools can be
seen as a market-based solution to the patent thicket
problem. A firm’s share in joint licensing revenue may
be better than the revenue the firm could generate by
licensing its patents individually. For consumers, such
coordination brings technologies to market that would
otherwise stay in the laboratory.
Available data suggest that patent pools have historically
been concentrated in Europe and the United States
(US).23 Many date to the earlier half of the 1900s (see
Figure 3.3). In the period after the Second World War,
a more stringent regulatory environment viewed many
patent pools as anticompetitive, which diminished the
entry of new pools.24 In the last decade, however, clearer
pronouncements on the part of the US and European
competition authorities have encouraged the creation
of patent pools once again. More recently, Asian par-
ticipation in patent pools has increased, reflecting their
growing role in technological innovation. In addition, the
ICT industry – broadly defined – accounts for the majority
of patent pools established over the last two decades
(see Figure 3.4).
Aligned objectives Conflicts of interest
Among producers of complements
• Coordinatecompatibilityoncollective offering
• Managetheevolutionoftechnological advance within the pool or standard
• Acceleratetechnologyadoption
• Competeforshareofjointlicense revenues
• Reducealternativesofone’s own technology, while increasing the substitutability of others
• Increasecompetitionbyreducing transaction costs
between technology producers and consumers
• Minimizeadoptionrisk• Lowerintegrationcostsacross
complementary offerings
• Scopeofinteroperabilitywith rival offerings providing complementary benefits
• Introductionofgreaterchoiceof suppliers through more open standards
23 However, the identification of patent pools
underlying the data used in Figure 3.3 relied
mostly on English language publications. The
data may thus be biased towards US pools.
The Data Annex provides further details.
24 The linkage between increased scrutiny by US
federal regulatory agencies and the diminished
number of patent pools should be interpreted
with caution, as patent pool activity not captured
by news sources or regulatory reports may
have occurred during the intervening time.
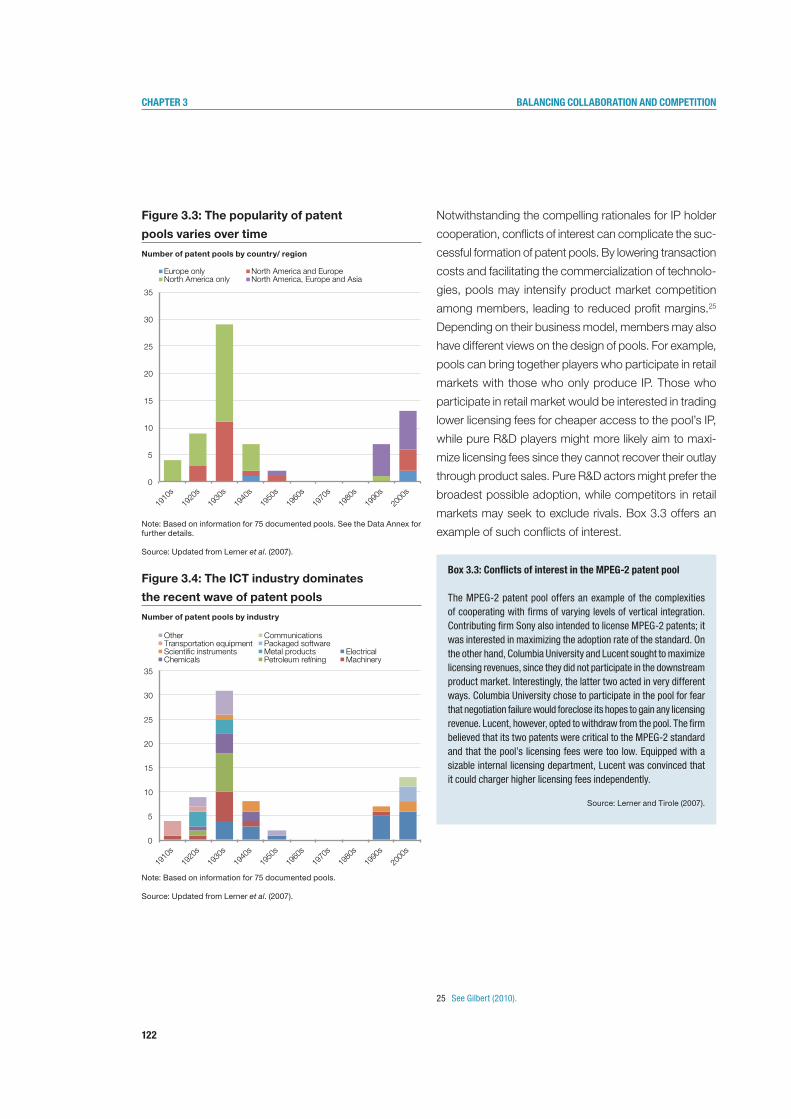
122
Chapter 3 BalanCing CollaBoration and Competition
Figure 3.3: The popularity of patent
pools varies over time
Number of patent pools by country/ region
Note: Based on information for 75 documented pools. See the Data Annex for further details.
Source: Updated from Lerner et al. (2007).
Figure 3.4: The ICT industry dominates
the recent wave of patent pools
Number of patent pools by industry
Note: Based on information for 75 documented pools.
Source: Updated from Lerner et al. (2007).
Notwithstanding the compelling rationales for IP holder
cooperation, conflicts of interest can complicate the suc-
cessful formation of patent pools. By lowering transaction
costs and facilitating the commercialization of technolo-
gies, pools may intensify product market competition
among members, leading to reduced profit margins.25
Depending on their business model, members may also
have different views on the design of pools. For example,
pools can bring together players who participate in retail
markets with those who only produce IP. Those who
participate in retail market would be interested in trading
lower licensing fees for cheaper access to the pool’s IP,
while pure R&D players might more likely aim to maxi-
mize licensing fees since they cannot recover their outlay
through product sales. Pure R&D actors might prefer the
broadest possible adoption, while competitors in retail
markets may seek to exclude rivals. Box 3.3 offers an
example of such conflicts of interest.
0
5
10
15
20
25
30
35
1910
s
1920
s
1930
s
1940
s
1950
s
1960
s
1970
s
1980
s
1990
s
2000
s
Europe only North America and Europe North America only North America, Europe and Asia
0
5
10
15
20
25
30
35
1910
s
1920
s
1930
s
1940
s
1950
s
1960
s
1970
s
1980
s
1990
s
2000
s
Other Transportation equipment Scienti c instruments Metal products
Petroleum re ning Chemicals
Communications Packaged software
ElectricalMachinery
25 See Gilbert (2010).
box 3.3: Conflicts of interest in the MPeG-2 patent pool
The MPEG-2 patent pool offers an example of the complexities of cooperating with firms of varying levels of vertical integration. Contributing firm Sony also intended to license MPEG-2 patents; it was interested in maximizing the adoption rate of the standard. On the other hand, Columbia University and Lucent sought to maximize licensing revenues, since they did not participate in the downstream product market. Interestingly, the latter two acted in very different ways. Columbia University chose to participate in the pool for fear that negotiation failure would foreclose its hopes to gain any licensing revenue. Lucent, however, opted to withdraw from the pool. The firm believed that its two patents were critical to the MPEG-2 standard and that the pool’s licensing fees were too low. Equipped with a sizable internal licensing department, Lucent was convinced that it could charger higher licensing fees independently.
Source: Lerner and Tirole (2007).
123
Chapter 3 BalanCing CollaBoration and Competition
As in the case of contractual partnerships and joint
ventures, a second conflict of interest arises where pool
members seek to maximize their return at the expense
of consumers. Patent pools that charge too high a price
effectively lower social welfare for the enrichment of pool
members. Social welfare may also diminish if incentives
to innovate are reduced. Pool members that enjoy mo-
nopoly status may have less incentive to release improved
versions of their technologies, and their market power
could raise barriers to entry for those who might step
forward with better alternatives (see also the discussion
in Subsection 2.2.3).
Should pools be allowed as a market-based solution to
the coordination problem, or disallowed as a vehicle for
collusion? The general principle is that competitive mar-
kets serve society’s interest; however, complementarities
present a special case for which coordination needs to
be considered. The short answer is “it depends”. Patent
pools comprising complementary patents can be welfare-
enhancing, because they solve the coordination problem.
On the other hand, patent pools containing substitute
technologies are not, since their main is to soften price
competition among pool members.26 Unfortunately, this
is far from a clear litmus test in real situations; patents
are rarely perfect complements or perfect substitutes.
One way to better differentiate beneficial pools from harm-
ful ones is to look at the detailed provisions governing
them. Two types of provisions are particularly relevant:
so-called grant backs and independent licensing rules.
Grant backs commit pool members to offer future patents
to the pool at no fee if such patents are deemed relevant
to the patent pool.27 This prevents individual members
who patent technologies that become essential to the
pool from holding up other members; it may also remove
the incentive to hide development in progress. However,
there is a cost to implementing such terms. Grant backs
also lower the incentives to invest in future innovation;
this not only works against the interests of pool members
but also against the public interest. Policymakers need to
be particularly concerned about grant backs restricting
technological progress.
Independent licensing rules allow any pool member to
license their patent outside of the pool. These can work
in the public interest in at least three ways. First, the
outside option to license the patents independently puts
a ceiling on the fees the pool can charge. As mentioned
earlier, in the absence of cooperation and where each
IP holder licenses independently, royalty stacking may
create inefficiently high prices. Certainly, policymakers
would not want pool prices to be higher than this. Allowing
pool members the option to independently license limits
the bundled price to the sum of the independent licens-
ing fees.
Second, independent licensing can serve as a screen-
ing device for policymakers to separate anticompetitive
pools with substitute patents from beneficial pools of
complementary patents. In anticompetitive pools, the
freedom of members to license their technology inde-
pendently would break the pool’s ability to fix prices
above the competitive rate. Such pools would therefore
not include independent licensing provisions. On the
other hand, independent licensing does not negatively
impact pools of complementary patents, since external
licensing of any component is either not valuable without
the remaining complements or occurs in a market that
does not compete with the pool.28
26 However, Gilbert (2010) shows that substitute
patents in a pool do not increase member profits
if the pool also includes essential patents. In this
case, the inclusion of substitute patents could affect
the ability of the pool to influence the adoption of
technologies that do not require the essential patents.
27 See Layne-Farrar and Lerner (2010).
28 See Lerner and Tirole (2004, 2007).
124
Chapter 3 BalanCing CollaBoration and Competition
Third, independent licensing encourages alternative appli-
cations of patented technologies which may have alterna-
tive uses outside the patent pool. Independent licensing
enables such multiuse patents to realize their potential
rather than restricting them to pool-related licensing.29
Empirical research on patent pools has made some
headway in assessing whether the above predictions hold
true in the real world. One key empirical challenge is that
patent pools are voluntary organizations, and the set of
candidate patents for pooling is thus difficult to identify.
One recent study overcame this challenge by focusing
on patent pools emerging from standard-setting efforts.30
Because SSOs typically identify all essential patents in
a patent pool, the authors were able to construct the
set of patents that could potentially be included in nine
modern patent pools.
Using data on participating companies as well as the
composition of the patent pools themselves, the study
reports several interesting findings. First, using patents
identified in a standard as the measure of potential
participation, they find that most pools contain roughly
one-third of eligible firms, underscoring the voluntary
nature of patent pools. This finding also points out that
the extent to which pools resolve the patent thicket prob-
lem is perhaps more limited in reality. Second, firms that
are vertically integrated in both R&D and downstream
product production are more likely to join a pool than
are pure R&D players.
Third, the study examines the impact of royalty sharing
terms. Where participants contribute patents of compa-
rable value, it is more likely that sharing revenue based
on the number of patents contributed will be accepted.
Because sharing terms might be determined with the
specific intent of attracting participation, the authors look
at the subset of firms that join the pool after the terms
were formed. They find that firms are less likely to join an
existing pool that uses such numerical proportion rules.31
In relation to whether independent licensing can effec-
tively screen for socially beneficial pools, another study
analyzes 63 patent pools and finds support for the as-
sociation between complementary patent pools and the
existence of independent licensing provisions.32 Since
patent pools do not spell out whether they comprise
either complementary or substitute patents, the study
employs records of legal challenges to capture the extent
to which pools reduce competition.33 It finds that pools
with complementary patents are more likely to allow for
external licensing. In addition, among litigated pools,
those without independent licensing are more likely to
face more severe verdicts. These findings are consistent
with the theory described earlier.
29 A possible fourth benefit of independent licensing
rules is that they reduce incentives for “socially
wasteful” inventive effort. Consider the “innovation
for buyout” scenario, whereby an enterprising
inventor produces a “me-too” innovation very
similar to a patent contained in a patent pool. The
entrepreneur pursues this marginal invention knowing
that the patent pool member will purchase the
entrepreneur’s patent in order to remove the threat
of being ousted from the patent pool. The effort to
develop a me-too invention and prosecute this buyout
strategy is socially wasteful, since it generates
little new knowledge; the primary purpose of this
tactic is essentially to blackmail pool members.
Mandated independent licensing can provide a
check on such wasteful practices. Such mandates
limit the opportunity to accumulate excess profits
within the pool, and this limits the potential reward
for pursuing innovation for buyout strategies.
30 See Layne-Farrar and Lerner (2010).
31 Given that few pools have adopted other approaches
to license revenue allocation, the study was
unable to conduct similar tests with value-
based allocation or royalty-free treatments for
licensing. See Layne-Farrar and Lerner (2010).
32 See Lerner et al. (2007).
33 In particular, the study uses records of both
private challenges and the memoranda from US
federal prosecutions to formulate this measure.
It considers both the occurrence of litigation and
remedies in such cases to measure the likelihood
that such pools have in fact reduced competition.
125
Chapter 3 BalanCing CollaBoration and Competition
Finally, the same study shows that grant back provisions
were more frequently used in complementary pools that
allow for independent licensing. This finding also supports
earlier arguments: grant back rules help remedy the
holdup problem (see earlier discussion), which is more
likely to arise in complementary pools.
3.2.3Why patent pools are emerging in the life sciences
As described in the previous subsection, the ICT industry
accounts for the majority of patent pools formed over
the last two decades. However, as patenting becomes
increasingly common in the life sciences, coordination
concerns for navigating patent thickets are also emerging
in the biotechnology industry.34
The incentives to create biotechnology patent pools are
similar to those in other industries. Overlapping patent
claims can block the commercialization and adoption of
technologies. The prospect of high coordination costs
can also dampen research efforts in the first place.
Patent pools offer a mechanism by which IP holders can
coordinate to remove such roadblocks.35
However, there are additional motives for considering
patent pools in the life sciences. Patent pools can be
created for philanthropic purposes (see Subsection 1.3.4).
For example, the Public Intellectual Property Resource
for Agriculture (PIPRA) patent pool for genetically modi-
fied rice brings together over 30 different IP owners. Its
purpose is to make patented technologies available to
less developed economies free of charge. Similarly, the
UNITAID patent pool focuses on making medicines for
diseases such as HIV/AIDS, malaria and tuberculosis
available to countries in need.
Patent pools may be created as a commons for en-
couraging research. In 2009, GlaxoSmithKline contrib-
uted over 500 patents to a patent pool for the study of
neglected tropical diseases. In contrast to the UNITAID
pool which concentrates on product availability, the
GlaxoSmithKline patent pool focuses on the accessibility
of its stock of ideas.
34 See Verbeure et al. (2006).
35 See Lerner and Tirole (2004) and
Verbeure et al. (2006).
126
Chapter 3 BalanCing CollaBoration and Competition
Proponents of life science patent pools point out that
pools can also be a means for setting standards.
Following the example of the telecommunications in-
dustry, pools may be used to establish and legitimize, for
example, standards for recognized genetic mutations.36
They could also be used to codify best practice guidelines
for genetic testing of particular diseases.37
While patent pools hold the potential to make technol-
ogy more accessible – particularly to disadvantaged
groups or countries – and to coordinate basic research
efforts, the biotechnology industry is in the early stages
of determining how best to use them. Resolving conflicts
of interest is likely to be just as challenging, if not more
so, as it is for other industries. At this stage, many pools
appear to focus on more marginal technologies, which
firms release at least in part because they are not part
of their core business. Many patent pools have a largely
philanthropic character; how patent pools will operate
within the business models of the biotechnology industry
remains to be seen.38
3.2.4How firms cooperate to set standards
As described earlier, patent pools in the modern era have
often been formed around certain standards. In fact,
patent pools can be the governing arrangement for a
standard-setting group.39 This subsection takes a closer
look at the standard-setting process, exploring where
standards are important, the role SSOs play, and the
conflicts of interest that arise in the setting of standards.
Standards become critical where interoperability is impor-
tant. They define which devices will work with others and
the technology that enables them to do so. They might
also specify not only the component technology, but
also the interface requirements between technologies.
Such interface standards allow producers to focus on
improving their own module without constantly revisit-
ing interoperability.
The link between standards and patent pools arises from
the fact that many standards are based on complemen-
tary technologies, often developed by different firms.
Patent pools that set out how technologies covered by
a particular standard can be accessed are therefore a
natural vehicle for cooperation among firms. One of the
first patent pools associated with a standard was the
MPEG-2 video coding standard pool. In 1997, the US
Department of Justice issued a business review letter
favorably responding to a proposal to license patents
essential to the MPEG standard as a package. This deci-
sion – along with the positive response in 1998 to the DVD
standard patent pool proposal – set the template for pat-
ent pools that would not run afoul of US antitrust laws.40
36 See Van Overwalle et al. (2005).
37 See Verbeure et al. (2006).
38 See The Lancet, “Pharmaceuticals, Patents,
Publicity… and Philanthropy?” (2009).
39 In the nine modern patent pools studied by
Layne-Farrar and Lerner (2010) all were
associated with standard-setting efforts.
40 See Gilbert (2004).
127
Chapter 3 BalanCing CollaBoration and Competition
Standards can be particularly important in the early
stages of technology adoption, because they can reduce
consumer confusion in the marketplace. Where con-
sumers are uncertain about which technology provides
the broadest compatibility, the rate of adoption is lower.
Standards provide some assurance that certain technolo-
gies will continue to be supported in the future through
upgrades and complementary products; they therefore
inform development efforts and consumer decisions.
Where industries adhere to standards, consumers can
mix and match the best technologies to suit their needs.41
Standard-setting based on patented technologies gen-
erally require voluntary participation by patent holders;
thus, many of the concepts and findings discussed in
Subsection 3.2.2 apply to the standard-setting process.
However, one economic characteristic associated with
standards further complicates incentives for cooperation
and has important social welfare implications: network
effects (see Box 3.4 for an explanation). In particular, there
is much to be gained by embedding one’s patent in a
standard and a great deal to lose by being excluded from
it. As a result, technology producers are keen to influence
the standard-setting process in their favor.
When the stakes are this high, it is not clear whether
open market competition will lead to the best standard.
IP holders will act to advance their own interests. Failure
to reach an agreement could result in no coordination,
even where it would be in society’s interest. Rather than
“voting with their money”, potential consumers may simply
choose not to adopt a technology, and the fear of poor
adoption rates becomes a self-fulfilling prophecy.
box 3.4: what are network effects and how are they related to standard setting?
Network effects occur where the value of a product increases as more people use it. The classic example is the fax machine: such a device is nearly worthless unless others own one; however, as more consumers adopt the technology, it becomes increasingly valuable.
For a product to effectively exploit network effects, prior standard setting is often necessary – as is the case for the fax machine. Produc-ers aligned with the standard have the advantage of remaining in the market as is, whereas those who are not so aligned must bring their offerings into compliance. Indeed, producers with a head start may be able to build a market share that makes it increasingly attractive for subsequent producers and consumers to adopt their standard. This positive feedback loop is referred to as an “indirect network effect”, whereby the consumer benefit of a standard depends on the number of producers that adopt the standard, and producers’ profits in turn depend on the number of consumers.42
Scholars who study network effects point out that, although ac-cording to theory there will be one or a handful of standards in a given segment where network effects are present, it is not clear which ones will be selected. Theoretical models which assume that producers and consumers make irreversible sequential decisions, predict that those who influence standards first will have the most to gain. Yet in other models, standards emerge from producers’ and users’ expectations about the future. In either case, these theories point to a critical implication for both producers and policymakers: the final standard adopted may not be the best one, but rather the one advanced by early movers.43 Clearly, producers of goods for which value depends on complementary technologies have a strong interest in shaping standards.44
128
Chapter 3 BalanCing CollaBoration and Competition
SSOs may intervene to facilitate coordination by provid-
ing a forum for communication among private firms,
regulatory agencies, industry groups or any combination
thereof. This can improve the chances of a cooperative
agreement being reached in the first place.45 In addition,
market mechanisms may lead to an impasse or to failed
adoption if important information on the technologies
themselves is not taken into account. Standard-setting
forums provide an outlet for such information to be con-
sidered.
However, coordination via standards organizations is
not without its own challenges. Conflicts of interest in
the formation of standards are somewhat analogous
to those encountered for patent pools. Suppliers can
withhold information about R&D in progress to steer
the group toward their forthcoming patents. Similarly,
suppliers can use the knowledge gained in the standard-
setting process to adjust their patent claims such that
they have greater power to hold up the group (see Box
3.5 for an example).46
In a close examination of the US modem industry, one
study finds that patent efforts may be the result, not the
antecedent, of participation in standard-setting activi-
ties.47 The study documents a high correlation between
patents granted for modem technology and participation
in standard setting. In addition, it finds that participation
in standard-setting predicts subsequent patents granted,
yet prior patents granted in the modem field are not indi-
cations of subsequent participation in standard setting.48
These effects hold even when accounting for anticipated
lags between patent applications and grants. While it is
possible that companies lobby for technologies that they
have not yet invented, the authors point out that such a
strategy is risky, because another company may learn
about the impending standard and overtake them in the
patenting race.
box 3.5: The case of rambus and the Joint electron device engineering Council
One controversial example of a patent claim amendment is the case of Rambus and the SSO, the Joint Electron Device Engineering Council (JEDEC). Founded in 1990 as a technology licensing company, Rambus was invited to join JEDEC shortly after its creation. Rambus dropped out of the SSO in 1996. By that time, it had had the op-portunity to observe the SSO’s proceedings and subsequently filed for patent continuations. Rambus claimed that the decision to file such continuations was independent from its participation in JEDEC; however, Rambus’ patent claim language for these continuations meant that those adopting JEDEC’s synchronous dynamic random access memory (SDRAM) standard risked infringing Rambus’ patents.
In 2000, Rambus successfully filed an infringement suit against Infineon, claiming that its memory manufactured under the SDRAM standard infringed four of its patents. These patents were filed after 1997, but they were continuations of a patent application originally filed in 1990. Over the next decade, Rambus was the subject of an extensive investigation by the US Federal Trade Commission (FTC). The agency charged Rambus with antitrust violations originating from what was inferred to be its attempt to use knowledge gained while participating in JEDEC to strategically expand the scope of its patent claims. These claims were contested through the District Courts and the Court of Appeals for the Federal Circuit, until 2009 when the US Supreme Court rejected the FTC’s final appeal.
Source: Graham and Mowery (2004) and FTC Docket No. 9302.www.ftc.gov/os/adjpro/d9302/index.shtm
45 See Farrell and Saloner (1988).
46 A different conflict of interest arises in the case of
interface standards: firms can adopt “one-way”
technical standards in which the interface on one
side is openly disclosed but concealed behind a
“translator” layer on the other. Such maneuvers
allow some firms to enjoy protected positions within
the standard while exposing others to competition.
47 See Gandal et al. (2007).
48 In particular, Gandal et al. (2007) employ a
Granger causality test. In a nutshell, this test
establishes that X “causes” Y if lagged values of
X are significant in explaining outcome Y, where
lagged values of Y are also included as controls.

129
Chapter 3 BalanCing CollaBoration and Competition
Finally, there may also be conflicts of interest between
SSOs and society. Notably, SSO members may charge
higher royalties to non-members than to fellow members.
One may argue that this would not be in the SSO’s inter-
est, as it could discourage wider adoption of a standard.
However, there are more subtle means of creating dis-
advantages for non-members. For example, delaying
disclosure can severely raise costs in a rapidly developing
industry, harming competitive market forces (see Box
3.6 for an example).
In the presence of network externalities, standards help to
increase societal welfare through the mutual adoption of
an agreed path for technological development. However,
the same network externalities can trap society in an infe-
rior standard (see also Box 3.4). Even were society to be
better off collectively absorbing the cost of upgrading to
another technology standard, no single firm may have the
incentive necessary to initiate such an upgrade.49 Private
incentives may thus be insufficient for ensuring socially op-
timal outcomes.50 This raises the question of which orga-
nizational attributes of SSOs best serve the public interest
and the appropriate form and level of government interven-
tion in the standard-setting process. Difficult trade-offs
exist. For example, it may seem more efficient to decide
on standards quickly; converging on this allows produc-
ers to focus on performance improvements rather than
standard-setting. On the other hand, encouraging more
competition among alternative standards prior to selection
could help to ensure that the best standard emerges.
3.3Safeguarding competition
The previous discussion pointed to a number of situations
in which private collaborative practices may conflict with
society’s interests. In particular, collaborative practices
can curtail the functioning of market competition to the
extent that consumers face higher prices, lower output,
less choice, the adoption of second-best technologies
and reduced innovation.
There is thus a role for competition policy to play in iden-
tifying and prohibiting those collaborative agreements
which impose a net cost on society. Indeed, in many
countries, competition policy addresses the interface
between private collaboration, IP and competition. While
there are important differences across jurisdictions,
most policy frameworks explicitly recognize that col-
laboration can promote societal welfare; they are thus
generally permissive of collaborative practices, unless
they trigger certain warning signs. Even then, only a few
collaborative practices are expressly prohibited – mainly
those associated with the formation of hardcore cartels.
In most cases, such warning signs prompt authorities
to further examine the competitive consequences of
collaborative agreements.
49 See Farrell and Saloner (1985).
50 See Katz and Shapiro (1985).
box 3.6: delayed disclosure in the case of the Universal Serial bus standard
One prominent example of delayed disclosure concerns the devel-opment of the Universal Serial Bus (USB) 2.0 standard. USB 2.0 improved speeds of the peripheral-to-computer connections by as much as 40 times. USB 2.0 was only compatible with a new controller interface, the Enhanced Host Controller Interface (EHCI). Consortium members like NEC Technologies, Lucent and Phillips all announced their new USB 2.0 and EHCI-compliant host controllers well in advance of the full release of the EHCI specification. In the fast-moving market of consumer electronics, such a head start can create a significant competitive advantage.
Source: MacKie-Mason and Netz (2007).

130
Chapter 3 BalanCing CollaBoration and Competition
Competition policy frameworks often spell out in some
detail the types of agreements that raise concerns in the
national context. This section reviews some of the key
rules and guidelines that have emerged in a number of
jurisdictions – namely, the European Union (EU), Japan,
the Republic of Korea and the US.51 The discussion is
not meant to be comprehensive from a legal viewpoint,
but merely seeks to illustrate the different approaches
and key legal concepts applied. Following the structure
of the previous discussion, the section first looks at col-
laborative R&D alliances, followed by patent pools and
standard-setting agreements.
3.3.1The type of collaborative R&D alliances that may be considered anticompetitive
There are three types of criteria that competition agencies
employ to identify potentially anticompetitive collaborative
R&D alliances: whether the combined market share of
participants exceeds certain concentration thresholds;
how the joint research undertaking might affect market
competition; and whether an agreement includes certain
provisions that may be unduly harmful for competition.
First, several jurisdictions have established critical market
share thresholds above which collaborative agreements
may trigger closer scrutiny by competition authorities.
For example, EU guidelines refer to a combined mar-
ket share threshold of 25 percent. In Japan and the
Republic of Korea, similar thresholds stand at 20 per-
cent. Competition authorities in the US do not employ a
market share threshold, but use threshold values for a
broader measure of market concentration, in particular
the Herfindahl-Hirschman Index.52
Implementing such threshold criteria is often not straight-
forward, as authorities need to define what constitutes
a relevant market. One possibility is to define markets in
relation to a specific technology – for example, combus-
tion engines. Other options are to define markets in rela-
tion to specific products and their close substitutes – for
example, car engines – or broader consumer markets
– for example, cars. Further complications arise where
R&D agreements concern radically new technologies
that have no close substitutes. Competition authorities
sometimes calculate market shares using alternative
market definitions, though the precise practice varies
across countries.
51 See guidelines on joint research practices for
the EU (2010, 2011), Japan (1993, 2007), the
Republic of Korea (2007, 2010) and the US
(1995, 2000). The US Department of Justice
and Federal Trade Commission (2007) reported
and reviewed the practices in this field.
52 The Herfindahl-Hirschman Index is calculated
by summing the squares of individual firms’
market shares thereby giving proportionately
greater weight to the larger market shares.
131
Chapter 3 BalanCing CollaBoration and Competition
Second, in assessing the competitive consequences of
collaborative agreements, some competition authori-
ties look at the nature of the joint research undertaking.
In Japan, for example, an agreement is more likely to
raise concerns the closer the joint research activity is to
the commercialization stage. Similarly, US competition
authorities are more circumspect of agreements that
assign marketing personnel to an R&D collaboration. In
the EU, R&D agreements that cover basic research are
less likely to raise concerns than agreements covering
the production and marketing of research results. In
addition, many competition authorities are more lenient
towards agreements involving firms that clearly possess
complementary assets and for which the rationale for
collaboration is thus strongest.
Finally, the inclusion of certain provisions in collaborative
R&D agreements may trigger action by competition au-
thorities. As already pointed out, provisions that facilitate
the formation of hardcore cartels – notably, price-fixing,
market sharing or joint marketing – are illegal per se in
most countries. In addition, authorities may investigate
agreements that impose restrictions on collaborating
partners which could result in reduced innovative activ-
ity. For example, in the EU and Japan, authorities may
question agreements that limit participants’ research
activity in areas different from those of the joint project,
or that takes place after the joint project is completed. In
addition, EU authorities may challenge agreements that
do not allow all participants access to the results of the
joint research or that prevent participants from exploiting
research results individually.
3.3.2How competition rules treat patent pools and standard-setting agreements
As pointed out in Subsection 3.2.2, competition au-
thorities have become more lenient towards the for-
mation of patent pools in the last two decades, which
partly explains their historical resurgence (see Figure
3.3). Nonetheless, they still scrutinize such agreements
for potential anticompetitive effects.
As in the case of collaborative R&D alliances, most juris-
dictions prohibit agreements that facilitate the formation
of hardcore cartels, that is, participants jointly determining
prices or quantities in product markets. In addition, many
competition frameworks may question agreements that
unduly slow innovative activity and, interestingly, they
sometimes employ the criteria outlined in Section 3.2.
Specifically, in the US, provisions that discourage par-
ticipants from engaging in further R&D – for example,
through grant back obligations – may be considered
anticompetitive.53 In the Republic of Korea and Japan,
authorities may challenge agreements that do not allow
for independent licensing. In addition, EU, Korean and US
authorities may investigate patent pools if the technolo-
gies included are seen as substitutes.
Relatively few countries have developed detailed competi-
tion rules on the treatment of patent rights in standard-
setting agreements, although certain business practices
by patent holders may be covered by general competition
law principles such as price gouging or refusal to deal.
Nonetheless, competition policy frameworks in some
countries address the patent-standards interface. Thus,
in the Republic of Korea, standard-setting agreements
that disclose only limited patent information or that do
not spell out the detailed licensing conditions affecting
participants may be considered anticompetitive.53 At the same time, the US Department of Justice has
expressly considered grant back provisions in its
business review letters, without rejecting them.

132
Chapter 3 BalanCing CollaBoration and Competition
Similarly, China’s Standardization Administration has is-
sued draft rules requiring patent holders to disclose their
patents if they are involved in standard-setting or if they
are otherwise aware that standards under development
cover a patent they own. These rules also foresee that
patents relevant to a national standard be licensed either
free-of-charge or at a below-normal royalty rate.54
3.4Conclusion and directions for future research
Firms increasingly look beyond their own boundaries to
maximize their investment in innovation. From society’s
perspective, private collaboration promises clear benefits:
it encourages knowledge spillovers; promotes an efficient
division of labor; reduces innovation risks; and fosters the
interoperability of complementary products. However,
leaving the formation of collaboration arrangements to
private market forces may not lead to socially optimal
outcomes; firms may either collaborate below desirable
levels or they may do so in an anticompetitive manner.
Insufficient levels of collaboration may occur where there
are conflicts of interest between potential collaborators.
Fears of free riding, risk shifting and other forms of oppor-
tunistic behavior may lead firms to forgo mutually beneficial
cooperation. Differences in business strategies between
specialized R&D firms and vertically integrated R&D and
production firms may contribute to negotiation gridlock.
In principle, the failure of private markets to attract an
optimal level of collaboration provides a rationale for
government intervention. Unfortunately, economic re-
search provides no universal guidance to policymakers
on how such market failures are best resolved. This is
partly because the benefits of and incentives for collabo-
ration are highly specific to technologies and business
models, and also because it is difficult to evaluate how
many potentially fruitful collaboration opportunities go
unexplored in different industries.
Some governments promote collaboration through fiscal in-
centives for firms and related innovation policy instruments.
In addition, there are incentive mechanisms for sharing IP
rights – for example, discounts on renewal fees if patent
holders make their patents available for licensing. However,
as greater technological complexity and a more fragment-
ed IP landscape have increased the need for collabora-
tion, there is arguably scope for creative policy thinking.54 See Standardization Administration of the
People’s Republic of China (2009).
133
Chapter 3 BalanCing CollaBoration and Competition
The problem of anticompetitive collaborative practices
seems easier to address from a policymaker’s viewpoint.
Such practices are generally more observable, and
authorities can assess the competitive effects of collab-
orative agreements on a case-by-case basis. In addition,
some consensus exists about the type of collaborative
practices that should not be allowed or at the least trigger
warning signs. For instance, the inclusion of grant back
provisions and restrictions on independent licensing have
emerged as differentiating markers between beneficial
versus potentially anticompetitive agreements.
Nonetheless, evaluating the competitive effects of specific
collaborative agreements remains challenging – especial-
ly where technologies move fast and their market impact
is uncertain. In addition, many low- and middle-income
countries have less developed institutional frameworks
for enforcing competition law in this area – although they
may benefit from the enforcement actions of high-income
countries where most collaborative agreements with
global reach are concluded.
Areas for future research
Seeking a better understanding of how collaborative
practices involving IP affect economic performance is a
fertile area for future research. In guiding policymakers
on how best to balance cooperation and competition in
the generation of new ideas, further investigation in the
following areas would seem especially helpful:
• MuchoftheavailableevidenceoncollaborativeR&D
alliances is based on case studies. This partly reflects
the fact that the impact of these alliances is critically
dependent on specific business strategies and tech-
nology properties, but it also reflects inadequate data.
Collecting more and better data through carefully
designed firm surveys could generate more system-
atic evidence of the patterns, motives and effects of
collaborative R&D, thereby usefully complementing
the available case study evidence.
• Theeconomicliteratureprovidesonlylimitedguidance
on situations in which governments should consider
intervening in market processes for selecting stan-
dards. This is a long-standing policy question, and
countries have opted for markedly different approach-
es. Clear-cut answers may seem elusive; however, it
would be useful to further investigate the effects of the
different structures and decision-making rules of SSOs
on the speed and quality of standard adoption where
underlying IP landscapes are highly fragmented.
• Littleinsightexistsontheeffectivenessofgovernment
programs that support collaboration. For example, as
pointed out above, many patent offices offer incentives
to patent owners for making their patents available for
licensing; no research has sought to systematically
evaluate whether such incentives matter and, if so,
how. More generally, no research exist on how other
elements of the IP system – above all, firms’ prospect
of effectively enforcing IP rights – affects incentives
for different forms of collaboration.
• Asmanycollaborativeagreementshaveaglobal
reach, national enforcement of competition law is
bound to have international spillovers. However, the
precise extent and nature of these spillovers is not
well understood. Generating evidence on this ques-
tion would be important in assessing the need for
low- and middle-income countries to further develop
competition rules in this area.
• Finally,availableevidenceoncollaborativepractices
focuses almost entirely on high income countries. In
the case of patent pools, this may be because many
of the patent families behind patent thickets do not
extend to low- and middle-income countries – though
this is an important research question in its own right.
In the case of R&D alliances, innovation surveys in
middle income countries suggest that local firms do
collaborate frequently. However, no evidence is avail-
able to assess whether the motivations and effects
of such collaboration differ systemically from high
income countries.
134
Chapter 3 BalanCing CollaBoration and Competition
ReFeRencesArthur, W.B. (1989). Competing Technologies, Increasing Returns, and Lock-in by Historical Events. The Economic Journal, 99(394), 116-131.
Bresnahan, T.F. & Yin, P. (2007). Standard Setting in Markets: The Browser War.InS.M.GreensteinandV.Stango(Eds.),Standards and Public Policy. Cambridge: Cambridge University Press, 18-59.
Cabral, L.M.B. (2000). R&D Cooperation and Product Market Competition. International Journal of Industrial Organization, 18(7), 1033-1047.
Carlson, S.C. (1999). Patent Pools and the Antitrust Dilemma. Yale Journal on Regulation, 16, 359-399.
Commerce Clearing House. (various years). Trade Regulation Reporter. NewYork:CommerceClearingHouse.
Dahlander, L. & Gann, D.M. (2010). How Open is Innovation? Research Policy, 39(6), 699-709.
De Backer, K., Lopez-Bassols, V. & Martinez, C. (2008). Open Innovation in a Global Perspective – What do Existing Data Tell Us? OECD STI Working Paper, 2008/4.
Deroian, F. & Gannon, F. (2006). Quality-Improving Alliances in Differentiated Oligopoly. International Journal of Industrial Organization, 24(3), 629-637.
Dun and Bradstreet (yearly). Who Owns Whom. In Dun and Bradstreet WorldBase (Ed.).
European Commission. (2010). Commission Regulation No. 1217/2010 on on the Application of Article 101(3) of the Treaty on the Functioning of the European Union to Certain Categories of Research and Development Agreements.
European Commission. (2011). Communication from the Commission: Guidelines on the Applicability of Article 101 of the Treaty on the Functioning of the European Union to Horizontal Co-Operation Agreements.
Fair Trade Commission Republic of Korea. (2007). Guidelines for Cartel Review.
Fair Trade Commission Republic of Korea. (2010). Review Guidelines on Undue Exercise of Intellectual Property Rights.
Farrell, J. & Klemperer, P. (2007). Coordination and Lock-in: Competition with Switching Costs and Network Effects. Handbook of Industrial Organization, 3, 1967-2072.
Farrell, J. & Saloner, G. (1988). Coordination through Committees and Markets. The RAND Journal of Economics, 19(2), 235-252.
Federal Trade Commission & US Department of Justice. (2000). Antitrust Guidelines for Collaborations Among Competitors.
Gandal, N., Gantman, N. & Genesove, D. (2007). Intellectual Property and Standardization Committee Participation in the US Modem Industry. In S.M. GreensteinandV.Stango(Eds.),Standards and Public Policy. Cambridge University Press, 208-230.
Gilbert, R.J. (2004). Antitrust for Patent Pools: A Century of Policy Evolution. Stanford Technology Law Review, 3, 7-38.
Gilbert, R.J. (2010). Ties that Bind: Policies to Promote (Good) Patent Pools. Antitrust Law Journal 77(1),1-48.
Goyal, S. & Moraga-Gonzalez, J.L. (2001). R&D Networks. The RAND Journal of Economics, 32(4), 686-707.
Graham, S. & Mowery, D. (2004). Submarines in Software: Continuations in U.S. Software Patenting in the 1980s and 1990s. Economics of Innovation and New Technology, 13, 443-456.
Grossman, G.M. & Shapiro, C. (1986). Optimal Dynamic R&D Programs. The RAND Journal of Economics, 17(4), 581-593.
Hagedoorn, J. (1993). Understanding the Rationale of Strategic Technology Partnering: Inter-organizational Modes of Cooperation and Sectoral Differences. Strategic Management Journal, 14(5), 371-385.
Hagedoorn, J. (2002). Inter-firm R&D partnerships: an overview of major trends and patterns since 1960. Research Policy, 31(4), 477-492.
Hagedoorn, J. (2003). Sharing Intellectual Property Rights—An Exploratory Study of Joint Patenting amongst Companies. Industrial and Corporate Change, 12(5), 1035-1050.
Harrigan, K.R. (1988). Strategic Alliances and Partner Asymmetries. In F. Contractor and P. Lorange (Eds.), Cooperative Strategies in International Business. Lanham: Lexington, 205-226.
Japanese Fair Trade Commission. (1947, amended 2009). Act on Prohibition of Private Monopolization and Maintenance of Fair Trade (Act no. 54 of April 14, 1947).
Japanese Fair Trade Commission. (1993, updated in 2009). Guidelines concerning Joint Research and Development under the Antimonopoly Act.
Japanese Fair Trade Commission. (2007). Guidelines for the Use of Intellectual Property under the Antimonopoly Act.
Jones, B.F. (2009). The Burden of Knowledge and the"Death of the Renaissance Man": Is Innovation Getting Harder? Review of Economic Studies, 76(1), 283-317.
Kaysen, C. & Turner, D.F. (1965). Antitrust Policy: An Economic and Legal Analysis. Cambridge: Harvard University Press.
Kogut, B. (1988).AStudyoftheLifeCycleofJointVentures.InF.Contractorand P. Lorange (Eds.), Cooperative Strategies in International Business. Lanham: Lexington Books, 169-186.
Langlois, R.N. (2007). Competition through Institutional Form: The Case of ClusterToolStandards.InS.M.GreensteinandV.Stango(Eds.),Standards and Public Policy. Cambridge: Cambridge University Press, 60-86.
Layne-Farrar, A. & Lerner, J. (2011). To Join or Not to Join: Examining Patent Pool Participation and Rent Sharing Rules. International Journal of Industrial Organization, 29(2), 294-303.
Lerner, J. & Malmendier, U. (2010). Contractibility and the Design of Research Agreements. The American Economic Review, 100(1), 214-246.
Lerner, J. & Schankerman, M. (2010). The Comingled Code: Open Source and Economic Development. Boston: MIT Press.
Lerner, J., Strojwas, M. & Tirole, J. (2007). The Design of Patent Pools: The Determinants of Licensing Rules. The RAND Journal of Economics, 38(3), 610-625.
Lerner, J. & Tirole, J. (2004). Efficient Patent Pools. The American Economic Review, 94(3), 691-711.
Lerner, J. & Tirole, J. (2005). The Economics of Technology Sharing: Open Source and Beyond. The Journal of Economic Perspectives, 19(2), 99-120.
Lerner, J. & Tirole, J. (2007). Public Policy toward Patent Pools. Innovation Policy and the Economy, 8, 157-186.
Lewis, J.A. (2007). Government Open Source Policies. Center for Strategic and International Studies.
Link, A. (2005).ResearchJointVenturesintheUnitedStates:ADescriptiveAnalysis. In A. N. Link & F. M. Scherer (Eds.), Essays in Honor of Edwin Mansfield.NewYork:Springer,187-193.
Lyons, D. (2005). Has Open Source Become a Marketing Slogan? Forbes.
MacKie-Mason, J.K. & Netz, J.S. (2007). Manipulating Interface Standards asanAnticompetitiveStrategy.InS.M.GreensteinandV.Stango(Eds.),Standards and Public Policy. Cambridge: Cambridge University Press, 231-259.
Martin, S. (1996).R&DJointVenturesandTacitProductMarketCollusion.European Journal of Political Economy, 11(4), 733-741.
Maurer, S. (2007). Open Source Drug Discovery: Finding a Niche (or Maybe Several). University of Missouri at Kansas City Law Review, 76(1-31).
Merges, R.P. (1999). As Many as Six Impossible Patents before Breakfast: Property Rights for Business Concepts and Patent System Reform. Berkeley Technology Law Journal, 14, 557-616.
Merges, R.P. (1999). Institutions for Intellectual Property Transactions: The Case of Patent Pools. University of California at Berkeley Working Paper.
135
Chapter 3 BalanCing CollaBoration and Competition
Ordover, J.A. and Willig, R.D. (1985). Antitrust for High-technology Industries:AssessingResearchJointVenturesandMergers.Journal of Law and Economics, 28(2), 311-333.
Oxley, J.E. (1997). Appropriability Hazards and Governance in Strategic Alliances: A Transaction Cost Approach. Journal of Law, Economics, and Organization, 13(2), 387-409.
Oxley, J.E. (1999). Institutional Environment and the Mechanisms of Governance: The Impact of Intellectual Property Protection on the Structure of Inter-firm Alliances. Journal of Economic Behavior and Organization, 38(3), 283-309.
Pharmaceuticals, Patents, Publicity… and Philanthropy? (February 2009). The Lancet, 373, 693.
Sampson, R.C. (2004). Organizational Choice in R&D Alliances: Knowledge-Based and Transaction-Cost Perspectives. Managerial and Decision Economics, 25(6-7), 421-436.
Schilling, M.A. (2009). Understanding the Alliance Data. Strategic Management Journal, 30(3), 233-260.
Shapiro, C. (2000). Navigating the Patent Thicket: Cross Licenses, Patent Pools, and Standard Setting. Innovation Policy and the Economy, 1, 119-150.
Standardization Administration of the People’s Republic of China. (2009). Regulations on Administration of Formulating and Revising National Standards Involving Patents.
Teece, D. (1986). Profiting from Technological Innovation: Implications for Integration, Collaboration, Licensing and Public Policy. Research Policy, 15(6), 285-305.
US Department of Justice & Federal Trade Commission. (1995). Antitrust Guidelines for the Licensing of Intellectual Property.
US Department of Justice & Federal Trade Commission. (2007). Antitrust Enforcement and Intellectual Property Rights: Promoting Innovation and Competition.
Van Overwalle, G., van Zimmeren, E., Verbeure, B. & Matthijs, G. (2005). Models for Facilitating Access to Patents on Genetic Inventions. Nature Reviews Genetics, 7(2), 143-154.
Vaughan, F.L. (1925). Economics of Our Patent System.NewYork:TheMacmillan Company.
Vaughan, F.L. (1956). The United States Patent System: Legal and Economic Conflicts in American Economic History. Norman: University of Oklahoma Press.
Verbeure, B., van Zimmeren, E., Matthijs, G. & Van Overwalle, G. (2006). Patent Pools and Diagnostic Testing. TRENDS in Biotechnology, 24(3), 115-120.
Veugelers, R. (1998). Collaboration in R&D: An Assessment of Theoretical and Empirical Findings. De Economist, 146(3), 419-443.
War and Peace and the Patent System (1942). Fortune, 26, 102-105,132,134,136,138,141.

136
Chapter 3 BalanCing CollaBoration and Competition
dAtA AnneXR&D alliances
The SDC Platinum, CORE and MERIT-CATI databases
are the three most used sources for measuring R&D-
specific alliances between firms across technology fields
and industrial sectors.
The SDC Platinum database is maintained by Thomson
Reuters and provides information on financial transac-
tions between firms, including merger and acquisition
(M&A) activity. Data on alliance activity, a section of the
M&A, capture a wide range of collaborative agreements,
including agreements between industrial partners on
distribution, licensing, manufacturing, marketing, R&D,
sales and supply, as well as joint ventures and strategic
alliances. They also comprise of alliances between
governments and universities. The data shown here
represent the count of R&D alliances classified in one
of the following four categories: R&D alliances, cross-
licensing, cross-technology transfer and joint ventures.
Information is collected based on Security and Exchange
Commission (SEC) filings, trade publications as well as
news sources.
The Cooperative Research (CORE) database, from the
National Science Foundation (NSF), collects informa-
tion on industrial partnerships which are filed under the
National Cooperative Research and Production Act
(NCRPA) in the US. Disclosure of any research and/
or production collaboration with other firms under the
NCRPA limits the possible antitrust liabilities arising
from those activities. NCPRA filings are published in
the Federal Register and include information on R&D
partners as well as partnership objectives. The CORE
database catalogues those filings and is further described
in Link (2005).
The MERIT-CATI database refers to Cooperative
Agreements and Technology Indicators (CATI) alliance
data administered by the UNU Maastricht Economic and
Social Research Institute on Innovation and Technology
(MERIT) in the Netherlands. Information on agreements
that cover technology transfer – including joint research
agreements and joint ventures involving technology
sharing between two or more industrial partners – is
collected on a worldwide basis. It relies on print publica-
tions including newspapers, company annual reports,
the Financial Times and Who Owns Whom, published
yearly by Dun and Bradstreet. Further description of the
database is available in Hagedoorn (2002).
These databases are likely to capture only a fraction of the
total instances of collaboration between firms worldwide.
One weakness is that they predominantly cover R&D
alliances documented in English-language publications,
although the MERIT-CATI database also includes an-
nouncements in Dutch and German. The language bias
also limits the geographical coverage of collaborative
agreements. By definition, the CORE database covers
only US agreements.
137
Chapter 3 BalanCing CollaBoration and Competition
Patent pools
The patent pool data presented in this chapter were kindly
supplied by Josh Lerner and Eric Lin from the Harvard
Business School. They build on an earlier database
described in Lerner et al. (2003), since updated to 2010.
No official reporting requirement exists for patent pools.
One therefore needs to rely on a variety of secondary
sources to track the formation of such pools. The patent
pool database relies on a variety of English-language
publications, reports by US government agencies, and
company news releases. Some of these publications
include Carlson (1999), Commerce Clearing House
(various years), Kaysen and Turner (1965), Merges (1999),
Vaughan (1925, 1956) and Fortune (1942). The coverage
of pools is clearly biased towards those formed in the US.
However, even for the US the data may be incomplete.
Patent pools are defined as patent-based collaborative
agreements of the following two types: (i) at least two
firms combine their patents with the intention to license
them, as a whole, to third parties; and (ii) at least three
firms come together to share their patents among them-
selves. The count of patent pools captured here does
not include cross-licensing agreements, new entities
established to manufacture products based on different
firms’ IP, firms that acquire patents and license them to
interested parties, or patent pools dominated by non-
profit entities (such as universities).


139
Chapter 4 harnessing publiC researCh for innovation – the role of intelleCtual property
Universities and public research organizations (PROs)
play a key role in innovation through their contribution to
the production and diffusion of knowledge.1
In the last decades, various national strategies have aimed
to improve the linkages between public research and
industry. As innovation becomes more collaborative, the
objective will be to find the most adequate frameworks for
spurring the commercialization of publicly-funded inven-
tions. Universities are therefore fostering entrepreneurial
activity along many dimensions, including by creating
incubators, science parks and university spin-offs.2
In the above context, patenting and licensing inventions
based on public research are used as instruments for
accelerating knowledge transfer, fueling greater cross-
fertilization between faculty and industry which leads to
entrepreneurship, innovation and growth. While this has
been an ongoing trend in high-income economies over
the last decades, it is increasingly also a matter of priority
in low- and middle-income economies. This has raised
numerous questions regarding the resulting economic
and other impacts, including those on the broader sci-
ence system.
This chapter reviews the developments and outcomes
of these approaches for countries at different stages
of development.
The first section of this chapter assesses the role of uni-
versities and PROs in national innovation systems. The
second section describes the ongoing policy initiatives
that promote university and PRO patenting and licensing,
and presents new data. The third section evaluates the
impacts of these policies based on the findings of the
growing empirical literature, while the fourth section is
concerned with implications for middle- and low-income
countries. Finally, the fourth section presents new prac-
tices that act as safeguards against the potential down-
side effects of commercializing publicly-funded research.
The analysis is supplemented by a background report to
this chapter (Zuñiga, 2011).
The concluding remarks summarize some of the key mes-
sages emanating from the economic literature and point
to areas where more research could usefully guide poli-
cymakers.
cHAPteR 4HARnessIng PUblIc ReseARcH FoR InnoVAtIon – tHe Role oF IntellectUAl PRoPeRtY
1 The text mostly covers universities and PROs.
At times, the term “public research institutions”
is used to cover both of the above. It must be noted
that the exact definition of what falls under “PROs
and universities” varies from country to country.
2 See Rothaermel et al. (2007).

140
Chapter 4 harnessing publiC researCh for innovation – the role of intelleCtual property
4.1The evolving role of universities and PROs in national innovation systems
Universities and PROs play a key role in national innova-
tion systems and in science more broadly. This has to
do with the magnitude and direction of public research
and development (R&D) (see Subsection 4.1.1) and the
impacts of these public research institutions on the
broader innovation system at different levels: first by pro-
viding human capital and training, advancing knowledge
through public science, and lastly through technology
transfer activities (see Subsection 4.1.2).
4.1.1Public R&D is key, in particular for basic research
The R&D conducted by universities and PROs accounts
for a substantial share of total R&D.
In high-income economies, the public sector is respon-
sible for anywhere between 20 and 45 percent of annual
total R&D expenditure (see Annex Figure 4.1). Importantly,
with some exceptions governments usually provide the
majority of the funds for basic research.3 On average,
in 2009 the public sector performed more than three-
quarters of all basic research in high-income economies
(see Figure 4.1).4 This contribution to basic research is
becoming more vital as firms focus mostly on product
development and as multinational companies in high-
income countries scale back their basic research in a
number of R&D-intensive sectors.5
3 Basic research means experimental or theoretical
work undertaken primarily to acquire new
knowledge of the underlying foundation of
phenomena and observable facts, without
any particular application or use in view.
4 See OECD, Research & Development Statistics.
Depending on the country in question, it accounts for
about 40 percent (Republic of Korea) to close to 100
percent (Slovakia) of all basic research performed.
5 See OECD (2008b).
Figure 4.1: Basic research is mainly conducted by the public sector
Basic research performed in the public sector for 2009 or latest available year, as a percentage of national basic research
Note: The above graph provides data from the most recent available years, mostly between 2007 and 2009 for each country, except Mexico for which the year provided is 2003. As noted in footnote 1, some of the distinction between higher education institutions – universities and government as well as PROs – is simply definitional and depends on what is defined as a university or a PRO in a given country.
Source: Organisation for Economic Co-operation and Development (OECD), Research and Development Database, May 2011.
0
20
40
60
80
100
China
Slovak
ia
Estonia
Poland
Icelan
d
Czech
Rep
ublic
Spain
New Z
ealan
d
Mexico
Norway
Hunga
ry
Fran
ce
Chile
Irelan
d
Denmark
Russia
n Fed
eratio
n Ita
ly
Austra
lia
Portug
al
Austria
South
Africa
Switzerl
and
United
Stat
es of
Ameri
ca
Israe
l
Japa
n
United
King
dom
Repub
lic of
Kor
ea
Higher education Government
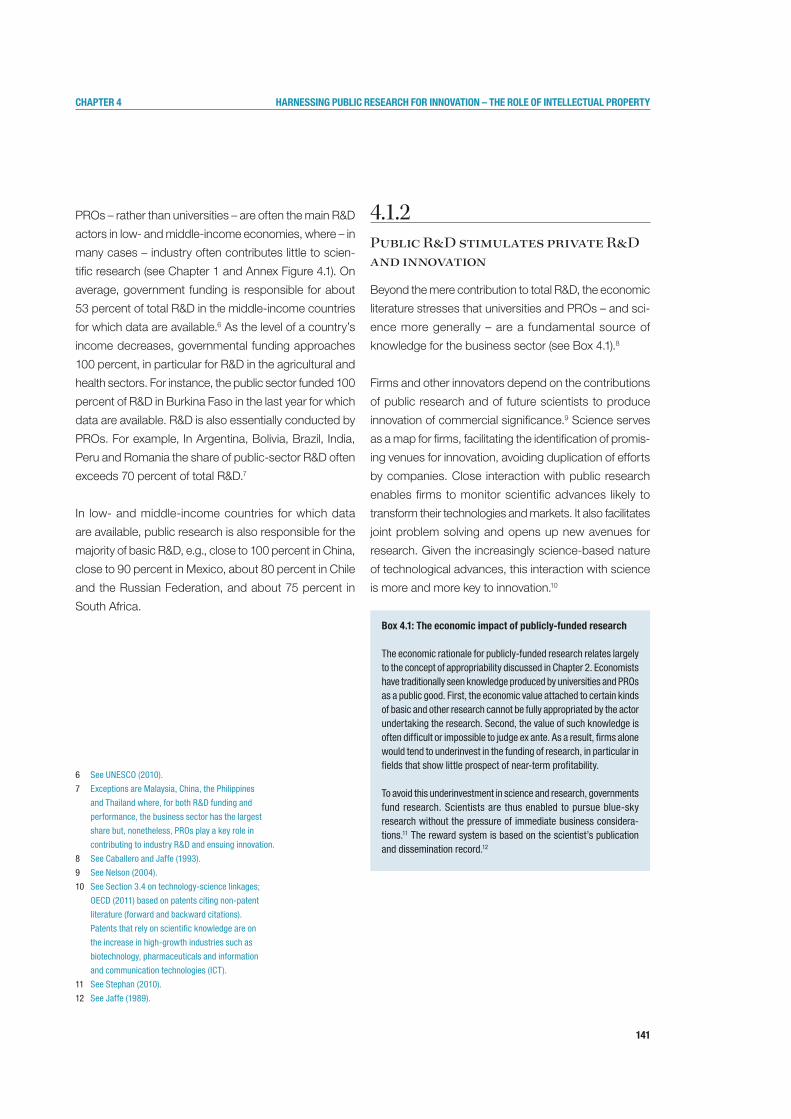
141
Chapter 4 harnessing publiC researCh for innovation – the role of intelleCtual property
PROs – rather than universities – are often the main R&D
actors in low- and middle-income economies, where – in
many cases – industry often contributes little to scien-
tific research (see Chapter 1 and Annex Figure 4.1). On
average, government funding is responsible for about
53 percent of total R&D in the middle-income countries
for which data are available.6 As the level of a country’s
income decreases, governmental funding approaches
100 percent, in particular for R&D in the agricultural and
health sectors. For instance, the public sector funded 100
percent of R&D in Burkina Faso in the last year for which
data are available. R&D is also essentially conducted by
PROs. For example, In Argentina, Bolivia, Brazil, India,
Peru and Romania the share of public-sector R&D often
exceeds 70 percent of total R&D.7
In low- and middle-income countries for which data
are available, public research is also responsible for the
majority of basic R&D, e.g., close to 100 percent in China,
close to 90 percent in Mexico, about 80 percent in Chile
and the Russian Federation, and about 75 percent in
South Africa.
4.1.2Public R&D stimulates private R&D and innovation
Beyond the mere contribution to total R&D, the economic
literature stresses that universities and PROs – and sci-
ence more generally – are a fundamental source of
knowledge for the business sector (see Box 4.1).8
Firms and other innovators depend on the contributions
of public research and of future scientists to produce
innovation of commercial significance.9 Science serves
as a map for firms, facilitating the identification of promis-
ing venues for innovation, avoiding duplication of efforts
by companies. Close interaction with public research
enables firms to monitor scientific advances likely to
transform their technologies and markets. It also facilitates
joint problem solving and opens up new avenues for
research. Given the increasingly science-based nature
of technological advances, this interaction with science
is more and more key to innovation.10
box 4.1: The economic impact of publicly-funded research
The economic rationale for publicly-funded research relates largely to the concept of appropriability discussed in Chapter 2. Economists have traditionally seen knowledge produced by universities and PROs as a public good. First, the economic value attached to certain kinds of basic and other research cannot be fully appropriated by the actor undertaking the research. Second, the value of such knowledge is often difficult or impossible to judge ex ante. As a result, firms alone would tend to underinvest in the funding of research, in particular in fields that show little prospect of near-term profitability.
To avoid this underinvestment in science and research, governments fund research. Scientists are thus enabled to pursue blue-sky research without the pressure of immediate business considera-tions.11 The reward system is based on the scientist’s publication and dissemination record.12
6 See UNESCO (2010).
7 Exceptions are Malaysia, China, the Philippines
and Thailand where, for both R&D funding and
performance, the business sector has the largest
share but, nonetheless, PROs play a key role in
contributing to industry R&D and ensuing innovation.
8 See Caballero and Jaffe (1993).
9 See Nelson (2004).
10 See Section 3.4 on technology-science linkages;
OECD (2011) based on patents citing non-patent
literature (forward and backward citations).
Patents that rely on scientific knowledge are on
the increase in high-growth industries such as
biotechnology, pharmaceuticals and information
and communication technologies (ICT).
11 See Stephan (2010).
12 See Jaffe (1989).
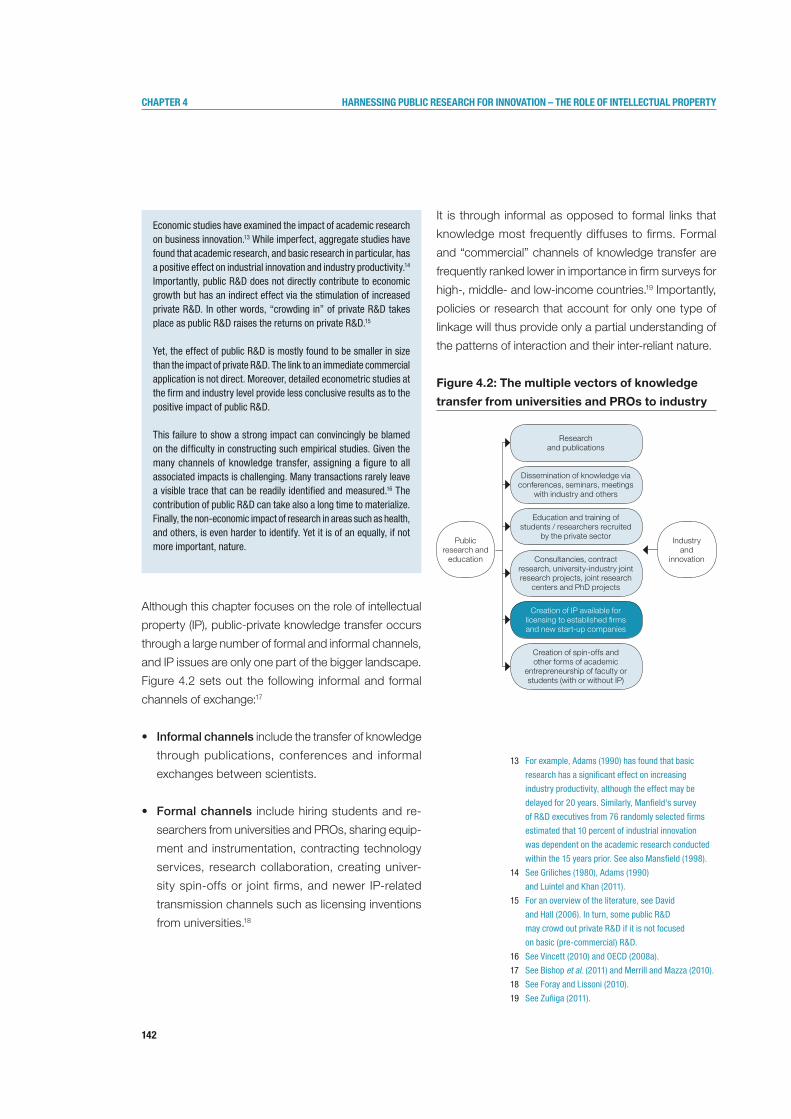
142
Chapter 4 harnessing publiC researCh for innovation – the role of intelleCtual property
Although this chapter focuses on the role of intellectual
property (IP), public-private knowledge transfer occurs
through a large number of formal and informal channels,
and IP issues are only one part of the bigger landscape.
Figure 4.2 sets out the following informal and formal
channels of exchange:17
• Informalchannels include the transfer of knowledge
through publications, conferences and informal
exchanges between scientists.
• Formalchannels include hiring students and re-
searchers from universities and PROs, sharing equip-
ment and instrumentation, contracting technology
services, research collaboration, creating univer-
sity spin-offs or joint firms, and newer IP-related
transmission channels such as licensing inventions
from universities.18
It is through informal as opposed to formal links that
knowledge most frequently diffuses to firms. Formal
and “commercial” channels of knowledge transfer are
frequently ranked lower in importance in firm surveys for
high-, middle- and low-income countries.19 Importantly,
policies or research that account for only one type of
linkage will thus provide only a partial understanding of
the patterns of interaction and their inter-reliant nature.
Figure 4.2: The multiple vectors of knowledge
transfer from universities and PROs to industry
13 For example, Adams (1990) has found that basic
research has a significant effect on increasing
industry productivity, although the effect may be
delayed for 20 years. Similarly, Manfield's survey
of R&D executives from 76 randomly selected firms
estimated that 10 percent of industrial innovation
was dependent on the academic research conducted
within the 15 years prior. See also Mansfield (1998).
14 See Griliches (1980), Adams (1990)
and Luintel and Khan (2011).
15 For an overview of the literature, see David
and Hall (2006). In turn, some public R&D
may crowd out private R&D if it is not focused
on basic (pre-commercial) R&D.
16 See Vincett (2010) and OECD (2008a).
17 See Bishop et al. (2011) and Merrill and Mazza (2010).
18 See Foray and Lissoni (2010).
19 See Zuñiga (2011).
Researchand publications
Dissemination of knowledge via conferences, seminars, meetings
with industry and others
Publicresearch and
education
Education and training of students / researchers recruited
by the private sector Industryand
innovationConsultancies, contract research, university-industry joint research projects, joint research
centers and PhD projects
Creation of IP available for licensing to established firms and new start-up companies
Creation of spin-offs and other forms of academic
entrepreneurship of faculty or students (with or without IP)
Economic studies have examined the impact of academic research on business innovation.13 While imperfect, aggregate studies have found that academic research, and basic research in particular, has a positive effect on industrial innovation and industry productivity.14 Importantly, public R&D does not directly contribute to economic growth but has an indirect effect via the stimulation of increased private R&D. In other words, “crowding in” of private R&D takes place as public R&D raises the returns on private R&D.15
Yet, the effect of public R&D is mostly found to be smaller in size than the impact of private R&D. The link to an immediate commercial application is not direct. Moreover, detailed econometric studies at the firm and industry level provide less conclusive results as to the positive impact of public R&D.
This failure to show a strong impact can convincingly be blamed on the difficulty in constructing such empirical studies. Given the many channels of knowledge transfer, assigning a figure to all associated impacts is challenging. Many transactions rarely leave a visible trace that can be readily identified and measured.16 The contribution of public R&D can take also a long time to materialize. Finally, the non-economic impact of research in areas such as health, and others, is even harder to identify. Yet it is of an equally, if not more important, nature.
143
Chapter 4 harnessing publiC researCh for innovation – the role of intelleCtual property
The payoffs of academic research are maximized when
the private sector uses and builds on these multiple
channels of transfer.20 These are not one-way exchanges
from universities to firms. Industrial research comple-
ments and also guides more basic research. It is also a
means of “equipping” university scientists with new and
powerful instruments.
For knowledge transfer to work, firms need to be able
to assimilate and exploit public research. Often this is
attained by firms actively engaged in upstream research
activity and actively participating in science.21 Promoting
outward knowledge transfer from universities and PROs
where this capacity does not exist will be ineffective.
Fostering this two-way exchange, which builds on the
mutual capacities of the public and private research
sectors, is a challenge for high-income countries but
particularly so for less developed economies with fewer
links among PROs, universities and the private sector
(see Section 4.4).
4.1.3Fostering the impact of publicly-funded research on innovation
Based on the above, policymakers have been keen to
bolster the effectiveness with which publicly-funded
research can foster commercial innovation.22
Since the late 1970s, many countries have changed their
legislation and created support mechanisms to encour-
age interaction between universities and firms, includ-
ing through technology transfer.23 Placing the output
of publicly-funded research in the public domain is no
longer seen as sufficient to generate the full benefits of the
research for innovation.24 Also, countries have intended
that budget cuts to universities should be compen-
sated by proactive approaches to revenue generation.25
In high-income countries, policy approaches promot-
ing increased commercialization of the results of public
research have included reforming higher education sys-
tems; creating clusters, incubators and science parks;
promoting university-industry collaboration; instituting
specific laws and institutions to regulate technology
transfer; and encouraging public research institutions
to file for and commercialize their IP.
The transformation of research institutions into more
entrepreneurial organizations is also taking place in
middle- and low-income countries by increasing the
quality of public research, creating new incentives and
performance-linked criteria for researchers, enhancing
collaboration of universities and PROs with firms, and
setting up mechanisms for formal technology transfer.2620 See David et al. (1992).
21 See Cohen and Levinthal (1989).
22 See Foray and Lissoni (2010) and
Just and Huffman (2009).
23 See Van Looy et al. (2011).
24 See OECD (2003) and Wright et al. (2007).
25 See Vincent-Lancrin (2006). There is increasing
evidence that countries seek to recover the full
economic cost of research activity in order to
allow research institutions to amortize the assets
and overhead, and to invest in infrastructure at
a rate adequate to maintain future capability.
26 See Zuñiga (2011).
144
Chapter 4 harnessing publiC researCh for innovation – the role of intelleCtual property
4.2Public research institutions’ IP comes of age
4.2.1Developing policy frameworks for technology transfer
University- and PRO-industry relationships have existed
for many years, and there have long been efforts to com-
mercialize public research, even before legal acts began
to facilitate the commercialization of patents.27
In the last three decades, however, the legislative trend
to incentivize university and PRO patenting and commer-
cialization has clearly intensified (see Box 4.2). Almost all
high-income countries have adopted specific legislative
frameworks and policies.28
Promoting technology transfer and the development of
industry-university collaboration has only been given
attention much later in less developed economies.29
Recently a number of more advanced middle- and low-
income economies have followed suit.
27 See Mowery et al. (2004); and Scotchmer
(2004). In the US, in particular, technology
transfer organizations, such as the Research
Corporation created in 1912, have sought
to commercialize academic research and to
channel monetary gains back into research.
28 See OECD (2003) and Guellec et al. (2010).
29 See Kuramoto and Torero (2009).
30 See Geuna and Rossi (2011) and Montobbio (2009).
31 See Cervantes (2009) and Foray and Lissoni (2010).
32 Professor’s privilege was abolished in Germany,
Austria, Denmark, Norway and Finland during
the period 2000-2007, but was preserved
in Sweden and Italy where, in the latter,
professor’s privilege was introduced in 2001.
box 4.2: A short history of university technology transfer legislation
In the 1960s, Israel was the first country to implement IP policies for several of its universities. However, in 1980 the Bayh-Dole Act of the US was the first dedicated legal framework which institutionalized the transfer of exclusive control over many government-funded inventions to universities and businesses operating under federal contracts. The shift and clarification of ownership over these inventions lowered transaction costs as permission was no longer needed from federal funding agencies, and because this gave greater clarity to ownership rights and therefore greater security to downstream – sometimes exclusive – licensees. For instance, the Act also contains rules for invention disclosure and requires institutions to provide incentives for researchers. It also contains march-in provisions reserving the right of government to intervene under some circumstances (see Section 4.5).
Several European, Asian and other high-income countries have adopted similar legislation, in particular as of the latter half of the 1990s onwards.30 In Europe, in many cases the challenge was to address the established situation according to which IP ownership was assigned to the faculty inventor – the so-called professor’s privilege – or to firms that funded the researchers rather than to the university or PRO itself.31 Since the end of the 1990s, most European countries have been moving away from inventor ownership of patent rights towards university or PRO ownership.32 European policy efforts have sought to increase both IP awareness within the public research system and the rate of commercialization of academic inventions. In Asia, Japan was the first to implement similar legislation in 1998 and, in 1999, shifted patent rights to public research institutions. The Republic of Korea implemented similar policies in 2000.
A number of middle- and low-income countries have also moved in this direction, whereas in other such countries these efforts are still nascent (for more details, see Zuñiga, 2011).
145
Chapter 4 harnessing publiC researCh for innovation – the role of intelleCtual property
33 See Zuñiga (2011). Thailand and the Russian
Federation, for instance, do not have specific
legislation defining ownership and commercialization
rules for research funded by the federal budget
at universities and PROs. Yet existing revisions to
the patent law or other policies leave universities
the flexibility to create and own their own IP.
A review of existing mechanisms reveals a few important
lessons. First, despite the general trend towards institu-
tional ownership and commercialization of university and
PRO inventions, a diversity of legal and policy approaches
persists, both in terms of how such legislation is anchored
in broader innovation policy (see Box 4.2) as well as how
it is designed with respect to specific rules on the scope
of university patenting, invention disclosure, incentives for
researchers (such as royalty sharing) and whether certain
safeguards are instituted to counteract the potentially
negative effects of patenting (see Subsection 4.4.1 and
Section 4.5).38 Second, the means to implement such
legislation, as well as the available complementary poli-
cies to enhance the impact of public R&D and to promote
academic entrepreneurship, vary widely (see Section 4.3).
In spite of the lack of an explicit policy framework, many of these countries have put in place general legislation regulating or facilitating IP ownership and commercialization by research institutions (see Annex, Table A.4.1).33 There are four distinct sets of countries. In the first set, there is no explicit regulation, but rather general rules defined in the law – mostly in patent acts – or legislation regulating research institutions or government funding. A second model consists of laws in the form of national innovation laws. A third, adopted in Brazil, China, and more recently in economies such as Malaysia, Mexico, the Philippines and South Africa, builds on the model of high-income countries which confers IP ownership to universities and PROs, spurring them to commercialize. Fourth, some countries, for example Nigeria and Ghana, have no national framework but rely on guidelines for IP-based technology transfer.
Fast-growing middle-income economies, such as Brazil, China, India, the Russian Federation and South Africa, have already implemented specific legislation or are currently debating its introduction (see Annex, Table A.4.1). China was among the first to adopt a policy framework in 2002.34 In addition, a significant number of countries in Asia – in particular Bangladesh, Indonesia, Malaysia, Pakistan the Philippines, and Thailand – and in Latin America and the Carib-bean – in particular Brazil, Mexico and more recently Colombia, Costa Rica and Peru – have been considering such legislation.35 However, only Brazil and Mexico have enacted explicit regulations regarding IP ownership and university technology transfer so far. In India, institutional policies have recently been developed at key national academic and research organizations, complementing legislative efforts which aim to implement university IP-based technology transfer rules.36
In Africa, most countries other than South Africa have neither a spe-cific law on IP ownership by research institutions nor any technology transfer laws. However, several countries have started to implement policy guidelines and to support technology transfer infrastructure. Nigeria and Ghana for instance do not have specific legislation but are both in the process of establishing technology transfer offices (TTOs) in all institutions of higher education.37 Algeria, Egypt, Morocco and Tunisia have been working on drafts for similar legislation. In 2010, South Africa implemented the Intellectual Property Rights from Publicly Financed R&D Act, which defines a number of obligations ranging from disclosure, IP management and inventor incentives, to the creation of TTOs and policies regarding entrepreneurship.
34 In 2002, the government provided universities with
full rights of ownership and commercialization for
inventions derived from state-funded research.
The “Measures for Intellectual Property Made
under Government Funding” legislation provides
specific rules for IP ownership and licensing,
inventor compensation and firm creation.
35 See Zuñiga (2011) and internal contributions
to this report made by WIPO’s Innovation
and Technology Transfer Section.
36 See Basant and Chandra (2007).
37 Nigeria is in the process of establishing TTOs inall
institutions of higher education and research. In
terms of its policy framework; however, there is
no specific law on IP creation and management
at publicly-funded research institutions. Instead,
regulations are set within federal research institutes
and, recently, the the National Office for Technology
Acquisition and Promotion (NOTAP) published
“Guidelines on Development of Intellectual Property
Policy for Universities and R&D Institutions”.
These guiding principles explain how each R&D
institution can formulate and implement its IP
policy to protect tangible research products in order
to make them demand-driven and economically
viable. The guidelines also promote the use of IP
for the benefit of society, and strengthen research-
industry linkages by establishing intellectual
property and technology transfer offices (IPTTO).
38 These can range from legal approaches (stand-
alone or as part of more comprehensive reforms)
and university by-laws, to “codes of practice” or
general guidelines on IP ownership and management
for fostering greater transparency and consistency.
See Grimaldi et al (2011) and OECD (2003).
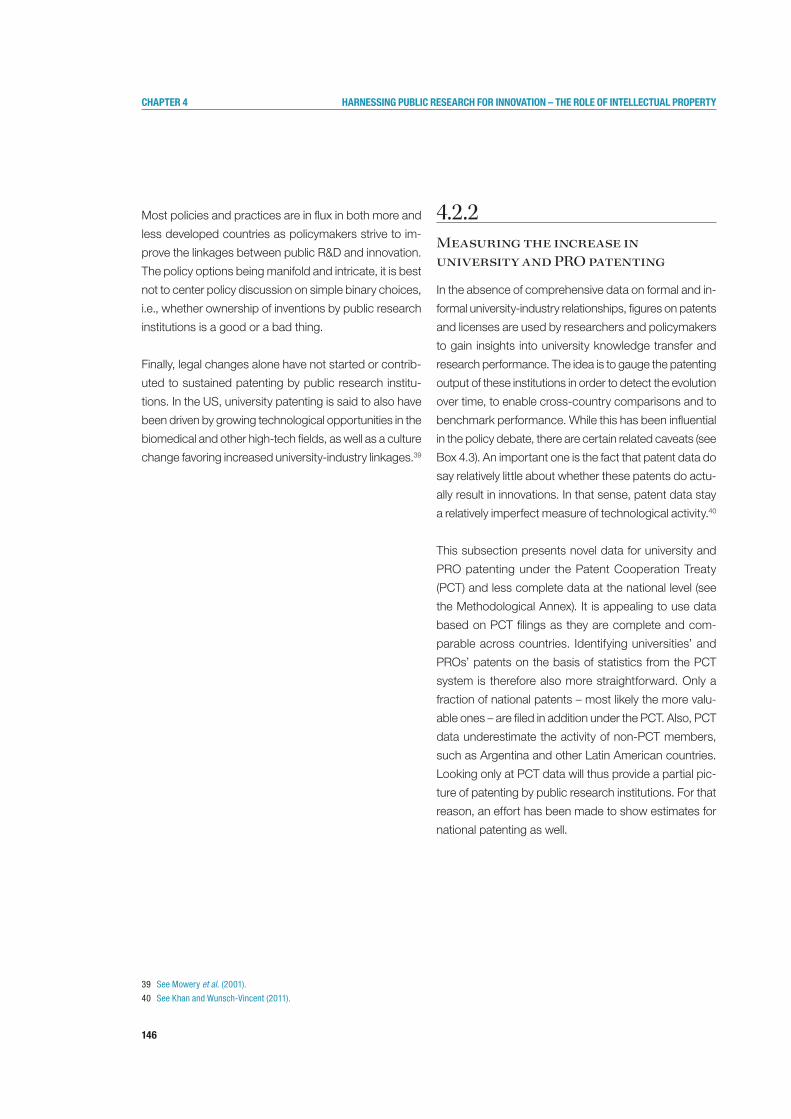
146
Chapter 4 harnessing publiC researCh for innovation – the role of intelleCtual property
Most policies and practices are in flux in both more and
less developed countries as policymakers strive to im-
prove the linkages between public R&D and innovation.
The policy options being manifold and intricate, it is best
not to center policy discussion on simple binary choices,
i.e., whether ownership of inventions by public research
institutions is a good or a bad thing.
Finally, legal changes alone have not started or contrib-
uted to sustained patenting by public research institu-
tions. In the US, university patenting is said to also have
been driven by growing technological opportunities in the
biomedical and other high-tech fields, as well as a culture
change favoring increased university-industry linkages.39
4.2.2Measuring the increase in university and PRO patenting
In the absence of comprehensive data on formal and in-
formal university-industry relationships, figures on patents
and licenses are used by researchers and policymakers
to gain insights into university knowledge transfer and
research performance. The idea is to gauge the patenting
output of these institutions in order to detect the evolution
over time, to enable cross-country comparisons and to
benchmark performance. While this has been influential
in the policy debate, there are certain related caveats (see
Box 4.3). An important one is the fact that patent data do
say relatively little about whether these patents do actu-
ally result in innovations. In that sense, patent data stay
a relatively imperfect measure of technological activity.40
This subsection presents novel data for university and
PRO patenting under the Patent Cooperation Treaty
(PCT) and less complete data at the national level (see
the Methodological Annex). It is appealing to use data
based on PCT filings as they are complete and com-
parable across countries. Identifying universities’ and
PROs’ patents on the basis of statistics from the PCT
system is therefore also more straightforward. Only a
fraction of national patents – most likely the more valu-
able ones – are filed in addition under the PCT. Also, PCT
data underestimate the activity of non-PCT members,
such as Argentina and other Latin American countries.
Looking only at PCT data will thus provide a partial pic-
ture of patenting by public research institutions. For that
reason, an effort has been made to show estimates for
national patenting as well.
39 See Mowery et al. (2001).
40 See Khan and Wunsch-Vincent (2011).
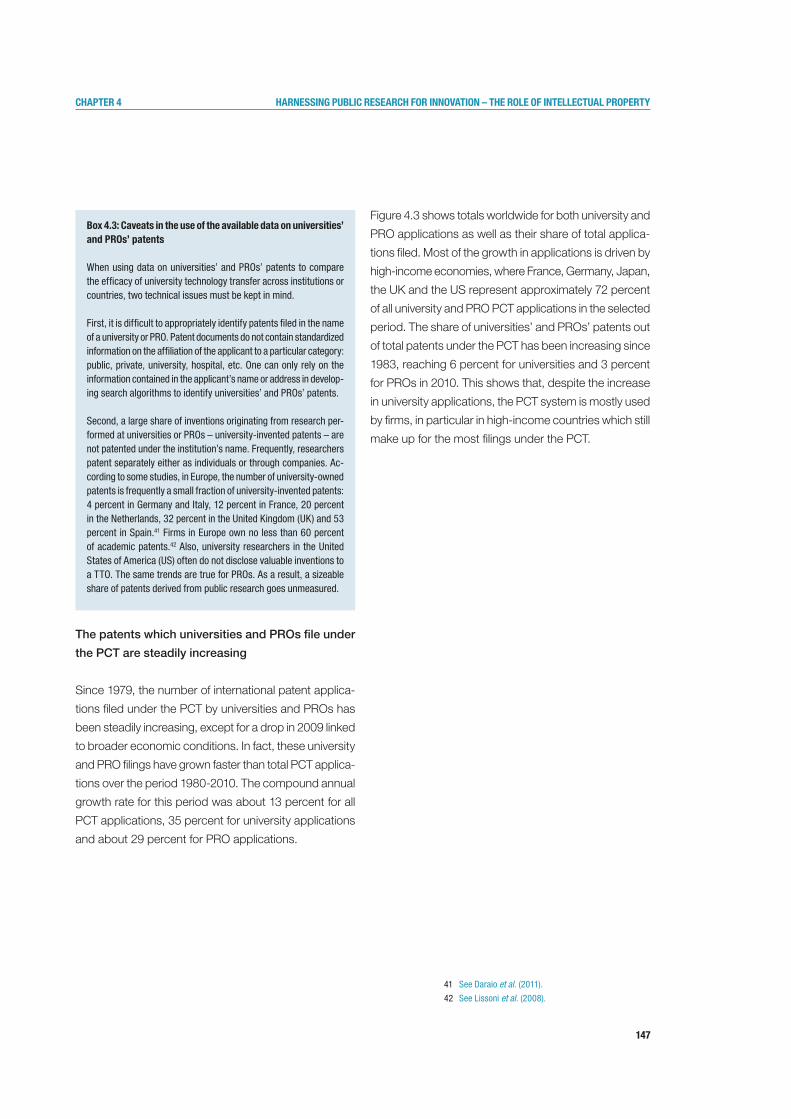
147
Chapter 4 harnessing publiC researCh for innovation – the role of intelleCtual property
The patents which universities and PROs file under
the PCT are steadily increasing
Since 1979, the number of international patent applica-
tions filed under the PCT by universities and PROs has
been steadily increasing, except for a drop in 2009 linked
to broader economic conditions. In fact, these university
and PRO filings have grown faster than total PCT applica-
tions over the period 1980-2010. The compound annual
growth rate for this period was about 13 percent for all
PCT applications, 35 percent for university applications
and about 29 percent for PRO applications.
Figure 4.3 shows totals worldwide for both university and
PRO applications as well as their share of total applica-
tions filed. Most of the growth in applications is driven by
high-income economies, where France, Germany, Japan,
the UK and the US represent approximately 72 percent
of all university and PRO PCT applications in the selected
period. The share of universities’ and PROs’ patents out
of total patents under the PCT has been increasing since
1983, reaching 6 percent for universities and 3 percent
for PROs in 2010. This shows that, despite the increase
in university applications, the PCT system is mostly used
by firms, in particular in high-income countries which still
make up for the most filings under the PCT.
box 4.3: Caveats in the use of the available data on universities’ and Pros’ patents
When using data on universities’ and PROs’ patents to compare the efficacy of university technology transfer across institutions or countries, two technical issues must be kept in mind.
First, it is difficult to appropriately identify patents filed in the name of a university or PRO. Patent documents do not contain standardized information on the affiliation of the applicant to a particular category: public, private, university, hospital, etc. One can only rely on the information contained in the applicant’s name or address in develop-ing search algorithms to identify universities’ and PROs’ patents.
Second, a large share of inventions originating from research per-formed at universities or PROs – university-invented patents – are not patented under the institution’s name. Frequently, researchers patent separately either as individuals or through companies. Ac-cording to some studies, in Europe, the number of university-owned patents is frequently a small fraction of university-invented patents: 4 percent in Germany and Italy, 12 percent in France, 20 percent in the Netherlands, 32 percent in the United Kingdom (UK) and 53 percent in Spain.41 Firms in Europe own no less than 60 percent of academic patents.42 Also, university researchers in the United States of America (US) often do not disclose valuable inventions to a TTO. The same trends are true for PROs. As a result, a sizeable share of patents derived from public research goes unmeasured.
41 See Daraio et al. (2011).
42 See Lissoni et al. (2008).
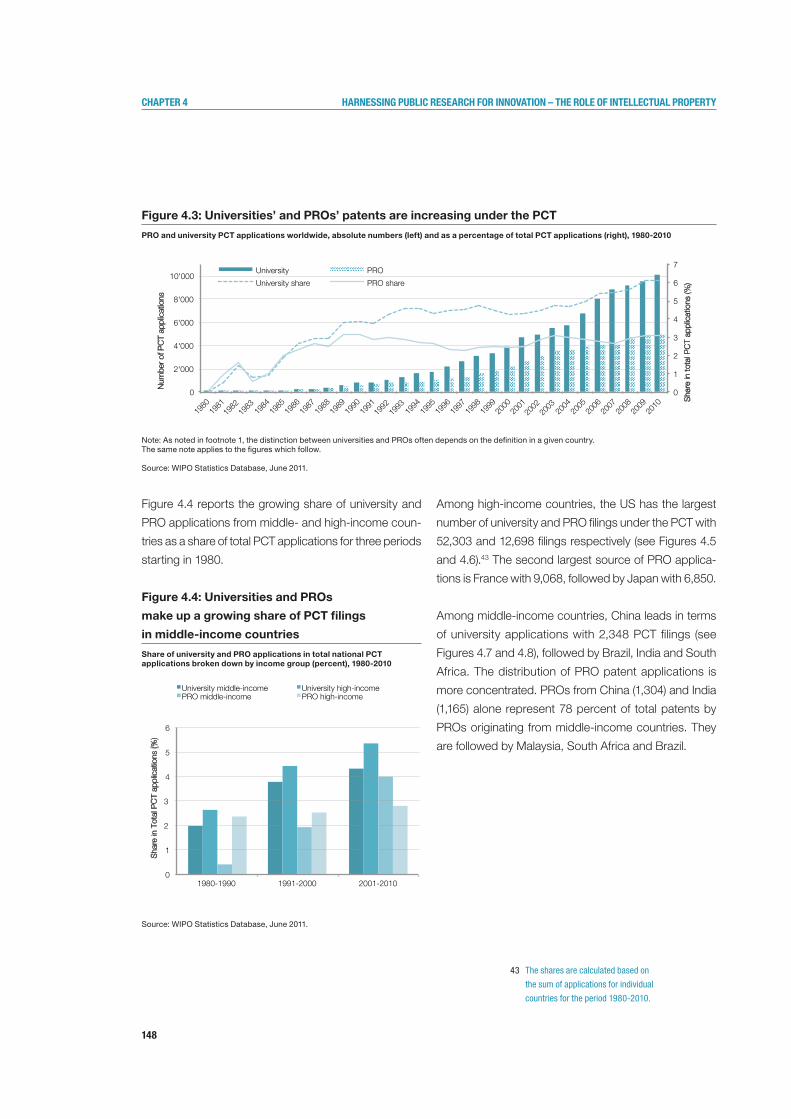
148
Chapter 4 harnessing publiC researCh for innovation – the role of intelleCtual property
Figure 4.3: Universities’ and PROs’ patents are increasing under the PCT
PRO and university PCT applications worldwide, absolute numbers (left) and as a percentage of total PCT applications (right), 1980-2010
Note: As noted in footnote 1, the distinction between universities and PROs often depends on the definition in a given country.The same note applies to the figures which follow.
Source: WIPO Statistics Database, June 2011.
Figure 4.4 reports the growing share of university and
PRO applications from middle- and high-income coun-
tries as a share of total PCT applications for three periods
starting in 1980.
Figure 4.4: Universities and PROs
make up a growing share of PCT filings
in middle-income countries
Share of university and PRO applications in total national PCT applications broken down by income group (percent), 1980-2010
Source: WIPO Statistics Database, June 2011.
Among high-income countries, the US has the largest
number of university and PRO filings under the PCT with
52,303 and 12,698 filings respectively (see Figures 4.5
and 4.6).43 The second largest source of PRO applica-
tions is France with 9,068, followed by Japan with 6,850.
Among middle-income countries, China leads in terms
of university applications with 2,348 PCT filings (see
Figures 4.7 and 4.8), followed by Brazil, India and South
Africa. The distribution of PRO patent applications is
more concentrated. PROs from China (1,304) and India
(1,165) alone represent 78 percent of total patents by
PROs originating from middle-income countries. They
are followed by Malaysia, South Africa and Brazil.
0
1
2
3
4
5
6
1980-1990 1991-2000 2001-2010
Sha
re in
Tot
al P
CT
appl
icat
ions
(%)
University middle-income University high-income PRO middle-income PRO high-income
43 The shares are calculated based on
the sum of applications for individual
countries for the period 1980-2010.
0
1
2
3
4
5
6
7
0
2'000
4'000
6'000
8'000
10'000
1980
1981
1982
1983
19
84
1985
1986
1987
1988
1989
1990
1991
1992
1993
19
94
1995
1996
1997
1998
1999
2000
2001
2002
2003
20
04
2005
2006
2007
2008
2009
2010
Sha
re in
tota
l PC
T ap
plic
atio
ns (%
)
Num
ber
of P
CT
appl
icat
ions
University PRO
University share PRO share
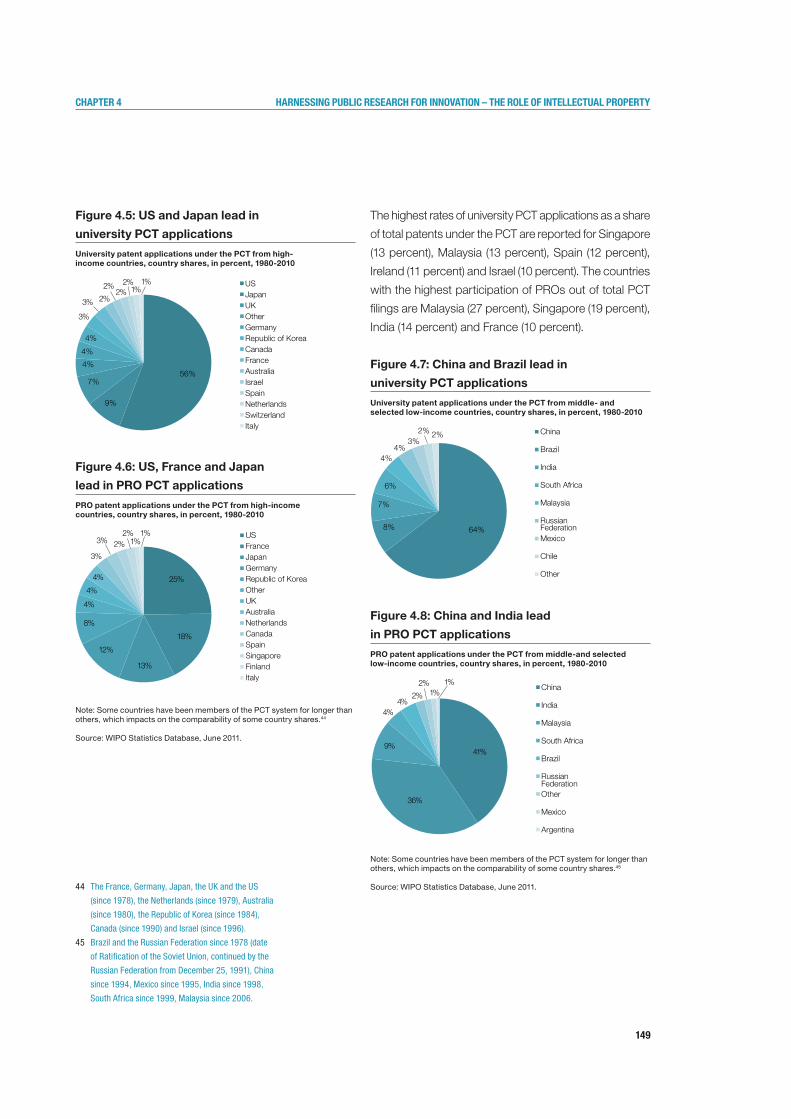
149
Chapter 4 harnessing publiC researCh for innovation – the role of intelleCtual property
Figure 4.5: US and Japan lead in
university PCT applications
University patent applications under the PCT from high-income countries, country shares, in percent, 1980-2010
Figure 4.6: US, France and Japan
lead in PRO PCT applications
PRO patent applications under the PCT from high-income countries, country shares, in percent, 1980-2010
Note: Some countries have been members of the PCT system for longer than others, which impacts on the comparability of some country shares.44
Source: WIPO Statistics Database, June 2011.
The highest rates of university PCT applications as a share
of total patents under the PCT are reported for Singapore
(13 percent), Malaysia (13 percent), Spain (12 percent),
Ireland (11 percent) and Israel (10 percent). The countries
with the highest participation of PROs out of total PCT
filings are Malaysia (27 percent), Singapore (19 percent),
India (14 percent) and France (10 percent).
Figure 4.7: China and Brazil lead in
university PCT applications
University patent applications under the PCT from middle- and selected low-income countries, country shares, in percent, 1980-2010
Figure 4.8: China and India lead
in PRO PCT applications
PRO patent applications under the PCT from middle-and selected low-income countries, country shares, in percent, 1980-2010
Note: Some countries have been members of the PCT system for longer than others, which impacts on the comparability of some country shares.45
Source: WIPO Statistics Database, June 2011.
US Japan UK Other Germany Republic of Korea Canada France Australia Israel Spain Netherlands Switzerland Italy
56%
9%
7%
4%
4%
4%
3%
3% 2%
2% 2%
2% 1% 1%
25%
18%
13%
12%
8%
4%
4%
4%
3%
3% 2% 2%
1% 1% US
France Japan Germany Republic of Korea Other UK Australia Netherlands Canada Spain Singapore Finland Italy
64% 8%
7%
6%
4% 4%
3% 2% 2% China
Brazil
India
South Africa
Malaysia
Russian Federation Mexico
Chile
Other
41%
36%
9%
4% 4%
2%
2% 1% 1%
China
India
Malaysia
South Africa
Brazil
Russian Federation Other
Mexico
Argentina
44 The France, Germany, Japan, the UK and the US
(since 1978), the Netherlands (since 1979), Australia
(since 1980), the Republic of Korea (since 1984),
Canada (since 1990) and Israel (since 1996).
45 Brazil and the Russian Federation since 1978 (date
of Ratification of the Soviet Union, continued by the
Russian Federation from December 25, 1991), China
since 1994, Mexico since 1995, India since 1998,
South Africa since 1999, Malaysia since 2006.
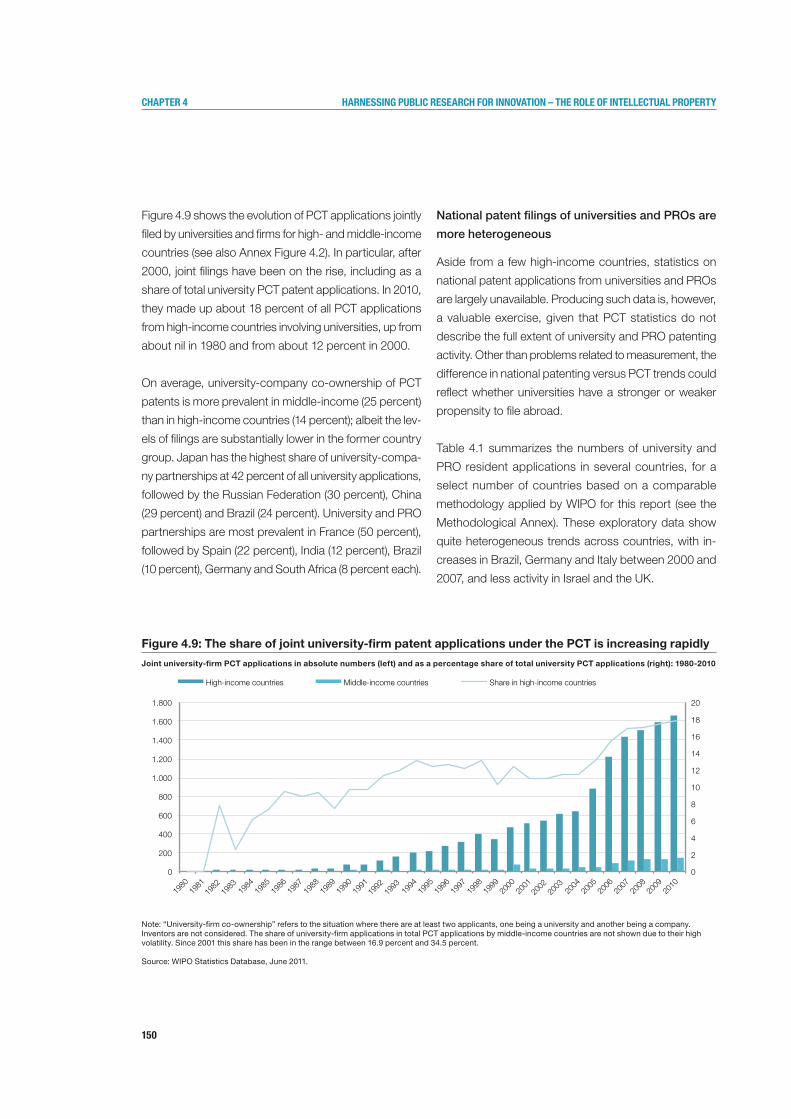
150
Chapter 4 harnessing publiC researCh for innovation – the role of intelleCtual property
Figure 4.9 shows the evolution of PCT applications jointly
filed by universities and firms for high- and middle-income
countries (see also Annex Figure 4.2). In particular, after
2000, joint filings have been on the rise, including as a
share of total university PCT patent applications. In 2010,
they made up about 18 percent of all PCT applications
from high-income countries involving universities, up from
about nil in 1980 and from about 12 percent in 2000.
On average, university-company co-ownership of PCT
patents is more prevalent in middle-income (25 percent)
than in high-income countries (14 percent); albeit the lev-
els of filings are substantially lower in the former country
group. Japan has the highest share of university-compa-
ny partnerships at 42 percent of all university applications,
followed by the Russian Federation (30 percent), China
(29 percent) and Brazil (24 percent). University and PRO
partnerships are most prevalent in France (50 percent),
followed by Spain (22 percent), India (12 percent), Brazil
(10 percent), Germany and South Africa (8 percent each).
National patent filings of universities and PROs are
more heterogeneous
Aside from a few high-income countries, statistics on
national patent applications from universities and PROs
are largely unavailable. Producing such data is, however,
a valuable exercise, given that PCT statistics do not
describe the full extent of university and PRO patenting
activity. Other than problems related to measurement, the
difference in national patenting versus PCT trends could
reflect whether universities have a stronger or weaker
propensity to file abroad.
Table 4.1 summarizes the numbers of university and
PRO resident applications in several countries, for a
select number of countries based on a comparable
methodology applied by WIPO for this report (see the
Methodological Annex). These exploratory data show
quite heterogeneous trends across countries, with in-
creases in Brazil, Germany and Italy between 2000 and
2007, and less activity in Israel and the UK.
Figure 4.9: The share of joint university-firm patent applications under the PCT is increasing rapidly
Joint university-firm PCT applications in absolute numbers (left) and as a percentage share of total university PCT applications (right): 1980-2010
Note:“University-firmco-ownership”referstothesituationwherethereareatleasttwoapplicants,onebeingauniversityandanotherbeingacompany.Inventors are not considered. The share of university-firm applications in total PCT applications by middle-income countries are not shown due to their high volatility. Since 2001 this share has been in the range between 16.9 percent and 34.5 percent.
Source: WIPO Statistics Database, June 2011.
0
2
4
6
8
10
12
14
16
18
20
0
200
400
600
800
1.000
1.200
1.400
1.600
1.800
1980
1981
1982
1983
19
84
1985
1986
1987
1988
1989
1990
1991
1992
1993
19
94
1995
1996
1997
1998
1999
2000
2001
2002
2003
20
04
2005
2006
2007
2008
2009
2010
High-income countries Middle-income countries Share in high-income countries

151
Chapter 4 harnessing publiC researCh for innovation – the role of intelleCtual property
resident university and Pro patent applications for selected countries, 2000-2007
Country Institution 2000 2001 2002 2003 2004 2005 2006 2007
Germany University 231 240 357 487 509 563 670 647
PRO 385 396 482 466 589 580 622 618
UK University 897 942 971 911 770 803 824 734
PRO 186 192 135 125 72 83 89 83
Brazil University 60 65 162 176 187 233 246 325
PRO 20 10 27 39 32 26 25 39
Italy University 66 108 62 26 139 133 186 197
PRO 52 78 30 19 35 38 41 21
Israel University 61 77 112 66 36 21 68 70
PRO 10 9 13 6 5 4 8 8
Table 4.1: National university and PRO
patent filings for selected countries
Note: These calculations only concern countries for which the Patstat database is reasonably complete for specific years.46
Source: WIPO, based on the Worldwide Patent Statistical Database (Patstat) of the European Patent Office (EPO), July 2011.
According to available national reports or studies, resident
university and PRO applications in France almost doubled
between 1996 and 2004, reaching 724 applications.47 In
Japan, the number of resident university applications filed
stood at 7,151 in 2009 (compared to 1,089 in 2000).48 In
the Republic of Korea, 9,980 university resident applica-
tions were filed in 2008, a compound annual growth rate
of 41 percent since 2000.49 In China, resident university
patent applications grew to 17,312 in 2006, a compound
annual growth rate of 44 percent since 2000, representing
about 14 percent of total resident applications which is
far superior to other countries. Analysis of Chinese uni-
versity patenting from 1998 to 2008 shows a significant
overall increase, making Chinese universities some of
the most active in the world. This can be explained in
part by government grants to research institutes and to
universities filing a large number of patent applications,
and related initiatives.50
Patents granted to US universities – which cannot be
directly compared to the above figures on application –
amounted to between 3,000 and 3,500 per year in the
period 1998-2008, and declined from 3,461 in 2000 to
3,042 in 2008 (about 4 percent of total resident patents
granted in 2008).51 US universities started patenting at
a much earlier phase and, given the volume of private
sector patenting, the university share stands at about 5
percent of total resident patents granted in 2008.
Figure 4.10 depicts the share of university and PRO
resident applications out of total national resident ap-
plications for selected countries. The countries with the
largest share of university applications are China (13.4
percent), Spain (13.2 percent), Mexico (12.6 percent), and
Morocco (11.2 percent).52 The countries with the largest
share of PRO resident applications are India (21 percent,
based on unofficial data), Mexico (9.5 percent), China (7.2
percent) and France (3.6 percent).53
46 The discrepancy between the number of published
resident applications (country totals) according
to Patstat 2011 and WIPO’s Statistics Database
on aggregate resident applications filed (for the
period 2000-2007) is: -21.8 percent for Germany,
-29.2 percent for the UK, -3.1 percent for Brazil,
-16 percent for Italy and -17.3 percent for Israel.
The WIPO Statistics Database does not provide
numbers for Italy for the period 2001-2006.
47 See Inspection générale des finances (2007).
The number excludes filings at the EPO.
48 See Japan Patent Office (2010).
49 See Korean Ministry of Knowledge Economy (2010).
50 See Luan et al. (2010).
51 See NSF (2010). On average, and for all patents
not limited to universities, about 42 percent of
applications filed are granted by the United States
Patent and Trademark Office (USPTO). See European
Patent Office, Japan Patent Office, Korean Intellectual
Property Office and USPTO (2009), “Four Office
Statistics Report”, available at:
www.trilateral.net/statistics/tsr/fosr2009/report.pdf.52 It is interesting to compare those numbers
with the ones from PCT filings for the same
periods. They are almost identical for Spain
(14.1 percent), Mexico (7.8 percent), China
(5.6 percent) and Morocco (3.6 percent).
53 In comparison, those shares for the same periods
for PCT data are 18.3 percent for India, 2.5
percent for Mexico, 2.8 percent for China and
10.3 percent for France. Note that the data for
the French report is an average for three years
(one before, one after and the reported year).
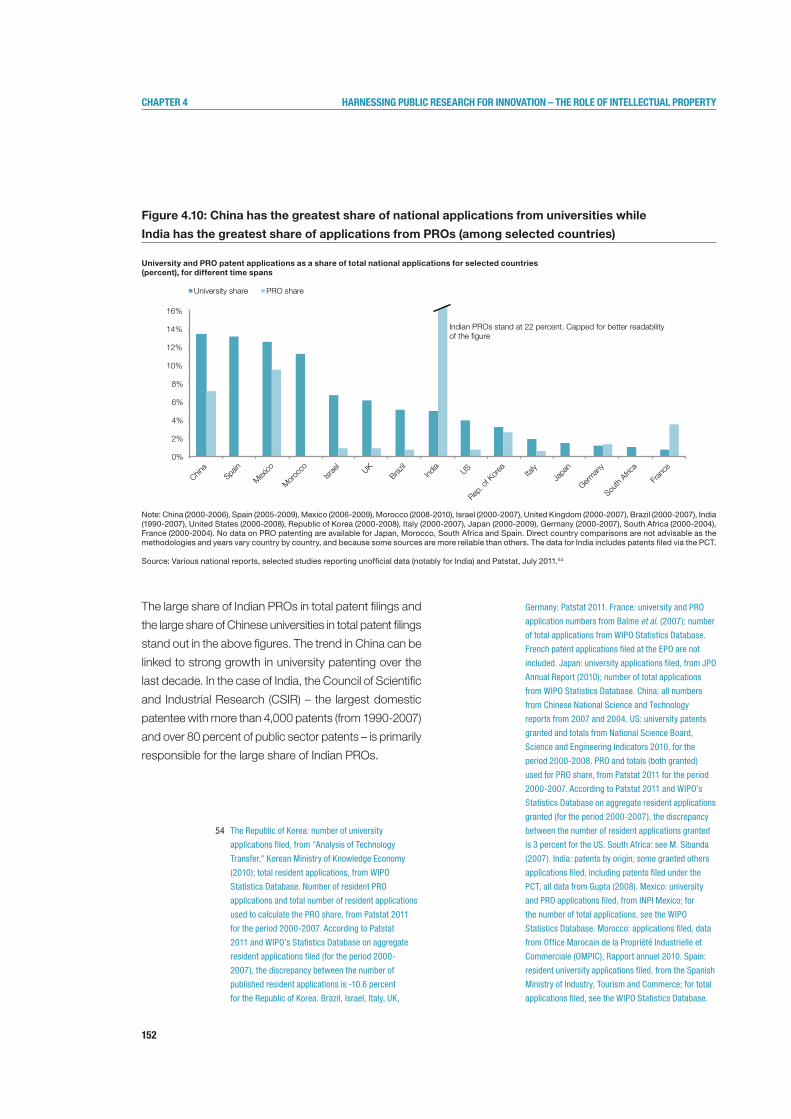
152
Chapter 4 harnessing publiC researCh for innovation – the role of intelleCtual property
The large share of Indian PROs in total patent filings and
the large share of Chinese universities in total patent filings
stand out in the above figures. The trend in China can be
linked to strong growth in university patenting over the
last decade. In the case of India, the Council of Scientific
and Industrial Research (CSIR) – the largest domestic
patentee with more than 4,000 patents (from 1990-2007)
and over 80 percent of public sector patents – is primarily
responsible for the large share of Indian PROs.
Germany: Patstat 2011. France: university and PRO
application numbers from Balme et al. (2007); number
of total applications from WIPO Statistics Database.
French patent applications filed at the EPO are not
included. Japan: university applications filed, from JPO
Annual Report (2010); number of total applications
from WIPO Statistics Database. China: all numbers
from Chinese National Science and Technology
reports from 2007 and 2004. US: university patents
granted and totals from National Science Board,
Science and Engineering Indicators 2010, for the
period 2000-2008. PRO and totals (both granted)
used for PRO share, from Patstat 2011 for the period
2000-2007. According to Patstat 2011 and WIPO’s
Statistics Database on aggregate resident applications
granted (for the period 2000-2007), the discrepancy
between the number of resident applications granted
is 3 percent for the US. South Africa: see M. Sibanda
(2007). India: patents by origin, some granted others
applications filed, including patents filed under the
PCT, all data from Gupta (2008). Mexico: university
and PRO applications filed, from INPI Mexico; for
the number of total applications, see the WIPO
Statistics Database. Morocco: applications filed, data
from Office Marocain de la Propriété Industrielle et
Commerciale (OMPIC), Rapport annuel 2010. Spain:
resident university applications filed, from the Spanish
Ministry of Industry, Tourism and Commerce; for total
applications filed, see the WIPO Statistics Database.
54 The Republic of Korea: number of university
applications filed, from "Analysis of Technology
Transfer," Korean Ministry of Knowledge Economy
(2010); total resident applications, from WIPO
Statistics Database. Number of resident PRO
applications and total number of resident applications
used to calculate the PRO share, from Patstat 2011
for the period 2000-2007. According to Patstat
2011 and WIPO’s Statistics Database on aggregate
resident applications filed (for the period 2000-
2007), the discrepancy between the number of
published resident applications is -10.6 percent
for the Republic of Korea. Brazil, Israel, Italy, UK,
Figure 4.10: China has the greatest share of national applications from universities while
India has the greatest share of applications from PROs (among selected countries)
University and PRO patent applications as a share of total national applications for selected countries(percent), for different time spans
Note: China (2000-2006), Spain (2005-2009), Mexico (2006-2009), Morocco (2008-2010), Israel (2000-2007), United Kingdom (2000-2007), Brazil (2000-2007), India (1990-2007), United States (2000-2008), Republic of Korea (2000-2008), Italy (2000-2007), Japan (2000-2009), Germany (2000-2007), South Africa (2000-2004), France (2000-2004). No data on PRO patenting are available for Japan, Morocco, South Africa and Spain. Direct country comparisons are not advisable as the methodologies and years vary country by country, and because some sources are more reliable than others. The data for India includes patents filed via the PCT.
Source:Variousnationalreports,selectedstudiesreportingunofficialdata(notablyforIndia)andPatstat,July2011.54
0%
2%
4%
6%
8%
10%
12%
14%
16%
China
Spain
Mexico
Moroc
co
Israe
l UK
Brazil
India US
Rep. o
f Kor
ea
Italy
Japa
n
German
y
South
Africa
Fran
ce
University share PRO share
Indian PROs stand at 22 percent. Capped for better readability of the gure

153
Chapter 4 harnessing publiC researCh for innovation – the role of intelleCtual property
Technological fields of university and PRO patenting
Overall, university and PRO patenting primarily concerns
biomedical inventions and pharmaceuticals, broadly de-
fined. This is true of high-income and other economies
alike. The result is not surprising as these industries are
the most science-driven. However, whether patenting in
these technological fields is demand- or supply-driven
is less clear.
On the basis of PCT data, it can be shown that, for the
period 1980-2010, university patenting was largely limited
to a few fields, including the following major areas for
both high- and middle-income countries: biotechnol-
ogy, with 22 percent of all university applications in
high-income countries and 18 percent in middle-income
countries; pharmaceuticals, with 15 percent in high-
and 14 percent in middle-income countries; medical
technology, with 8 percent in high- and 5 percent in
middle-income countries; organic fine chemistry, with
6 percent in high- and middle-income countries; and
measurement technologies, with 6 percent in high- and
middle-income countries.
For PRO applications, during the same period the most
prominent technological fields in high-income countries
were biotechnology (21 percent), pharmaceuticals (10
percent), measurement technologies (8 percent), organic
fine chemistry (5 percent) and analysis of biological mate-
rials (5 percent). For middle-income countries, the largest
share of PRO applications related to pharmaceuticals (17
percent), organic fine chemistry (17 percent), biotechnol-
ogy (14 percent), basic materials chemistry (5 percent)
and digital communications (5 percent).
The available data on national patent filings – based
on Patstat and the WIPO methodology – confirm this
trend. For the period 1989-1998, 287 university applica-
tions (resident and non-resident) were published by the
Brazilian patent office, with the two largest fields being
pharmaceuticals and biotechnology.
4.2.3University and PRO licensing growing but from low levels
Few indicators exist for assessing the scale of university
commercialization and related impacts.
The most widely used indicators for measuring university
technology transfer are the number of licenses issued and
the associated income. These data are only available for
a few countries, are often based on non-governmental
surveys using varying methodologies and schedules, and
are largely confined to universities without covering PROs.
Broadly speaking, the data tend to support the view that
university and PRO licenses and related income are grow-
ing from low levels. However, outside the US, both are
still relatively modest compared to the number of patents
filed by public research institutions, or compared to their
income from R&D contracts and consulting or their R&D
expenditure. Furthermore, while licensing revenue has
been increasing, it has been largely driven by a few in-
stitutions in a few sectors – notably the pharmaceuticals,
biomedical and software sectors – and mostly by a few
specific patents. As shown below, however, in particular in
Table 4.2, this is diversifying. Finally, universities and PROs
often seem to generate more income from non-patent
licensing relating to biological materials or know-how and
from copyrighted materials.
• Licensing incomehasgrownconsistently inboth
Canada and the US (see Table 4.2, which also notes
that this growth is partly explained by the growth in
reporting institutions). Five institutions were respon-
sible for 53 percent of all reported licensing income in
1991, 48 percent in 2000 and 33 percent in 2009. In
the light of the discussion in Section 4.3 on the impact
of exclusive licenses on innovation, it is important
to note that the majority of licenses in the US and
Canada are non-exclusive (1,682 exclusive versus
2,595 non-exclusive licenses in the US, and 177 out
of 317 in Canada, both for 2009).

154
Chapter 4 harnessing publiC researCh for innovation – the role of intelleCtual property
Table 4.2: Canadian and US university
technology transfer: 1991-2009
Note: As shown above, the number of reporting institutions has grown throughout the selected time period and, in particular, in the 1990s. The totals shown reflect the growth of reporting institutions plus growth in the number of reporting universities. Aside from universities, the above numbers also cover hospitals and research centers, but exclude institutions that reply anonymously.
Source: Statistics Access for Tech Transfer (STATT), database of the US Association of University Technology Managers (AUTM), May 2011.
• AccordingtoasurveyofAustralia,theamountofin-
come from licenses, options and assignments stood
at USD 246 million in 2009.56 One patent filed by the
Commonwealth Scientific and Industrial Research
Organization generated the majority of this income.
• AccordingtoasurveyofSwitzerland,abouthalfof
institutions surveyed provide data on licensing income,
which amounted to USD 7.55 million in 2009.57
• AccordingtoasurveyofSpain,thenumberoflicenses
executed grew to 190 in 2007, and income increased
from about EUR 1.69 million in 2003 to EUR 1.98 mil-
lion in 2007.58
• InFrance,theamountoflicensingrevenueisreported
to be modest and concentrated in a few patents and
institutions. It has not grown much since the com-
mercialization of university technologies became a
declared policy objective in the late 1980s.59
On average, university and PRO licensing income is still
marginal compared to total university and PRO funding
or research expenditure. Table 4.3 shows the ratio of
licensing income per dollar spent on R&D. The small
size of licensing revenue in Europe in comparison to the
US has been highlighted.60 However, this is also related
to measurement issues concerning the identification of
university and PRO patents (see Box 4.3) and different
approaches to technology transfer.61
Year 1991 2001 2002 2005 2006 2007 2008 2009
Reporting institutions(Canada/US)
9/841 27/169 31/181 33/180 39/182 37/187 35/184 36/175
number of licenses and options55 executed
Canada 570 462 675 620 690
US 4,648 4,678 4,882 4,993 5,214
licensing income (in million US dollars)
Canada 3.3 42.1 32.8 43.7 56.6 58.6 53.9 52.1
US 162.2 1,039.3 1,175.3 1,927.3 1,854.0 2,656.4 3,410.4 2,277.7
55 An option agreement gives potential licensees a
certain amount of time to evaluate the technology
and to discuss and arrange a licensing agreement.
56 Based on the OECD exchange rate for 2009: Australian
Dollar (AUD) 1.282 for USD 1. See Commonwealth
of Australia (2011). Seventy-two publicly-funded
research organizations responded to the survey,
including universities, medical research institutes,
publicly-funded research agencies. Definitions as
per the report: “A license agreement formalizes the
granting of IP rights between two parties where
the owner of the IP (the licensor) permits the other
party (the licensee) to have access to and the
right to use the IP. An option agreement grants the
potential licensee a period during which it may
evaluate the IP and negotiate the terms of a licensing
agreement. An assignment agreement conveys
all rights, title and interest in and to the licensed
subject matter to the named assignee.” The data for
Europe are derived from the Association of European
Science and Technology Transfer Professionals
(ASTP) survey. It is similar to the AUTM and NSRC
surveys and covers approximately 100 research
institutions from up to 26 European countries.
57 Based on the OECD exchange rate for 2009: Swiss
Francs (CHF) 1.086 for USD 1. The respondents to
the survey were 7 cantonal universities, 2 federal
institutes of technology, 6 universities of applied
sciences and 3 related research institutions in
the ETH domain. About half of the participants in
the survey provided data on licensing income.
58 See RedOTRI (2008). The Spanish Network
of University Knowledge Transfer Offices
(RedOTRI) provides information on Spanish
university inventions. In 2007, the network had
62 member universities. There were 44 valid
answers on royalties from licenses for 2007.
59 See Inspection générale des finances (2007).
60 See Conti and Gaulé (2011).
61 Idem.
155
Chapter 4 harnessing publiC researCh for innovation – the role of intelleCtual property
2000 2001 2002 2003 2004 2005 2006 2007 2008 2009
Australia 2.8 2.0 1.9 1.6 1.3 1.3 2.1 3.6 1.5 4.1
Canada 1.8 2.3 1.6 1.6 1.4 1.2 1.4 1.2 1.0 -
europe - - - - 3.2 3.2 0.4 1.0 1.3 -
UK 0.6 1.1 1.1 1.1 1.5 1.3 1.3 1.4 2.1 -
US 4.8 3.4 3.5 3.4 3.4 5.3 5.3 5.5 6.6 6.5
Table 4.3: Ratio of income from “IP
licenses, options and assignments” to total
research expenditure, 2000 to 2009
Note: The methodology is described in the report below. See footnote 56 for definitions.Here,“Europe”includes26countriesbutnottheUK.62
Source: Commonwealth of Australia (2011).
In middle- and low-income countries, data on university
technology transfer are even scarcer. All existing stud-
ies, however, point to the nascent stage of IP and its
commercialization which is limited to a few patents and
patenting institutions.63
The scarcity of information also suggests that patents are
used much less for technology transfer, due in part also
to a lack of a culture and institutions supporting formal
IP-based technology transfer in these countries, and
weak research activity with few technology applications.
Also in these countries, other forms of IP and know-
how are more commonly used to transfer knowledge
to businesses.
• AstudysurveyingselectedLatinAmericanuniversities
reports that 17 out of the 56 universities surveyed in
Argentina, Brazil, Colombia, Chile and Mexico have
licensed some type of IP.64 This mostly concerns
designs, know-how or secrets, rather than patents.
• InChina,8.7percentofpatentsgrantedtohigher
education institutions were licensed out in 2007,
contributing only a minor share to total revenue but,
admittedly, representing a very large figure in absolute
terms.65 One study concludes that patent licensing is
underutilized, compared to the very large amount and
the high growth of Chinese university patenting (see
Section 4.2.2).66
• InSouthAfrica,mostuniversitiesreceivednorev-
enue from their patents, other than the Council for
Scientific and Industrial Research, the University of
Johannesburg and North-West University.67
Table 4.4: Technology transfer activity by
Chinese higher education institutions, 2000-2007
Source: Wu (2010).
2000 2001 2002 2003 2004 2005 2006 2007
number of patents licensed and sold 299 410 532 611 731 842 701 711
as a percentage of patents granted to higher education institutions 45.9 70.8 76.3 35.3 21 18.9 11.3 8.7
as a percentage of university r&d revenue 2.3 2.6 1.7 2.3 1.5 1.3 1.1 1.4
62 The European data are derived from the Association
of European Science and Technology Transfer
Professionals (ASTP) survey, which is similar to
the AUTM and NSRC surveys. The ASTP survey
covers about 100 research institutions from
up to 26 European countries. Where reported,
the ASTP data exclude UK institutions.
63 See Dalmarco and Freitas (2011).
64 See PILA Network (2009).
65 See Wu (2010).
66 See Luan et al. (2010) and Sibanda (2009).
67 See Sibanda (2009).

156
Chapter 4 harnessing publiC researCh for innovation – the role of intelleCtual property
4.3Assessment of impacts and challenges in high-income countries
A large body of economic literature has assessed the effi-
ciency and impacts of university patenting in high-income
countries. Research now also focuses on PRO patenting.
The studies aim to identify the impacts of increased uni-
versity IP technology transfer and examine the optimal
design of policies and the institutions that carry them
out. A first set of studies has mapped various linkages
between universities and industry and explored the use
of patents in such transactions.68 Since then, a second
stream of research has moved from universities and firms
to a more disaggregated level, often studying the effects
of patenting on the behavior of individual academics.
4.3.1Direction of impacts
The literature is divided as to the impacts of IP-based
technology transfer laws and practices.
Conceptually, the question is whether an exclusive system
based on university patenting is the optimal approach
for driving business innovation and, at the same time,
preserving the science system.69
The various impacts discussed in the literature are set out
in Tables 4.5 and 4.6. They distinguish possible benefits
and costs for the two respective main agents – firms
and public research institutions – and broader systemic
impacts on science, the economy and society.
On the one hand, economists have argued that allowing
universities and PROs to patent inventions enables them
to “reveal their inventions” while improving incentives for
firms to develop and commercialize them further, and
creating a “market” for university and PRO inventions.70
The rationale behind this argument is that inventions
developed by universities are often embryonic and need
further development in order to be useful. Firms will be
reluctant to invest in further development if these inven-
tions and the resulting products can be appropriated
by third parties, as well as if there is legal uncertainty
regarding the ownership of results. In many cases, they
will want to obtain an exclusive license. For universities
and PROs, the benefits may include increased revenue,
more contractual research and greater cross-fertilization
between entrepreneurial faculty and industry. TTOs or
other intermediaries lead to a division of tasks by un-
dertaking IP administration and commercialization, thus
contributing to a new form of technology market. This
IP-based technology transfer is meant to lead to a bet-
ter use of research results, different forms of academic
entrepreneurship and therefore improved economic and
social development.68 See Gulbrandsen et al. (2011).
69 See Foray and Lissoni (2010).
70 See Mowery et al. (2001).
157
Chapter 4 harnessing publiC researCh for innovation – the role of intelleCtual property
This can bring about the following benefits (see also
Tables 4.5 and 4.6):
• Foruniversities,thisset-upcanleadto(i)increasedIP
ownership, facilitating academic and other entrepre-
neurship (including academic spin-offs) and vertical
specialization; (ii) cross-fertilization between faculty
and industry; and (iii) increased student intake and
ability to place students in firms.
• Forfirms,it(i)facilitatestherevelationofusefuluniver-
sity inventions to the business sector; (ii) enables the
creation of a market for inventions based on publicly-
funded research; and (iii) can spur the commercializa-
tion of new products generating profits and growth.
• Positivesystemicoutcomescouldinclude(i)increased
impact of more research with the potential for appli-
cation; (ii) improved innovation system linkages; (iii) a
higher quality of research and education, in particular
for science; (iv) greater commercialization of inven-
tions; (v) positive impacts on entrepreneurship and
local jobs; and (vi) for the wider economy, greater
competitiveness in the global market.
On the other hand, it has been argued that patents are
not necessary to provide incentives for university scien-
tists and engineers to invent and to disclose inventions.
It is also argued that university and PRO patents do not
necessarily facilitate the collaboration between public
research institutions and firms.71
According to this view, university research has been asso-
ciated with the norms of rapid disclosure of research results
and an environment of knowledge sharing, co-authorship
and joint projects which contribute to cumulative learning.
The patenting of university inventions and related conflicts
of interest might, however, have negative influences on
these norms; slow the diffusion of university inventions, in-
cluding research tools; and stifle innovation.72 The exclusive
licensing of patents to single firms might, in particular, limit
the diffusion of knowledge generated with public funds.
Potential benefits Potential costs (or investment)
Universities and Pros 1) Increased IP ownership facilitating entrepreneurship and vertical specialization
• Reinforcingotherpoliciesaimedatacademicentrepreneurship (e.g., enhancing access to finance)
• Licensingandotherrevenues(e.g.,consulting)can be invested in research
2) Cross-fertilization between faculty and industry• Intangiblebenefitstouniversityreputationandthequalityofresearch• Helpingtoidentifyresearchprojectswithadual
scientific and commercial purpose
3) Increased student intake and ability to place students in firms
1) diversion of time away from academic research• Distortingincentivesforscientistsandpotentiallyalso
for the nature of public-oriented institutions• Reorganizinguniversityprocessesandculture
with a view to commercialization
2) IP-related establishment and maintenance costs• EstablishingandmaintainingaTTOandrelatedIPmanagement,
including investment in expertise and human resources• SpendingtimeonIPfilingsandtechnology
transfer (even if contracted out to a TTO)• Additionalfinancialandreputationalcosts
associated with defense of IP rights
Firms 1) Facilitates the revelation of useful university inventions to the business sector
• Enablingfirmstohaveaccesstotopscientistsandtocollaborate with the scientific community in developing innovation within a clear contractual setting
2) enables the creation of a market for ideas and contracting with universities
• Frameworkdiminishestransactioncostsandincreaseslegal certainty, facilitating investment by private sector
• Securinganexclusivelicenseincreasesincentives for further investment
• Abilitytospecializeiscompetitiveadvantage(verticalspecialization)
3) Commercialization of new products generating profits and growth
1) barriers to access of university inventions• Precludesfreeaccesstouniversityinventions–including
the more basic research fields and research tools, except where research is the result of a sponsored contract
• Lackofaccessifanotherfirmhassecuredanexclusivelicense
2) IP-based transaction costs and tensions in industry-university relationships
• Universityscientistslackanunderstandingofdevelopmentcosts and market needs (cognitive dissonance) leading to higher probability of bargaining breakdown
• IPnegotiationscaninterferewithestablishmentofjointR&D and university-industry relations, where universities act as revenue maximizer with strong stance on IP
Table 4.5: Impacts of IP-based technology transfer policies on universities/PROs and firms
71 See David (2004) and Dasgupta and David (1994).
72 See Eisenberg (1989); Heller and Eisenberg
(1998); and Kenney and Patton (2009). The latter
authors note that the institutional arrangements
within which TTOs are embedded have
encouraged some of them to become revenue
maximizers rather than facilitators of technology
dissemination for the good of the entire society.

158
Chapter 4 harnessing publiC researCh for innovation – the role of intelleCtual property
Critics also suggest that IP-based technology transfer by re-
search institutions limits the diversity of research that would
otherwise be pursued by follow-on innovators. The decline
in the intensity and diversity of research has made for rather
minimal income prospects for institutions themselves.
Moreover, a strong stance on IP by universities and PROs
might negatively impact other knowledge transfer channels
– such as informal knowledge exchanges with the private
sector and fellow scientists, as well as more formal R&D
collaboration – due to the complexity of negotiating IP rights.
The following costs may arise (see also Tables 4.5 and 4.6):
• Foruniversities,thisset-upcanleadto(i)adiversion
of time away from scientific research; and (ii) IP-related
establishment and maintenance costs (which can
howere also be seen as an investment).
• Forfirms,thiscouldresult in(i)potentialbarriersto
access of university inventions; and (ii) increased
IP-based transaction costs and tensions in industry-
university relationships.
• Negativesystemicimpactscouldinclude(i)areorienta-
tion of the direction of research towards less diversity
and an overemphasis on short-term, commercially-
oriented research; (ii) negative impacts on open sci-
ence; (iii) prospects of reduced government funding
for public research, for science and for the economy
more widely; (iv) long-run negative effect of diverting
attention away from academic knowledge production;
(v) long-run negative effects of IP on open science and
follow-on innovation; and, finally, (vi) the fact that IP
might inhibit rather than promote commercialization
of inventions.
Potential benefits Potential costs
broader impacts on science
1) Increased impact of more focused research with potential for application
2) Improved innovation system linkages• Efficientdivisionoflaborinthegenerationand
commercialization of new inventions• Privatesectorcontributiontofundingbasicandappliedresearch
3) Increase in the quality of research and education
1) reorientation of the direction of research• Overemphasisonapplied,short-term,morelucrativeresearch• Lessdiversityinscientificdisciplinesasfocus
on patentable outcomes increases• Otheruniversitymissionsareneglected,suchasteachingandtraining
2) negative impacts on open science• Crowdsout/displacestheuseofotherknowledge
transfer channels to industry• Publicationdelays,increasedsecrecy,less
sharing, including the withholding of data• Decreaseininternationalscientificexchanges
3) The promise of university income can reduce government commitment to funding
Innovation and growth
1) Commercialization of inventions with economic and social impacts• Increaseinconsumerwelfareandbusinessproductivity
via access to innovative products and processes
2) (localized) positive impacts on r&d, technology spillovers, entrepreneurship, employment and growth
3) Higher competitive position of country in global market
1) long-run negative effect of diverting attention away from academic knowledge production
2) long-run negative effects of IP on open science and follow-on innovation
• Patentingofbroadupstreaminventions,platformtechnologiesandresearch tools increases the cost of follow-on research and innovation
• Reductioninthediversityofresearch
3) Focus on IP might inhibit rather than promote commercialization of inventions
Table 4.6: Systemic impacts of IP-based technology transfer policies
159
Chapter 4 harnessing publiC researCh for innovation – the role of intelleCtual property
4.3.2Impacts and experiences in high-income countries
This section sets out the key lessons learned from the
experiences of high-income countries and the associated
economic literature.73
The evidence confirms the potential benefits mentioned
in the previous subsection. University and PRO patenting
and efficient technology transfer policies and institutions
are an important precondition for increasing opportuni-
ties for commercializing university inventions (see Table
4.5). Access to early stage university research is critical
to firms, in particular in the science-intensive sectors.
Turning university ideas into innovation requires substan-
tial development by the private sector and the involvement
of academic inventors, lending credence to the motive
behind such patent-based policies.74
The evidence also suggests a synergy among a wide
range of traditional academic, entrepreneurial and pat-
enting activity of scientists as well as interaction with
the private sector.75 It also confirms the complementary
nature of the different technology transfer channels. Firms
that actively engage with public research institutions, both
through informal exchanges – such as at scientific confer-
ences – and formally-organized knowledge exchanges
– such as in R&D collaboration – are also likely to license
more inventions from universities. They may also engage
intensively with faculty to further develop inventions as
the tacit knowledge involved in an invention is important
in turning it into a commercial innovation.
Yet, the literature and information on past experiences
do not easily lend themselves to a complete cost-benefit
analysis of the above impacts, which could be easily
generalized across sectors and countries with very dif-
ferent characteristics. The literature does not send an
unambiguously clear message on the most adequate
ownership model, i.e., whether the university-ownership
model is superior to one in which faculty retains own-
ership of inventions, or to other models.76 Finally, the
long-term implications of patenting on science are also
still under discussion.
One reason for this incomplete cost-benefit analysis
is that these policies, institutional practices and their
implementation are still relatively young, in particular
outside the US.
In addition, however, two other interrelated factors compli-
cate the evaluation of policy initiatives aimed at IP-based
university technology transfer.
i) Definitional and measurement challenges: So far,
mostly IP-based indicators have been used to evalu-
ate university technology transfer. However, surveys of
patenting and licensing activity – undertaken by national
governments, multilaterally, or by PROs themselves – are
rare.77 Often they tend to underestimate the number of
university inventions and the broader impacts of university
technology transfer (see Box 4.3).78
73 See Baldini (2006) and Larsen (2011).
74 See Goldfarb et al. (2011); Goldfarb et al. (2001);
and Jensen and Thursby (2001).
75 See Boardman and Ponomariov (2009).
76 Kenney and Patton (2009) argue that the university-
ownership model is neither optimal in terms
of economic efficiency nor for advancing the
interest of rapidly commercializing technology and
encouraging entrepreneurship. They maintain that
this model is plagued by ineffective incentives,
information asymmetries and contradictory
motivations for universities, inventors, potential
licensees and university TTOs. These structural
uncertainties can lead to delays in licensing,
misaligned incentives among parties and obstacles
to the flow of scientific information and the
materials necessary for scientific progress.
77 See OECD (2003).
78 See Aldridge and Audretsch (2010).
160
Chapter 4 harnessing publiC researCh for innovation – the role of intelleCtual property
Furthermore, the drivers of successful commercializa-
tion of academic research – whether via licensing or an
academic spin-off – and the different vectors of university-
industry knowledge transfer are numerous. However, no
framework exists for measuring and evaluating these
knowledge transfers, their interactions and the role of
various policies to spur them on.79 In this data context,
and given the unique conditions of particular institutions
and countries, the ability to draw clear causal conclu-
sions concerning the effect of a particular IP-based
technology transfer policy on the commercialization of
academic research or on wider economic indicators is
limited. Furthermore, caution needs to be exercised in
generalizing particular case-specific findings to other
institutions, disciplines or countries.
ii)Benchmarkingagainstappropriatealternatives:
It is vital to benchmark outcomes resulting from new
IP-based technology transfer policies against realistic
alternatives or a careful assessment of the status quo.
Often, new outcomes are benchmarked against sce-
narios that entail a perfect “open science” system with
rapid knowledge diffusion and strong incentives to in-
novate. Arguably, in most cases the policy alternatives
are less favorable. For a start, the science system itself
is also prone to malfunction, in particular with regard
to internal communication and its efficacy in helping to
spur innovation, and the resulting economic and social
development. Furthermore, with or without IP-based
technology transfer models, the linkages between dif-
ferent actors in national innovation systems are rarely
perfect and mostly deserve policy attention.
Moreover, the introduction of formal IP ownership models
for universities and PROs is often not responsible for
the formation of IP rights to begin with. To the contrary,
their objective is to further clarify existing IP ownership
in order to facilitate follow-on transactions. Specifically,
the alternative, existing settings are often of the following
nature: (1) unclear ownership rules lacking incentives to
further develop inventions, as was previously the case in
high-income countries and as is still often the case in less
developed economies; (2) governments own the title to
inventions emanating from publicly-funded research, as
was previously the case in the US; (3) faculty members
own the title, as was previously the case in Europe; or
(4) particular firms solely own the title resulting from joint
university-industry projects. Compared to the introduc-
tion of IP-based technology transfer practices, these
scenarios mostly provide less legal certainty as to owner-
ship of inventions and offer less potential for innovation as
firms will neither be aware of nor interested in developing
these inventions further.
With these caveats in mind the next subsections portray
the evidence for wider economic impacts, the factors
determining a successful IP-based university and PRO
technology transfer system, and the evidence regarding
the most severe concerns with respect to such a model.
Evidence for wider economic impacts
Policy-makers in many high- and middle-income coun-
tries alike are lamenting the fact that too little innova-
tions result from the growing number of university and
PRO patents.
It is important to move beyond the number of patents filed
and licensing revenue earned as measures of success
in technology transfer.
79 Arundel and Bordoy (2010) explore the
possibilities and difficulties of developing
internationally comparable output indicators
for the commercialization of public science.
161
Chapter 4 harnessing publiC researCh for innovation – the role of intelleCtual property
As desirable as this is, the contribution that commercial-
ization of university IP makes to economic development
is hard to demonstrate convincingly in economic studies.
The calculations are plagued by the same issues that
complicate impact assessments of public R&D (see Box
4.1 and the previous section), i.e., constructing data that
effectively capture other dimensions of the impacts of
IP-based technology transfer is challenging (for example,
productivity gains of downstream firms using or building
on such IP, or a consumer surplus from the resulting in-
novation). Establishing clear causal relationships between
IP-based technology transfer and these social gains is
even harder. Only one study, prepared for an industry
association, aims to assign figures to wider economic
impacts in the US.80
Given the above difficulties, many related studies show
impacts of university-industry interactions, without neces-
sarily implying that technology transfer based on IP, or
for that matter the university-IP ownership model, is the
essential condition and trigger for this impact.
The literature shows that university-industry technology
transactions can generate important spillovers by stimu-
lating additional R&D investment, new firms and products,
and job creation.81 Benefits for firms include an increase
in the level of applied research effort, higher overall R&D
productivity as measured by patents, a higher quality
of patents, the introduction of new products, increased
sales and labor cost reductions. Linkages with industry
are shown to have enriching effects for university research
and also lead to synergies between applied and basic
research and the development of new research ideas.82
Beyond this, studies have used the limited statistics on
the number of academic spin-offs directly or indirectly
linked to IP-based commercialization efforts of TTOs to
evaluate IP-based technology transfer legislation (see
Box 4.5). Given the generally low figures, some observ-
ers have used these data to cast doubt on the overall
impact of such policies.83
Yet, these absolute numbers might miss out on the truly
important question of which start-ups produce tangible
economic results and improve employment in the medi-
um- to longer-run. Studies show that university patenting
and licensing have been fundamental to the emergence of
new industries, such as the scientific instruments industry,
semiconductors, computer software and the nano- and
biotechnology industries.84 Several major corporations
originated from academic start-ups facilitated by TTOs.85
US university start-ups also seem disproportionately
more likely to develop into viable businesses and to create
more jobs.86 For instance, the US AUTM collects case
studies and examples of university IP contributions over
the last 30 years, with 423 start-ups still operating as of
the end of 2009, in particular in the health care sector.87
The literature also shows that academic start-ups are
more likely to commercialize new technologies that are
radical, early stage and of a general purpose nature.88
Again, attributing these positive impacts exclusively to IP-
based technology transfer is most likely not appropriate.
80 See Roessner et al. (2009), cited in AUTM (2010).
This widely cited study states that, over the last 30
years, more than 6,000 new US companies were
formed on the basis of university inventions; 4,350
new university-licensed products entered the market;
and these inventions made a USD187 billion impact
on the US gross domestic product, with 279,000 jobs
created. The authors argue that no attempt was made
to valuate the other significant economic contributions
of university-based research, and that estimates are
therefore considered to be significantly conservative.
81 See Rosenberg and Nelson (1994).
82 See Azoulay et al. (2006)
and Owen-Smith and Powell (2003).
83 See Aldridge and Audretsch (2010).
84 See Rosenberg and Nelson (1994)
and Zucker et al. (1998).
85 Several major corporations began as TTO start-ups,
including Genentech in biotechnology, Cirrus Logic
in semiconductors, and Lycos in Internet search
engines. See Di Gregorio and Shane (2003).
86 See Di Gregorio and Shane (2003) and Shane (2004).
87 See AUTM (2010).
88 In contrast, licensing to established firms is
used to commercialize new technologies that
are more incremental, codified, late stage and
specific in purpose. They also tend to involve
minor technical advances, provide moderate
customer value and have weaker IP protection.
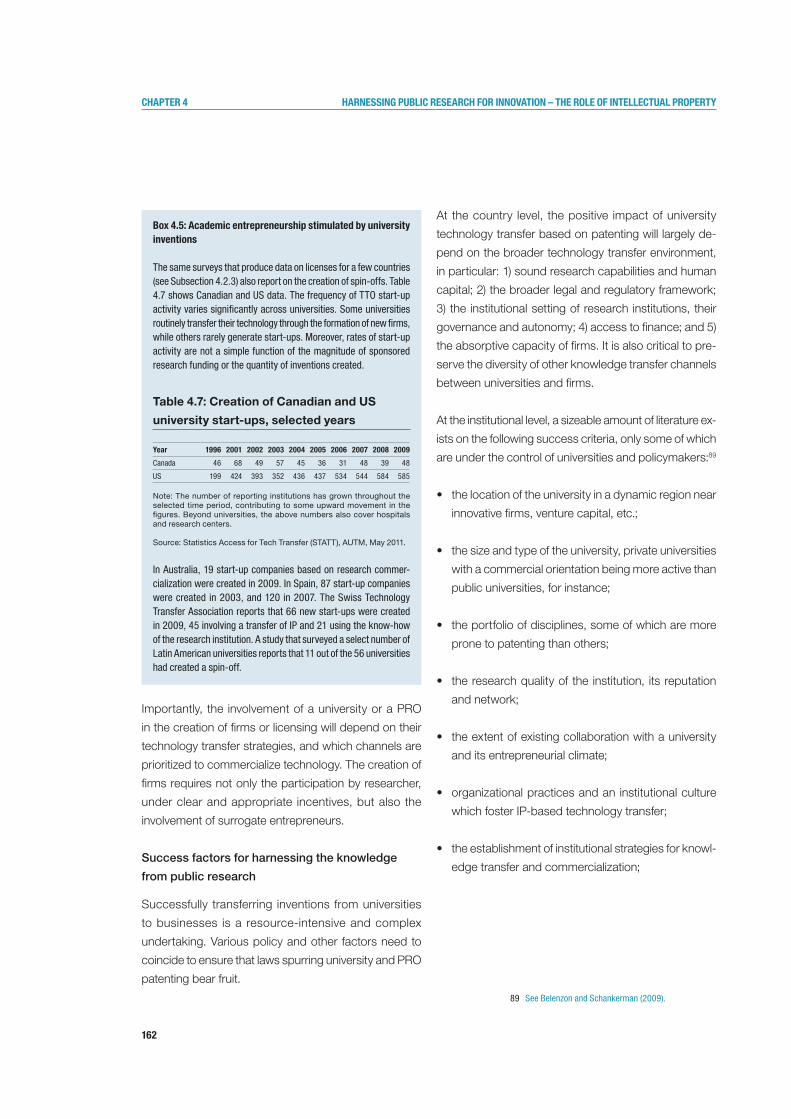
162
Chapter 4 harnessing publiC researCh for innovation – the role of intelleCtual property
Importantly, the involvement of a university or a PRO
in the creation of firms or licensing will depend on their
technology transfer strategies, and which channels are
prioritized to commercialize technology. The creation of
firms requires not only the participation by researcher,
under clear and appropriate incentives, but also the
involvement of surrogate entrepreneurs.
Successfactorsforharnessingtheknowledge
from public research
Successfully transferring inventions from universities
to businesses is a resource-intensive and complex
undertaking. Various policy and other factors need to
coincide to ensure that laws spurring university and PRO
patenting bear fruit.
At the country level, the positive impact of university
technology transfer based on patenting will largely de-
pend on the broader technology transfer environment,
in particular: 1) sound research capabilities and human
capital; 2) the broader legal and regulatory framework;
3) the institutional setting of research institutions, their
governance and autonomy; 4) access to finance; and 5)
the absorptive capacity of firms. It is also critical to pre-
serve the diversity of other knowledge transfer channels
between universities and firms.
At the institutional level, a sizeable amount of literature ex-
ists on the following success criteria, only some of which
are under the control of universities and policymakers:89
• thelocationoftheuniversityinadynamicregionnear
innovative firms, venture capital, etc.;
• thesizeandtypeoftheuniversity,privateuniversities
with a commercial orientation being more active than
public universities, for instance;
• theportfolioofdisciplines,someofwhicharemore
prone to patenting than others;
• theresearchqualityoftheinstitution, itsreputation
and network;
• theextentofexistingcollaborationwithauniversity
and its entrepreneurial climate;
• organizationalpracticesandaninstitutionalculture
which foster IP-based technology transfer;
• theestablishmentofinstitutionalstrategiesforknowl-
edge transfer and commercialization;
box 4.5: Academic entrepreneurship stimulated by university inventions
The same surveys that produce data on licenses for a few countries (see Subsection 4.2.3) also report on the creation of spin-offs. Table 4.7 shows Canadian and US data. The frequency of TTO start-up activity varies significantly across universities. Some universities routinely transfer their technology through the formation of new firms, while others rarely generate start-ups. Moreover, rates of start-up activity are not a simple function of the magnitude of sponsored research funding or the quantity of inventions created.
Table 4.7: Creation of Canadian and US
university start-ups, selected years
Note: The number of reporting institutions has grown throughout the selected time period, contributing to some upward movement in the figures. Beyond universities, the above numbers also cover hospitals and research centers.
Source: Statistics Access for Tech Transfer (STATT), AUTM, May 2011.
In Australia, 19 start-up companies based on research commer-cialization were created in 2009. In Spain, 87 start-up companies were created in 2003, and 120 in 2007. The Swiss Technology Transfer Association reports that 66 new start-ups were created in 2009, 45 involving a transfer of IP and 21 using the know-how of the research institution. A study that surveyed a select number of Latin American universities reports that 11 out of the 56 universities had created a spin-off.
Year 1996 2001 2002 2003 2004 2005 2006 2007 2008 2009
Canada 46 68 49 57 45 36 31 48 39 48
US 199 424 393 352 436 437 534 544 584 585
89 See Belenzon and Schankerman (2009).
163
Chapter 4 harnessing publiC researCh for innovation – the role of intelleCtual property
• competitivefacultysalariesandincentivestofilefor
IP rights and to disclose inventions to a TTO, notably
also with respect to whether patents are considered
in the attainment of academic tenure;
• thecharacteristicsof the relevantTTO (seeBox
4.6);90 and
• complementaryfactorsandpoliciesthatencourage
academic start-ups, such as allowing faculty to cre-
ate and own a share in a start-up or to take a leave of
absence, providing additional financing and support,
and framework conditions such as incubators and
science parks.
The required institutional, financial and human resources
represent a sizeable investment by universities and
PROs. The often volatile and skewed licensing income
typically does not recover these costs. As a result, the
idea that licensing could act as a potential substitute for
other university income or other funding sources should
be discarded.
Beyond these factors, the evidence stresses the impor-
tance of a well-defined university IP policy. Universities
with internal rules regulating the participation of research-
ers in the transfer of technology perform better than
universities without such rules.95 Well-defined university
policies with clear rules on benefit sharing improve per-
formance by giving researchers incentives to participate
in the transfer of technology.96 Rules that help to stan-
dardize relationships with potential licensees through
standard forms and contracts also reduce transaction
costs in finalizing agreements with the private sector. In
addition, these policies can help address some of the
concerns raised above, ensuring that universities and
PROs – and their faculties – do not neglect their other
major missions of teaching and research in the name
of commercialization.
90 See Belenzon and Schankerman (2010).
91 See Zuñiga (2011), Sections 3 and 5.
92 See Debackere and Veugelers (2005); Owen-
Smith and Powell (2001); Lach and Schankerman
(2008); and Chapple et al. (2005).
93 See Owen-Smith and Powell (2001).
94 A “Free agency” approach, according to which
faculty members choose who will negotiate
licensing agreements for them while promising
a share of income to the university, could be an
alternative to TTOs or relevant competition.
95 See Debackere and Veugelers (2005).
96 See Lach and Schankerman (2008).
box 4.6: The role of technology transfer offices and open questions
The activities TTOs undertake can exclusively be confined to IP management and commercialization; or, alternatively, they can have a broader scope and also conduct activities related to regional economic development, the funding of education, and industry training in areas such as IP and technology transfer.91
The nature and type of technology transfer intermediaries are important factors influencing the technology transfer performance of universities.92 The size and age of a TTO, the number of its staff, their experience (in particular in industry) are major success criteria for building a qualitative portfolio of inventions. However, these attributes are not a guarantee of success. Experience shows that building successful TTO interfaces between science and industry is a challenge even in the high-income countries with the most technology transfer experience.
Open questions include:1) What is the optimal degree of involvement of scientists in the
development of an idea, and should inventors have the option to select commercial providers?
2) How can the danger of “capture” of TTOs by industrial interests or specific firms be avoided?93
3) To what extent should a TTO be the only body able to commer-cialize university inventions? Should researchers be obliged to go through a TTO or also be able to manage and commercialize IP on their own?94
4) Given the costs involved, should universities have an individual TTO? Several institutions are experimenting with regional or sectoral TTOs, recognizing that many individual universities or PROs do not have the necessary scale for their own TTOs.
164
Chapter 4 harnessing publiC researCh for innovation – the role of intelleCtual property
Substantiating the concerns about
publicly-funded research
Table 4.6 describes a spectrum of concerns about the
impact of IP-based technology transfer on the science
system and on relationships between universities, PROs
and firms.
The empirical literature has, however, been narrowly
focused on gauging the impacts of university patents on
the publication activity of scientists. Indeed, the existing
studies are also severely limited, because metrics on
the broader impacts on science are hard to come by.
Thus, the literature stresses “the ambiguous nature of
current empirical evidence on the long-term implications
of academic enterprise”.97
In any case, the available evidence does not lend itself
to exaggerated concerns with respect to impact. In fact,
the opposite is true.
1) Impacts on scientific publications and the norms
of “open science” in academia: The majority of stud-
ies focusing on the relationship between publishing –
the proxy used for open science – and patenting have
found little evidence of conflict between interactions with
industry and traditional academic roles.98
On the contrary, the studies conducted in the US and
Europe find a positive relationship between interactions
with the private sector, patenting and publishing. In fact,
scientists who have research contracts with industry
demonstrate superior productivity, both in terms of
number and quality of publications as measured by cita-
tions, compared to their non-inventing peers.99 Academic
patenting may well be complementary to publishing at
least up to a certain level of patenting output, after which
some studies find a substitution effect.100 This evidence is
interpreted to show that no substantial shift towards ap-
plied research is taking place.101 It is argued that scientists
are likely to publish results even if they are also patented,
because of the continuing importance of publishing in
establishing priority and reputation in academia. Also,
new research – especially, but not only, in the biomedical
field – may be dual-purpose, both basic, in that it uncov-
ers new scientific principles, and commercially applicable,
perhaps even commercially motivated.102
Interestingly, the evidence on whether the establishment
of an academic spin-off has an adverse effect on scientific
output is less clear and somewhat mixed. Some stud-
ies find that faculty entrepreneurs are more productive,
while others see a decrease in publishing, subject to
variations by field.
Substitution effects between patenting and publishing
may arise under specific circumstances, notably where
researchers have already achieved a prominent scientific
career; at high levels of patenting; and, in some cases,
where academics are involved in corporate patents.103
Nevertheless, the above results which suggest that a
positive relationship between publishing and patenting
could be influenced by the sample of respondents and
some inherent statistical problems related to endoge-
neity. This could simply mean that the best scientists
happen to be good at publishing, attracting public and
private research funds, and patenting at the same time.
Alternatively, it could mean that cooperation with industry
positively influences both publishing and patenting, but
that one neither causes nor influences the other.
97 See Larsen (2011); Engel (2008);
and Geuna & Nesta (2006).
98 See, for good overviews Grimaldi et al. (2011); Fabrizio and Di Minin (2008);
and Czarnitzki et al. (2009).
99 See Thursby and Thursby (2011).
100 A few studies have also established a positive
relationship between licensing and publishing
activity. Jensen et al. (2010), for instance,
show that the ability to license their university
research will lead scientists to devote more
time to university research and less time to
consulting on applied projects with firms.
101 See Thursby and Thursby (2007).
102 These fall under what has been referred to as
“Pasteur's quadrant” in Stokes (1997).
103 See, for instance, Crespi et al. (2010); Czarnitzki
et al. (2011); and Gulbrandsen et al. (2011).
165
Chapter 4 harnessing publiC researCh for innovation – the role of intelleCtual property
Furthermore, this evidence depends on the scientific
discipline in question, and the positive relationship is
strongest in fields such as biomedicine and the life sci-
ences, i.e., in research motivated by both a quest for
fundamental understanding and considerations of use.
Finally, these findings say little about potential publication
delays or violations of open science principles. Surveys
of scientists have indeed documented increased secrecy
and delays in publication; in addition, a refocusing of
research activity can accompany the involvement of
particular researchers in patenting and commercializa-
tion activity.104 Examples have been noted of compa-
nies restricting the findings of university researchers
or researchers denying others access to their data.105
Despite these examples, no broad evidence exists that
could unambiguously demonstrate alarming impacts
and that, moreover, would causally link such behavior
to faculty patenting activity. Increased secrecy is often
also a consequence of greater industry collaboration as
well as other factors. Nonetheless, this is an important
area for future study. Policy approaches to mitigate these
potential effects are needed.
2) Impacts on basic research: Insofar as this can be
measured, the existing literature – mostly focused on
the US and the life sciences – finds neither a decrease
in basic research nor an effect on the ratio of applied
versus basic research as a result of patenting.106 It has
been shown that the great majority of licensed university
inventions require substantial effort by firms to develop
commercially viable products from them. According
to the literature, this is a clear indication that university
research continues to be fundamental in nature.107 The
literature also shows that commercially-oriented re-
search may be complementary to more fundamental
research.108 The positive feedback loops running from
firms to universities, and for the benefit of science, may
indeed be underappreciated.
To put these findings into perspective, the data show
that universities continue to account for the majority
of basic and academic research, while pursuing little
development. If anything, basic R&D as a percentage
of gross domestic product (GDP) has increased or
remained the same over time, including in high-income
economies.109 Also, the risk of industry exerting an overly
great influence might be exaggerated as it funds only a
small share of academic R&D. In the US, for example,
companies finance about 5 to 6 percent of basic and
applied academic R&D, respectively, with a focus on
basic R&D (see Figure 4.11).
This evidence notwithstanding, it remains a complex task
to distinguish between, and separately measure, basic
research, applied research and development activity.
In any event, the whole breakdown may be misleading
if there are important feedback effects from later stage
research that may affect earlier stage research.
104 See, for an overview of this literature,
Azoulay et al. (2009).
105 See, for instance, Campbell et al. (2002);
Campbell et al. (2000); and the related literature.
106 See Rafferty (2008) and Larsen (2011).
107 See Rafferty (2008).
108 See Breschi et al. (2007); Van Looy
(2006); and Van Looy et al. (2004).
109 OECD Main Science, Technology and
Industry Statistics (MSTI).
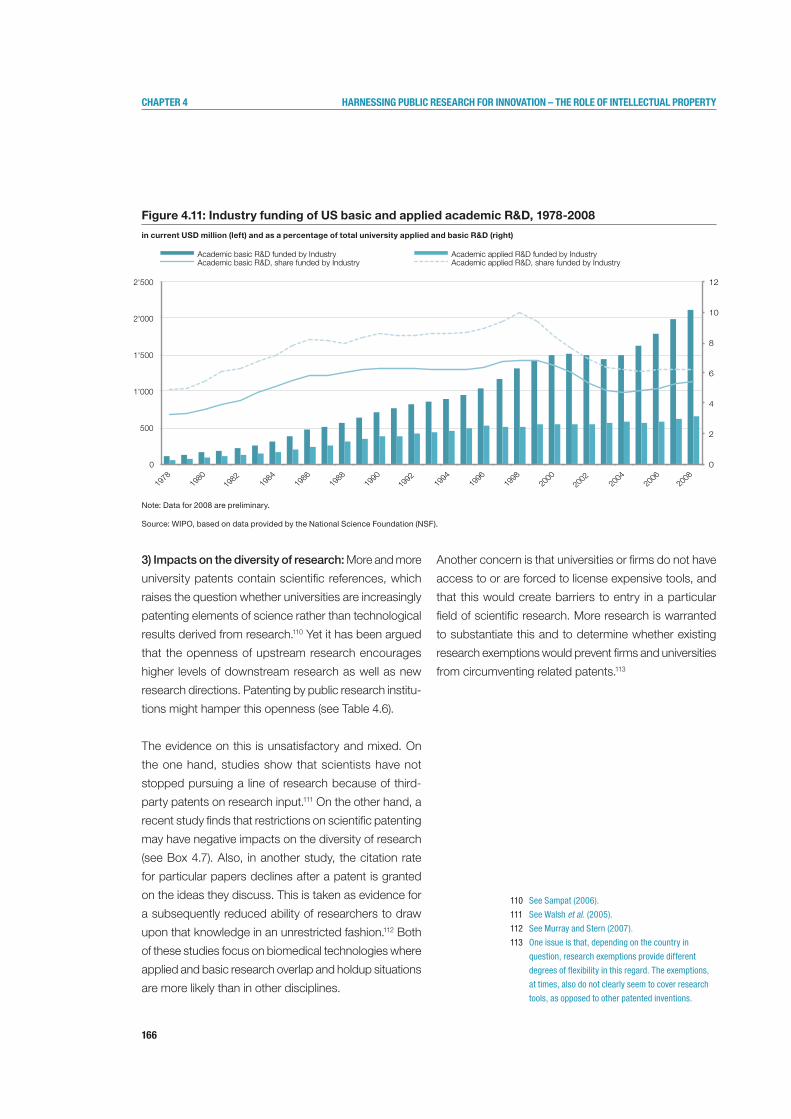
166
Chapter 4 harnessing publiC researCh for innovation – the role of intelleCtual property
Figure 4.11: Industry funding of US basic and applied academic R&D, 1978-2008
in current USD million (left) and as a percentage of total university applied and basic R&D (right)
Note: Data for 2008 are preliminary.
Source: WIPO, based on data provided by the National Science Foundation (NSF).
3) Impacts on the diversity of research: More and more
university patents contain scientific references, which
raises the question whether universities are increasingly
patenting elements of science rather than technological
results derived from research.110 Yet it has been argued
that the openness of upstream research encourages
higher levels of downstream research as well as new
research directions. Patenting by public research institu-
tions might hamper this openness (see Table 4.6).
The evidence on this is unsatisfactory and mixed. On
the one hand, studies show that scientists have not
stopped pursuing a line of research because of third-
party patents on research input.111 On the other hand, a
recent study finds that restrictions on scientific patenting
may have negative impacts on the diversity of research
(see Box 4.7). Also, in another study, the citation rate
for particular papers declines after a patent is granted
on the ideas they discuss. This is taken as evidence for
a subsequently reduced ability of researchers to draw
upon that knowledge in an unrestricted fashion.112 Both
of these studies focus on biomedical technologies where
applied and basic research overlap and holdup situations
are more likely than in other disciplines.
Another concern is that universities or firms do not have
access to or are forced to license expensive tools, and
that this would create barriers to entry in a particular
field of scientific research. More research is warranted
to substantiate this and to determine whether existing
research exemptions would prevent firms and universities
from circumventing related patents.113
0
2
4
6
8
10
12
0
500
1'000
1'500
2'000
2'500
1978
1980
1982
19
84
1986
1988
1990
1992
19
94
1996
1998
2000
2002
20
04
2006
2008
Academic basic R&D funded by Industry Academic applied R&D funded by Industry Academic basic R&D, share funded by Industry Academic applied R&D, share funded by Industry
110 See Sampat (2006).
111 See Walsh et al. (2005).
112 See Murray and Stern (2007).
113 One issue is that, depending on the country in
question, research exemptions provide different
degrees of flexibility in this regard. The exemptions,
at times, also do not clearly seem to cover research
tools, as opposed to other patented inventions.

167
Chapter 4 harnessing publiC researCh for innovation – the role of intelleCtual property
4) Influences on university and industry relations:
Anecdotal evidence from the US suggests that proactive
university efforts to own results of co-sponsored research
and to generate licensing income have become contro-
versial (see Table 4.5).114 The fact that universities insist
on their own IP terms prior to working with industry has
been framed as a barrier to collaboration, given the long
delays and potential for friction where universities act to
maximize profits.115 Some frustration stems from the fact
that universities may tend to deploy a “one-size-fits-all”
approach to patenting research results, notwithstanding
the evidence that patents and exclusive licensing play
different roles in the development of complex versus
discrete technologies (see Chapter 2).116
Few studies have assessed this potential downside
effect. Instead, studies show that often – and despite
potential friction – university IP, collaboration and re-
search productivity go hand in hand. In other words,
those universities that collaborate more with industry
also tend to be the ones with the most patents – again,
no causality is implied.
When looking at official statistics, one cannot help ob-
serving modest but continued industry-university collabo-
ration, measured in terms of the share of industry-funded
R&D carried out in academia. Specifically, the share of
higher education R&D expenditure financed by industry
has always been small, but increases when looking at
averages for all Organisation for Economic Co-operation
and Development (OECD) countries (from 2.9 percent in
1981, to about 6.6 percent in 2007).117 In Argentina, China
and the Russian Federation, for example, firms also fund
a stable or increasing percentage of academic R&D.
Finally, and as mentioned in Chapter 1, when dealing
with universities, firms are also increasingly inventive
with regard to their IP policies, fostering cooperation on
the one hand while ensuring control on the other. For
instance, university researchers are granted access to
the company’s internal IP, for example antibody libraries
and research tools, and, in certain cases, are allowed to
publish in addition to obtaining external funding.
box 4.7: of mice and academic freedom
A recent paper tests the issue of whether restrictions on scientific openness – such as those created by university patenting – may limit diversity and experimentation in basic research itself. The authors use the example of certain genetically-engineered mice and related scientific papers to examine the effects of more relaxed IP policies following an agreement between the private sector and the US National Institutes of Health (NIH). Specifically, that agreement eased IP-based restrictions limiting access to research materials (the mice) and limitations on downstream expropriation by follow-on innovators. In particular, the authors evaluate how the level and type of follow-on research using these mice changes after the NIH-initiated increase in openness.
The authors find a significant increase in the level of follow-on research driven by a substantial increase in the rate of exploration of more diverse research paths. They interpret this to mean that openness of upstream research does not simply encourage higher levels of downstream exploitation; it also increases incentives for additional upstream research by encouraging the establishment of new research directions, and an increase in more basic and higher quality research publications. The authors suggest that the effects of university IP legislation should be studied in the light of these findings.
Source: Murray et al. (2009)
114 See Thursby and Thursby (2007)
and Litan et al. (2008).
115 See Alexy et al. (2009) and Wadhwa (2011).
Specific firms have argued that it has distanced
universities from firms in the US and has been
a reason for US firms to collaborate more
with firms abroad. See Litan et al. (2008).
116 See So et al. (2008).
117 OECD MSTI.
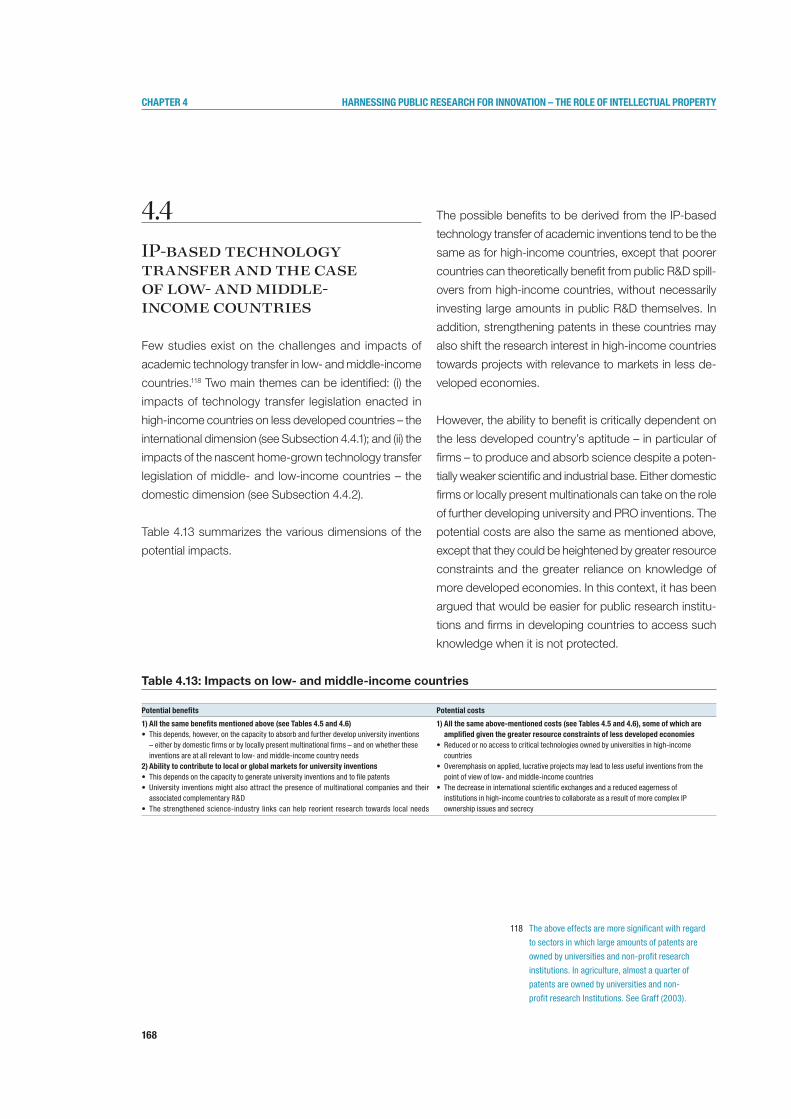
168
Chapter 4 harnessing publiC researCh for innovation – the role of intelleCtual property
4.4IP-based technology transfer and the case of low- and middle-income countries
Few studies exist on the challenges and impacts of
academic technology transfer in low- and middle-income
countries.118 Two main themes can be identified: (i) the
impacts of technology transfer legislation enacted in
high-income countries on less developed countries – the
international dimension (see Subsection 4.4.1); and (ii) the
impacts of the nascent home-grown technology transfer
legislation of middle- and low-income countries – the
domestic dimension (see Subsection 4.4.2).
Table 4.13 summarizes the various dimensions of the
potential impacts.
The possible benefits to be derived from the IP-based
technology transfer of academic inventions tend to be the
same as for high-income countries, except that poorer
countries can theoretically benefit from public R&D spill-
overs from high-income countries, without necessarily
investing large amounts in public R&D themselves. In
addition, strengthening patents in these countries may
also shift the research interest in high-income countries
towards projects with relevance to markets in less de-
veloped economies.
However, the ability to benefit is critically dependent on
the less developed country’s aptitude – in particular of
firms – to produce and absorb science despite a poten-
tially weaker scientific and industrial base. Either domestic
firms or locally present multinationals can take on the role
of further developing university and PRO inventions. The
potential costs are also the same as mentioned above,
except that they could be heightened by greater resource
constraints and the greater reliance on knowledge of
more developed economies. In this context, it has been
argued that would be easier for public research institu-
tions and firms in developing countries to access such
knowledge when it is not protected.
Potential benefits Potential costs
1) All the same benefits mentioned above (see Tables 4.5 and 4.6)• Thisdepends,however,onthecapacitytoabsorbandfurtherdevelopuniversityinventions
– either by domestic firms or by locally present multinational firms – and on whether these inventions are at all relevant to low- and middle-income country needs
2) Ability to contribute to local or global markets for university inventions• Thisdependsonthecapacitytogenerateuniversityinventionsandtofilepatents• University inventionsmightalsoattractthepresenceofmultinationalcompaniesandtheir
associated complementary R&D• Thestrengthenedscience-industry linkscanhelpreorientresearchtowards localneeds
1) All the same above-mentioned costs (see Tables 4.5 and 4.6), some of which are amplified given the greater resource constraints of less developed economies
• Reducedornoaccesstocriticaltechnologiesownedbyuniversitiesinhigh-incomecountries
• Overemphasisonapplied,lucrativeprojectsmayleadtolessusefulinventionsfromthepoint of view of low- and middle-income countries
• Thedecreaseininternationalscientificexchangesandareducedeagernessofinstitutions in high-income countries to collaborate as a result of more complex IP ownership issues and secrecy
118 The above effects are more significant with regard
to sectors in which large amounts of patents are
owned by universities and non-profit research
institutions. In agriculture, almost a quarter of
patents are owned by universities and non-
profit research Institutions. See Graff (2003).
Table 4.13: Impacts on low- and middle-income countries

169
Chapter 4 harnessing publiC researCh for innovation – the role of intelleCtual property
4.4.1Impacts of high-income countries’ technology transfer legislation on low- and middle-income economies
The literature on this topic has focused on how technol-
ogy transfer legislation originating in high-income coun-
tries impacts on low- and middle-income economies.
In that context, the literature considers their reduced and
more expensive access to knowledge.119 One concern
is that the patenting of scientific results in high-income
countries could restrict access to research tools, da-
tabases and technologies.120 In particular, stricter IP
practices may hinder access to technologies that are
particularly critical for less developed economies, for
example in agriculture and health and for particular life-
saving medications (see Section 4.5 in this regard, which
suggests policies to counteract such impacts).121
At the outset, the impacts of reduced access to such
knowledge are critically dependent on whether the uni-
versity or PRO inventor has been granted a patent by the
national patent office of the country in question.122 Also,
the costs depend on whether (i) the technology is at all
meaningful to the country and (ii) whether such country
has the ability to take up and develop unpatented univer-
sity inventions prior to such legislation in the first place.
That said, more research is required on this potential
downside effect. The earlier sections of this chapter show
that the number and share of university and PRO patents
are growing and, in particular, in the pharmaceutical and
health area. It would be of interest to determine which pat-
ents are filed in areas critical to low- and middle-income
economies and their related effects, including the terms of
access and impacts on consumption. The extent to which
research in high-income countries focuses on neglected
diseases or crops for the tropics – areas of great interest
for less developed countries – and the extent to which
this research is being patented is likely to be limited. Yet
this question deserves more research. It would also be
interesting to ascertain which safeguards could be put in
place to avert the possible downside effects of university
and PRO patenting (see Section 4.5).
Finally, the literature considers the potentially harmful
impact of international knowledge diffusion that could
be triggered by increased university and PRO patent-
ing in high-income countries. The concern is that op-
portunities for scientific networking between scientists
in high-income and less developed countries might be
narrowed.123 Examples have been cited of cooperation
agreements between institutions of more and less devel-
oped countries being abolished due to across-the-board
patenting strategies.124 In particular in the climate change
debate, less developed countries have called on high-
income countries to make the results of publicly-funded
research in this area available. In the absence of more
systematic evidence, it is of central importance to further
substantiate concerns of faltering scientific cooperation
between richer and poorer countries that could be linked
to IP, and a corresponding decline in scientific openness.
119 Kapsynski et al. (2003) cite major HIV treatment
drug patents held by Yale University, the University
of Minnesota, Emory University and Duke University.
120 See Boettiger and Benett (2006); So et al. (2008); Montobio (2009); and Engel (2008).
121 See Boettiger (2006).
122 Sampat (2009) explains that for university patenting
in the North to affect access to drugs in middle-
and low-income countries, two things need to be
true: universities would have to own a substantial
number of patents; and, second, universities or
firms licensing university technologies would have
to file patents in low-and middle-income countries.
123 See Clemente (2006).
124 Idem.
170
Chapter 4 harnessing publiC researCh for innovation – the role of intelleCtual property
4.4.2Challenges to home-grown technology transfer in low- and middle-income countries
Despite costs and benefits similar to high-income coun-
tries, low- and middle-income economies’ differing needs
must be taken into consideration in formulating technol-
ogy transfer policies and anticipating their related impacts.
Experience and the economic literature show that dif-
ferent stages of development and different innovation
systems require different policies in order to promote
IP-based incentives for the commercialization of public
research.125 Conditions for technology transfer develop
over time and depend heavily on research capabilities
and science-industry linkages. Having a broad view of
the concept of technology commercialization, looking
at intermediate steps and broad technology transfer
activities – not exclusively focused on IP creation and
licensing, and academic entrepreneurship – makes for
good policy advice.
The importance of improved science-industry
linkagesinlow-andmiddle-incomeeconomies
Low- and middle-income countries vary substantially
with regard to the R&D capacity of their public research
institutions, science-industry cooperation and their infra-
structure and policy framework for technology transfer
(see Chapter 1 and Subsection 4.2.1).
Generally speaking, however, a key difference with high-
income countries is the weak linkages between public
R&D and national economic development which is often
rooted in the factors below:
• alowerlevelofscienceandtechnologyactivity(S&T);
• thefactthatthegovernmentandinternationaldonorsare
often the main funders of S&T, and that national PROs
are the main R&D performers (see Subsection 4.1.1), im-
plying low research and innovation capabilities of firms;
• lessdevelopedhumancapitalforS&Tactivity,particu-
larly a low number of scientists in firms and the best do-
mestic scientists moving abroad (“brain drain” effect);
• lowerqualityresearchandlowrelevanceofpublic
research to the business sector;
• limitedscience-industrylinkages,explainedbyalow
absorptive capacity of firms combined with an ensuing
lack of “business” demand for S&T;
• alackofpoliciesandstructurestofacilitateacademic
and other start-ups; and
• constrainedaccesstofinancingasabarriertothe
development of innovation.
Linkages between PROs and the business sector are
constrained by a number of structural factors and inertia.
In many less developed economies, government-funded
S&T expenditure has largely focused on agriculture and
overlooked engineering and industrial research. The lack
of applied research, the deficit of trained engineers and
applied scientists, and weak technological capabilities in
the manufacturing sector are all factors contributing to a
disconnection between science and firms.
125 See Guellec et al. (2010).
171
Chapter 4 harnessing publiC researCh for innovation – the role of intelleCtual property
Structural features have also constrained the development
of linkages between universities and firms. Often, com-
mercial activity by universities and researchers has been or
is still highly regulated or forbidden. With few exceptions,
most universities fully depend on federal budgets and have
weak linkages with regional governments and economies.
The lack of absorptive capacity in firms and their natural
focus on imitative innovation and acquisition of foreign
technology as innovation strategies also contribute to frag-
mentation in national innovation systems (see Chapter 1).126
The technological strategies of firms in lower- and middle-
income economies often depend on off-the-shelf import-
ed technology, primarily in the form of machinery and turn-
key technology transfer from abroad. Often these are also
the only options for these firms to access current technol-
ogy.127 The barriers to industry-science collaboration re-
ported by firms include a lack of communication channels
with universities, differences in organizational culture (in
respect of timing and product delivery), uncertainty of a
market perspective for research results, and high costs
for developing and commercializing university research.128
In this context, technology transfer policies that are not
accompanied by policies targeting the strengthening of
R&D capabilities in firms and industry-science linkages
will unlikely be successful. Similar as in the case of high-
income countries, transforming academia into more
entrepreneurial institutions requires cultural change – in
particular among researchers, and often increased uni-
versity autonomy, including for more competitive hiring
and in terms of resource management.
Compared to high-income countries, the following are
additional barriers to technology transfer in low- and
middle-income countries:
• lackofclearuniversityandPROtechnologytrans-
fer policies;
• weakoperativeguidelinesonpatenting,forexample
on disclosure and commercialization of IP at the
institutional level;
• littleawarenessaboutandfewincentivesforresearch-
ers to participate in IP-based technology transfer; and
• absenceoforinadequateresourcesforTTOs,with
staff lacking the necessary skills and experience
related to IP and commercialization.
• moregenerally,anadditionalfrictiontothedevelop-
ment of IP registration and commercialization in many
middle- and low-income countries is the sluggish
process of patenting at national patent offices and
its relatively high cost.129
However, these characteristics are not shared equally
across all low- and middle-income countries. For the
most part, work is ongoing to improve the systemic
weaknesses in national innovation systems and giv-
ing increasing autonomy to universities. As evidenced
earlier, many of these countries are also in the midst of
implementing or setting up technology transfer policies
and practices (see Subsection 4.2.1). Indeed, in some
cases this has already led to significant impacts, both in
terms of measured technology transfer and the related
broader impacts on public research institutions, firms
and the linkages between them.
Finally, it is also important to reiterate that high-income
countries struggle with many of the same challenges
when it comes to putting in place functioning technol-
ogy transfer practices. Therefore, a perfect blueprint that
could easily be adopted does not exist.
126 See Navarro et al. (2010).
127 See Zuñiga (2011). In Argentina, for example, according
to the innovation survey of 1998-2001, 84 percent
of firms that cooperated with other actors in the
national innovation systems did so for informational
purposes and 58 percent for training purposes;
only 21 percent engaged in cooperation for R&D. In
Colombia, the percentages of firms (within those that
reported links with agents providing technological
services) are 31, 50 and 15 percent, respectively.
128 For evidence from China on this,
see Guan et al. (2005).
129 See Zuñiga (2011).
172
Chapter 4 harnessing publiC researCh for innovation – the role of intelleCtual property
4.5New university policies act as safeguards
The preceding discussion pointed to possible downside
effects of university and PRO patenting on knowledge
diffusion and access to technology or critical products.
Better monitoring and improved understanding of these
potential effects would seem to be desirable.
Furthermore, policies and practices are being tested
by governments and universities to institute safeguards
against unintended negative consequences.
Universities, PROs, funding agencies, donors and gov-
ernments have essentially two levers for preventing or
limiting the potentially negative impacts of IP-based
technology transfer.
• First,thepatentingandthelicensingofparticularinven-
tions and technologies can be restricted. For instance,
guidelines can demand that patents should be sought,
and exclusive licenses attributed, only where they are
a necessary condition for their commercialization.
University policies and government bodies can also
declare certain areas off-limits to university patenting:
basic research, research tools, technologies critical
to public health in low-income countries.
• Second,whereinventionsarepatented,thetypeof
and access to downstream licenses can be influenced
by legislation or institutional policies. For instance,
licensees of government-funded technologies can
be required to disclose follow-on investment and the
actual use of the patent, for instance avoiding that
these patents are used to block follow-on inventions
by incumbents or patent aggregators. Certain re-
quirements can be instituted to ensure that products
derived from these inventions are sold to consumers or
poorer countries on reasonable terms.130 Field-of-use
restrictions can also be implemented to ensure that
the IP is made available for future research, including
to other firms. Governments can also reserve the right
to practice the invention or override exclusive licensing
rights (“march-in rights”).
Related codes of practice aim to prevent abusive patent-
ing and licensing:131
• Asof2004,theEuropeanCommissionsuggested
guidelines and established a recommendation based
on various expert groups.132
• Anine-pointplanhasbeensetupbyagroupofaca-
demics and endorsed by a number of US universities
which provide safeguards (see Box 4.8). This plan is
particularly concerned with the preservation of follow-
on science and innovation, and with ensuring that
patents do not create undue burdens. One of the nine
points stresses that patenting universities should be
sensitive to poor countries, in particular with respect
to their medical and food needs.
• AnumberofprominentUSinstitutionshavealsoen-
dorsed a “Statement of Principles and Strategies for the
Equitable Dissemination of Medical Technologies”.133
• Legislationandpracticesthatfacilitateorguarantee
humanitarian access for poorer countries to technolo-
gies and products based on publicly-funded research
are being established.134
130 See OECD (2003) and So et al. (2008).
131 See Montobbio (2009); OECD (2003);
and Sampat (2009).
132 See MacDonald et al. (2004) and European
Commission (2008, 2009).
133 www.autm.net/Content/NavigationMenu/TechTransfer/GlobalHealth/statementofprincliples.pdf (accessed on October 11, 2011).
134 See Chokshi (2006) and Chokshi
and Rujkumar (2007).

173
Chapter 4 harnessing publiC researCh for innovation – the role of intelleCtual property
Moreover, universities and PROs are trying a number of
interesting additional approaches (see Table 4.12). These
include patenting strategies but also access to research
tools and to copyrighted works such as teaching materi-
als, an often neglected IP issue in this debate.
Table 4.12: University and PRO “open IP policies”
To conclude, the extent to which these policies are imple-
mented and successful in reaching their intended goal is
an issue for further research. Governments, including in
low- and middle-income countries, that are in the process
of adopting technology transfer laws and policies can
consider formally instituting such safeguards.138
box 4.8: “nine Points to Consider in licensing”
• Universitiesshouldreservetherighttopracticelicensedinventionsand to allow other non-profit and governmental organizations to do so.
• Universitiesshouldalsoendeavortostructurelicenses,especiallyex-clusive licenses, in ways that promote investment, technology devel-opment and use, with milestone criteria to back up such requirements.
• Universitiesshouldstrivetominimizethelicensingof“futureimprovements”.
• Universitiesshouldanticipateanddotheirbesttomanageoreliminate technology transfer-related conflicts of interest.
• Universitiesshouldtrytoensurebroadaccesstoresearchtools.• Enforcementactionshouldbecarefullyconsidered.• Universitiesshouldbecareful toavoidworkingwithprivate
patent aggregators (referred to as non-practicing entities in Chapter 2) whose business model is limited to asserting patents against established firms rather than seeking to promote further development and commercial application of the technology.
• Incaseswherethereisamarketforthesaleofunlicensedpatents,universities should try to ensure that purchasers operate under a business model that allows for commercialization rather than a model based on threats of patent infringement litigation to generate revenue.
• Universitiesshouldtrytoanticipatewhichtechnologiesmayhaveapplications that address important unmet social needs unlikely to be served by terms appropriate for commercial markets and to structure agreements to allow for these applications. The examples are technologies suited to meeting the agricultural, medical and food needs of less advanced countries.
Source: Drawing on Merrill & Mazza (2010), based on the informal White Paper“In thePublic Interest:NinePoints toConsider inLicensingUniversity Technology”, March 6, 2007 http://otl.stanford.edu/documents/whitepaper-10.pdf.
licensing strategies • Apreferencetograntcompaniesnon-exclusiveratherthanexclusive licenses135
• Universitiesdiscriminateinissuinglicenses,makingthemfree or cheaper if used for humanitarian, not-for-profit purposes136
• Freelicensestosmallcompaniesorstart-upsforselectedtechnologies
• Institutingfavorablelicensingstrategiestopromoteaccessby poorer countries
Access to copyrighted materials
• Freeaccesstoresearchmaterials,publicationsandteachingmaterials
• Opensourceor,morerecently,openhardwarelicenses137
135 See Nill (2002).
136 Examples are: the University of Leuven not requiring
royalties on Tenofavir from drugs sold in countries
that belong to the Gilead Access Program; Yale
University negotiating humanitarian terms with
Bristol Myers Squibb for sales of drugs in Africa;
University of California, Berkeley, with several
licensing agreements for humanitarian purposes.
137 European Organization for Nuclear Research (CERN)
open hardware license:
www.ohwr.org/projects/ohr-support/wiki/Manifesto.
138 See So et al. (2008).
174
Chapter 4 harnessing publiC researCh for innovation – the role of intelleCtual property
4.6Conclusions and directions for future research
Policymakers increasingly seek to bolster the effective-
ness of academic research in fostering innovation. In this
context, universities and PROs have been encouraged
to patent their inventions and license them to the private
sector. Technology transfer policies and institutions have
been put in place to facilitate this knowledge transfer. This
approach of commercializing publicly-funded research
aims to enable firms to better identify and further develop
inventions based on academic research, thus generating
wider economic and social benefits.
As a result, the number of national and international
patent applications by research institutions has been
increasing, in particular in fields such as biotechnology
and pharmaceuticals. The licensing income generated
is still relatively modest and concentrated within a few
institutions, but it is growing fast and diversifying.
Based on the available evidence, this chapter concludes
that IP-based technology transfer policies and institutions
are instrumental to increasing opportunities for the com-
mercialization of academic inventions. The evidence also
suggests a synergy between academic and entrepre-
neurial activity and the complementary nature of different
knowledge transfer channels. That said, the chapter has
also discussed potential costs of such initiatives.
Moreover, the evidence shows that simply instituting
relevant laws and regulations is only a first ingredient to
stimulating industry-science linkages. A number of condi-
tions need to be in place at the country and institutional
level to reap the resulting benefits. Moreover, diverse
stages of development will require different approaches
and complementary policies, including safeguards for
avoiding the downside risks of university patenting. A
blueprint that could easily be adopted across institutions
and countries therefore does not yet exist, even in high-
income economies.
Areas for future research
In the light of the discussions in this chapter, the following
areas emerge as promising fields of research:
• TheinteractionsbetweenIP-basedknowledgetransfer
channels and other vectors need more careful analysis;
this concerns, in particular, the question whether and
where they are substitutes rather than complements.
• Basedonbettersearchalgorithmsandtargeted
institutional surveys, better data are required to
clearly identify patents, licensing income and spin-
offs derived from academic research, and benefits
from faculty involvement. The role of IP in transforming
a scientist into a successful entrepreneur deserves
particular attention. The respective impacts of licensing
university technologies to existing firms versus the
creation of academic spin-offs is also of interest.
• Experiencesrelatedtomakingtechnologytransferin-
stitutions efficient should be documented more widely,
in particular with an eye for lessons applicable to lesser
endowed research institutions. Examples include the
design of university policies, the design of performance
incentives for researchers and the most optimal inter-
face between public research and firms. The question
whether the current approach of “one-size-fits-all” laws
and practices suits the different scientific disciplines
– on the supply side – and industrial sectors – on the
demand side – needs to be explored.
175
Chapter 4 harnessing publiC researCh for innovation – the role of intelleCtual property
• Morecompellingstudiesareneededtodemonstrate
the economic benefits of IP-based technology transfer,
and the benefits of the university-ownership model
in particular. Quantifying the missed opportunities
resulting from a lack of incentives to commercialize,
in particular in low- and middle-income countries,
would be equally desirable.
• Work isrequiredtobetterdocumentthepotential
negative effects of IP-based knowledge transfer on the
broader science system. The design and implementa-
tion of policy safeguards which are emerging should
be monitored and evaluated. At the same time, the
positive feedback loops on the science system from
industry-science linkages deserve more attention.
• Finally,analyticalworkwithrespecttolow-andmiddle-
income countries is only now emerging, as the major-
ity of these countries are just starting to implement
associated policies and as many of these countries
may not have much innovation capacity in the interim
to experience the impact of such mechanisms.

176
Chapter 4 harnessing publiC researCh for innovation – the role of intelleCtual property
ReFeRencesAdams, J.D. (1990). Fundamental Stocks of Knowledge and Productivity Growth. Journal of Political Economy, 98(4), 673-702.
Aldridge, T. & Audretsch, D.B. (2010). Does Policy Influence the Commercialization Route? Evidence from National Institutes of Health Funded Scientists. Research Policy, 39(5), 583-588.
Alexy, O., Criscuolo, P. & Salter, A. (2009). Does IP Strategy Have to Cripple Open Innovation? MIT Sloan Management Review, October 1, 2009.
Arundel, A. & Bordoy, C. (2010). Developing Internationally Comparable Indicators for the Commercialization of Publicly-funded Research. UNU-MERIT Working Paper Series, 075.
AUTM (2010). The Better World Report – A Positive Impact of Academic Innovations on Quality of Life. Deerfield: The Association of University Technology Managers.
Azoulay, P., Ding, W. & Stuart, T. (2009). The Impact of Academic Patenting on the Rate, Quality and Direction of (Public) Research Output. The Journal of Industrial Economics, 57(4), 637-676.
Baldini, N. (2006). University Patenting and Licensing Activity: A Review of the Literature. Research Evaluation, 15(3), 197-207.
Balme, P., Cytermann, J.-R., Dupont, J.-L., Guillaume, H., Langlois-Berthelot,M.,Macron,E.,deMalleray,P.-A.&Szymankievicz,C.(2007). Rapport sur la valorisation de la recherche. Paris: Ministère de l'Économie, de l'industrie et des finances.
Basant,R.&Chandra,P.(2007). University-Industry Link and Enterprise CreationinIndia–SomeStrategicandPolicyIssues.InYusuf&Nabeshima(Eds.), How Universities Promote Economic Growth. Washington, D.C.: The World Bank, 209-226.
Belenzon,S.&Schankerman,M.(2009). University Knowledge Transfer: Private Ownership, Incentives, and Local Development Objectives. Journal of Law and Economics, 52(1), 111-144.
Belenzon,S.&Schankerman,M.(2010). Spreading the Word: Geography, Policy and University Knowledge Diffusion. CEP Discussion Paper, CEPDP1005.
Bishop, K., D'Este, P. & Neely, A. (2011). Gaining from Interactions with Universities: Multiple Methods for Nurturing Absorptive Capacity. Research Policy, 40(1), 30-40.
Boettiger S., B.A.B. (2006). The Bayh-Dole Act: Implications for Developing Countries. IDEA: The Intellectual Property Law Review, 46(2), 259-279.
Breschi,S.,Lissoni,F.&Montobbio,F.(2007). The Scientific Productivity of Academic Inventors: New Evidence from Italian Data. Economics of Innovation and New Technology, 16(2), 101-118.
Caballero, R.J. & Jaffe, A.B. (1993). How High are the Giants' Shoulders: An Empirical Assessment of Knowledge Spillovers and Creative Destruction in a Model of Economic Growth. In O.J. Blanchard & S. Fischer (Eds.), NBER Macroeconomics Annual(Vol.8).Chicago:TheUniversityofChicagoPress, 15-74.
Campbell,E.G.,Clarridge,B.R.,Gokhale,M.,Birenbaum,L.,Hilgartner,S., Holtzman, N.A. & Blumenthal, D. (2002). Data Withholding in Academic Genetics: Evidence from a National Survey. Journal of the American Medical Association, 287(4), 473-480.
Campbell, E.G., Weissman, J.S., Causino, N. & Blumenthal, D. (2000). Data Withholding in Academic Medicine: Characteristics of Faculty Denied Access to Research Rsults and Biomaterials. Research Policy, 29(2), 303-312.
Cervantes, M. (2009). Academic Patenting: How Universities and Public Research Organizations are Using Their Intellectual Property to Boost Research and Spur Innovative Start-ups. Retrieved from www.wipo.int/sme/en/documents/academic_patenting.html
Chapple,W.,Lockett,A.,Siegel,D.&Wright,M.(2005). Assessing the Relative Performance of U.K. University Technology Transfer Offices: Parametric and Non-parametric Evidence. Research Policy, 34(3), 369-384.
Chokshi,D.A.(2006). Improving Access to Medicines in Poor Countries: The Role of Universities. PLoS Medicine, 3(6).
Chokshi,D.A.&Rujkumar,R.(2007). Leveraging University Research to Advance Global Health. Journal of the American Medical Association, 29(16), 1934-1936.
Clemente,F.-P.(2006). The Impact of Stronger Intellectual Property Rights on Science and Technology in Developing Countries. Research Policy, 35(6), 808-824.
Cohen, W.M. & Levinthal, D.A. (1989). Innovation and Learning: The Two Faces of R & D. The Economic Journal, 99(397), 569-596.
Commonwealth of Australia (2011). National Survey of Research Commercialization 2008 and 2009 – Selected Measures of Commercialisation Activity in Australia’s Universities, Publicly Funded Research Agencies, Medical Research Institutes and Cooperative Research Centres. Canberra: Commonwealth of Australia.
Conti, A. & Gaule, P. (2011). Is the US Outperforming Europe in University Technology Licensing? A New Perspective on the European Paradox. Research Policy, 40(1), 123-135.
Craig Boardman, P. & Ponomariov, B.L. (2009). University Researchers Working with Private Companies. Technovation, 29(2), 142-153.
Crespi, G.A., Geuna, A., Nomaler, Ö. & Verspagen, B. (2010). University IPRs and Knowledge Transfer: Is University Ownership More Efficient? Economics of Innovation and New Technology, 19(7), 627-648.
Czarnitzki,D.,Glänzel,W.&Hussinger,K.(2009). Heterogeneity of Patenting Activity and Its Implications for Scientific Research. Research Policy, 38(1), 26-34.
Czarnitzki,D.,Hussinger,K.&Schneider,C.(2011). Commercializing Academic Research: the Quality of Faculty Patenting. Industrial and Corporate Change.
Dalmarco,G.&Freitas,d.M.(2011). Universities' Intellectual Property: Path for Innovation or Patent Competition? Journal of Technology Management & Innovation, 6(3).
Daraio, C., Bonaccorsi, A., Geuna, A., Lepori, B., Bach, L., Bogetoft, P. et al. (2011). The European University Landscape: A Micro Characterization Based on Evidence from the Aquameth Project. Research Policy, 40(1), 148-164.
Dasgupta, P. & David, P.A. (1994). Toward a New Economics of Science. Research Policy, 23(5), 487-521.
David, P.A. (2004). Can "Open Science" Be Protected from the Evolving Regime of IPR Protections? Journal of Institutional and Theoretical Economics JITE, 160(1), 9-34.
David, P.A. & Hall, B.H. (2006). Property and the Pursuit of Knowledge: IPR Issues Affecting Scientific Research. Research Policy, 35(6), 767-771.
David, P.A., Mowery, D. & Steinmueller, W.E. (1992). Analysing the Economic Payoffs from Basic Research. Economics of Innovation and New Technology, 2(1), 73-90.
Debackere,K.&Veugelers,R.(2005). The Role of Academic Technology Transfer Organizations in Improving Industry Science Links. Research Policy, 34(3), 321-342.
Di Gregorio, D. & Shane, S. (2003). Why Do Some Universities Generate More Start-ups than Others? Research Policy, 32(2), 209-227.
Du Plessis, M., Van Looy, B., Song, X. & Magerman, T. (2010). Data Production Methods for Harmonized Patent Statistics: Patentee Sector Allocation 2009. Brussels: Eurostat.
Edwin, M. (1991). Academic Research and Industrial Innovation. Research Policy, 20(1), 1-12.
Eisenberg, R. (1989). Patents and the Progress of Science: Exclusive Rights and Experimental Use. University of Chicago Law Review, 56, 1017-1055.
Engel, N. (2008). University Patenting and its Effects: An Assessment for Developing Countries. In C. S. Krishna (Ed.), Technology Transfer: Intellectual Property Rights Hyderabad: Amicus Books/The Icfai University Press, 127-142.
European Commission (2008). Commission Recommendation on the Management of Intellectual Property in Knowledge Transfer Activities and Code of Practice for Universities and Other Public Research Organizations. Luxembourg: European Commission.
European Commission (2009). Expert Group on Knowledge Transfer – Final Report. In Directorate General for Research (Ed.). Brussels: European Commission.
177
Chapter 4 harnessing publiC researCh for innovation – the role of intelleCtual property
Fabrizio,K.R.&DiMinin,A.(2008). Commercializing the Laboratory: Faculty Patenting and the Open Science Environment. Research Policy, 37(5), 914-931.
Foray,D.&Lissoni,F.(2010). University Research and Public-Private Interaction. In B.H. Hall & N.Rosenberg (Eds.), Handbook of the Economics of Innovation(Vol.1).Amsterdam:NorthHolland,275-314.
Geuna, A. & Nesta, L.J.J. (2006). University Patenting and Its Effects on Academic Research: The Emerging European Evidence. Research Policy, 35(6), 790-807.
Geuna,A.&Rossi,F.(2011). Changes to University IPR Regulations in Europe and the Impact on Academic Patenting. Research Policy, 40(8), 1068-1076.
Goldfarb,B.,Henrekson,M.,&Rosenberg,N.(2001). Demand vs. Supply Driven Innovations: US and Swedish Experiences in Academic Entrepreneurship. SIEPR Discussion Paper, 0436.
Goldfarb, B., Sampson, R.C. & Ziedonis, A.A. (2011). Incentives or Resources? Commercialization of University Research by Start-Ups vs. Established Firms. Paper presented at the DRUID 2011. Retrieved from http://druid8.sit.aau.dk/druid/acc_papers/pejqk7endg416ljvit0t91ds0uac.pdf
Graff, Gregory D., Bradford, Kent J., Zilberman, David & Bennett, Alan B. (2003). The Public-Private Structure of Intellectual Property Ownership in Agricultural Biotechnology. Nature Biotechnology, 21, 989-995.
Griliches, Z. (1980). R&D and the Productivity Slowdown. The American Economic Review, 70(2), 343-348.
Grimaldi, R., Kenney, M., Siegel, D.S. & Wright, M. (2011).30YearsafterBayh-Dole: Reassessing Academic Entrepreneurship. Research Policy, 40(8), 1045-1057.
Guan,J.C.,Yam,R.C.M.&Mok,C.K.(2005). Collaboration Between Industry and Research Institutes/Universities on Industrial Innovation in Beijing, China. Technology Analysis & Strategic Management, 17(3), 339-353.
Guellec, D., Madies, T. & Prager, J.-C. (2010). Les marchés de brevets dans l'économie de la connaissance. Les Rapports du Conseil d'analyse économique. Paris: Conseil d'analyse économique.
Gulbrandsen,M.,Mowery,D.&Feldman,M.(2011).Introduction to the Special Section: Heterogeneity and University-Industry Relations. Research Policy, 40(1), 1-5.
Gupta , V.K. (2008). Indian Patent Output 1990-2007. India, Science and Technology: 2008. S&T Output and Patents. New Delhi: National Institute of Science, Technology and Development Studies.
Heller, M. & Eisenberg, R. (1998). Can Patents Deter Innovation? The Anticommons in Biomedical Research. Science, 280, 698-701.
Inspectiongénéraledesfinances(2007). Rapport sur la valorisation de la recherche, Pour le Ministère de l'économie, des finances et de l'industrie et le Ministère de l'éducation nationale, de l'enseignement supérieur et de la recherche. Paris.
Jaffe, A. B. (1989). Real effects of academic research. The American Economic Review, 79(5), 957-970.
Japan Patent Office (2010). Japan Patent Office Annual Report. Tokyo: Japan Patent Office.
Jensen, R., Thursby, J. & Thursby, M.C. (2010). University-Industry Spillovers, Government Funding, and Industrial Consulting. National Bureau of Economic Research Working Paper Series, No. 15732.
Jensen, R. & Thursby, M. (2001). Proofs and Prototypes for Sale: The Licensing of University Inventions. The American Economic Review, 91(1), 240-259.
Just, R.E. & Huffman, W.E. (2009). The Economics of Universities in a New Age of Funding Options. Research Policy, 38(7), 1102-1116.
Kapsynski,A.,Crone,T.E.&Merson,M.(2003). Global Health and University Patents. Science, 301, 1629.
Kenney, M. & Patton, D. (2009). Reconsidering the Bayh-Dole Act and the Current University Invention Ownership Model. Research Policy, 38(9), 1407-1422.
Khan, M. and S. Wunsch-Vincent. (2011). Capturing Innovation: The Patent System. In S. Dutta & I. Mia (Eds.), The Global Information Technology Report 2010–2011. Geneva: World Economic Forum. Chapter 1.1, Box 3.
Korean Ministry of Knowledge Economy (2010). Analysis of Technology Transfer. Seoul: Korean Ministry of Knowledge Economy.
Kuramoto, J., & Torero, M. (2009). Public–Private Research, Development, and Innovation in Peru. In M. Graham & J. Woo (Eds.), Fuelling Economic Growth: The Role of Public–Private Sector Research in Development (pp. 105-158). Ottawa: Practical Action Publishing/International Development Research Centre.
Lach,S.&Schankerman,M.(2008). Incentives and Invention in Universities. The RAND Journal of Economics, 39(2), 403-433.
Larsen, M.T. (2011). The Implications of Academic Enterprise for Public Science: An Overview of the Empirical Evidence. Research Policy, 40(1), 6-19.
Lissoni,F.,Llerena,P.,McKelvey,M.&Sanditov,B.(2008).Academic Patenting in Europe: New Evidence from the KEINS Database. Research Evaluation, 16(2), 87–102.
Litan, R.E., Mitchell, L. & Reedy, E.J. (2008). Commercializing University Innovations: Alternative Approaches. In A.B. Jaffe, J. Lerner & S. Stern (Eds.), Innovation Policy and the Economy(Vol.8).Cambridge,MA:MITPress,pp. 31-57.
Luan, C., Zhou, C. & Liu, A. (2010). Patent Strategy in Chinese Universities: A Comparative Perspective. Scientometrics, 84(1), 53-63.
Luintel, K. B., & Khan, M. (2011). Basic, applied and experimental knowledge and productivity: Further evidence. Economics Letters, 111(1), 71-74.
MacDonald, L., Capart, G., Bohlander, B., Cordonnier, M., Jonsson, L., Kaiser, L., Lack, J., Mack, J., Matacotta, C., Schwing, T., Sueur, T., van Grevenstein, P., van den Bos, L. & Vonortas, N.S. (2004). Management of Intellectual Property in Publicly-Funded Research Organisations: Towards European Guidelines, Expert Group Report to the European Commission. Luxembourg: European Communities.
Mansfield, E. (1998). Academic Research and Industrial Innovation: An Update of Empirical Findings. Research Policy, 26(7-8), 773-776.
Merrill, S.A. & Mazza, A.-M. (2010). Managing University Intellectual Property in the Public Interest National Research Council: Committee on Management of University Intellectual Property: Lessons from a Generation of Experience. Washington, D.C.: National Academy of Sciences.
Montobbio,F.(2009). Intellectual Property Rights and Knowledge Transfer from Public Research to Industry in the US and Europe: Which Lessons for Innovation Systems in Developing Countries? The Economics of Intellectual Property: Suggestions for Further Research in Developing Countries and Countries with Economies in Transition. Geneva: World Intellectual Property Organization.
Mowery, D.C., Nelson, R.R., Sampat, B.N. & Ziedonis, A.A. (2001). The Growth of Patenting and Licensing by U.S. Universities: An Assessment of the Effects of the Bayh-Dole Act of 1980. Research Policy, 30(1), 99-119.
Mowery, D.C., Nelson, R.R., Sampat, B.N. & Ziedonis, A.A. (2004). Ivory Tower and Industrial Innovation: University-Industry Technology Transfer Before and After Bayh-Dole. Stanford: Stanford University Press.
Murray,F.,Aghion,P.,Dewatripont,M.,Kolev,J.&Stern,S.(2009). Of Mice and Academics: Examining the Effect of Openness on Innovation. National Bureau of Economic Research Working Paper Series, 14819.
Murray,F.&Stern,S.(2007). Do Formal Intellectual Property Rights Hinder the free Flow of Scientific Knowledge?: An Empirical Test of the Anti-commons Hypothesis. Journal of Economic Behavior & Organization, 63(4), 648-687.
Navarro, J.C., Llisterri, J. & Zuñiga, P. (2010). The Importance of Ideas for Innovation and Productivity. In C. Pages (Ed.), The Age of Productivity: Transforming Economies from the Bottom Up. Washington, D.C.: Pallgrave, Macmillan.
Nelson, R.R. (2004). The Market Economy, and the Scientific Commons. Research Policy, 33(3), 455-471.
Nill, D.W. (2002). Corporate Sponsored Research and Development at Universities in the US. AIPPI Journal, June 2002.
NSF(2010). Science and Engineering Indicators. Arlington,VA:NationalScience Board.
178
Chapter 4 harnessing publiC researCh for innovation – the role of intelleCtual property
OECD (2003). Turning Science into Business – Patenting and Licensing at Public Research Organisations. Paris: Organisation for Economic Co-operation and Development.
OECD (2008a). Assessing the Socio-economic Impacts of Public R&D: Recent Practices and Perspectives. Science, Technology and Industry Outlook 2008. Paris: Organisation for Economic Co-operation and Development.
OECD (2008b). ICT Research and Development and Innovation. Information Technology Outlook. Paris: Organisation for Economic Co-operation and Development.
OECD (2011). Science, Technology and Industry Scoreboard 2011. Paris: Organisation for Economic Co-operation and Development.
Owen-Smith, J. & Powell, W.W. (2001). To Patent or Not: Faculty Decisions and Institutional Success at Technology Transfer. Journal of Technology Transfer, 26(1-2), 99-114.
Owen-Smith, J. & Powell, W.W. (2003). The Expanding Role of University Patenting in the Life Sciences: Assessing the Importance of Experience and Connectivity. Research Policy, 32(9), 1695-1711.
PILANetwork(2009). Gestión de propiedad intelectual e industrial en las instituciones de educación superior. Buenas practicas en universidades de Latinoamérica y Europa, Research Report: Red de Propiedad Intelectual e Industrial en Latinoamérica.
Rafferty, M. (2008). The Bayh-Dole Act and University Research and Development. Research Policy, 37(1), 29-40.
RedOTRI (2008). Annual Survey on Knowledge and Technology Transfer: Red Oficinas de Transferencia de Resultados de Investigación.
Roessner,D.,Bond,J.,Okubo,S.,&Planting,M.(2009).The Economic Impact of Licensed Commercialized Inventions Resulting from University Research, 1996-2007, Final Report prepared for the Biotechnology Industry Organization, www.oregonbio.org/Portals/0/docs/Education/BIO_EDU_partnership_final_report.pdf.
Rosenberg, N. & Nelson, R.R. (1994). American Universities and Technical Advance in Industry. Research Policy, 23(3), 323-348.
Rothaermel,F.T.,Agung,S.D.&Jiang,L.(2007). University Entrepreneurship: A Taxonomy of the Literature. Industrial and Corporate Change, 16(4), 691-791.
Sampat, B.N. (2006). Patenting and US Academic Research in the 20th Century: The World Before and After Bayh-Dole. Research Policy, 35(6), 772-789.
Sampat, B.N. (2009). Academic Patents and Access to Medicines in Developing Countries. American Journal of Public Health, January, 99(1), 9-17.
Sampat, B.N. (2009). The Bayh-Dole Model in Developing Countries: Reflections on the Indian Bill on Publicly Funded Intellectual Property. UNCTAD – ICTSD Policy Brief (5).
SCImago (2010). SIR World Report, SCIMAGO Institution Rankings.
Scotchmer, S. (2004). Innovation and Incentives. Cambridge: MIT Press.
Shane, S. (2004). Academic Entrepreneurship. Cheltenham: Edward Elgar.
Sibanda,M.(2007). The State of Patenting in South Africa. Special Report 2007.
Sibanda, M. (2009). Intellectual Property, Commercialization and Institutional Arrangements at South African Publicly Financed Research Institutions, The Economics of Intellectual Property in South Africa. Geneva: World Intellectual Property Organization.
So,A.D.,Sampat,B.N.,Rai,A.K.,Cook-Deegan,R.,Reichman,J.H.,Weissman, R. et al. (2008). Is Bayh-Dole Good for Developing Countries? Lessons from the US Experience. PLoS Biol, 6(10), e262.
Stephan, P.E. (2010). The Economics of Science. In B.H. Hall & N. Rosenberg (Eds.), Handbook of the Economics of Innovation(Vol.1).Amsterdam:NorthHolland, pp. 217-273.
Stokes,D.E.(1997). Pasteur's Quadrant: Basic Science and Technological Innovation. Washington, D.C.: Brookings Institution Press.
Thursby,J.G.&Thursby,M.C.(2007). University Licensing. Oxford Review of Economic Policy, 23(4), 620-639.
Thursby, J.G. & Thursby, M.C. (2011). Faculty Participation in Licensing: Implications for Research. Research Policy, 40(1), 20-29.
UNESCO (2010). UNESCO Science Report 2010. Paris: United Nations Educational, Scientific and Cultural Organization.
VanLooy,B.,Callaert,J.&Debackere,K.(2006). Publication and Patent Behavior of Academic Researchers: Conflicting, Reinforcing or Merely Co-existing? Research Policy, 35(4), 596-608.
Van Looy, B., Landoni, P., Callaert, J., van Pottelsberghe, B., Sapsalis, E. & Debackere,K.(2011). Entrepreneurial Effectiveness of European Universities: An Empirical Assessment of Antecedents and Trade-offs. Research Policy, 40(4), 553-564.
VanLooy,B.,Ranga,M.,Callaert,J.,Debackere,K.&Zimmermann,E.(2004). Combining Entrepreneurial and Scientific Performance in Academia: Towards a Compounded and Reciprocal Matthew-effect? Research Policy, 33(3), 425-441.
Engel, N. (2008). University Patenting and its Effects: An Assessment for Developing Countries. In C. S. Krishna (Ed.), Technology Transfer: Intellectual Property Rights Hyderabad: Amicus Books/The Icfai University Press, 127-142.
Vincent-Lancrin, S. (2006). What is Changing in Academic Research? Trends and Future Scenarios. European Journal of Education, 41(2), 169-202.
Vincett, P.S. (2010). The Economic Impacts of Academic Spin-off Companies, and Their Implications for Public Policy. Research Policy, 39(6), 736-747.
Wadhwa, V. (2011). Innovation's Golden Opportunity. Washington Post. Retrieved from http://wadhwa.com/2011/06/12/washington-post-innovation%E2%80%99s-golden-opportunity/
Walsh, J., Cho, C. & Cohen, W.M. (2005). Patents, Material Transfers and Access to Research Inputs in Biomedical Research. Washington, D.C.: National Academy of Sciences.
Wright,M.,Clarysse,B.,Mustar,P.&Lockett,A.(Eds.).(2007). Academic Entrepreneurship in Europe. Cheltenham: Edward Elgar.
Wu, W. (2010). Higher Education Innovation in China; Washington DC: World Bank, East Asia and Pacific Region Human Development Department.
Zucker,L.G.,Darby,M.R.&Brewer,M.B.(1998).Intellectual Human Capital and the Birth of U.S. Biotechnology Enterprises. The American Economic Review, 88(1), 290-306.
Zuñiga, P. (2011). The State of Patenting at Research Institutions in Developing Countries: Policy Approaches and Practices. WIPO Economics Research Working Papers, World Intellectual Property Organization.
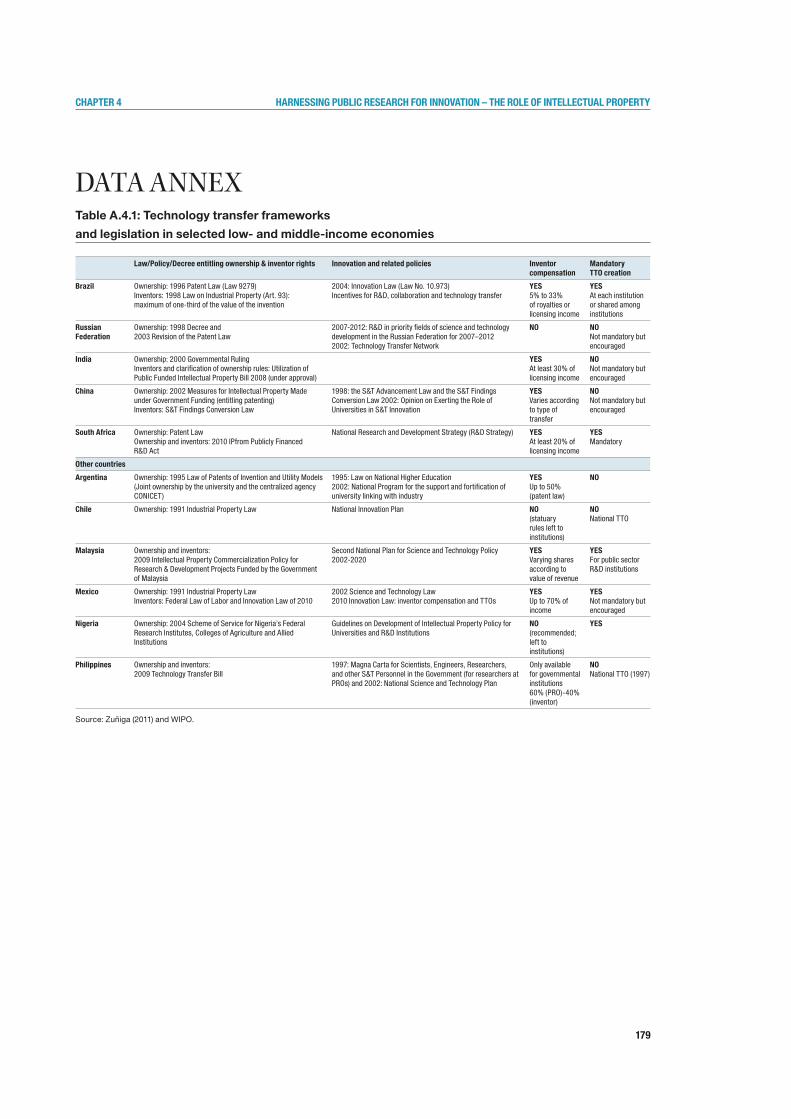
179
Chapter 4 harnessing publiC researCh for innovation – the role of intelleCtual property
dAtA AnneXTable A.4.1: Technology transfer frameworks
and legislation in selected low- and middle-income economies
Source: Zuñiga (2011) and WIPO.
law/Policy/decree entitling ownership & inventor rights Innovation and related policies Inventor compensation
Mandatory TTo creation
brazil Ownership: 1996 Patent Law (Law 9279)Inventors: 1998 Law on Industrial Property (Art. 93): maximum of one-third of the value of the invention
2004: Innovation Law (Law No. 10.973) Incentives for R&D, collaboration and technology transfer
YeS5% to 33% of royalties or licensing income
YeSAt each institution or shared among institutions
russian Federation
Ownership: 1998 Decree and 2003 Revision of the Patent Law
2007-2012: R&D in priority fields of science and technology development in the Russian Federation for 2007–20122002: Technology Transfer Network
no noNot mandatory but encouraged
India Ownership: 2000 Governmental Ruling Inventors and clarification of ownership rules: Utilization of Public Funded Intellectual Property Bill 2008 (under approval)
YeSAt least 30% of licensing income
noNot mandatory but encouraged
China Ownership: 2002 Measures for Intellectual Property Made under Government Funding (entitling patenting)Inventors: S&T Findings Conversion Law
1998: the S&T Advancement Law and the S&T Findings Conversion Law 2002: Opinion on Exerting the Role of Universities in S&T Innovation
YeS Varies according to type of transfer
noNot mandatory but encouraged
South Africa Ownership: Patent LawOwnership and inventors: 2010 IPfrom Publicly Financed R&D Act
National Research and Development Strategy (R&D Strategy) YeS At least 20% of licensing income
YeSMandatory
other countries
Argentina Ownership: 1995 Law of Patents of Invention and Utility Models (Joint ownership by the university and the centralized agency CONICET)
1995: Law on National Higher Education2002: National Program for the support and fortification of university linking with industry
YeSUp to 50% (patent law)
no
Chile Ownership: 1991 Industrial Property Law National Innovation Plan no(statuary rules left to institutions)
noNational TTO
Malaysia Ownership and inventors: 2009 Intellectual Property Commercialization Policy for Research & Development Projects Funded by the Government of Malaysia
Second National Plan for Science and Technology Policy 2002-2020
YeSVarying shares according to value of revenue
YeSFor public sector R&D institutions
Mexico Ownership: 1991 Industrial Property LawInventors: Federal Law of Labor and Innovation Law of 2010
2002 Science and Technology Law 2010 Innovation Law: inventor compensation and TTOs
YeSUp to 70% of income
YeSNot mandatory but encouraged
nigeria Ownership: 2004 Scheme of Service for Nigeria’s Federal Research Institutes, Colleges of Agriculture and Allied Institutions
Guidelines on Development of Intellectual Property Policy for Universities and R&D Institutions
no(recommended; left to institutions)
YeS
Philippines Ownership and inventors: 2009 Technology Transfer Bill
1997: Magna Carta for Scientists, Engineers, Researchers, and other S&T Personnel in the Government (for researchers at PROs) and 2002: National Science and Technology Plan
Only available for governmental institutions60% (PRO)-40% (inventor)
noNational TTO (1997)
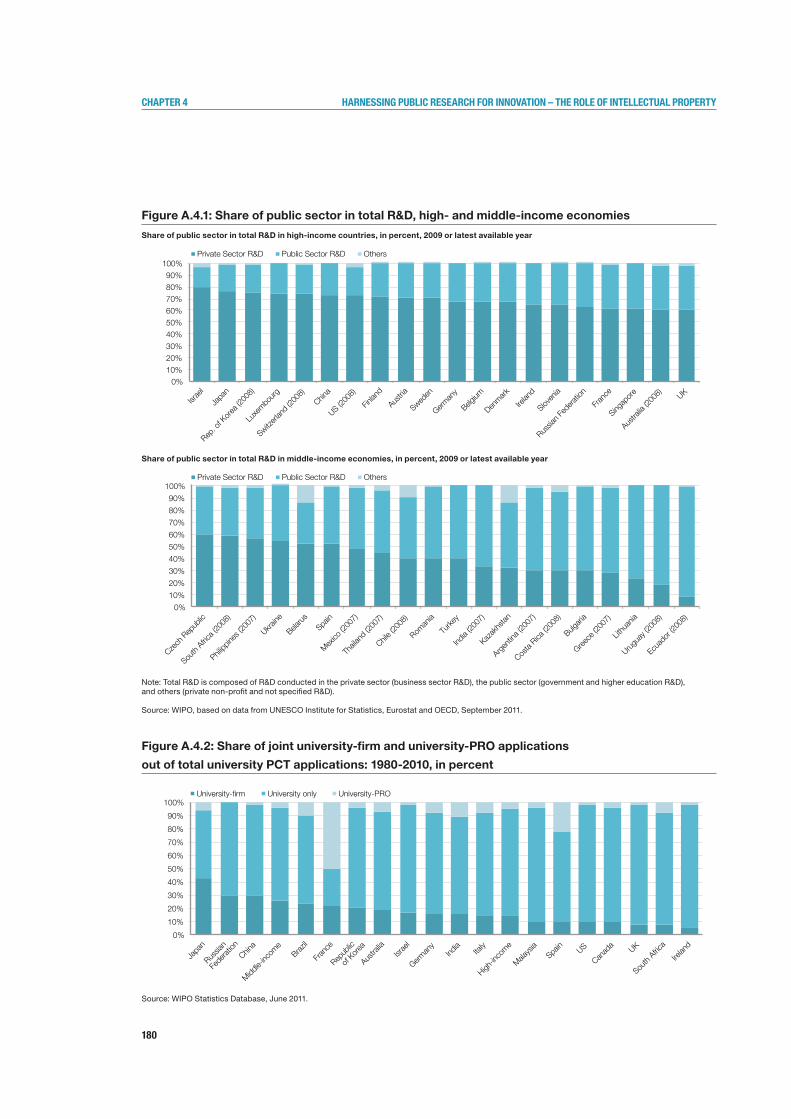
180
Chapter 4 harnessing publiC researCh for innovation – the role of intelleCtual property
Figure A.4.1: Share of public sector in total R&D, high- and middle-income economies
Share of public sector in total R&D in high-income countries, in percent, 2009 or latest available year
Share of public sector in total R&D in middle-income economies, in percent, 2009 or latest available year
Note: Total R&D is composed of R&D conducted in the private sector (business sector R&D), the public sector (government and higher education R&D), and others (private non-profit and not specified R&D).
Source: WIPO, based on data from UNESCO Institute for Statistics, Eurostat and OECD, September 2011.
Figure A.4.2: Share of joint university-firm and university-PRO applications
out of total university PCT applications: 1980-2010, in percent
Source: WIPO Statistics Database, June 2011.
0%
10%
20%
30%
40%
50%
60%
70%
80%
90%
100%
Israe
l
Japa
n
Rep. o
f Kor
ea (2
008)
Luxe
mbour
g
Switzerl
and
(2008
)
China
US (200
8)
Finlan
d
Austria
Sweden
German
y
Belgium
Denmark
Irelan
d
Sloven
ia
Russia
n Fed
eratio
n
Fran
ce
Singap
ore
Austra
lia (2
008) UK
Private Sector R&D Public Sector R&D Others
0%
10%
20%
30%
40%
50%
60%
70%
80%
90%
100%
Czech
Rep
ublic
South
Africa (
2008
)
Philipp
ines (
2007
)
Ukraine
Belaru
s
Spain
Mexico
(200
7)
Thail
and
(2007
)
Chile (
2008
)
Roman
ia
Turke
y
India
(2007
)
Kazak
hstan
Argen
tina (
2007
)
Costa
Rica (2
008)
Bulgari
a
Greece
(200
7)
Lithu
ania
Urugu
ay (2
008)
Ecuad
or (2
008)
Private Sector R&D Public Sector R&D Others
0%
10%
20%
30%
40%
50%
60%
70%
80%
90%
100%
Japa
n
Russia
n
Fede
ration
China
Middle-
incom
e
Brazil
Fran
ce
Repub
lic
of Kor
ea
Austra
lia
Israe
l
German
y Ind
ia Ita
ly
High-in
come
Malays
ia
Spain US
Canad
a UK
South
Africa
Irelan
d
University- rm University only University-PRO
181
Chapter 4 harnessing publiC researCh for innovation – the role of intelleCtual property
metHodologIcAl AnneXCounting university and PRO patents
in filings under the PCT
PCT records do not classify applicants by institutional cat-
egory. To count the number of university and PRO appli-
cations, one needs to identify applicants and assign them
to a category. This is done by searching the names of
applicants or their addresses as recorded in patent docu-
ments, and determining, based on the name, whether the
applicant is a university, PRO, company or an individual.
WIPO’s Statistics Database contains PCT application
data. Upon filing, an applicant is classified as an individual
or non-individual. The following procedures have been
used to categorize PCT applicants as a university139 or
PRO: as a first step, the names of non-individual appli-
cants were consolidated in order to obtain a standard
name for each. Next, a list of keywords identifying uni-
versities, university hospitals and PROs was compiled.
In the final phase, manual checks were performed to
ensure that applicants were classified correctly. Where in
doubt about the classification, a web-based search was
performed for additional information. One should note
that, in the chosen methodology, applicants are classified
according to their names only, without considering their
employment relationship or address. Therefore, where a
natural person is identified as the applicant filing on behalf
of an educational institution, that application would not
be classified as belonging to a university.
A similar search method has been developed at the
Catholic University of Leuven (Belgium).140 It also relies
on information contained in the applicant’s name and,
with the help of a list of keywords, assigns applicants to
a category. A notable difference in assigning an appli-
cation to a country is that Leuven’s method uses every
applicant’s country of origin whereas, in the method de-
scribed above, only the first applicant’s country of origin
is used. This could potentially lead to a downward bias
in the contribution of low- and middle-income countries
to academic patenting.
The performance of the two search methods has been
compared for countries with at least 4,000 PCT appli-
cations over the period 1990-2010. Some differences
emerge, with the WIPO method reporting greater shares
of both university and PRO applications. This can be at-
tributed to differences in classification of organizations
with the definitions and interpretations varying country
by country, and/or to the use of different data sources.
Counting university and PRO patents
in national patent filings
Data on national patent applications are generally difficult
to obtain for a larger group of countries on a consistent
and comparable basis. Showing such data is, however,
a valuable exercise, because international applications
filed through the PCT system capture only a small pro-
portion of a country’s total patenting activity, and they
underestimate the activity of non-PCT members such
as Argentina and other Latin American countries. Most
reliable statistics originate from national patent offices
or government institutes which track patent applications
or patents granted. Frequently, however, a given mea-
surement approach may differ from that of a reporting
institution in another country, making cross-country
comparisons difficult.
An additional source of national patent applications data
is the Patstat database compiled by the EPO. Due to
missing data for some countries and years, it is more
challenging to analyze and especially to compare country
patent output at the national level. The data provided here
should be read with caution and seen as an attempt to
provide a broader overview of country patenting activity
that goes beyond PCT applications.
139 The university category includes all types
of educational establishments (e.g.,
university, colleges, polytechnics, etc.).
140 See Du Plessis et al. (2010).
182
Chapter 4 harnessing publiC researCh for innovation – the role of intelleCtual property
As was done for PCT data, Patstat does not classify pat-
ent applicants in groups that separate individuals from
institutions or that show institutional affiliation. In order to
identify universities and PROs, one would need to per-
form a search that relied entirely on applicants’ names.
Certain words – like “university”, “college”, “school”,
“government”, or “ministry” – in various languages can
help to identify institutions. An extensive list of such key-
words forms the basis of the search method for identifying
universities and PROs in the Patstat database.
Through direct contact with government officials, and by
consulting government websites and university directo-
ries, lists of universities for 54 countries were carefully
checked, and keywords that help identify universities
were selected.141 Through the same approach, lists of
PROs for 38 countries were compiled from which, again,
keywords identifying PROs were selected.142 Scopus is
a database containing citations and abstracts for scien-
tific journal articles. The top 200 publishing institutions
in 62 countries143 (out of a total of 12,400 institutions)
were identified from that database. In addition, the list of
keywords and institutions was enriched by using the SIR
World Report (2010), which provides a list of top publish-
ing institutions in the world – 2,833 in total.
Several quality checks have been performed. Two issues
emerge when producing university and PRO numbers
from Patstat: first, the reliability of the data and, second,
the reliability of the search method itself, or how well it
identifies those institutions. The first question can be
addressed by comparing Patstat values on aggregate
applications per year per country of origin to aggregate
numbers reported to WIPO by national patent offices.
WIPO conducts an annual survey of national patent of-
fices’ data on patent applications filed. Patstat collects
data on applications published. A small discrepancy
between the two groups – filed versus published – can
be expected, the first being always larger, since some
applications are withdrawn and never published.
To verify how well the search method identifies institu-
tions, the results are compared to government reports
for selected countries, wherever available.
It is important to note that the country assigned to an ap-
plication is the country of residence of the first applicant.
Data are classified either by origin – all applications with
the first applicant originating from that country – or by
office – all applications filed in that country. Data by of-
fice are broken down into resident applications (filed by
individuals or institutions originating from that country)
and non-resident applications (filed by individuals or
institutions from abroad).
141 Argentina, Australia, Austria, Bangladesh, Belgium,
Brazil, Bulgaria, Canada, Chile, Colombia, Cuba,
Czech Republic, Denmark, Egypt, Estonia, Ethiopia,
Finland, France, Germany, Greece, Hungary,
Iceland, India, Indonesia, Iran (Islamic Republic
of), Ireland, Israel, Italy, Japan, Republic of Korea,
Luxembourg, Malaysia, Mexico, Netherlands, New
Zealand, Nigeria, Norway, Philippines, Poland,
Portugal, Russian Federation, Serbia, Slovakia,
Slovenia, South Africa, Spain, Sweden, Switzerland,
Turkey, UK, Ukraine, US, Uzbekistan, Venezuela.
142 Argentina, Australia, Austria, Belgium, Brazil,
Canada, Chile, Colombia, Czech Republic,
Denmark, Estonia, Ethiopia, Finland, France,
Germany, Greece, Hungary, Iceland, Ireland, Israel,
Italy, Japan, Republic of Korea, Luxembourg,
Mexico, Netherlands, New Zealand, Norway,
Poland, Portugal, Slovakia, Slovenia, Spain,
Sweden, Switzerland, Turkey, UK, US.
143 Albania, Algeria, Argentina, Armenia, Australia,
Azerbaijan, Bangladesh, Barbados, Brazil, Canada,
Chile, China, Colombia, Cuba, Denmark, Egypt,
Ethiopia, Finland, France, Germany, Ghana,
Hungary, India, Israel, Italy, Jamaica, Japan,
Jordan, Madagascar, Malaysia, Mexico, Morocco,
Mozambique, Netherlands, New Zealand, Norway,
Pakistan, Peru, Philippines, Poland, Republic
of Korea, Romania, Russian Federation, Saudi
Arabia, Senegal, Singapore, Slovenia, South
Africa, Spain, Sweden, Switzerland, Thailand,
Trinidad and Tobago, Tunisia, Turkey, Uganda,
Ukraine, UK, US, Uruguay, Uzbekistan, Viet Nam.

183
ACronYMS
AcRonYmsASTP Association of European Science and
Technology Transfer Professionals
AUTM Association of University
Technology Managers
BRICS Brazil, the Russian Federation,
India, China and South Africa
CATI Cooperative Agreement and
Technology Indicators
CDIP WIPO Committee on Development
and Intellectual Property
CERN European Organization for
Nuclear Research
CHF Swiss Franc
CIS Community Innovation Survey
CORE Cooperative Research
CPI Consumer Price Index
CSIR Council of Scientific and
Industrial Research
DVD Digital Video Disc
EHCI Enhanced Host Controller Interface
EPO European Patent Office
EU European Union
EUR Euro
FDI Foreign Direct Investment
FT Financial Times
FTC Federal Trade Commission
GBP Great Britain Pounds
GDP Gross Domestic Product
GERD Gross Domestic Expenditure on R&D
GPT(s) General Purpose Technology(ies)
HIV/AIDS Human Immunodeficiency Virus/
Acquired Immune Deficiency Syndrome
ICT(s) Information and
Communications Technology(ies)
IDRC International Development Research Centre
IMF International Monetary Fund
INPI Institut national de la propriété industrielle
IP Intellectual property
IPTTO Intellectual Property and
Technology Transfer Offices
IRS Internal Revenue Services
ISIC International Standard
Industrial Classification
JEDEC Joint Electron Device Engineering Council
JPO Japan Patent Office
JPY Japanese Yen
KIBS Knowledge-Intensive Business Services
KTI Knowledge- and Technology-
Intensive Industries
LDCs Least Developed Countries
MERIT UNU Maastricht Economic and
Social Research Institute on
Innovation and Technology
MNEs Multinational Enterprises
MPEG Motion Picture Experts Group
MSTI Main Science and Technology Indicators
NACE Statistical Classification of Economic
Activities in the European Community
NCRPA National Cooperative Research
and Production Act
NESTI National Experts in Science and
Technology Innovation
NIH National Institute of Health
NOTAP National Office for Technology
Acquisition and Promotion
NPEs Non-Practicing Entities
NSB National Statistics Bureau of China
NSF National Science Foundation
NSRC National Survey Research Center
OECD Organization for Economic Co-
operation and Development
OMPIC Office Marocain de la Propriété
Industrielle et Commerciale
PATSTAT Worldwide Patent Statistical Database
PCT Patent Cooperation Treaty
PILA Propiedad Intelectual e Industrial
en Latinoamérica
PIPRA Public Intellectual Property
Resource for Agriculture
PPP Purchasing Power Parity
PRO(s) Public Research Organization(s)
R&D Research and development
RedOTRI Red de Oficinas de Transferencia
de Resultados de Investigación
RIETI Research Institute of Economics,
Trade and Industry
184
ACronYMS
RLF Royalties and License Fees
S&T Science and Technology
SCP Standing Committee on the Law of Patents
SDRAM Synchronous Dynamic
Random Access Memory
SMEs Small and Medium-Sized Enterprises
SSO(s) Standard Setting Organization(s)
STATT Statistics Access for Technology Transfer
TRIPS Trade-Related Aspects of
Intellectual Property Rights
TTO(s) Technology Transfer Office(s)
UK United Kingdom
UN United Nations
UNCTAD United Nations Conference on
Trade and Development
UNESCO United Nations Educational, Scientific
and Cultural Organization
UNIDO United Nations Industrial
Development Organization
US United States
USB Universal Serial Bus
USD United States Dollars
USPTO United States Patent and Trademark Office
WIPO World Intellectual Property Organization

For more information contact WIPO at www.wipo.int
World Intellectual Property Organization34, chemin des ColombettesP.O. Box 18CH-1211 Geneva 20Switzerland
Telephone :+4122 338 91 11Fax :+4122 733 54 28
WIPO Publication No. 944E/2011 ISBN 978-92-805-2160-3


