The changing hydrology of a dammed AmazonKelsie Timpe and David Kaplan*
Developing countries around the world are expanding hydropower to meet growing energy demand. In the BrazilianAmazon, >200 dams are planned over the next 30 years, and questions about the impacts of current and futurehydropower in this globally important watershed remain unanswered. In this context, we applied a hydrologicindicator method to quantify how existing Amazon dams have altered the natural flow regime and to identify predic-tors of alteration. The type andmagnitude of hydrologic alteration variedwidely by dam, but the largest changeswereto critical characteristics of the flood pulse. Impacts were largest for low-elevation, large-reservoir dams; however,small dams had enormous impacts relative to electricity production. Finally, the “cumulative” effect of multiple damswas significant but only for some aspects of the flow regime. This analysis is a first step toward the development ofenvironmental flows plans and policies relevant to the Amazon and other megadiverse river basins.
on June 7, 2018http://advances.sciencem
ag.org/D
ownloaded from
INTRODUCTIONFlow variability is widely recognized as a primary driver of biotic andabiotic conditions in riverine ecosystems (1–4). Alongwith longitudinaland lateral connectivity (5, 6), maintenance of a natural flow regime iscritical for sustaining healthy riverine ecosystems and the services theyprovide (7–9). While the magnitude, timing, and predictability of riverflow vary greatly among river systems, the flood pulse concept (6) pre-dicts that periodic flow pulsing supports productivity, biodiversity, andspecies adaptation (10). Large, lowland rivers often have extensivefloodplains and predictable annual flood pulses, creating recurring spa-tial and temporal variability as the aquatic/terrestrial transition zonemoves up and down the floodplain (11). This dynamic also promotesthe exchange of sediments, nutrients, and biota between the riverchannel and the floodplain (12) and promotes species adaptations tothe dynamic environment of frequent, regular flooding, including fishthat time their spawning with the flood pulse to use floodplains forfeeding and rearing (13) and plants adapted to take advantage offlood-delivered nutrients (14, 15). These dynamic river-floodplain en-vironments (for example, the Amazon, Mekong, Congo, and Yangtzerivers) exhibit some of the highest levels of biodiversity and productivityin the world (16–19).
Dams alter the natural flow regime by changing the magnitude, fre-quency, duration, timing, and rate of change of flow (1), as well as bymodifying the transport of riverine sediments, nutrients, and biota (20).Just upstream of a dam, the creation of a reservoir shifts the environ-ment from lotic to lentic, affecting water quality (21) and potentiallyincreasing atmospheric flux of greenhouse gases from decomposing or-ganic matter (22, 23). Reservoirs generally reduce biodiversity (24) andare specifically detrimental to migratory fish species because the lenticenvironment of the reservoir can act as a “filter” for species reliant onfree-flowing water (25). Reservoirs, even those associated with “run-of-river” dams, trap sediments (26), reducing storage capacity and po-tentially causing backwater effects (27, 28); downstream, floodplainsreceive less nutrient and organic matter deposition (2, 28).
In addition to reduced sediment transport, the most conspicuousdownstream impact of dam construction and operation is permanentalterationof the flow regime (28–31). Stunted floodpulses and increasedbase flows reduce floodplain habitat and encourage the encroachmentof upland vegetation, resulting in the degradation of floodplain forests
and loss of biodiversity (1, 30, 32). Frequent flow reversals and changesin flood timing driven by energy demand can disorient fauna, whichrely on predictable flood timing and duration for migration andspawning cues (33). Rapid changes in flow, particularly if coupled withdecreased sediment load, can also erode river channels and shorelines,resulting in vegetation disturbance and habitat loss (30, 34).
While the negative environmental impacts of dams are fairly wellunderstood, the development of new hydropower to support growingglobal energy demand (35) is widely viewed as a sustainable source ofelectricity (36). Currently, 450 new large dams are planned or in con-struction in the Amazon, Congo, and Mekong basins (16). In theBrazilian Amazon, >30 large and >170 small dams are planned forconstruction over the next 30 years as a result of government plans gearedtoward increased energy security, economic growth, improved livingstandards, and industrialization (37–39). These efforts are a subsetof the Initiative for the Integration of the Regional Infrastructure ofSouthAmerica, which seeks to transformAmazonia into a continentalsource of hydropower and intermodal hub of roads, waterways, andrailroads (40). The rapid pace of planned development, spatial scale ofimpact, and potential for loss of globally important ecosystem servicesmake this impending hydrological transformation unprecedented(41). As such, hydropower development in the Amazon region isexpected to have a cascade of physical, ecological, and social effectsat local to global scales (42), many of which result from dam-inducedchanges to the hydrologic regime.
In recent decades, the concept of “environmental flows” has been ap-plied to understand and, where possible, mitigate the negative impacts ofdams, with a focus on quantifying hydrologic alteration (HA) and subse-quent social-ecological impacts (43–46). At its core, the environmentalflows concept recognizes that societies benefit directly (for example, viafood production) and indirectly (for example, by supporting industry, re-creation, and cultural identity) by allowing free-flowing water to supportaquatic ecosystems (9). Several pioneering studies have sought to identifythe gap between the state of the art globally and within Brazil’s legalframeworkon the subject of environmental flows (47–49), and somehaveworked to adapt and apply holistic environmental flowsmethodologies tospecific cases within Brazil (50, 51).
Despite this progress, implementation of environmental flowsmethods and policies remains in the early stages of development in Brazil(47, 52). Particularly lacking in this context is a basin-wide characteri-zation of the type andmagnitude of dam-induced changes to the hydro-logic regime and a synthesis of the environmental and managementvariables that drive alteration. Put simply, we ask: Are existing dams
causing significant hydrological changes and, if so, in what ways andwhy? The goals of this work are thus (i) to quantify dam-induced HAacross the Brazilian Legal Amazon (Fig. 1), (ii) to identify environ-mental andmanagement variables that predict the observedmagnitudeof hydrological alteration to inform future dam siting and operation,and (iii) to quantify the cumulative effects of multiple dams on a river,where applicable. By advancing these goals, we aim to support theestablishment of holistic environmental flows methods suitable forthe region.
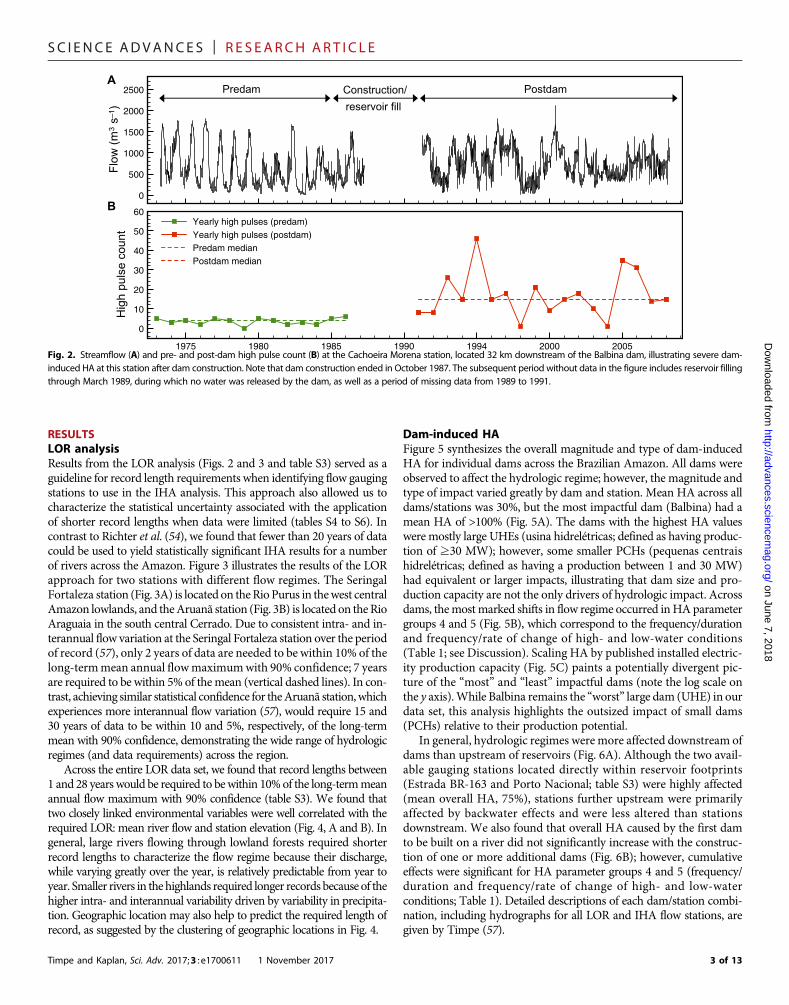
Given the large spatial and temporal scales of analysis and thelimited availability of hydrological and biological data in the region,we used a broadly applicable environmental flows method to quantifythe type and magnitude of HA induced by Amazon dams and to iden-tify the influence of environmental andmanagement predictor variableson the observed alteration. The Indicators of Hydrologic Alteration(IHA) method (1) uses pre- and post-dam construction flow data(Fig. 2A) to calculate 33 ecologically relevant parameters across five“groups” that describe primary facets of the flow regime: magnitude,frequency, duration, timing, and rate of change of flow (Table 1). Therelative differences (percentage) between pre- and post-impact param-eter values (Fig. 2B) are then used to assess and compare dam impactsacross systems.
The hydrologic parameters in Table 1 were chosen specifically be-cause of their relationships to ecological functions, such as populationdynamics and habitat suitability (30). Given their structuring influenceson ecosystems (53), half of the IHA parameters seek to characterize dif-ferent aspects of event extremes, such as the magnitude and duration offlood/drought events. For example, IHA parameters in group 2 include1-, 3-, 7-, 30-, and 90-day maxima and minima; number of zero flowdays; and base flow index. Group 3 parameters describe the timing ofannualminima andmaxima.Group 4 parameters quantify the number/
Timpe and Kaplan, Sci. Adv. 2017;3 : e1700611 1 November 2017
duration of high and lowpulses. Event extremes affect rivermorphologyand physical habitat conditions, availability of floodplain habitats, soilmoisture and anaerobic stress in plants, magnitude of channel-floodplainnutrient exchange, distribution of plant communities, spawning cuesfor migratory fish, and compatibility with aquatic organism life cycles,among others (6). The remaining parameters focus on themagnitude ofaverage flow (group 1; average monthly flows) and the rate of change ofwater conditions (group 5; rise/fall rate and number of reversals).Monthly flows influence the reliability of water supplies for terrestrialanimals and habitat availability for aquatic organisms, whereas the rateof change of flow can affect spawning cues and the trapping of organ-isms on islands or within floodplain lakes (Table 1).
Using a pre-/post-analysis such as IHA to quantify HA in the ab-sence of an experimental control requires assumptions about the lengthof record (LOR) needed to characterize the hydrologic regime. Previousstudies suggested using >20 years of pre- and post-impact data (54);however, this guidance was developed for temperate systems andwouldpreclude IHA application for many Amazonian dams, given their rela-tively recent construction and a lack of long-term hydrological data inthe region (55). To overcome this challenge, we modified the approachof Richter et al. (54) to characterize the uncertainty associated with theapplication of shorter record lengths when data were limited. This LORanalysis was used to determine howmany years of datawere required toachieve a specified level of statistical certainty for any flow gauging sta-tion. This LOR method guided station selection for IHA analysis (seeMethods). Using this approach, we identified 40 flow stations associatedwith 33 dams that had sufficiently long records for analysis (tables S1and S2), allowing us to assess the impacts of both individual and mul-tiple dams. A complete description of hydrology and dam data sets,which have since been published in a larger social-ecological database(56), is given in Methods.
on June 7, 2018em
ag.org/
Large dams analyzed
Small dams analyzed
Other large dams
Other small dams
IHA streamflow stations
LOR streamflow stations
Major rivers
Study area (Brazilian Legal Amazon)
Amazon Basin
FranciscoBasin
Tocantins Araguaia Basin
Fig. 1. Map of the study area, which encompasses the Brazilian Legal Amazon, the Tocantins/Araguaia basin, and parts of the Paraná and North Atlantic basins,illustrating the distribution of existing small and large dams and highlighting those used in this study. Large dams are referred to as UHEs and have a production capacityof ≥30MW; small dams are PCHs and have a production capacity of 1 to 30MW. Streamflow stations used in the LOR analysis and to calculate IHA are also shown. Note that onlymajor rivers are depicted.
RESULTSLOR analysisResults from the LOR analysis (Figs. 2 and 3 and table S3) served as aguideline for record length requirements when identifying flow gaugingstations to use in the IHA analysis. This approach also allowed us tocharacterize the statistical uncertainty associated with the applicationof shorter record lengths when data were limited (tables S4 to S6). Incontrast to Richter et al. (54), we found that fewer than 20 years of datacould be used to yield statistically significant IHA results for a numberof rivers across the Amazon. Figure 3 illustrates the results of the LORapproach for two stations with different flow regimes. The SeringalFortaleza station (Fig. 3A) is located on theRioPurus in thewest centralAmazon lowlands, and theAruanã station (Fig. 3B) is located on theRioAraguaia in the south central Cerrado. Due to consistent intra- and in-terannual flow variation at the Seringal Fortaleza station over the periodof record (57), only 2 years of data are needed to be within 10% of thelong-termmean annual flowmaximumwith 90% confidence; 7 yearsare required to be within 5% of themean (vertical dashed lines). In con-trast, achieving similar statistical confidence for theAruanã station,whichexperiences more interannual flow variation (57), would require 15 and30 years of data to be within 10 and 5%, respectively, of the long-termmean with 90% confidence, demonstrating the wide range of hydrologicregimes (and data requirements) across the region.
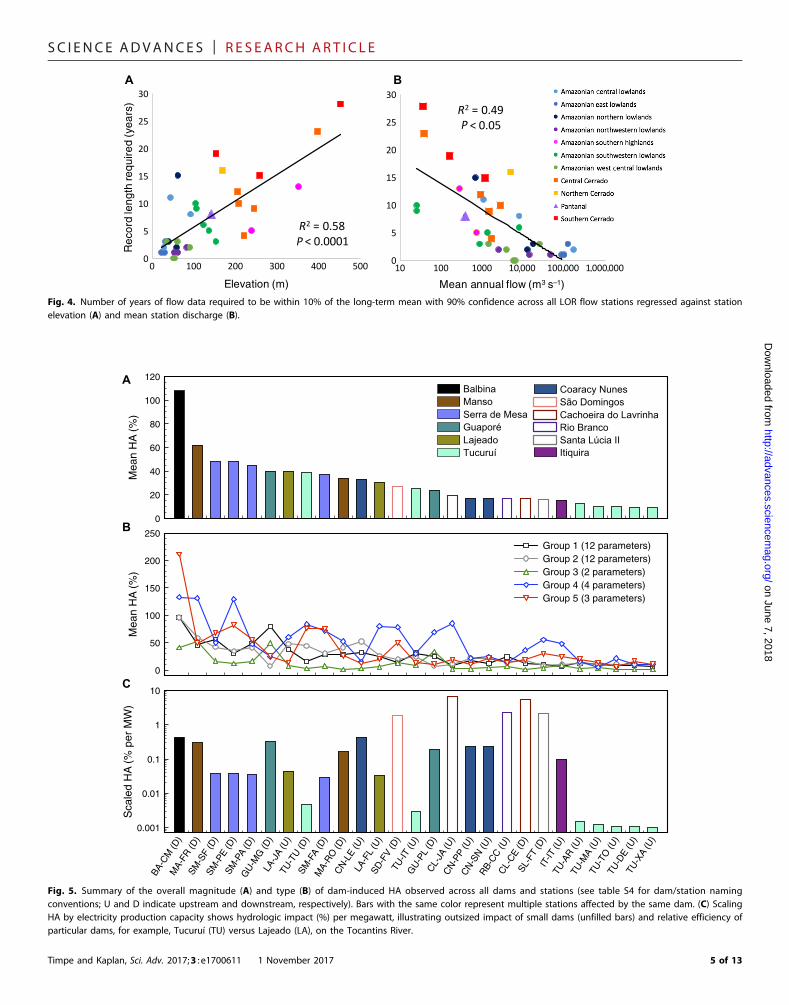
Across the entire LOR data set, we found that record lengths between1 and 28 years would be required to bewithin 10%of the long-termmeanannual flow maximum with 90% confidence (table S3). We found thattwo closely linked environmental variables were well correlated with therequired LOR: mean river flow and station elevation (Fig. 4, A and B). Ingeneral, large rivers flowing through lowland forests required shorterrecord lengths to characterize the flow regime because their discharge,while varying greatly over the year, is relatively predictable from year toyear. Smaller rivers in the highlands required longer records because of thehigher intra- and interannual variability driven by variability in precipita-tion. Geographic location may also help to predict the required length ofrecord, as suggested by the clustering of geographic locations in Fig. 4.
Timpe and Kaplan, Sci. Adv. 2017;3 : e1700611 1 November 2017
Dam-induced HAFigure 5 synthesizes the overall magnitude and type of dam-inducedHA for individual dams across the Brazilian Amazon. All dams wereobserved to affect the hydrologic regime; however, the magnitude andtype of impact varied greatly by dam and station. Mean HA across alldams/stations was 30%, but the most impactful dam (Balbina) had amean HA of >100% (Fig. 5A). The dams with the highest HA valueswere mostly large UHEs (usina hidrelétricas; defined as having produc-tion of ≥30 MW); however, some smaller PCHs (pequenas centraishidrelétricas; defined as having a production between 1 and 30 MW)had equivalent or larger impacts, illustrating that dam size and pro-duction capacity are not the only drivers of hydrologic impact. Acrossdams, themostmarked shifts in flow regime occurred inHAparametergroups 4 and 5 (Fig. 5B), which correspond to the frequency/durationand frequency/rate of change of high- and low-water conditions(Table 1; see Discussion). Scaling HA by published installed electric-ity production capacity (Fig. 5C) paints a potentially divergent pic-ture of the “most” and “least” impactful dams (note the log scale onthe y axis).While Balbina remains the “worst” large dam (UHE) in ourdata set, this analysis highlights the outsized impact of small dams(PCHs) relative to their production potential.
In general, hydrologic regimes were more affected downstream ofdams than upstream of reservoirs (Fig. 6A). Although the two avail-able gauging stations located directly within reservoir footprints(Estrada BR-163 and Porto Nacional; table S3) were highly affected(mean overall HA, 75%), stations further upstream were primarilyaffected by backwater effects and were less altered than stationsdownstream. We also found that overall HA caused by the first damto be built on a river did not significantly increase with the construc-tion of one or more additional dams (Fig. 6B); however, cumulativeeffects were significant for HA parameter groups 4 and 5 (frequency/duration and frequency/rate of change of high- and low-waterconditions; Table 1). Detailed descriptions of each dam/station combi-nation, including hydrographs for all LOR and IHA flow stations, aregiven by Timpe (57).
0
500
1000
1500
2000
2500
1975 1980 1985 1990 1994 2000 2005
0
10
20
30
40
50
60Yearly high pulses (predam)Yearly high pulses (postdam)Predam medianPostdam median
Flow
(m3
s–1 )
Predam Postdam
Hig
h pu
lse
coun
t
A
B
Construction/reservoir fill
Fig. 2. Streamflow (A) and pre- and post-dam high pulse count (B) at the Cachoeira Morena station, located 32 km downstream of the Balbina dam, illustrating severe dam-induced HA at this station after dam construction. Note that dam construction ended in October 1987. The subsequent period without data in the figure includes reservoir filling
through March 1989, during which no water was released by the dam, as well as a period of missing data from 1989 to 1991.
Fig. 3. Sample LOR results for Seringal Fortaleza (A) and Aruanã (B) stations. Solid black horizontal lines represent the long-term mean annual maximum flow for each station.Dashed black and gray horizontal lines represent 5 and 10% of the long-term mean, respectively. Solid green, red, and blue curves represent the 85, 90, and 95% confidenceintervals (CIs). Dashed vertical lines indicate the number of years of data required to characterize the annual maximum flow within 5 and 10% of the long-term mean with 90%confidence. LOR results illustrate that widely varying hydrologic regimes yield different LOR requirements to provide similar statistical inference (see text).
Table 1. Summary of hydrologic parameters used in IHA and their ecological influences. Adapted from IHA Manual V7 (28).
Tim
IHA statistics group
pe and Kaplan, Sci. Adv. 2017;3 : e1
Regime characteristics
700611 1 November 2017
Ecosystem influences
Group 1: Magnitudeof monthly waterconditions (12 indices)
Mean or median value foreach calendar month
Habitat availability for aquatic organismsSoil moisture availability for plantsAvailability of water for terrestrial animalsAvailability of food/cover for furbearing mammalsReliability of water supplies for terrestrial animalsAccess by predators to nesting sitesWater temperature, oxygen levels, and
photosynthesis in water column
Group 2: Magnitude andduration of annualextreme water conditions(12 indices)
Balance of competitive, ruderal, and stress-tolerant organismsCreation of sites for plant colonizationStructuring of aquatic ecosystems by abiotic versus biotic factorsStructuring of river channel morphology and physical habitat conditionsSoil moisture stress in plantsDehydration in animalsAnaerobic stress in plantsVolume of nutrient exchanges between rivers and floodplainsDuration of stressful conditions such as low oxygen and
concentrated chemicals in aquatic environmentsDistribution of plant communities in lakes, ponds, and floodplainsDuration of high flows for waste disposal and aeration of
spawning beds in channel sediments
Group 3: Timing ofannual extremewater conditions(2 indices)
Julian date of each annual,1-day maximum
Julian date of each annual,1-day minimum
Compatibility with life cycles of organismsPredictability/avoidability of stress for organismsAccess to special habitats during reproduction or to avoid predationSpawning cues for migratory fishEvolution of life history strategies and behavioral mechanisms
Group 4: Frequency and durationof high and low pulses(4 indices)
Number of low pulses within each water yearMean or median duration of low pulses (days)Number of high pulses within each water yearMean or median duration of high pulses (days)
Frequency and magnitude of soil moisture stress for plantsFrequency and duration of anaerobic stress for plantsAvailability of floodplain habitats for aquatic organismsNutrient and organic matter exchanges between river and floodplainSoil mineral availabilityAccess for waterbirds to feeding, resting, and reproduction sitesBed load transport, channel sediment textures, and
duration of substrate disturbance (high pulses)
Group 5: Rate andfrequency of watercondition changes(3 indices)
Rise rates: Mean or median of all positivedifferences between consecutivedaily values
Fall rates: Mean or median of all negativedifferences between consecutivedaily values
Number of hydrologic reversals
Drought stress on plants (falling levels)Entrapment of organisms on islands and floodplains
(rising levels)Desiccation stress on low-mobility stream
Fig. 4. Number of years of flow data required to be within 10% of the long-term mean with 90% confidence across all LOR flow stations regressed against stationelevation (A) and mean station discharge (B).
Coaracy NunesSão DomingosCachoeira do LavrinhaRio BrancoSanta Lúcia IIItiquira
BA-C
M (D
)M
A-FR
(D)
SM-S
F (D
)SM
-PE
(D)
SM-P
A (D
)G
U-M
G (D
)LA
-JA
(U)
TU-T
U (D
)SM
-FA
(D)
MA-
RO
(D)
CN
-LE
(U)
LA-F
L (U
)SD
-FV
(D)
TU-IT
(U)
GU
-PL
(D)
CL-
JA (U
)C
N-P
P (U
)C
N-S
N (U
)R
B-C
C (U
)C
L-C
E (D
)SL
-FT
(D)
IT-IT
(U)
TU-A
R (U
)TU
-MA
(U)
TU-T
O (U
)TU
-DE
(U)
TU-X
A (U
)
0.001
0.01
0.1
1
10
Sca
led
HA
(%
per
MW
)
A
B
C
Fig. 5. Summary of the overall magnitude (A) and type (B) of dam-induced HA observed across all dams and stations (see table S4 for dam/station namingconventions; U and D indicate upstream and downstream, respectively). Bars with the same color represent multiple stations affected by the same dam. (C) ScalingHA by electricity production capacity shows hydrologic impact (%) per megawatt, illustrating outsized impact of small dams (unfilled bars) and relative efficiency ofparticular dams, for example, Tucuruí (TU) versus Lajeado (LA), on the Tocantins River.
Timpe and Kaplan, Sci. Adv. 2017;3 : e1700611 1 November 2017 5 of 13
Predicting alterationThe best predictors of hydrological impact were reservoir area and vol-ume (positive correlation) and dam elevation (negative correlation), butthe strength and significance of these associations varied by station lo-cation (upstream versus downstream) and HA category (Fig. 7). Fordownstream stations, dam elevation was a consistently significant pre-dictor of dam-induced alteration, explaining 55% of the variance inoverall station HA. Elevation was also a good predictor of HA inparameter groups 2, 4, and 5. Upstream, HA values were significantlycorrelated with multiple predictor variables. Reservoir area and volumewere the best predictors of overall HA upstream (reservoir area ex-plained 81% of HA variance across dams), and reservoir area/volume,SD of discharge, production, and dam elevation were all significant pre-dictors of HA in parameter groups 1 and 2. Distance was negativelycorrelated with HA (that is, impacts decreased with distance from thedam), but not significantly.
DISCUSSIONThe synthesis of dam-induced HA across the Brazilian Legal Amazondemonstrates the extensive impact of hydroelectric dams on a range ofecologically relevant hydrologic parameters. Using publicly availabledata, we characterized the type and magnitude of hydrological changesbrought about by dam construction and operation across the Amazonand provide insight into the physical and management drivers of theseimpacts. These results highlight substantial alteration to critical aspects
Timpe and Kaplan, Sci. Adv. 2017;3 : e1700611 1 November 2017
of the flood pulse as a primary ecohydrological implication of ob-served hydrologic changes. The diversity of dams and rivers in our dataset additionally allowed us to highlight the outsized impact of smallhydropower systems relative to their electricity production capacityand add to the discussion of the cumulative impacts of dams. As a crit-ical first step, our LOR analysis expanded the robustness of statisticalinference that can be drawn from IHA and other indicator analysesin data-scarce regions. Overall, this study supports the utility of IHAin quantifying HAs for region-wide comparisons, which we believeare important for the creation of scientifically based environmentalflows management plans and policies.
Dam-induced HA in the AmazonGlobally, dams are well known to alter the hydrologic regime (29, 30, 58),often with severe ecological (59–61) and social (62–64) consequences.However, dam-induced ecohydrological impacts vary widely based ondam size, design, operation, and geographic setting (64–66). The damsin our study are located across diverse physiographic regions, rangingfrom lowlands to highlands, and were built over decades of changing de-sign standards, operational protocols, and monitoring regimes. Perhapsunsurprisingly given this heterogeneity, dam-induced HA varied widelyacross the dams in this study (Fig. 5A). All dams had some impact on thehydrologic regime, however, highlighting their pervasive effects on arange of hydrologic processes. A similar result was found by MagilliganandNislow (30), who performed a regional study of dam-induced hydro-logic impacts across the continental United States.
0
20
40
60
80
100
120
Mea
n H
A (
%)
DownstreamUpstream
Overall Group 1 Group 2 Group 3 Group 4 Group 5
**
** ***
*
0
50
100
150
200
Mea
n H
A (
%)
Individual damsMultiple dams
Overall Group 1 Group 2 Group 3 Group 4Group 1 Group 5
*
*
Fig. 6. (A) Stations were generally more affected downstream of dams than upstream of reservoirs. (B) Cumulative impacts of multiple dams increased impacts only forparameter groups 4 and 5. P values were calculated using the Mann-Whitney U test.
Fig. 7. Pearson R values for linear and log regressions between station HA and predictor variables (blue and red indicate positive and negative correlations,respectively; boxed values, P < 0.1). The best predictors of HA were reservoir area/volume (positive correlation) and dam elevation (negative correlation). CV,coefficient of variation.
While each dam-station pair in this study offers a unique case studyin HA driven by differences in environmental and management varia-bles (57), several general trends stood out among IHA results. First, al-though all elements of the flow regimewere affected by dam constructionand operation in the Amazon, the largest changes are associated withelements of the flow regime related to the frequency, duration, and rateof change of high- and low-water conditions (IHA parameter groups 4and 5; Table 1) (Figs. 5B and 6A). High values of HA in these parametergroups are indicative of dam operation for energy production (that is,peaking operations). These results point to a substantial impact ofAmazonian dams on flood pulse dynamics, which play an importantrole in structuring river and floodplain geomorphology and biodiversityin tropical rivers (11). Dam-induced alterations in the flood pulse affectriverine sediment transport and the exchange of nutrients, organicmatter, and plant/animal propagules between the river and floodplain(6). Impacts on sediment transport are particularly alarming consideringthe large number of planned dams within the Andean Amazon, wheremost of the rivers carry large sediment loads (67). Specifically, changesin the frequency/duration of pulse events (group 4) influence soil mois-ture and anaerobic stress for plants and the availability of floodplainhabitat for aquatic organisms (29). Changes in the frequency/rate ofpulse events (group 5) can trap aquatic organisms in floodplain lakesand strand terrestrial organisms on floodplain islands (68). Reducedflood duration also reduces fish recruitment, juvenile fish diversity, andfloodplain macroinvertebrate abundance (69).
In contrast, changes in mean monthly flows (group 1), the magni-tude and duration of annual extremes (group 2), and timing of annuallow- and high-water conditions (group 3) were relatively low (Figs. 5Band 6A). Changes to these parameters are generally driven more by themaintenance of large reservoir reserves and water withdrawals for agri-culture or domestic use (70) or during the initial stages of reservoir filing(71) rather than by hydropower generation. In this sense, many of thedammed rivers in our study maintained their coarse (that is, monthly)scalemean behavior despite substantial alteration to other aspects of theflow regime, although several large dams (for example, Balbina, Manso,Guaporé, and Serra da Mesa) did have significant impacts on one ormore of these parameter groups. Where present, impacts to monthlyflows were worse in the dry season for most dams, a finding supportedby previous studies on the Manso and Ponte de Pedra dams (72, 73).
We also found that hydrologic regimes downstream of dams weresignificantly more affected than those upstream (Fig. 6A). Mean over-all station HA values for downstream stations were twice as high asthose for upstream stations (40 and 20%, respectively). However, itis important to note that these results group all stations upstreamanddownstreamof all (individual) dams together and thus do not takedistance fromdam into account. Only two dams in our study had bothupstream and downstream stations with sufficient data to directlycompare HA values. Cachoeira do Lavrinha on the Rio das Almasin the Tocantins/Araguaia basin had equidistant upstream and down-stream stations (57 and 54 km, respectively) with low and approximate-ly equal HA (17 and 19%, respectively). These stations’ distance fromthe dam, coupled with its low production capacity (~3 MW), make ithard to draw conclusions about the magnitude of upstream versusdownstream impacts. In contrast, stations upstream and downstreamof the Tucuruí dam on the Tocantins River did have different overallHA, with greater impacts downstream (39% at the Tucuruí station)than upstream (25% at the Itupiranga station). However, the down-stream station is only 9 km away from the dam, whereas the upstreamstation is nearly 50 km upstream of the reservoir, again making it dif-
Timpe and Kaplan, Sci. Adv. 2017;3 : e1700611 1 November 2017
ficult to draw robust conclusions about upstream versus downstreamimpacts of a specific dam.
When compared with regional IHA analyses from temperate andarid zones (30, 31, 74), our results suggest general similarities betweendam-induced hydrological alteration across climates (for example, re-duced peak flows and increased base flows and flow reversals), althoughsome differences are apparent. For example, as noted above, we observedrelatively small changes inmeanmonthly flows (group 1 parameters) be-cause dams in the Amazon are built primarily for hydropower, with mi-nor abstraction for domestic or agricultural supply. Changes in the timingof extreme events were also relatively low in our data set, because stronglyseasonal rainfall in theAmazon is the primary driver of intra-annual flowvariation, even in these dammed systems. In contrast, Magilligan andNislow (30) and Pyron and Neumann (74) observed significant reduc-tions in monthly flows in temperate and arid regions due primarily toagricultural abstraction, which also caused extreme shifts in the timingof flowmaxima andminima in some dammed rivers. Themagnitude ofoverall HA across our studied dams (8 to 108%) was within the range ofthe Richter et al. (31) study (33 to 87%) but considerably lower than themost affected rivers in arid regions reported by Magilligan and Nislow(30) (>250%). We note that the lowest values we observed were gener-ally for small dams (PCHs) and upstream stations, which were not in-cluded in these other studies.
Regardless of magnitude, the impact of hydrologic alterations onecological function can differ between watersheds whether or not theyare within the same climatic region (75). One obvious difference be-tween temperate and tropical regions is the high level of biodiversityand productivity in the tropics (76, 77). When considered alongsideglobal climate regulation and other ecosystem services provided bythese systems (78), these differences suggest that the impacts of dam-inducedHA in tropical river systemsmay be more detrimental than intemperate systems in terms of biodiversity, productivity, and eco-system service provisioning, even at lower absolute levels of alteration.
HA versus electricity production capacityCritically, the dams associated with the most severe HAs in our data sethave vastly different installed electricity production capacities. Of thethree most impactful dams (Fig. 5A), Serra da Mesa produces nearlysix times as much energy as Balbina or Manso (table S1) yet has lowermeanHA. To better understand the balance between production capac-ity and impact across dams, we scaled mean station HA by each dam’spublished installed production capacity, yielding hydrologic impact(percentage) per megawatt of electricity produced (Fig. 5C). This“scaled HA” suggests that Balbina and Manso have an order of magni-tude greater hydrologic impact than Serra da Mesa per unit of installedelectricity generation capacity. We note that published installed capaci-ties for hydroelectric dams within Brazil are often large overestimates ofactual energy production (71), making these values low estimates ofscaled impact. Although HA is not the only indicator of a dam’s envi-ronmental impact, this analysis points to a widely divergent range ofecological impacts relative to economic (that is, energy) benefits. Forexample, Tucuruí’s large published installed generation capacity(8535MW) andmoderate HA (39% at the closest downstream station)combined tomake it themost “efficient” dam in our data set, despite itswidely recognized environmental and social impacts (63, 79).
In contrast, despite having relatively lowHAvalues overall (Fig. 5A),the four small dams (PCHs) in our data set had the highest scaled HAvalues (Fig. 5C). These results are concordant with other studies showingthat small hydropower systems can have environmental impacts equal
to or greater than large systems per unit of power generation capacity(80–83). The high relative impact of these small dams on the hydro-logic regime is troubling, given plans for the construction of hundreds ofsimilar systems in the Amazon in the coming decades (40), coupledwith minimal environmental licensing requirements for most damswith a production capacity of <10 MW (16). Currently, there are plansto build >400 small hydropower plants within Brazil, many of whichwill fall within the Brazilian Legal Amazon (84). The impacts of smalldams are similar in kind to those of large dams (for example, hydrologicregie alteration, water quality degradation, habitat conversion, and sub-sequent social-ecological effects) (85), and previous analyses have as-sumed that the magnitude of these impacts scales with dam size,discounting small dam impacts as “minimal” (86). Despite the widelyaccepted view that small-scale hydropower is a potential source of “clean”or “green” energy (87), there is growing evidence that the environmentalimpacts of small dams have been vastly underestimated (83, 87), es-pecially at the potential scale of their application. Of particular con-cern is the contradiction between the potential impacts of small damson greenhouse gas emissions and climate change policies that promotesmall hydropower systems as a climate mitigation strategy (88). An ad-ditional challenge is the lack of an internationally agreed upon defini-tion of “small” hydropower, blurring the lines between small and largesystems in terms of policy, permitting, implementation, and manage-ment (84, 88).
Cumulative impacts of multiple damsUnderstanding the cumulative impacts of multiple dams remains a chal-lenge in both the scientific and management communities (16). Only afew studies have assessed how multiple dams affect specific ecologicalfunctions. Several authors have found thatmultiple dams fragment ripar-ian flora relative to free-flowing rivers, leading to increased habitat frag-mentation, exacerbated loss of primary vegetation, reduced vegetationcomplexity, and increased sedimentation relative to single dam systems(89–91). In contrast, a study on low head dams (<15 in height) founduniform disturbance along a river with multiple dams, with no apparentcumulative downstream ecological effects (92). Critically, there are fewexisting studies that compare the effects of single versus multiple damson the hydrologic regime (93), leaving several fundamental questions un-answered (for example, are the effects of multiple dams additive, multi-plicative, or largely insignificant? Is it better to build several dams on asingle river or distribute them across the landscape?). Due at least in partto this lack of knowledge, the cumulative effects of multiple dams re-main undervalued in environmental planning and decision-making forboth new and existing dams (94, 95).
Our analysis of cumulative impacts for six rivers in the Brazilian LegalAmazon with multiple dams showed that, although overall HA did notsignificantly increase with the construction of additional dams, alterationwithin specific parameter groups did (Fig. 6B). Mean HAs in parametergroups 1 to 3 (Table 1) were relatively low (for the reasons discussedabove) and nearly identical whether calculated during periods with singleormultiple dams along a river. Because group 1 parameters represent themagnitude ofmonthly flows andgroup3parameters represent the timingof peak and low flows, it may be expected that adding additional hydro-power dams (that is, with minimal long-term storage or abstraction)would be unlikely to further alter these aspects of the flow regime. Incontrast, cumulative impacts were significantly higher than singledam impacts for parameter groups 4 and 5, which represent the fre-quency and duration of high and low pulses and the rate and frequencyof water condition changes, respectively (Table 1). Although derived
Timpe and Kaplan, Sci. Adv. 2017;3 : e1700611 1 November 2017
froma small data set, these findings imply thatmultiple damsmaymag-nify the hydrological impacts to critical aspects of the flood pulse thatare central to the ecological health of lowland tropical rivers (27). Furtherstudies are needed to elucidate the potential influences of differing damsizes, types, and geoclimatic regions on the accumulation of impacts frommultiple dams.
Predictors of dam-induced HAReservoir area and volume and dam elevation were consistently signif-icant predictors of the observed HA (Fig. 7). Even without taking damtype or operational rules into account, these simple bivariate relation-ships allow us tomake general predictions about the strongest drivers ofdam-induced HA across the Brazilian Amazon. In general, we foundthat lowland dams with large reservoirs affect the hydrologic regimemore than higher elevation dams with smaller reservoirs. This is exem-plified by comparing the two highest HA dams in our data set: Balbina,built on the Uatumã River in the northern Amazonian lowlands [32 mabove sea level (masl)], and Serra daMesa, built on the Tocantins Riverin the central Cerrado (451 masl). The rivers that these dams impoundhave comparable average annual flow; however, Balbina created a~4400-km2 reservoir due to the region’s flat topography. In contrast,Serra da Mesa flooded ~1250 km2 in the hillier Cerrado landscape.The impacts of Serra daMesa on the hydrologic regimewere substantial(overall HA, 48%), but Balbina’s impact was more than twice as high(overall HA, 108%) and would likely be even greater if the reservoirfilling period (that is, zero flow) and initial water releases (missing data)were included in the post-dam analysis.
While elevation and reservoir area were the best univariate predic-tors of downstream and upstreamHAs, respectively, there are inherentrelationships among predictor variables. For example, elevation plays aclear role in defining reservoir sizes and flowmagnitude; lowland riverstend to be large because of their large catchments, and dams built inthese lowlands create extensive reservoirs due to large flows and flat to-pography.Moreover, these large, lowland rivers are most strongly char-acterized by periodic flood pulses, the dynamic we found to be mostaffected by dam construction (that is, groups 4 and 5 in Fig. 5B). Build-ing dams on these rivers threatens ecologically important floodplainsystems that rely on the flood pulse (96) and can have landscape levelimpacts that are difficult to predict (91). Highland rivers, on the otherhand, generally have smaller catchments, lower flows, and “flashier”flood pulses. Although ecological functions in highland rivers are simi-larly tied to the flow regime, we found dam-induced HA in thesesystems to be less severe than in lowland rivers. Additionally, dams builton highland rivers generally create smaller reservoirs, leading to (rela-tively) lower ecological impacts, particularly on fish and macrobenthos(21, 24).
We expectedHA to decrease with station distance fromdams as damoperation effects and reservoir backwater effects diminish. Although wefound a negative correlation between HA and the distance between adam and an upstream or downstream flow station, the associations werenot statistically significant (Fig. 7). These results are similar to those re-ported by Jiang et al. (97), who found overall HA on the Yangtze River(China) to decline with increasing distance downstream of the ThreeGorges Dam, but not monotonically. These authors attributed thisdecline primarily to inflows from undammed large tributaries andinteraction with large natural lakes. Given the potential correlationamong predictor variables and a small number of observations acrossmultiple river systems in our study (total of eight upstream and sixdownstream stations), we limited our analysis of the distance effect to
univariate regression; however,multivariate regressionona larger data setmay further elucidate the threshold of upstream/downstream distancesbeyond which the hydrologic effects of dams become negligible.
Study limitations and applicationThis study has several limitations. First, IHA is a simple analytical toolthat relies only on observed flow data to make predictions aboutpotential ecohydrological impacts to river-floodplain systems.Althoughthe method’s simplicity allows rapid calculation of HA across broadspatiotemporal scales, it lacks site-specific calibration in the predictionof impacts to hydrogeomorphology, floodplain characteristics, sedi-ment transport, and other ecological functions. Our application ofIHA across diverse river basinswithwidely varying physiographic char-acteristics (hydrologic regime, geology and morphometry of the drainagebasin, land use types, sediment yield, morphodynamics, sedimenttransport, floodplain form, etc.) means that similar magnitudes of HAmay have different relative impacts. However, because impacts are quan-tified in relative terms (that is, percent change),webelieve that these resultsstill allow useful comparisons between and among dam-affected rivers.
A second limitation of this study was the challenge of identifyingstreamflow stations with sufficient record lengths to apply hydrologicindicator methods. Although our LOR analysis allowed us to justifyusing shorter record lengths in several cases (particularly for high-flow,lowland rivers), many dammed rivers had no nearby flow gauging sta-tions or stations with only short or incomplete records. We excludedthree UHEs and approximately 100 PCHs from the study because of thislack of data. Missing pre-dam flows may be estimated using remotesensing and other hydrologic tools developed for ungauged basins (98);however, deriving post-dam flows without directmeasurement will likelybe difficult. Additionally, several newly constructed Amazon dams (forexample, the Santo Antônio and Jirau dams on the Madeira River) werebuilt too recently to characterize post-dam hydrology. This data limita-tion speaks to the need for improvements and expansion of hydrolog-ical monitoring across the region, particularly in watersheds with new,under-construction, and planned dams (for example, Tapajós, Xingu,and Madeira). While we support improved monitoring of dam impactsacross all components of the social-ecological system, we strongly advocatefor improved hydrological monitoring as a relatively cost-effective wayto deduce ecological impacts via methods such as IHA.
One possible way around the “new-dam” data challenge is to modelpost-dam flows and apply the IHA method to compare observed pre-dam data and predicted post-dam data. This approach requires a phys-ically based hydrologic model for each river and dam, as well as exten-sive parameterization and assumptions to characterize dam operations.This approach is feasible on a dam-by-dam basis and is the general ap-proach taken to predict dam impacts on hydrology via the Environ-mental Impact Assessment process (99). For example, these modelshave been used to project an annual streamflow decrease of 80% inthe ecologically significant “Big Bend” of the Xingu River (100) andshould be further applied to understand how altered hydrology is likelyto affect riverine ecohydrology on this and other Amazonian rivers withnew or planned dams, such as the Madeira River, where reduced floodpulses may affect connections to floodplain lakes that are critical tosupport fisheries production (101). Although this intensive modelingapproach is beyond the scope of this work, which looks to assess hydro-logic impacts from existing dams across a wide spatiotemporal domain,our results do provide guidance on the likely range of impacts from re-cently built and future dams based on a set of environmental and man-agement variables (Fig. 7).
Timpe and Kaplan, Sci. Adv. 2017;3 : e1700611 1 November 2017
Additionally, while the LOR analysis approach is useful for assessingHA in the Amazon and other poorly gauged basins, it does have severalmethodological caveats. First, the long-term means for the parametervalues are only estimates of the true mean, given record lengths (23to 45 years) relative to multidecadal and longer time-scale climate var-iability (102, 103). Thus, the LOR and IHA approaches implicitly as-sume climate and land use stationarity (104). Second, we only appliedthe LOR analysis to one IHA parameter, annual 1-day maximum flow,and thus do not characterize the statistics of all 33 metrics of hydrologicvariability at all stations; pursuing this approach is computationally fea-sible but unlikely to provide a more robust estimate of required recordlengths. Nevertheless, the LOR analysis presented here improved thequality of our IHA analysis by providing (i) a better understanding ofnatural system variability, (ii) guidance for the minimum LOR requiredto perform IHA, and (iii) a quantitative measure of uncertainty aroundthe statistical significance of hydrologic impacts. The method is transfer-able to other systems andmay help to provide support for IHA and otherhydrologic indicator analyses in developing basins with limited data.
A general limitation of this study is that the changes in hydrologicregime synthesized here are limited to the Brazilian Legal Amazon anddescribe only one of the many ecohydrological impacts of Amazoniandams. Notably, our analysis does not assess how dams and reservoirsaffect biotic connectivity. Even in the absence of altered hydrology,dams anddamnetworks can severely disruptmedium- and long-distancefishmigration (16). Along with the physical disruption caused by dams,reservoirs can act as environmental filters for migratory fish, which re-quire stretches of free-flowing river and floodplain habitat for nurseries(21). On rivers with multiple dams, fish can become trapped (21),leading to local extirpation or extinction. Critically, fish ladders haveoften failed in the Amazon (105, 106). Together, the looming loss ofAndes-Amazon connectivity (67), coupled with the severe and wide-spread HA illustrated here, threatens to devastate some of the planet’smost biodiverse fish communities (107), and further work is needed toadequately assess these combined ecohydrological impacts.
Hydropower development in the Amazon has myriad hydrological,ecological, and social effects (108), and critical questions about its over-all sustainability remain unanswered at a variety of scales (67, 109, 110).Given the many impacts of Amazonian hydropower expansion, analternative to building new generation capacity would be to implement“demand-side” energy policy solutions, such as energy conservation(111); however, with strong political and economic pressure to harnessthe Amazon’s hydropower potential, this is likely unfeasible. Takingsteps to reduce the environmental impacts of dams could be consideredthe “next-best” practice, including optimizing dam operations to reducehydrologic regime alterations and improving our understanding of thelinks between altered hydrology and impacts to ecological and socialsystems. This work quantified the hydrological impacts of 33 smalland large dams across the Brazilian Legal Amazon, providing insightinto the physical drivers of dam impacts and highlighting the importantecohydrological implications of the observed hydrologic changes. Webelieve that this type of regional hydrologic analysis is an important firststep toward the development of environmental flows managementplans and policies relevant to theAmazon and othermegadiverse tropicalriver basins. Critically, the application of environmental flows methodsrequires integrative analyses to understand the drivers of hydrological al-teration and ecological impacts on aquatic systems in periods before damimplementation (110). These studies thus serve as a baseline from whichto isolate anthropogenic impacts fromnatural variability (4) and to derivepost-dam conservation and mitigation strategies. This type of analysis is
difficult in areas where there is a shortage of continuous data, hinderingcommunities and governments in these regions from taking appropriateand sustainable decisions (112).
on June 7, 2018http://advances.sciencem
ag.org/D
ownloaded from
METHODSStudy areaThis study focuses on existing hydroelectric dams within the BrazilianLegal Amazon and the Tocantins/Araguaia basin (Fig. 1). The “LegalAmazon” covers 5217 km2 (61% of Brazil’s territory) and fully encom-passes seven states (Amazonas, Pará, Acre, Amapá, Roraima, Rondônia,andTocantins), alongwith portions of two others (Maranhão andMatoGrosso). Hydrologically, the Legal Amazon includes the entire Amazonbasin and parts of the Tocantins/Araguaia, Paraná, Parnaíba, andnortheast Atlantic basins. We included the entire Tocantins/Araguaiabasin in our assessment because of the large number of hydroelectricdams in the watershed. Information on dams in the study is summa-rized in table S1.
The study area includes three biomes (Amazon forest, Cerrado, andPantanal), various terrain types, and altitudes ranging fromnear sea lev-el to >600 m. The region’s rivers range from small, mountainousstreams to large, meandering lowland rivers with expansive floodplainforests. Some rivers, such as the Madeira in the southwest Amazon, are“white-water rivers” that originate in the Andes Mountains and carryheavy sediment loads. Others, such as the Tocantins in the southeasternportion of the study area, are clear-water rivers that originate in theweathered Brazilian and Guianan shields and have low sediment loadsbut are rich in dissolvedminerals. Black-water rivers, such as theUatumãin the northern Amazon, carry few suspended sediments but are highlyacidic and high in tannins because they drain nutrient-poor sandy soilsof the central Amazon (110, 113).
Data collection and preparationTo initiate our study, we developed a hydrological database of river flowand stage at 1062 stream gauge stations across the study area. All hy-drological data were publicly available and downloaded from the Agên-cia Nacional de Águas (ANA; Brazil’s National Water Agency) usingthe Hydroweb platform (www.ana.gov.br). Data gaps, when present,were filled whenever possible using linear interpolation, interstationcorrelations (R2 > 0.8), and/or stage-discharge curves, as deemed mostappropriate. Next, we added information about existing hydroelectricdams to the database (table S1). Information on hydroelectric damswas obtained from the Agência Nacional de Energia Elétrica (ANEEL;Brazil’s National Agency of Electric Energy) and the Sistema Nacionalde Informações sobre Recursos Hídricos (SNIRH; Brazil’s NationalSystem of Water Resources Information). Dams were divided into twogroups: those with an electricity production capacity greater than orequal to 30 MW (referred to as UHEs) and those with a productioncapacity between 1 and 30 MW (referred to as PCHs). Using the com-piled databases, we identified hydrological stations on dammed riverswith sufficient streamflow data for IHA analysis (table S2). These data-bases were coupled with other hydrological, environmental, social, andeconomic data of Tucker Lima et al. (56) and alsomade available on thewebsite of the Amazon Dams Network/Rede Barragens Amazônicas(http://amazondamsnetwork.org/amazon-databases/).
LOR analysisCharacterizing natural and altered flow regimes using IHA or other sta-tistical methods requires a flow record that captures intra- and interan-
Timpe and Kaplan, Sci. Adv. 2017;3 : e1700611 1 November 2017
nual flow variations driven by climate variability. Huh et al. (114)concluded that 20 to 30 years of data are required on either side of animpact to characterize changes in flow variability in southeastern(United States) rivers, and Richter et al. (54) suggested a minimum of20 years based on threeU.S. streamswith varying hydrology. OtherU.S.studies have found that 10 to >40 years of data are required to detectstreamflow trends (114, 115). Given this uncertainty, additional workwas needed to robustly define the LOR required to detect statisticallysignificant changes in hydrologic regime due to dam constructionand to assess whether guidance derived in temperate and arid systemsapplied in the Amazon.
To do so, we modified the analysis of Richter et al. (54) to developguidance for the LOR required to characterize streamflow variabilitywithin specific statistical bounds and applied it to data sets from34 stream-flow stations within the study area (table S3). Stations were chosen torepresent watersheds with the least anthropogenic impact and longestrecord lengths and were distributed across regions, elevations, and flowmagnitudes to assess how hydrogeomorphic factors affected the re-quired LOR. For each LOR station in the analysis, we calculated annual1-day maximum flow for each year in a data set along with the long-termmean for this parameter. Parameter valueswere randomly orderedand grouped into record length increments ranging from 2 years to thefull LOR. The mean of each record length increment was calculatedfor comparison to the long-term mean. This process was repeated50,000 times, from which 95, 90, 85, and 80% CI were calculated.Using these statistics, we calculated the LOR required to be within agiven percentage of the long-term mean at a specified level of confi-dence for each river in the study (table S3). All analyses were performedusing R statistical software (116).
IHA methodThe IHAmethod (1) is an open-access desktopmodel developed by theNature Conservancy that calculates 33 ecologically relevant parametersto characterize hydrologic regime (Table 1). IHA parameters are basedon five characteristics of the flow regime listed inTable 1 andwere chosenfor their close relationship to ecological functions, such as population dy-namics and habitat suitability (30). Because of the structuring influencethat extreme events have on ecosystems (53), many IHA parameters focuson measuring the characteristics of event extremes, such as timing ofextremes (Julian dates), magnitude and duration of events (1-, 3-, 7-, 30-,and 90-daymaxima andminima; zero flow days and base flow index; andduration of pulse events), and frequency and duration of events (number/duration of high and low pulses). The remaining parameters focus on themagnitude of average flow (average flow in each month) and the rate ofchange of water conditions (rise/fall rate and number of reversals).
We used IHA to quantify changes in hydrologic regime due to damconstruction and operation by applying IHA to pre- and post-damperiods and comparing the 33 IHA parameters between the twoperiods. At every station, median values of each IHA parameter werecalculated for both the pre- and post-impact periods. Using these sta-tistics, we calculated HA values for each parameter according to thefollowing equation
HA ð%Þ ¼ ðMpost �MpreÞMpre
*100
where Mpost is the median for the post-impact period and Mpre is themedian for the pre-impact period. HA values were calculated for each
parameter and then averaged by parameter groups (Table 1) and acrossall parameters.
Station selection and data analysisWe applied IHA to 40 streamflow stations upstream and downstreamof 17 UHE dams and 16 PCH dams in the study area (tables S4 to S6).We categorized the statistical significance of each IHA analysis based onthe stations’ pre- and post-impact period record lengths and our LORanalysis of unimpacted stations with similar hydrologic regimes withinthe geographic area (table S3). Several stations with fewer years of datathan identified in the LOR analysis were maintained in our analysis iftheir hydrographs showed obvious hydrologic impacts after dam con-struction and they had an extended data set on one side of the impact(that is, were only lacking data in one period).
Some of the rivers in our study area have a single dam, whereasothers have a cascade of two or more dams. We thus divided theIHA analysis into two sections to separately assess the impacts of singleversus multiple dams on riverine ecohydrology (tables S4 to S6). Somedamswere included in both analyses if the available data allowed for theisolation of impacts from one dam along a river with multiple dams.This occurred if a dam was the first to be built on a river and remainedthe only dam for a sufficient period of time for IHA analysis based onthe results of the LOR analysis. Depending on data availability, somedams and combinations of dams were analyzed using multiplestreamflow stations located upstream, downstream, or upstream anddownstream of dams to characterize spatial variation in the ecohydro-logical impacts of dam construction (for example, upstream versusdownstream impacts and the effect of distance from dams).
For rivers with single dams, we analyzed the impacts of eight UHEdams and four PCHdams using data from 27 streamflow stations (tablesS4 and S7). Pre- and post-impact periods were determined on the basisof dam construction, reservoir fill, and operation start dates (table S1).For rivers withmultiple dams, we analyzed the cumulative impacts of14 UHE dams and 12 PCHdams on six rivers using data from 22 stream-flow stations (tables S5, S6, and S8). Multiple dams along the same riverwere grouped together for analysis of cumulative impacts. Because of thecomplexity of the hydroelectric complex along the Tocantins River, damson this river were grouped into five combinations based on the dates ofdam construction (that is, after the construction of the Tucuruí dam in1984, after the construction of the Lajeado dam in 2001, etc.). If datawere available, separate IHA analyses were run using different post-impact periods to reflect the impacts of an increasing number of dams.
Predictor variable analysisOur study area covered a wide range of hydroclimatic regions, topo-graphies, river types (white, black, or clear water), streamflow magni-tudes, dam sizes, and dam types (reservoir, run-of-river, and diversion).Additionally, station locations were not always close to dams, rangingfrom directly adjacent to hundreds of kilometers away when data wereavailable. To identify the influence of different environmental andman-agement variables on the magnitude and type of dam-induced HA, weperformed linear and log regressions between station HA (overall andparameter group mean HA values) and a suite of predictor variables,including the mean, SD, and coefficient of variation of river discharge(Q); electricity production capacity; reservoir area and volume; dam el-evation; and station distance from the dam. Regressions were per-formed separately on upstream and downstream stations to isolatepredictor variable effects from inherent upstream versus downstreamimpact differences (Fig. 6A). For dams with flow data from more than
Timpe and Kaplan, Sci. Adv. 2017;3 : e1700611 1 November 2017
one streamflow station, only the station closest to the dam was used,except when analyzing the effect of distance, when we used all stations.
SUPPLEMENTARY MATERIALSSupplementary material for this article is available at http://advances.sciencemag.org/cgi/content/full/3/11/e1700611/DC1table S1. Hydroelectric dams analyzed with supporting information.table S2. Streamflow stations used for IHA analysis.table S3. Stations used in the LOR analysis.table S4. Stations used in the IHA analysis of individual dams, with supporting information.table S5. Stations used in the IHA analysis of multiple dams in the Amazon and Paraná basins.table S6. Stations used in the IHA analysis of multiple dams in the Tocantins basin.table S7. IHA results for streamflow stations in the individual dams analysis.table S8. IHA results for streamflow stations in the multiple dams analysis.
REFERENCES AND NOTES1. B. D. Richter, J. V. Baumgartner, J. Powell, D. P. Braun, A method for assessing hydrologic
alteration within ecosystems. Conserv. Biol. 10, 1163–1174 (1996).2. N. L. Poff, J. D. Allan, M. B. Bain, J. R. Karr, K. L. Prestegaard, B. D. Richter, R. E. Sparks,
J. C. Stromberg, The natural flow regime. BioScience 47, 769–784 (1997).3. R. J. Naiman, J. J. Latterell, N. E. Pettit, J. D. Olden, Flow variability and the biophysical
vitality of river systems. C. R. Geosci. 340, 629–643 (2008).4. G. Scarcella, F. Grati, L. Bolognini, F. Domenichetti, S. Malaspina, S. Manoukian, P. Polidori,
A. Spagnolo, G. Fabi, Time-series analyses of fish abundance from an artificial reef and areference area in the central-Adriatic Sea. J. Appl. Ichthyol. 31, 74–85 (2015).
5. R. L. Vannote, G. W. Minshall, K. W. Cummins, J. R. Sedell, C. E. Cushing, The rivercontinuum concept. Can. J. Fish. Aquat. Sci. 37, 130–137 (1980).
6. W. J. Junk, P. B. Bayley, R. E. Sparks, The flood pulse concept in river-floodplain systems.Can. Spec. Publ. Fish. Aquat. Sci. 106, 110–127 (1989).
7. J. Loomis, P. Kent, L. Strange, K. Fausch, A. Covich, Measuring the total economic valueof restoring ecosystem services in an impaired river basin: Results from a contingentvaluation survey. Ecol. Econ. 33, 103–117 (2000).
8. D. J. Gilvear, C. J. Spray, R. Casas-Mulet, River rehabilitation for the delivery of multipleecosystem services at the river network scale. J. Environ. Manage. 126, 30–43 (2013).
9. M. Acreman, A. H. Arthington, M. J. Colloff, C. Couch, N. D. Crossman, F. Dyer, I. Overton,C. A. Pollino, M. J. Stewardson, W. Young, Environmental flows for natural, hybrid,and novel riverine ecosystems in a changing world. Front. Ecol. Environ. 12, 466–473(2014).
10. W. J. Junk, K. M. Wantzen, The flood pulse concept: New aspects, approaches andapplications—An update, in Proceedings of the Second International Symposium on theManagement of Large Rivers for Fisheries, R. L. Welcomme, T. Petr, Eds. (Food andAgriculture Organization and Mekong River Commission, FAO Regional Office for Asiaand the Pacific, 2004), pp. 117–149.
11. J. V. Ward, K. Tockner, F. Schiemer, Biodiversity of floodplain river ecosystems: Ecotonesand connectivity. Regul. Rivers: Res. Manage. 15, 125–139 (1999).
12. K. Tockner, D. Pennetzdorfer, N. Reiner, F. Schiemer, J. V. Ward, Hydrologicalconnectivity, and the exchange of organic matter and nutrients in a dynamic river–floodplain system (Danube, Austria). Freshwater Biol. 41, 521–535 (1999).
13. T. W. FitzHugh, R. M. Vogel, The impact of dams on flood flows in the United States.River Res. Appl. 27, 1192–1215 (2011).
14. R. J. Naiman, H. Décamps, The ecology of interfaces: Riparian zones. Annu. Rev. Ecol. Syst.28, 621–658 (1997).
15. M. T. F. Piedade, W. J. Junk, S. P. Long, Nutrient dynamics of the highly productiveC4 macrophyte Echinochloa polystachya on the Amazon floodplain. Funct. Ecol. 11, 60–65(1997).
16. K. O. Winemiller, P. B. McIntyre, L. Castello, E. Fluet-Chouinard, T. Giarrizzo, S. Nam,I. G. Baird, W. Darwall, N. K. Lujan, I. Harrison, M. L. J. Stiassny, R. A. M. Silvano,D. B. Fitzgerald, F. M. Pelicice, A. A. Agostinho, L. C. Gomes, J. S. Albert, E. Baran,M. Petrere Jr., C. Zarfl, M. Mulligan, J. P. Sullivan, C. C. Arantes, L. M. Sousa, A. A. Koning,D. J. Hoeinghaus, M. Sabaj, J. G. Lundberg, J. Armbruster, M. L. Thieme, P. Petry,J. Zuanon, G. Torrente Vilara, J. Snoeks, C. Ou, W. Rainboth, C. S. Pavanelli, A. Akama,A. van Soesbergen, L. Sáenz, Balancing hydropower and biodiversity in the Amazon,Congo, and Mekong. Science 351, 128–129 (2016).
17. B. Mérona, J. Rankin-de-Mérona, Food resource partitioning in a fish community of thecentral Amazon floodplain. Neotrop. Ichthyol. 2, 75–84 (2004).
18. G. Ziv, E. Baran, S. Nam, I. Rodríguez-Iturbe, S. A. Levin, Trading-off fish biodiversity, foodsecurity, and hydropower in the Mekong River Basin. Proc. Natl. Acad. Sci. U.S.A. 109,5609–5614 (2012).
19. C. Fu, J. Wu, J. Chen, Q. Wu, G. Lei, Freshwater fish biodiversity in the YangtzeRiver basin of China: Patterns, threats and conservation. Biodivers. Conserv. 12, 1649–1685(2003).
20. F. K. Ligon, W. E. Dietrich, W. J. Trush, Downstream ecological effects of dams. BioScience45, 183–192 (1995).
21. A. A. Agostinho, F. M. Pelicice, L. C. Gomes, Dams and the fish fauna of the Neotropicalregion: Impacts and management related to diversity and fisheries. Braz. J. Biol. 68,1119–1132 (2008).
22. P. M. Fearnside, S. Pueyo, Greenhouse-gas emissions from tropical dams. Nat. Clim.Change 2, 382–384 (2012).
23. M. A. dos Santos, L. P. Rosa, B. Sikar, E. Sikar, E. O. dos Santos, Gross greenhouse gasfluxes from hydro-power reservoir compared to thermo-power plants. Energy Policy 34,481–488 (2006).
24. F. M. Pelicice, P. S. Pompeu, A. A. Agostinho, Large reservoirs as ecological barriers todownstream movements of Neotropical migratory fish. Fish Fish. 16, 697–715 (2015).
25. A. A. Agostinho, L. C. Gomes, S. Veríssimo, E. K. Okada, Flood regime, dam regulationand fish in the Upper Paraná River: Effects on assemblage attributes, reproductionand recruitment. Rev. Fish Biol. Fish. 14, 11–19 (2004).
26. G. Klaver, B. van Os, P. Negrel, E. Petelet-Giraud, Influence of hydropower dams onthe composition of the suspended and riverbank sediments in the Danube. Environ. Pollut.148, 718–728 (2007).
27. P. M. Fearnside, Decision-making on Amazon dams: Politics trumps uncertainty in theMadeira River sediments controversy. Water Altern. 6, 313–325 (2013).
28. C. Nilsson, K. Berggren, Alterations of riparian ecosystems caused by river regulation:Dam operations have caused global-scale ecological changes in riparian ecosystems.How to protect river environments and human needs of rivers remains one of the mostimportant questions of our time. BioScience 50, 783–792 (2000).
29. W. L. Graf, Downstream hydrologic and geomorphic effects of large dams on Americanrivers. Geomorphology 79, 336–360 (2006).
30. F. J. Magilligan, K. H. Nislow, Changes in hydrologic regime by dams. Geomorphology 71,61–78 (2005).
31. B. D. Richter, J. V. Baumgartner, D. P. Braun, J. Powell, A spatial assessment of hydrologicalteration within a river network. Regul. Rivers: Res. Manage. 14, 329–340 (1998).
32. F. J. Magilligan, K. H. Nislow, Long-term changes in regional hydrologic regime followingimpoundment in a humid-climate watershed. J. Am. Water Resour. Assoc. 37, 1551–1569(2001).
33. T. Næsje, B. Jonssons, J. Skurdal, Spring flood: A primary cue for hatching of riverspawning Coregoninae. Can. J. Fish. Aquat. Sci. 52, 2190–2196 (1995).
34. S. B. Rood, J. M. Mahoney, Collapse of riparian poplar forests downstream from dams inwestern prairies: Probable causes and prospects for mitigation. Environ. Manage. 14,451–464 (1990).
35. C. Zarfl, A. E. Lumsdon, J. Berlekamp, L. Tydecks, K. Tockner, A global boom inhydropower dam construction. Aquat. Sci. 77, 161–170 (2015).
36. G. W. Frey, D. M. Linke, Hydropower as a renewable and sustainable energy resourcemeeting global energy challenges in a reasonable way. Energy Policy 30, 1261–1265(2002).
37. W. F. Laurance, M. A. Cochrane, S. Bergen, P. M. Fearnside, P. Delamônica, C. Barber,S. D’Angelo, T. Fernandes, Environment—The future of the Brazilian Amazon. Science291, 438–439 (2001).
38. P. M. Fearnside, Avança Brasil: Environmental and social consequences of Brazil’splanned infrastructure in Amazonia. Environ. Manage. 30, 735–747 (2002).
39. B. S. Soares-Filho, D. C. Nepstad, L. M. Curran, G. C. Cerqueira, R. Alexandrino Garcia,C. Azevedo Ramos, E. Voll, A. McDonald, P. Lefebvre, P. Schlesinger, Modellingconservation in the Amazon basin. Nature 440, 520–523 (2006).
40. C. Kis Madrid, G. M. Hickey, M. A. Bouchard, Strategic environmental assessmenteffectiveness and the Initiative for the Integration of Regional Infrastructure in SouthAmerica (IIRSA): A multiple case review. JEAPM 13, 515–540 (2011).
41. P. M. Fearnside, in Secretaria General del Panel Internacional de Ambiente y Energía,Derecho, Ambiente y Recursos Naturales (DAR), Lima, Peru, C. Gamboa, E. Gudynas, Eds.(Centro Latino Americano de Ecología Social, 2014).
42. J. Ferreira, L. E. O. C. Aragão, J. Barlow, P. Barreto, E. Berenguer, M. Bustamante,T. A. Gardner, A. C. Lees, A. Lima, J. Louzada, R. Pardini, L. Parry, C. A. Peres, P. S. Pompeu,M. Tabarelli, J. Zuanon, Brazil’s environmental leadership at risk. Science 346, 706–707 (2014).
43. Y. Gao, R. M. Vogel, C. N. Kroll, N. L. Poff, J. D. Olden, Development of representativeindicators of hydrologic alteration. J. Hydrol. 374, 136–147 (2009).
44. A. H. Arthington, J. M. King, J. H. O’Keefe, S. E. Bunn, J. A. Day, B. J. Pusey, D. R. Bluhdorn,R. Tharme, Development of an holistic approach for assessing environmental flowrequirements of riverine ecosystems, in Water Allocation for the Environment,J. J. Pigram, B. P. Hooper, Eds. (The Centre for Water Policy Research, University ofNew England, 1992), pp. 69–76.
45. J. D. Olden, N. L. Poff, Redundancy and the choice of hydrologic indices forcharacterizing streamflow regimes. River Res. Appl. 19, 101–121 (2003).
Timpe and Kaplan, Sci. Adv. 2017;3 : e1700611 1 November 2017
46. Z. Yang, Y. Yan, Q. Liu, Assessment of the flow regime alterations in the Lower YellowRiver, China. Eco. Inform. 10, 56–64 (2012).
47. V. G. Pinto, C. B. d. M. Ribeiro, D. D. da Silva, Vazão ecológica e o arcabouço legalbrasileiro (Instream flow and the Brazilian legal framework). Rev. Bras. Geogr. Fís. 9,91–109 (2016).
48. W. Collischonn, S. G. Agra, G. K. Freitas, G. R. Priante, R. Tassi, C. F. Souza, Em busca dohidrograma ecológico. XVI Simpósio Brasileiro de Recursos Hídricos 16, 20–24 (2005).
49. P. V. C. J. Santos, A. C. Da Cunha, Outorga de recursos hídricos e vazão ambientalno Brasil: Perspectivas metodológicas frente ao desenvolvimento do setor hidrelétricona Amazônia. Rev. Bras. Recur. Hídricos 18, 81–95 (2013).
50. D. M. d. O. Galvão, “Subsídios à determinação de vazões ambientais em cursos d’águanão regulados: O caso do Ribeirão Pipiripau (DF/GO),” thesis, Universidade de Brasília(2008).
51. J. G. Tundisi, T. M. Tundisi, Integrating ecohydrology, water management, andwatershed economy: Case studies from Brazil. Ecohydrol. Hydrobiol. 16, 83–91(2016).
52. A. D. Benetti, A. E. Lanna, M. S. Cobalchini, Current practices for establishingenvironmental flows in Brazil. River Res. Appl. 20, 427–444 (2004).
53. S. D. Gaines, M. W. Denny, The largest, smallest, highest, lowest, longest, and shortest:Extremes in ecology. Ecology 74, 1677–1692 (1993).
54. B. Richter, J. Baumgartner, R. Wigington, D. Braun, How much water does a river need?Freshwater Biol. 37, 231–249 (1997).
55. A. C. V. Getirana, M.-P. Bonnet, S. Calmant, E. Roux, O. C. Rotunno Filho, W. J. Mansur,Hydrological monitoring of poorly gauged basins based on rainfall–runoff modelingand spatial altimetry. J. Hydrol. 379, 205–219 (2009).
56. J. M. Tucker Lima, D. Valle, E. M. Moretto, S. M. P. Pulice, N. L. Zuca, D. R. Roquetti,L. E. C. Beduschi, A. S. Praia, C. P. F. Okamoto, V. L. da Silva Carvalhaes, E. A. Branco,B. Barbezani, E. Labandera, K. Timpe, D. Kaplan, A social-ecological database to advanceresearch on infrastructure development impacts in the Brazilian Amazon. Sci. Data 3,160071 (2016).
57. K. Timpe, Quantifying the ecohydrological impacts of damming the Amazon. MS Thesis,University of Florida, Gainesville (2016).
58. M. E. Arias, T. Piman, H. Lauri, T. A. Cochrane, M. Kummu, Dams on Mekong tributaries assignificant contributors of hydrological alterations to the Tonle Sap Floodplain inCambodia. Hydrol. Earth Syst. Sci. 18, 5303–5315 (2014).
59. S. E. Bunn, A. H. Arthington, Basic principles and ecological consequences of alteredflow regimes for aquatic biodiversity. Environ. Manage. 30, 492–507 (2002).
60. K. Van Looy, T. Tormos, Y. Souchon, Disentangling dam impacts in river networks. Ecol.Indic. 37, 10–20 (2014).
61. P. McCully, Rivers no more: The environmental effects of dams, in Silenced Rivers: TheEcology and Politics of Large Dams (Zed Books, 1996).
62. M. M. Cernea, Social impacts and social risks in hydropower programs: Preemptiveplanning and counter-risk measures, in Keynote Address: Session on Social Aspects ofHydropower Development. United Nations Symposium on Hydropower and SustainableDevelopment Beijing, China (2004).
63. P. M. Fearnside, Social impacts of Brazil’s Tucuruí dam. Environ. Manage. 24, 483–495(1999).
64. B. Tilt, Y. Braun, D. He, Social impacts of large dam projects: A comparison ofinternational case studies and implications for best practice. J. Environ. Manage. 90,S249–S257 (2009).
65. P. S. Levin, N. Tolimieri, Differences in the impacts of dams on the dynamics ofsalmon populations, in Animal Conservation (Cambridge Univ. Press, 2001), vol. 4,pp. 291–299.
66. N. L. Poff, D. D. Hart, How dams vary and why it matters for the emerging science ofdam removal. BioScience 52, 659–668 (2002).
67. M. Finer, C. N. Jenkins, Proliferation of hydroelectric dams in the Andean Amazon andimplications for Andes-Amazon connectivity. PLOS ONE 7, e35126 (2012).
68. Nature Conservancy, Indicators of Hydrologic Alteration version 7.1: User's Manual(2009).
69. N. L. Poff, J. K. H. Zimmerman, Ecological responses to altered flow regimes: A literaturereview to inform the science and management of environmental flows. Freshwater Biol.55, 194–205 (2010).
70. W. L. Graf, Dam nation: A geographic census of American dams and their large-scalehydrologic impacts. Water Resour. Res. 35, 1305–1311 (1999).
71. P. M. Fearnside, Brazil’s Balbina dam: Environment versus the legacy of the pharaohs inAmazonia. Environ. Manage. 13, 401–423 (1989).
72. P. Zeilhofer, R. M. de Moura, Hydrological changes in the northern Pantanal causedby the Manso dam: Impact analysis and suggestions for mitigation. Ecol. Eng. 35, 105–117(2009).
73. I. Fantin-Cruz, O. Pedrollo, P. Girard, P. Zeilhofer, S. K. Hamilton, Effects of a diversionhydropower facility on the hydrological regime of the Correntes River, a tributary to thePantanal floodplain, Brazil. J. Hydrol. 531, 810–820 (2015).
74. M. Pyron, K. Neumann, Hydrologic alterations in the Wabash River watershed, USA. RiverRes. Appl. 24, 1175–1184 (2008).
75. P. M. Davies, R. J. Naiman, D. M. Warfe, N. E. Pettit, A. H. Arthington, S. E. Bunn, Flow–ecologyrelationships: Closing the loop on effective environmental flows. Mar. Freshwater Res. 65,133–141 (2013).
76. P. Dugan, M. M. Dey, V. V. Sugunan, Fisheries and water productivity in tropical riverbasins: Enhancing food security and livelihoods by managing water for fish. Agric. WaterManage. 80, 262–275 (2006).
77. J. Salo, R. Kalliola, I. Häkkinen, Y. Mäkinen, P. Niemelä, M. Puhakka, P. D. Coley, Riverdynamics and the diversity of Amazon lowland forest. Nature 322, 254–258 (1986).
78. D. J. Hoeinghaus, A. A. Agostinho, L. C. Gomes, F. M. Pelicice, E. K. Okada, J. D. Latini,E. A. L. Kashiwaqui, K. O. Winemiller, Effects of river impoundment on ecosystemservices of large tropical rivers: Embodied energy and market value of artisanal fisheries.Conserv. Biol. 23, 1222–1231 (2009).
79. P. M. Fearnside, Environmental impacts of Brazil’s Tucuruí dam: Unlearned lessons forhydroelectric development in Amazonia. Environ. Manage. 27, 377–396 (2001).
80. F. de Miranda Ribeiro, G. A. da Silva, Life-cycle inventory for hydroelectric generation: ABrazilian case study. J. Clean. Prod. 18, 44–54 (2010).
81. A. Pascale, T. Urmee, A. Moore, Life cycle assessment of a community hydroelectricpower system in rural Thailand. Renew. Energy 36, 2799–2808 (2011).
82. Varun, R. Prakash, I. K. Bhat, Life cycle greenhouse gas emissions estimation for smallhydropower schemes in India. Energy 44, 498–508 (2012).
83. M.Premalatha, Tabassum-Abbasi, T. Abbasi, S. A. Abbasi, A critical viewon theeco-friendlinessof small hydroelectric installations. Sci. Total Environ. 481, 638–643 (2014).
84. J. H. I. Ferreira, J. R. Camacho, J. A. Malagoli, S. C. G. Júnior, Assessment of the potentialof small hydropower development in Brazil. Renew. Sustain. Energy Rev. 56, 380–387 (2016).
85. International Energy Agency, Benign Energy?: The Environmental Implications ofRenewables (Organisation for Economic Co-operation and Development, 1998).
86. L. Kosnik, The potential of water power in the fight against global warming in the US.Energy Policy 36, 3252–3265 (2008).
87. T. Abbasi, S. A. Abbasi, Small hydro and the environmental implications of its extensiveutilization. Renew. Sustain. Energy Rev. 15, 2134–2143 (2011).
88. S. Kelly-Richards, N. Silber-Coats, A. Crootof, D. Tecklin, C. Bauer, Governing thetransition to renewable energy: A review of impacts and policy issues in the smallhydropower boom. Energy Policy 101, 251–264 (2017).
89. H. Zhai, B. Cui, B. Hu, K. Zhang, Prediction of river ecological integrity after cascadehydropower dam construction on the mainstream of rivers in Longitudinal Range-GorgeRegion (LRGR), China. Ecol. Eng. 36, 361–372 (2010).
90. J. Li, S. Dong, Z. Yang, M. Peng, S. Liu, X. Li, Effects of cascade hydropower dams on thestructure and distribution of riparian and upland vegetation along the middle-lowerLancang-Mekong River. For. Ecol. Manage. 284, 251–259 (2012).
91. R. Jansson, C. Nilsson, B. Renöfält, Fragmentation of riparian floras in rivers with multipledams. Ecology 81, 899–903 (2000).
92. V. J. Santucci Jr., S. R. Gephard, S. M. Pescitelli, Effects of multiple low-head dams on fish,macroinvertebrates, habitat, and water quality in the Fox River, Illinois. N. Am. J. Fish.Manage. 25, 975–992 (2005).
93. Q. Zhao, S. Liu, L. Deng, S. Dong, Cong, Wang, Z. Yang, J. Yang, Landscape change andhydrologic alteration associated with dam construction. Int. J. Appl. Earth Obs. Geoinf.16, 17–26 (2012).
94. W. C. de Sousa Júnior, J. Reid, Uncertainties in Amazon hydropower development: Riskscenarios and environmental issues around the Belo Monte dam. Water Altern. 3,249–268 (2010).
95. J. L. d. S. Soito, M. A. V. Freitas, Amazon and the expansion of hydropower in Brazil:Vulnerability, impacts and possibilities for adaptation to global climate change.Renewable Sustainable Energy Rev. 15, 3165–3177 (2011).
96. W. J. Junk, The Central Amazon Floodplain: Ecology of a Pulsing System (Springer Scienceand Business Media, 2013), vol. 126.
97. L. Jiang, X. Ban, X. Wang, X. Cai, Assessment of hydrologic alterations caused by theThree Gorges Dam in the middle and lower reaches of Yangtze River, China. Water 6,1419–1434 (2014).
98. S. J. Birkinshaw, P. Moore, C. G. Kilsby, G. M. O’Donnell, A. J. Hardy, P. A. M. Berry, Dailydischarge estimation at ungauged river sites using remote sensing. Hydrol. Process.28, 1043–1054 (2014).
99. M. C. Soares, “EIA in Brazil: Is it rational?,” thesis, University of East Anglia (2012).
Timpe and Kaplan, Sci. Adv. 2017;3 : e1700611 1 November 2017
100. A. C. Lees, C. A. Peres, P. M. Fearnside, M. Schneider, J. A. S. Zuanon, Hydropower andthe future of Amazonian biodiversity. Biodivers. Conserv. 25, 451–466 (2016).
101. P. M. Fearnside, Impacts of Brazil’s Madeira River dams: Unlearned lessons forhydroelectric development in Amazonia. Environ. Sci. Policy 38, 164–172 (2014).
102. T. Zhou, D. Gong, J. Li, B. Li, Detecting and understanding the multi-decadal variability ofthe East Asian Summer Monsoon: Recent progress and state of affairs. Meteorol. Z.18, 455–467 (2009).
103. D. Labat, J. Ronchail, J. L. Guyot, Recent advances in wavelet analyses: Part 2—Amazon,Parana, Orinoco and Congo discharges time scale variability. J. Hydrol. 314, 289–311(2005).
104. P. C. D. Milly, J. Betancourt, M. Falkenmark, R. M. Hirsch, Z. W. Kundzewicz,D. P. Lettenmaier, R. J. Stouffer, Stationarity is dead: Whither water management?Science 319, 573–574 (2008).
105. C. S. Agostinho, A. A. Agostinho, F. Pelicice, D. A. de Almeida, E. E. Marques, Selectivity of fishladders: A bottleneck in Neotropical fish movement. Neotrop. Ichthyol. 5, 205–213 (2007).
106. A. A. Agostinho, C. S. Agostinho, F. M. Pelicice, E. E. Marques, Fish ladders: Safe fishpassage or hotspot for predation? Neotrop. Ichthyol. 10, 687–696 (2012).
107. R. E. Reis, J. S. Albert, F. Di Dario, M. M. Mincarone, P. Petry, L. A. Rocha, Fish biodiversityand conservation in South America. J. Fish Biol. 89, 12–47 (2016).
108. P. H. Brown, D. Tullos, B. Tilt, D. Magee, A. T. Wolf, Modeling the costs and benefits ofdam construction from a multidisciplinary perspective. J. Environ. Manage. 90,S303–S311 (2009).
109. P. M. Fearnside, Tropical dams: To build or not to build? Science 351, 456–457 (2016).110. L. Castello, M. N. Macedo, Large-scale degradation of Amazonian freshwater
ecosystems. Glob. Chang. Biol. 22, 990–1007 (2015).111. F. A. Prado Jr., S. Athayde, J. Mossa, S. Bohlman, F. Leite, A. Oliver-Smith, How much is
enough? An integrated examination of energy security, economic growth and climatechange related to hydropower expansion in Brazil. Renew. Sustain. Energy Rev. 53,1132–1136 (2016).
112. H. Escobar, Brazil roils waters with moves to protect aquatic life. Science 348, 169–169(2015).
113. W. P. Duncan, M. N. Fernandes, Physicochemical characterization of the white, black,and clearwater rivers of the Amazon Basin and its implications on the distribution offreshwater stingrays (Chondrichthyes, Potamotrygonidae). Pan Am. J. Aquat. Sci. 5,454–464 (2010).
114. S. Huh, D. A. Dickey, M. R. Meador, K. E. Ruhl, Temporal analysis of the frequency andduration of low and high streamflow: Years of record needed to characterize streamflowvariability. J. Hydrol. 310, 78–94 (2005).
115. USGS, Guidelines for Determining Flood Flow Frequency. Bulletin #17B of the HydrologySubcommittee (U.S. Department of the Interior Geological Survey, 1982).
116. R Development Core Team, R: A Language and Environment for Statistical Computing(R Foundation for Statistical Computing, 2016); www.r-project.org.
Acknowledgments: We thank N. Reaver and S. Acharya for their assistance with codedevelopment and S. Athayde, S. Bohlman, and C. Doria for their assistance and feedback inthe development of this research. Funding: Support for this work was provided by theUniversity of Florida (UF) SEED Opportunity Grant, the UF School of Natural Resources andEnvironment, and the Amazon Dams Network (http://amazondamsnetwork.org). Authorcontributions: D.K. and K.T. conceived the study. K.T. developed the database and performed IHAanalyses. D.K. and K.T. analyzed results and wrote the manuscript. Competing interests: Theauthors declare that they have no competing interests. Data and materials availability: All dataneeded to evaluate the conclusions in the paper are present in the paper and/or theSupplementary Materials. Additional data related to this paper may be requested from theauthors. Flow data underlying these analyses are also available from Tucker Lima et al. (56) andfrom the website of the Amazon Dams Network (http://amazondamsnetwork.org/amazon-databases/).
Submitted 28 February 2017Accepted 4 October 2017Published 1 November 201710.1126/sciadv.1700611
Citation: K. Timpe, D. Kaplan, The changing hydrology of a dammed Amazon. Sci. Adv. 3,e1700611 (2017).