THE CHARACTERIZATION OF WOOD-PRESERVING CREOSOTE BY PHYSICAL AND CHEMICAL METHODS OF ANALYSIS USDA Forest Service Research Paper FPL 195 1974 U.S. Department of Agriculture Forest Service Forest Products Laboratory Madison, Wisconsin
Transcript
THE CHARACTERIZATION OF WOOD-PRESERVING CREOSOTE BY PHYSICAL AND CHEMICAL METHODS OF ANALYSIS
USDA Forest Service Research Paper FPL 195 1974
U.S. Department of Agriculture Forest Service Forest Products Laboratory Madison, Wisconsin
Synopsis Published data show that between 11 and
22 of the many hundreds of compounds stated to be present in whole creosote can be designated as major components. These are largely unsubstituted aromatic hydrocarbons, though a few have ring structures with one saturated carbon atom, and three are heterocyclic compounds.
No single analytical method can characterize the chemical composition of a creosote oil in its relationship to the toxicity-preservative function. Broad, but valid, generalizations have been reported.
54)2 provide a comprehensive review of coal-tar creosote as a wood-preservative: History, chemical composition, physical characteristics, toxicity, volatility, and marine use. The objective of this review is the collation of published data to the extent that these might be utilized either immediately to chemically characterize creosote(s) or to direct an experimental research program2 toward this objective. The data are correlated with the various analytical methods used. Two categories of information include (1) lists of specific compounds identified as present and (2) fractions of creosote, any one of which may contain similar compounds.
The mode whereby creosote acts as a wood preservative has not been clearly defined. It is known that its toxicity is dependent upon the presence of “aromatic” compounds (33, 39); however, aromaticity, per se, is a relative term. The saturated, aliphatic hydrocarbons have no toxic action (31). A table of all compounds present in creosote would clearly define its composition, but the information would not necessarily be of value because of the synergism exhibited by creosote in its toxic effect as a wood preservative (39). Furthermore, the complexity of whole creosote oil, or of its admixture with coal tar, precludes analysis in terms of pure compounds (no known analytical method can provide such information simply) except for
the relative few which comprise the group of major components discussed later.
On the opposite score, too little effort has gone into defining fractions of creosote by true type separation methods. A strong case could be made, therefore, for characterizing these fractions quantitatively in terms of the amounts of carbon or ring types (especially aromatic) present and their toxicity or preservative action. No evidence was found for the application of the more sophisticated methods of “carbontype or ring analysis” (41, 55) developed for use in characterizing petroleum oils and their products. Fractionation of the whole oil as carried out experimentally, e.g., by silica gel chromatography or selective solvent partition, is a form of compound, or molecular, type analysis. C h e m i c a l Compos i t i on o f
Creosote Officially (8), American wood-preserving
creosote is defined as a distillate from coal tar made by high-temperature carbonization of bituminous coal; the boiling range of the creosote is at least 125° C beginning at about 200° C. Various other creosotes may be defined, the physical and chemical characteristics of which are dependent upon the temperature
1 Maintained at Madison, Wis., in cooperation with the University of Wisconsin. 2 Underlined numbers in parentheses refer to literature cited at the end of this report.3 The experimental study is discussed later.
1
at which the coal(s) are carbonized and/or the type of equipment used. The subject has been treated in detail (35, 47). McNeil emphasized early, however, that differences between all coal-tar creosotes resulted from the relative amounts and distribution of types of chemical compounds and not in the nature of the compounds (33). Classes of Compounds
The subject of compound classes in coal tar and creosote was discussed in general terms by McNeil (33). In coal tar, well over 400 individual compounds have been identified, but the components in creosote belong to a relatively small number of chemical classes. One of these, the polynuclear aromatic hydrocarbons, generally accounts for 90 percent of the constituents in a coke-oven creosote; the major members of this class contain no substituent groups (34). McNeil states further (33) that all high-temperature coal-tar creosotes are similar to the extent that they contain varying quantities of the same restricted number of chemical classes. The significance of this statement to the analysis of creosotes will be apparent from the data assembled in the next section.
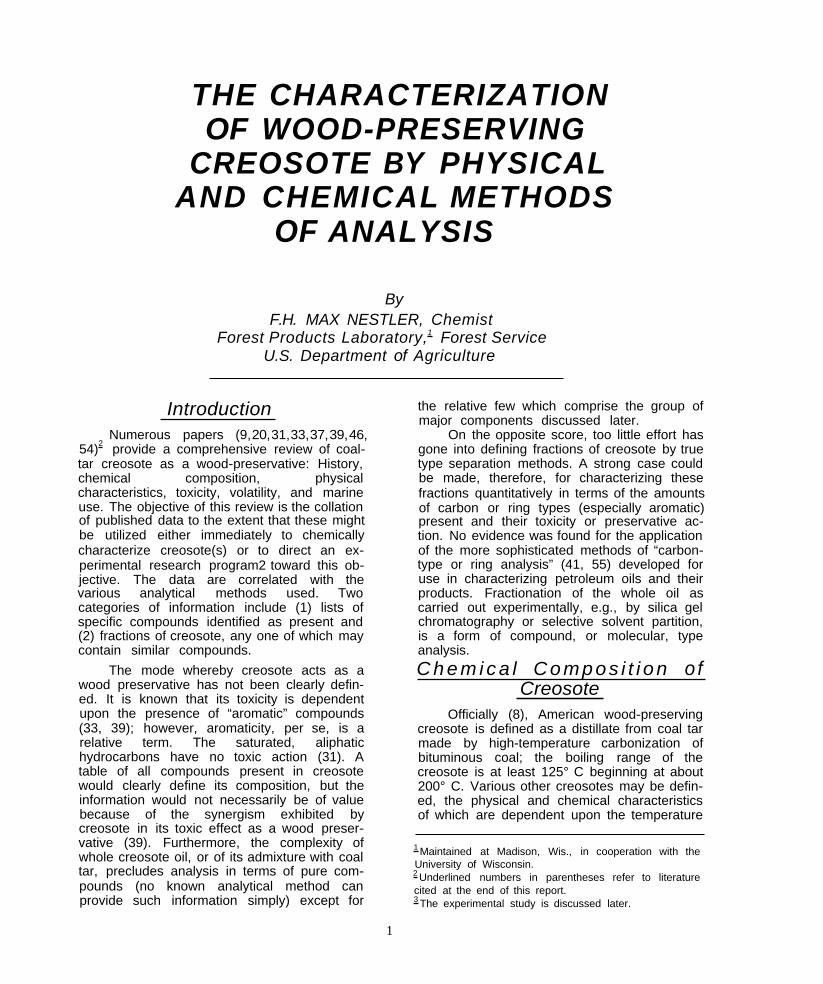
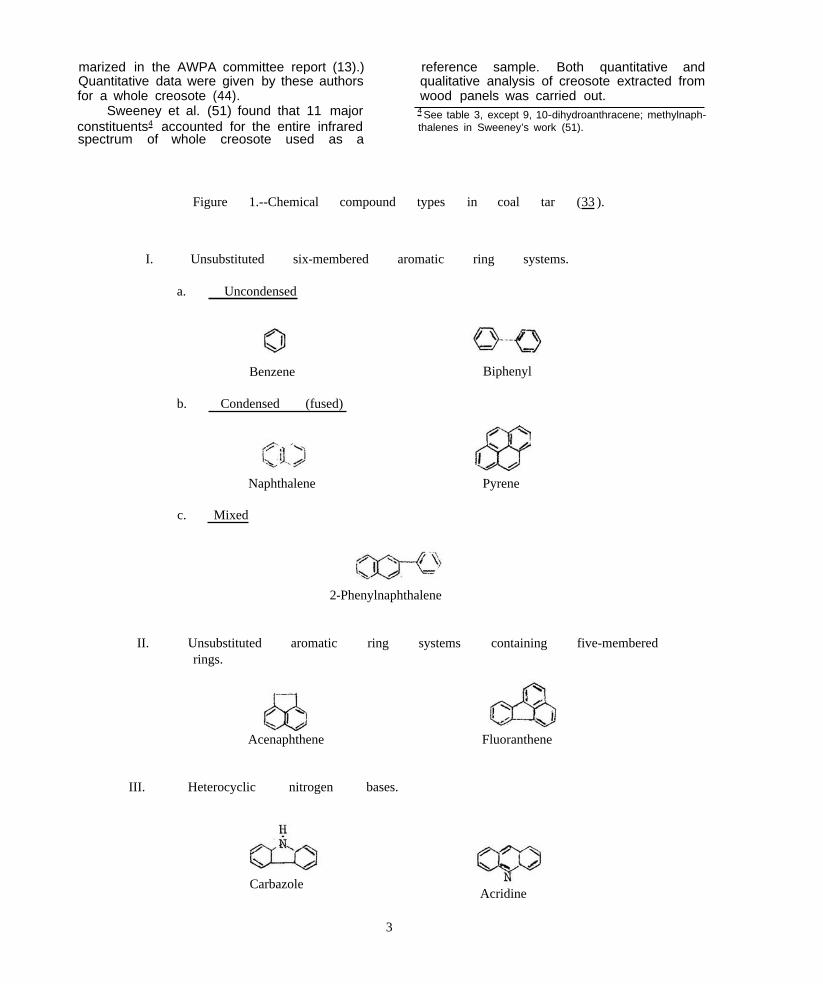
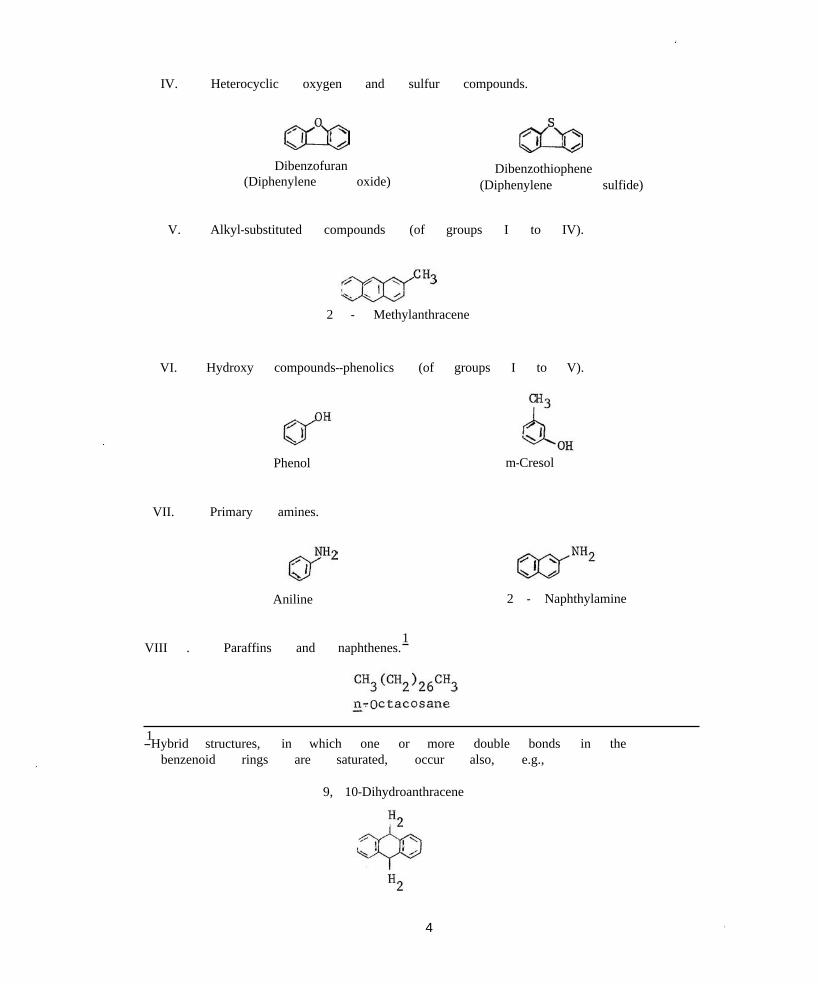
Examples of eight types of chemical compounds occurring in coal tar are illustrated in figure 1 (33). All, except benzene whose boiling point (TB = 80° C) is much below the creosote distillation range, have been reported present in creosote or may be expected to be found, table 1 (48) (see section following). Specific Compounds
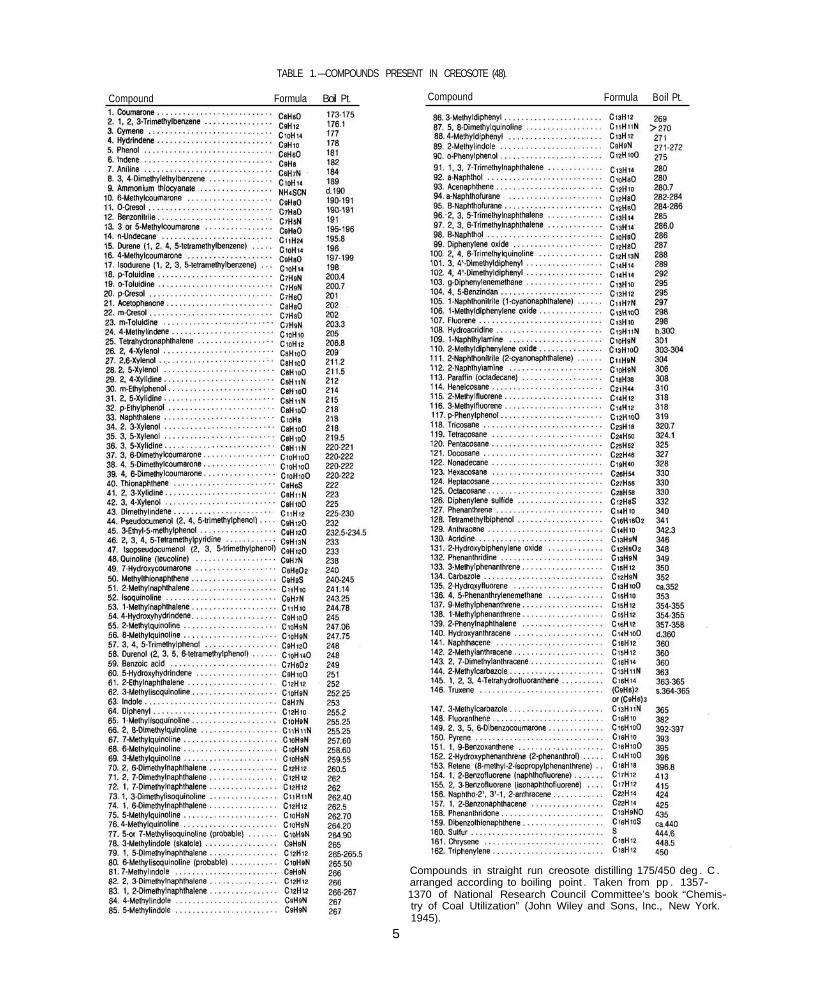
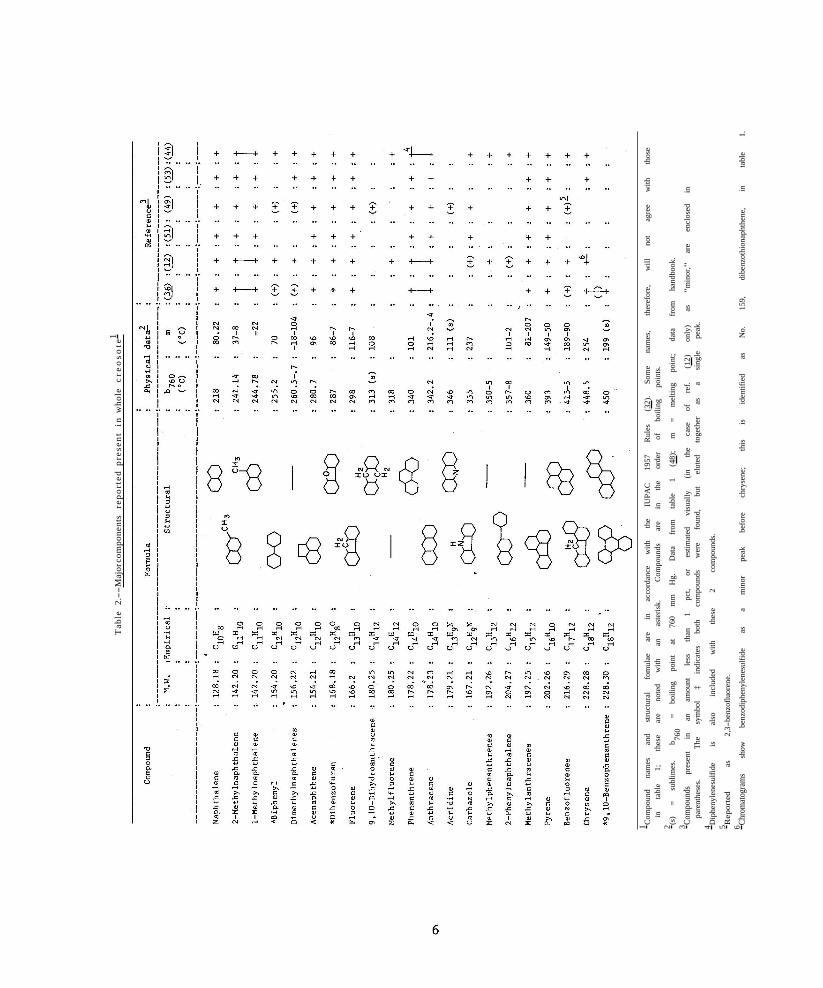
Table 1 represents the most comprehensive published list of compounds expected to be found in creosote. It is based on Rhodes’ (45) compilation of compounds identified from the carbonization of coal. Roche (48) assumed that creosote, as a bulk distillate of coal tar, would contain those compounds whose boiling points (TB) fall within the usual industrial practice for straight-run creosote distilling over the range 175° to 450° C. In the discussion following, it will be seen from experimental work that only a limited number of those in table 1 are present to the extent of 1 percent or more, and yet may constitute as much as 56 percent of a whole creosote oil (49). These major components are arranged in table 2 in the order of increasing boiling point. Their selection was based on the published analytical data sources noted in the last six columns.
McNeil (34) used gas-liquid chromatography (GLC) to identify a large
number of compounds in two fractions-the neutral oil and tar acids-ofcreosote. With the exception of a small number boiling below 170° C, all the compounds he identified may be found in table 1. Furthermore, any compounds reported present to the extent of 1 percent or more are also among those listed in table 2.
McNeil and Vaughan (36) also used GLC to examine creosote which was volatilized from small (splinter-20mg) samples of impregnated wood. Their report did not include data for the original creosote used to prepare the “freshly impregnated” wood block (sample 4), preventing an actual before-and-after comparison of the composition. Thus, while this work does not represent data for an actual whole creosote, it is believed that the experimental GLC conditions were such that the material analyzed was a close approximation to such an oil. These data have, therefore, been included in preparing table 2.
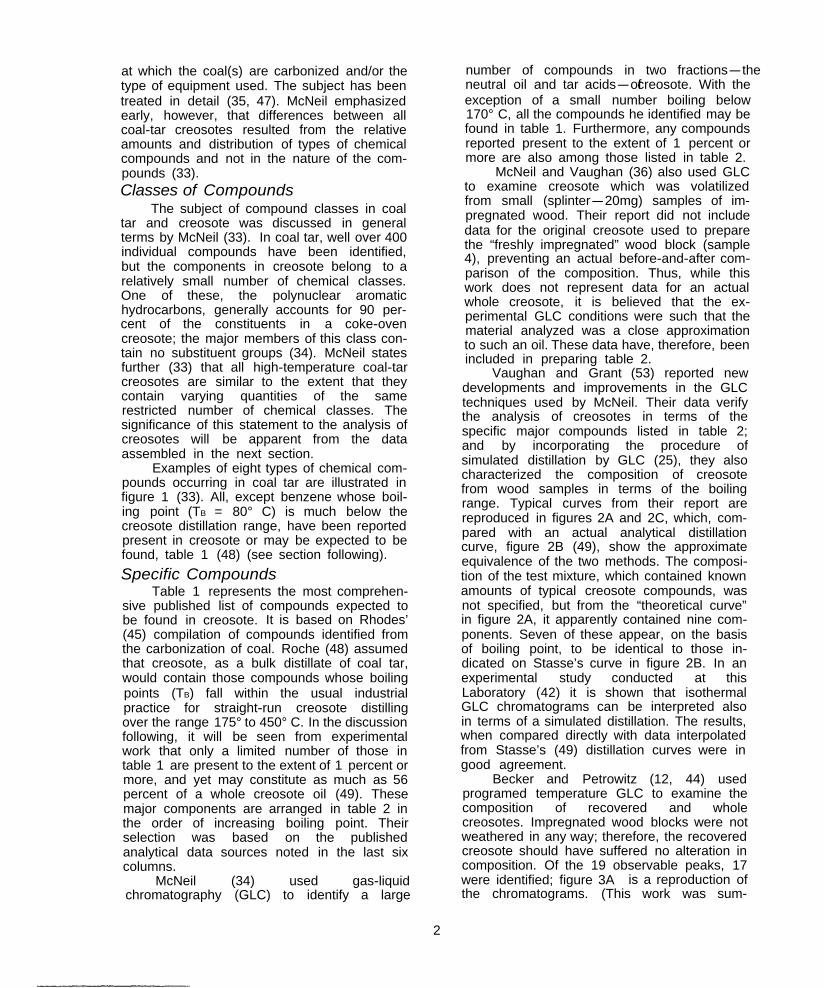
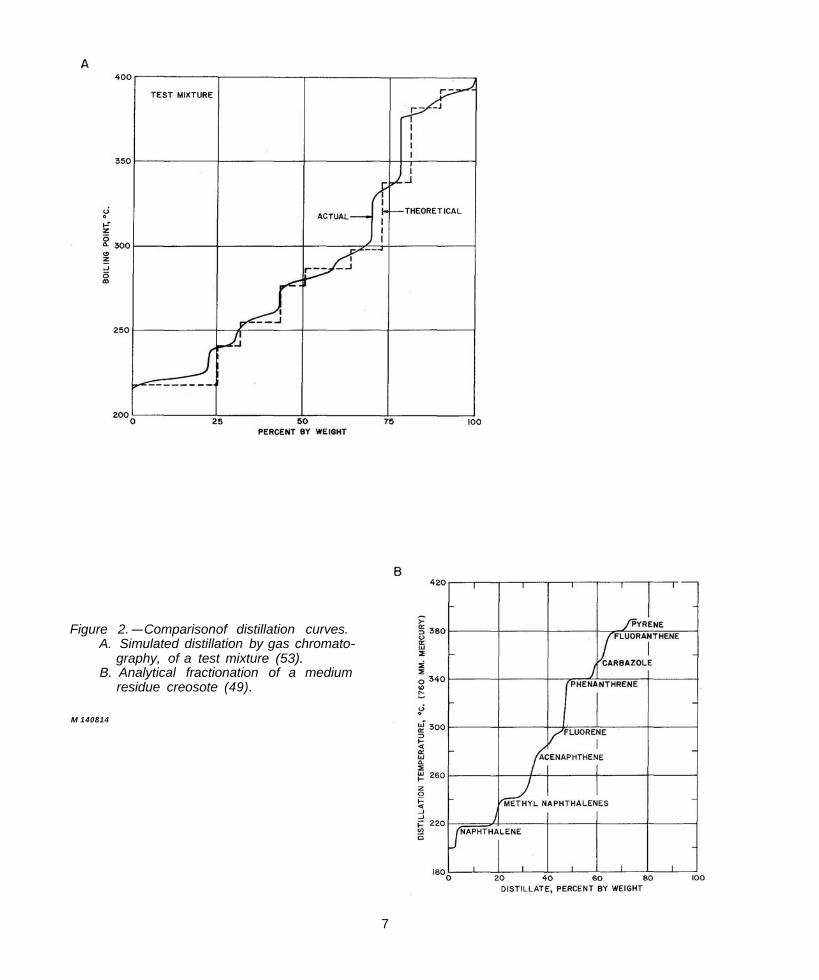
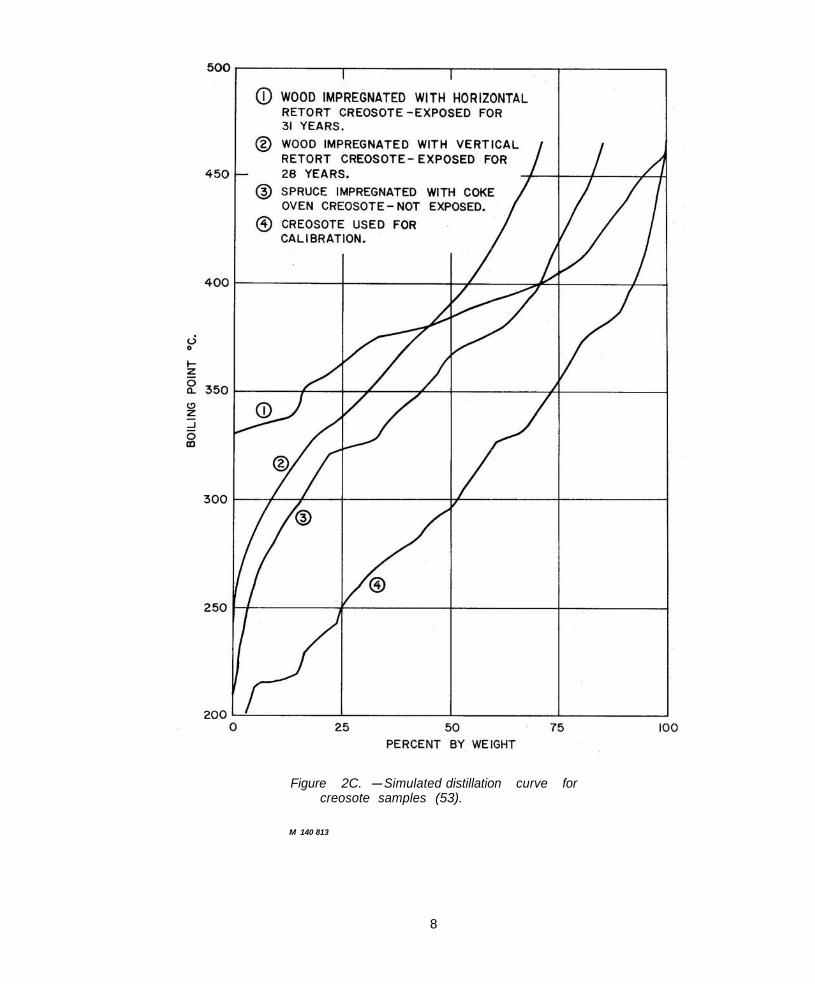
Vaughan and Grant (53) reported new developments and improvements in the GLC techniques used by McNeil. Their data verify the analysis of creosotes in terms of the specific major compounds listed in table 2; and by incorporating the procedure of simulated distillation by GLC (25), they also characterized the composition of creosote from wood samples in terms of the boiling range. Typical curves from their report are reproduced in figures 2A and 2C, which, compared with an actual analytical distillation curve, figure 2B (49), show the approximate equivalence of the two methods. The composition of the test mixture, which contained known amounts of typical creosote compounds, was not specified, but from the “theoretical curve” in figure 2A, it apparently contained nine components. Seven of these appear, on the basis of boiling point, to be identical to those indicated on Stasse’s curve in figure 2B. In an experimental study conducted at this Laboratory (42) it is shown that isothermal GLC chromatograms can be interpreted also in terms of a simulated distillation. The results, when compared directly with data interpolated from Stasse’s (49) distillation curves were in good agreement.
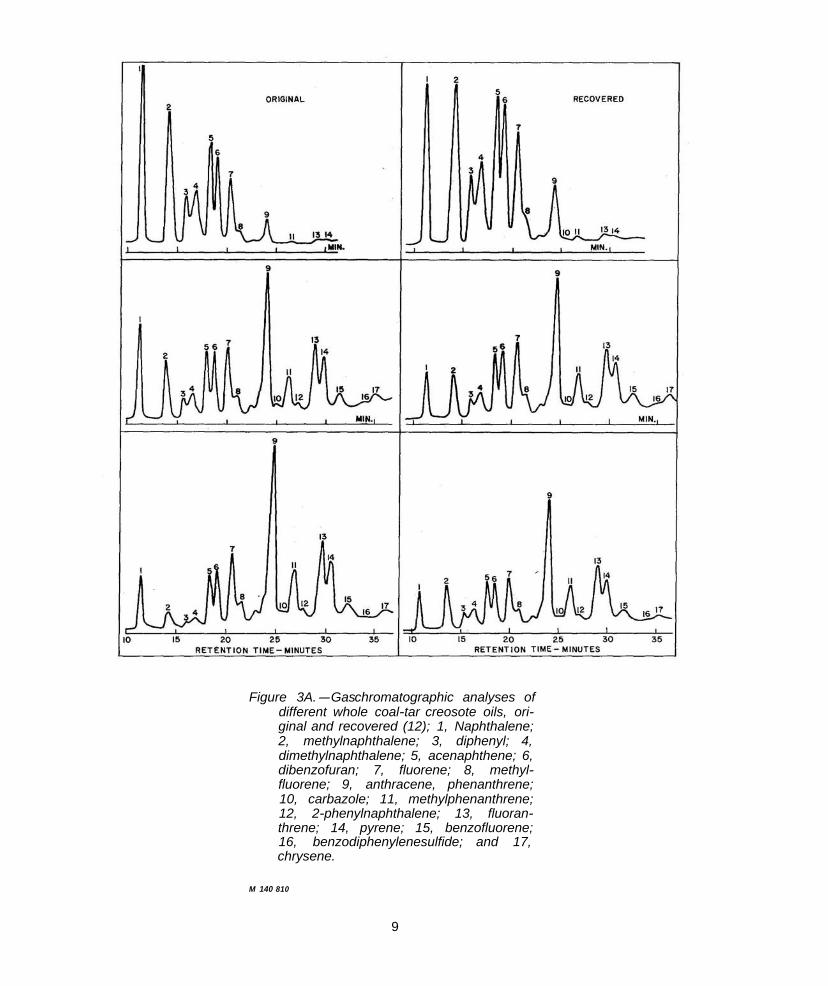
Becker and Petrowitz (12, 44) used programed temperature GLC to examine the composition of recovered and whole creosotes. Impregnated wood blocks were not weathered in any way; therefore, the recovered creosote should have suffered no alteration in composition. Of the 19 observable peaks, 17 were identified; figure 3A is a reproduction of the chromatograms. (This work was sum
2
marized in the AWPA committee report (13).) Quantitative data were given by these authors for a whole creosote (44).
Sweeney et al. (51) found that 11 major constituents4 accounted for the entire infrared spectrum of whole creosote used as a
Figure 1.--Chemical compound
I. Unsubstituted six-membered
a. Uncondensed
Benzene
b. Condensed (fused)
Naphthalene
c. Mixed
reference sample. Both quantitative and qualitative analysis of creosote extracted from wood panels was carried out.
4 See table 3, except 9, 10-dihydroanthracene; methylnaphthalenes in Sweeney’s work (51).
types in coal tar (33 ).
aromatic ring systems.
Biphenyl
Pyrene
2-Phenylnaphthalene
II. Unsubstituted aromatic ring systems containing five-membered rings.
V. Alkyl-substituted compounds (of groups I to IV).
2 - Methylanthracene
VI. Hydroxy compounds--phenolics (of groups I to V).
Phenol m-Cresol
VII. Primary amines.
Aniline 2 - Naphthylamine
1VIII . Paraffins and naphthenes.
1 -Hybrid structures, in which one or more double bonds in the benzenoid rings are saturated, occur also, e.g.,
9, 10-Dihydroanthracene
4
TABLE 1.-COMPOUNDS PRESENT IN CREOSOTE (48).
Compound Formula Boil Pt. Compound Formula Boil Pt.
Compounds in straight run creosote distilling 175/450 deg . C . arranged according to boiling point . Taken from pp . 13571370 of National Research Council Committee’s book “Chemistry of Coal Utilization” (John Wiley and Sons, Inc., New York. 1945).
5
Tab
le
2.--
Maj
or co
mpo
nent
s re
port
ed p
rese
nt
in w
hole
c
reo
sote
1
1 Com
poun
d na
mes
an
d st
ruct
ural
fo
mul
ae
are
in
acco
rdan
ce
with
th
e IU
PAC
19
57
Rul
es
(32)
. So
me
nam
es,
ther
efor
e,
will
no
t ag
ree
with
th
ose
in
tabl
e 1;
th
ese
are
note
d w
ith
an
aste
risk.
C
ompo
unds
ar
e in
th
e or
der
of
boili
ng
poin
ts.
2 (s)
= su
blim
es.
b 760
= bo
iling
po
int
at
760
mm
H
g.
Dat
a fr
om
tabl
e 1
(48)
; m
=
mel
ting
poin
t; da
ta
from
ha
ndbo
ok.
3 Com
poun
ds
pres
ent
in
an
amou
nt
less
th
an
1 pc
t, or
es
timat
ed
visu
ally
(in
th
e ca
se
of
ref.
(12)
on
ly)
as
"min
or,"
ar
e en
clos
ed
in
pare
nthe
ses.
Th
e sy
mbo
l ‡
indi
cate
s bo
th
com
poun
ds
wer
e fo
und,
bu
t el
uted
to
geth
er
as
a si
ngle
pe
ak.
4 Dip
heny
lene
sulfi
de
is
also
in
clud
ed
with
th
ese
2 co
mpo
unds
. 5 R
epor
ted
as
2,3-
benz
oflu
oren
e.
6 Chro
mat
ogra
ms
show
be
nzod
iphe
nyle
nesu
lfide
as
a
min
or
peak
be
fore
ch
ryse
ne;
this
is
id
entif
ied
as
No.
15
9,
dibe
nzot
hion
apht
hene
, in
ta
ble
1.
Figure 2.-Comparisonof distillation curves. A. Simulated distillation by gas chromato
graphy, of a test mixture (53). B. Analytical fractionation of a medium
residue creosote (49).
M 140814
7
Figure 2C. -Simulated distillation curve for creosote samples (53).
Stasse (49) fractionally distilled creosotes to obtain analytical data. Eleven of the 16 major components which he listed were found to be present to the extent of 1 percent (by weight) or more. Minor components were not estimated. The data from this report were found to be the most consistent and comprehensive results published for whole creosote oils.
Data from six of the preceding references (12, 36, 44, 49, 51, 53) have been summarized in table 2 to show the accuracy of the qualitative correlation for the compounds reported. This is a compilation which emphasizes the most commonly occurring compounds, those present to the extent of 1 percent or more, and is based on the assumption that the data were obtained from a sample of whole creosote, either as received or, in effect, as extracted from treated wood.
With respect to the qualitative composition of creosote, there is good agreement for these major constituents. Fifteen of the 22 probable compounds have been identified by two or more researchers and by more than one analytical technique. Several regions in the table do require more definitive measurements, however, in order to verify the presence of some compounds. This is particularly true in the GLC work (12, 36, 44, 53) where inadequate column resolution leaves identification of some peaks open to question for compounds having little separation in boiling points. The greatest uncertainty exists for the higher molecular weight, higher boiling compounds beginning with acridine and continuing to the end of the table. To what extent these constitute that portion of the distillation curve called the “residue fraction” (AWPA designation (8)) is not known since such information does not appear to exist in the form of specific data. On the other hand, from boiling point considerations alone, one would expect to find an increasing number of these higher weight compounds in the residue fraction. This supposition was confirmed by the experimental study (42) employing GLC and a 14component standard mixture of aromatic compounds, the boiling points of which ranged from 218° C (naphthalene) to 449° C (chrysene).
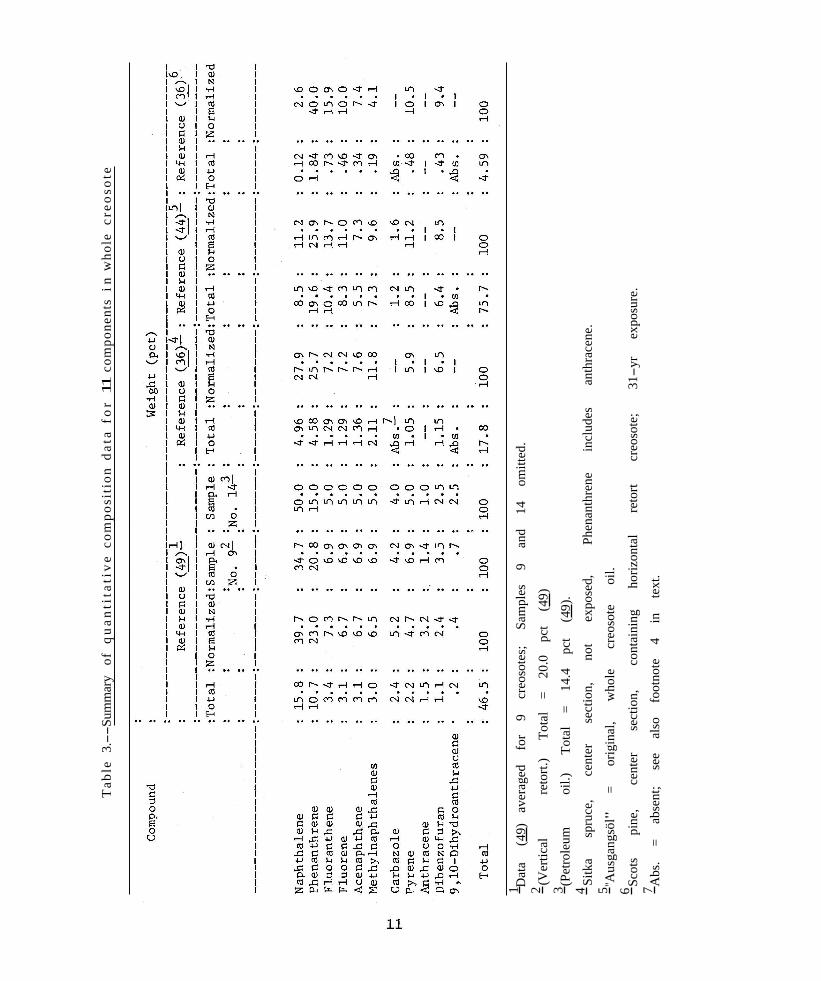
The quantitative composition of creosote is summarized in table 3 from the sources indicated.
Stasse’s data (49) were rearranged to show the average distribution of his 11 major components in nine of the creosotes; source and type of oil were disregarded in the averaging.5 Normalization (“Total” = 100 pct) of the data shows the relative composition of
these 11 major components as a group. Creosote No. 9 with the lowest specific gravity and the smallest total amount of this major group still appeared to have the same relative composition as the average. Sample 14, which was not a coal-tar creosote, but rather a nontoxic petroleum oil, also had a similar complement of these major components. Thus, this series of creosotes appears to fall within a fairly well-defined, though broad, envelope of composition.
Few recent publications are available containing quantitative data which could be compared with Stasse’s (49). Results from two (36, 44), however, for the same group of major compounds, are included in table 3. Again, the normalized values show considerable similarity to the distillation data. The German creosote (44) contained several compounds which were exceptions to Stasse’s results.
McNeil and Vaughan (36) also examined creosotes obtained from exposed, treated woods; data for one of these are in the last two columns of table 3. The redistribution of composition which took place is very evident (compare columns 7 and 11) and, as the authors point out, is generally in the direction of an increase in the less volatile components. Those lost, principally naphthalene and the methylnaphthalenes, would be the more water-soluble ones.
In their analyses, these authors (36, 44) included a number of compounds not among the major ones listed in table 3. It appears from their results and from the correlation in table 2 that the dimethylnaphthalenes, diphenyl, the benzofluorenes, and chrysene (triphenylene) should be included in table 3. Each can be present in significant amount in whole creosote (44) and can be found in treated wood even after long exposures (36). Stasse (49) did not, however, report quantitative data for any of the above compounds. (It will be seen later in the discussion of the experimental study (42) that suitable adjustment was made to include additional compounds as representative of the major group.)
Both research groups (36, 44) reported finding methyl-substituted compounds for which analytical correlation is poor; these are the methylphenanthrenes and methylanthracenes. This situation may well be explainable in the same respect as for the parent compounds, phenanthrene and anthracene, which
5 See table 2 in ref. 49. Creosotes Nos. 9 and 14 were omitted. Because 9, 10-dihydroanthracene was present to less than 1 pct, it was not considered a major component from the present review, and was omitted, therefore, from the experimental study (42).
10
1 2 3 4 5 6 7
Tab
le 3
.--S
umm
ary
of
qu
anti
tati
ve
com
posi
tion
dat
a fo
r 11
com
pone
nts
in w
hole
cre
oso
te
Dat
a (4
9)
aver
aged
fo
r 9
creo
sote
s;
Sam
ples
9
and
14
omitt
ed.
(Ver
tical
re
tort.
) To
tal
= 20
.0
pct
(49)
(Pet
role
um
oil.)
To
tal
= 14
.4
pct
( 49)
.
Sitk
a sp
ruce
, ce
nter
se
ctio
n,
not
expo
sed,
Ph
enan
thre
ne
incl
udes
an
thra
cene
.
"Aus
gang
söl"
=
orig
inal
, w
hole
cr
eoso
te
oil.
Scot
s pi
ne,
cent
er
sect
ion,
co
ntai
ning
ho
rizon
tal
reto
rt cr
eoso
te;
31-y
r ex
posu
re.
Abs
. =
abse
nt;
see
also
fo
otno
te
4 in
te
xt.
cannot be separated by GLC due to closeness of boiling points and use of nonselective liquid phases; a chromatogram by McNeil and Vaughan (36) illustrates this. Both derivatives have been reported in significant enough quantities to warrant being included in table 3. The methylanthracenes were still present in exposed wood (36). However, in the absence of adequate peak resolution on a chromatogram, positive identification by means of gas-chromatography retention data is very uncertain, and may well rest upon a fortuitous choice of the reference compound(s) used.
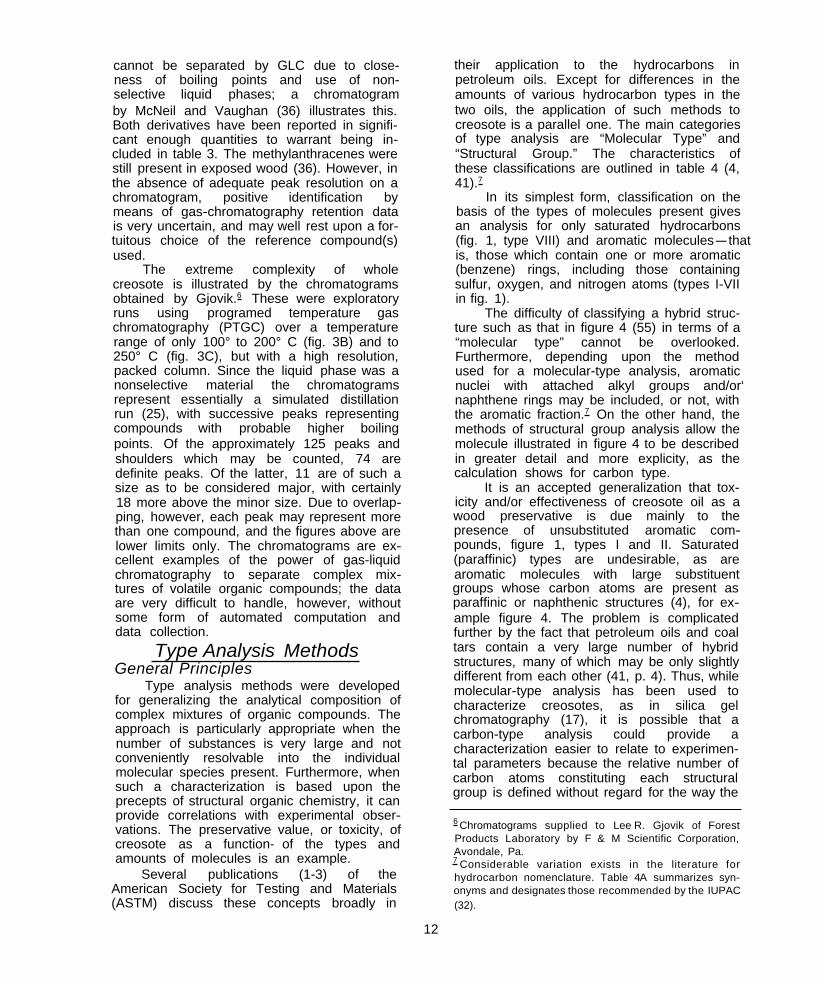
The extreme complexity of whole creosote is illustrated by the chromatograms obtained by Gjovik.6 These were exploratory runs using programed temperature gas chromatography (PTGC) over a temperature range of only 100° to 200° C (fig. 3B) and to 250° C (fig. 3C), but with a high resolution, packed column. Since the liquid phase was a nonselective material the chromatograms represent essentially a simulated distillation run (25), with successive peaks representing compounds with probable higher boiling points. Of the approximately 125 peaks and shoulders which may be counted, 74 are definite peaks. Of the latter, 11 are of such a size as to be considered major, with certainly 18 more above the minor size. Due to overlapping, however, each peak may represent more than one compound, and the figures above are lower limits only. The chromatograms are excellent examples of the power of gas-liquid chromatography to separate complex mixtures of volatile organic compounds; the data are very difficult to handle, however, without some form of automated computation and data collection.
Type Analysis Methods General Principles
Type analysis methods were developed for generalizing the analytical composition of complex mixtures of organic compounds. The approach is particularly appropriate when the number of substances is very large and not conveniently resolvable into the individual molecular species present. Furthermore, when such a characterization is based upon the precepts of structural organic chemistry, it can provide correlations with experimental observations. The preservative value, or toxicity, of creosote as a function- of the types and amounts of molecules is an example.
Several publications (1-3) of the American Society for Testing and Materials (ASTM) discuss these concepts broadly in
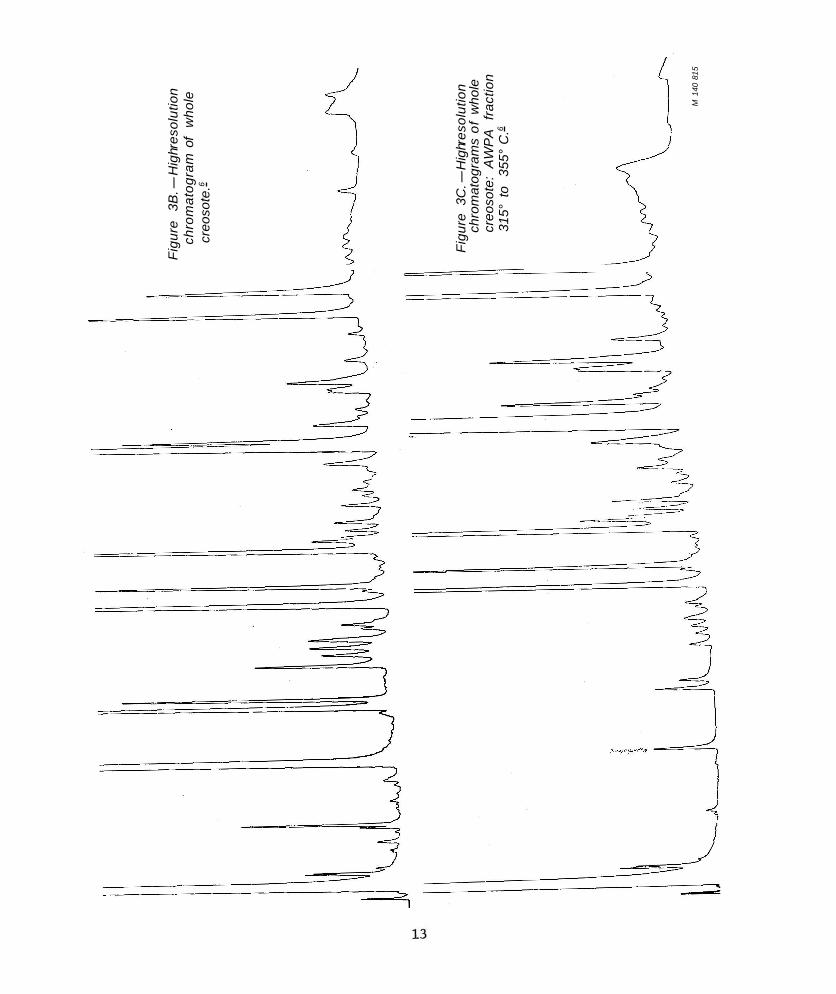
their application to the hydrocarbons in petroleum oils. Except for differences in the amounts of various hydrocarbon types in the two oils, the application of such methods to creosote is a parallel one. The main categories of type analysis are “Molecular Type” and “Structural Group.” The characteristics of these classifications are outlined in table 4 (4, 41).7
In its simplest form, classification on the basis of the types of molecules present gives an analysis for only saturated hydrocarbons (fig. 1, type VIII) and aromatic molecules-that is, those which contain one or more aromatic (benzene) rings, including those containing sulfur, oxygen, and nitrogen atoms (types I-VII in fig. 1).
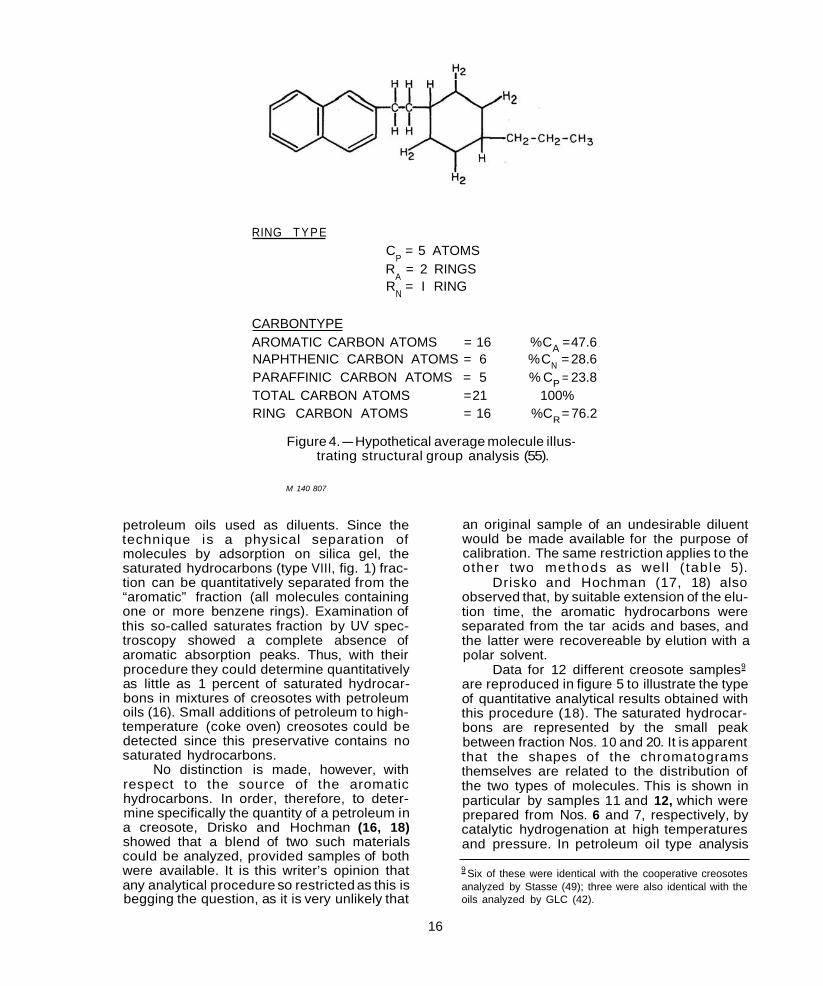
The difficulty of classifying a hybrid structure such as that in figure 4 (55) in terms of a “molecular type” cannot be overlooked. Furthermore, depending upon the method used for a molecular-type analysis, aromatic nuclei with attached alkyl groups and/or‘ naphthene rings may be included, or not, with the aromatic fraction.7 On the other hand, the methods of structural group analysis allow the molecule illustrated in figure 4 to be described in greater detail and more explicity, as the calculation shows for carbon type.
It is an accepted generalization that toxicity and/or effectiveness of creosote oil as a wood preservative is due mainly to the presence of unsubstituted aromatic compounds, figure 1, types I and II. Saturated (paraffinic) types are undesirable, as are aromatic molecules with large substituent groups whose carbon atoms are present as paraffinic or naphthenic structures (4), for example figure 4. The problem is complicated further by the fact that petroleum oils and coal tars contain a very large number of hybrid structures, many of which may be only slightly different from each other (41, p. 4). Thus, while molecular-type analysis has been used to characterize creosotes, as in silica gel chromatography (17), it is possible that a carbon-type analysis could provide a characterization easier to relate to experimental parameters because the relative number of carbon atoms constituting each structural group is defined without regard for the way the
6 Chromatograms supplied to Lee R. Gjovik of Forest Products Laboratory by F & M Scientific Corporation, Avondale, Pa. 7 Considerable variation exists in the literature for hydrocarbon nomenclature. Table 4A summarizes synonyms and designates those recommended by the IUPAC (32).
12
Fig
ure
3B.-
Hig
hres
olut
ion
chro
mat
ogra
m o
f w
hole
cr
eoso
te.6
Fig
ure
3C.-
Hig
hres
olut
ion
chro
mat
ogra
ms
of w
hole
cr
eoso
te:
AW
PA
fr
actio
n 31
5° t
o 35
5° C
.6
M 1
40 8
15
--Table 4. Nomenclature and symbols f o r t h e composition of o i l s and f r a c t i o n s (4 , 4 1)
A. Molecular Type Analysis (percentage of sample)
Aromatic
Olefinic
Naphthenic
Paraffinic (contains none of the preceding three)
B. Structural Group Analysis
Ring type (number per mean molecule)
Number of paraffin chain carbons, CP
Number of aromatic. rings, RA
Number of naphthene rings, RN
Carbon type (percentage of sample)
Number of carbon atoms in ring structures, %CR
Number of carbon atoms in aromatic structures, %CA Number of carbon atoms in naphthene structures, %CN
Number of carbon atoms in paraffin chain structures, %CP
C. Elemental Analysis (percentage of sample)
Carbon, %C
Hydrogen, %H
Sulfur, %S
Oxygen, %O
Nitrogen, %N
groups are combined in the molecules. There The ASTM has recently approved a appears to be no evidence in the literature for method (5) for carbon-type composition of in-the application of structural group analysis sulating oils of petroleum origin. The method is concepts directly to creosotes. The obvious said to be applicable to oils having average need for such, however, was recognized and 8 R.T. Bell in the discussion section following the paper by stated explicitly as early as 1952.8 Heiks (26).
14
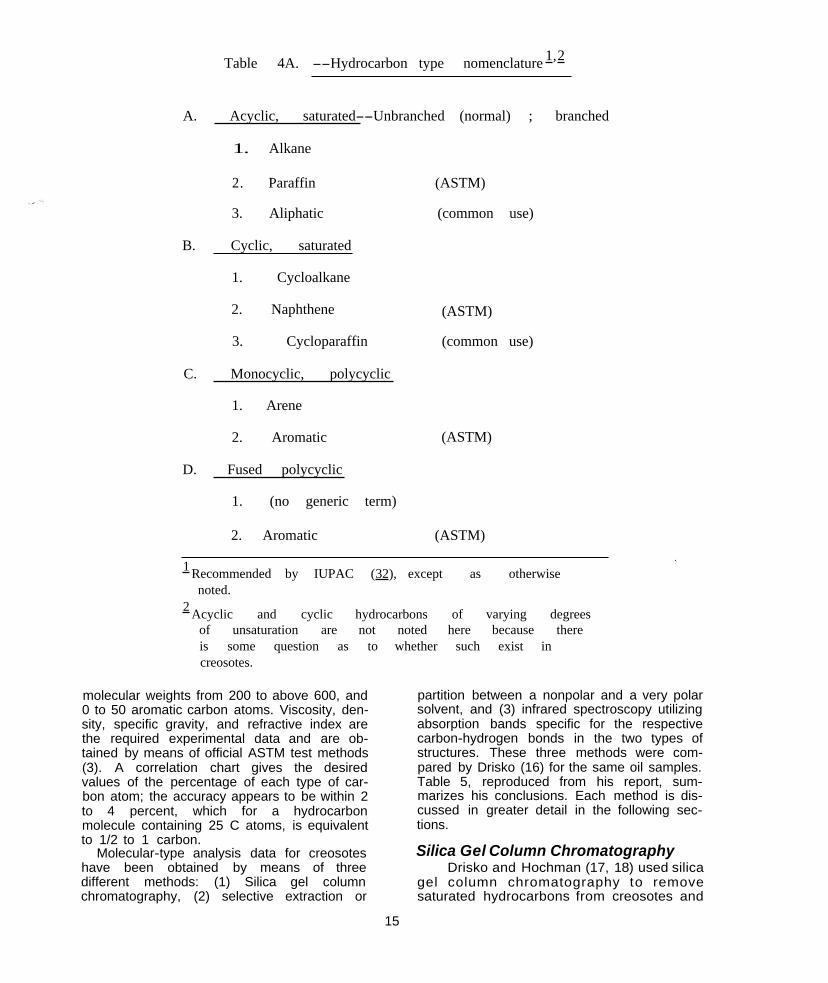
Table 4A. --Hydrocarbon type nomenclature 1,2
A. Acyclic, saturated--Unbranched (normal) ; branched
1. Alkane
2. Paraffin (ASTM)
3. Aliphatic (common use)
B. Cyclic, saturated
1. Cycloalkane
2. Naphthene (ASTM)
3. Cycloparaffin (common use)
C. Monocyclic, polycyclic
1. Arene
2. Aromatic (ASTM)
D. Fused polycyclic
1. (no generic term)
2. Aromatic (ASTM)
1 Recommended by IUPAC (32), except as otherwise noted.
2 Acyclic and cyclic hydrocarbons of varying degrees of unsaturation are not is some question as to creosotes.
molecular weights from 200 to above 600, and 0 to 50 aromatic carbon atoms. Viscosity, density, specific gravity, and refractive index are the required experimental data and are obtained by means of official ASTM test methods (3). A correlation chart gives the desired values of the percentage of each type of carbon atom; the accuracy appears to be within 2 to 4 percent, which for a hydrocarbon molecule containing 25 C atoms, is equivalent to 1/2 to 1 carbon.
Molecular-type analysis data for creosotes have been obtained by means of three different methods: (1) Silica gel column chromatography, (2) selective extraction or
noted here because there whether such exist in
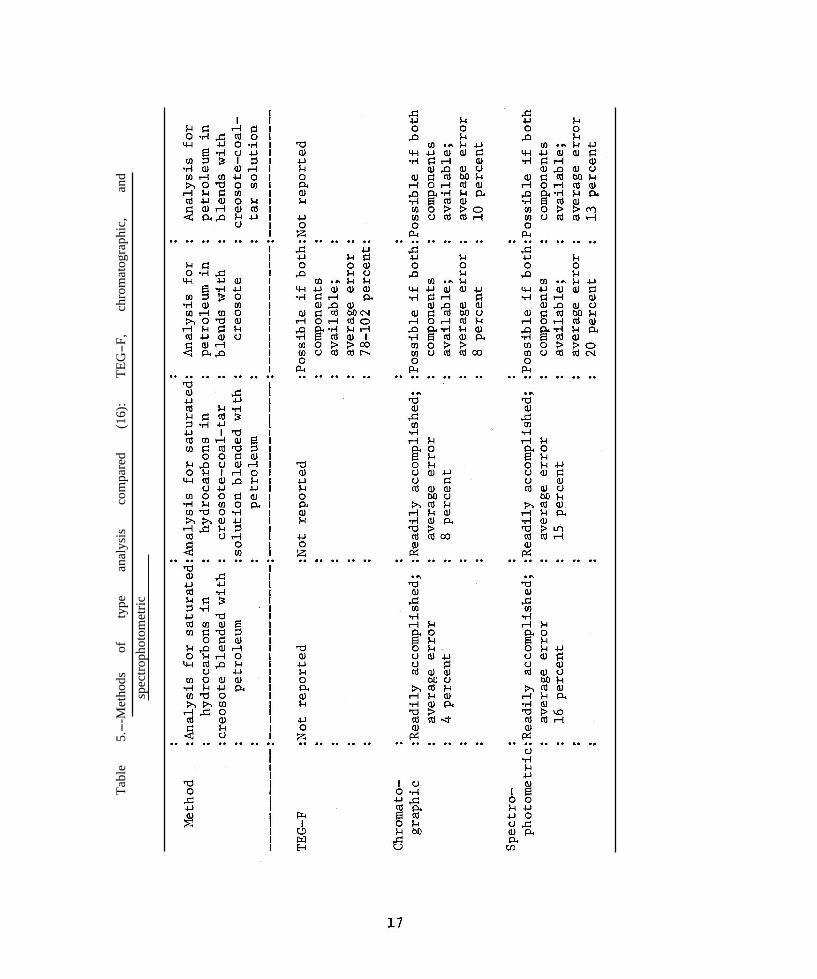
partition between a nonpolar and a very polar solvent, and (3) infrared spectroscopy utilizing absorption bands specific for the respective carbon-hydrogen bonds in the two types of structures. These three methods were compared by Drisko (16) for the same oil samples. Table 5, reproduced from his report, summarizes his conclusions. Each method is discussed in greater detail in the following sections.
Silica Gel Column Chromatography Drisko and Hochman (17, 18) used silica
gel column chromatography to remove saturated hydrocarbons from creosotes and
Figure 4.-Hypothetical average molecule illustrating structural group analysis (55).
M 140 807
petroleum oils used as diluents. Since the technique is a physical separation of molecules by adsorption on silica gel, the saturated hydrocarbons (type VIII, fig. 1) fraction can be quantitatively separated from the “aromatic” fraction (all molecules containing one or more benzene rings). Examination of this so-called saturates fraction by UV spectroscopy showed a complete absence of aromatic absorption peaks. Thus, with their procedure they could determine quantitatively as little as 1 percent of saturated hydrocarbons in mixtures of creosotes with petroleum oils (16). Small additions of petroleum to high-temperature (coke oven) creosotes could be detected since this preservative contains no saturated hydrocarbons.
No distinction is made, however, with respect to the source of the aromatic hydrocarbons. In order, therefore, to determine specifically the quantity of a petroleum in a creosote, Drisko and Hochman (16, 18) showed that a blend of two such materials could be analyzed, provided samples of both were available. It is this writer’s opinion that any analytical procedure so restricted as this is begging the question, as it is very unlikely that
an original sample of an undesirable diluent would be made available for the purpose of calibration. The same restriction applies to the other two methods as well ( table 5).
Drisko and Hochman (17, 18) also observed that, by suitable extension of the elution time, the aromatic hydrocarbons were separated from the tar acids and bases, and the latter were recovereable by elution with a polar solvent.
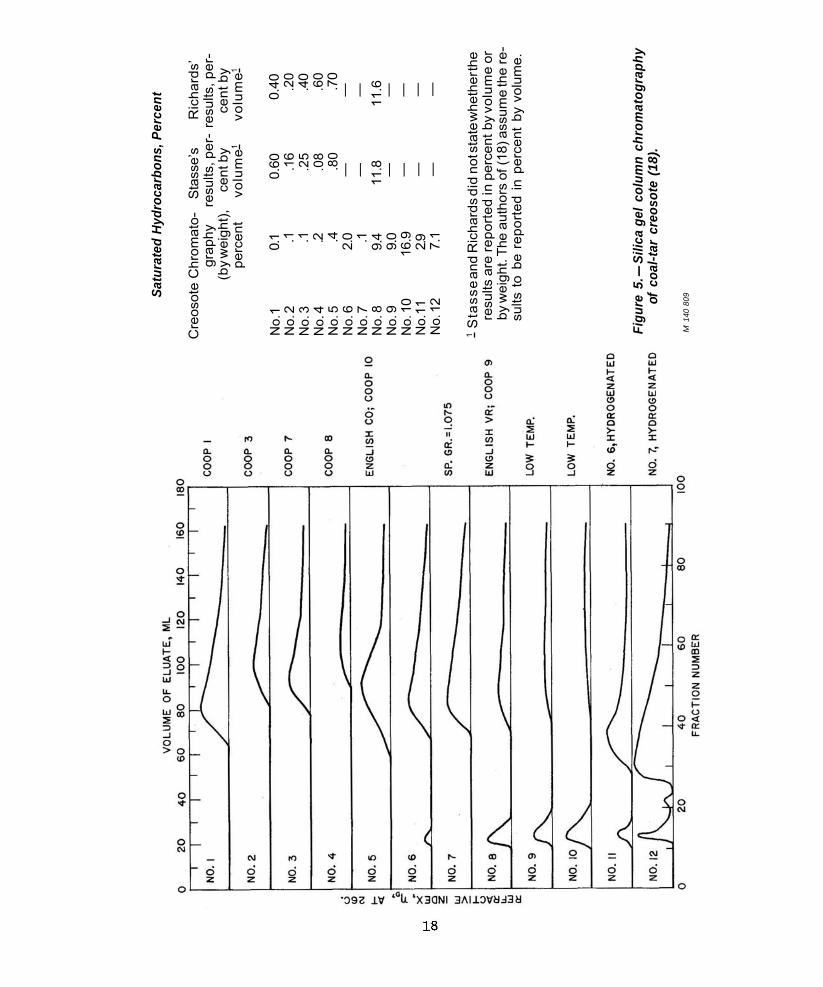
Data for 12 different creosote samples9
are reproduced in figure 5 to illustrate the type of quantitative analytical results obtained with this procedure (18). The saturated hydrocarbons are represented by the small peak between fraction Nos. 10 and 20. It is apparent that the shapes of the chromatograms themselves are related to the distribution of the two types of molecules. This is shown in particular by samples 11 and 12, which were prepared from Nos. 6 and 7, respectively, by catalytic hydrogenation at high temperatures and pressure. In petroleum oil type analysis
9 Six of these were identical with the cooperative creosotes analyzed by Stasse (49); three were also identical with the oils analyzed by GLC (42).
16
Tabl
e 5.-
-Met
hods
of
ty
pe
anal
ysis
co
mpa
red
(16)
: TE
G-F
, ch
rom
atog
raph
ic,
and
spec
troph
otom
etric
1 2 3 4 5 6 7 8 9 10
11
12
No.
N
o.
No.
N
o.
No.
N
o.
No.
N
o.
No.
N
o.
No.
N
o.
Sat
urat
ed H
ydro
carb
ons,
Per
cent
Cre
osot
e C
hrom
ato-
Sta
sse’
s R
icha
rds’
gr
aphy
re
sults
, per
-re
sults
, per
-(b
y wei
ght),
ce
nt b
y ce
nt b
y pe
rcen
t vo
lum
e1 vo
lum
e1
0.1
0.60
0.
40
.1
.16
.20
.1
.25
.40
.2
.08
.60
.4
.80
.70
2.0
—
—
.1
—
—
9.4
11.8
11
.6
9.0
—
—
16.9
—
—
2.9
—
—
7.
1 —
—
1 S
tass
e an
d R
icha
rds d
id n
ot st
atew
heth
erth
e re
sults
are
repo
rted
in p
erce
nt b
y vo
lum
e or
by
wei
ght.
The
auth
ors
of (1
8) a
ssum
e th
e re
-su
lts t
o be
rep
orte
d in
per
cent
by
volu
me.
Figu
re 5
.-S
ilica
gel
col
umn
chro
mat
ogra
phy
of c
oal-t
ar c
reos
ote
(18)
.
M 1
40 8
09
(41, 55) hydrogenation is used as an analytical tool for the quantitative conversion of aromatic rings into the corresponding naphthenes; this is the basis of a method of determining the percentage of aromatic carbon atoms in a fraction. The respective chromatograms in figure 5 show the expected, large shift in “aromaticity” of the oils.
In 1965, Committee P-3 (23) of AWPA considered the chromatographic procedure (16, 17) as one method for testing creosote-petroleum solutions for their content of saturated hydrocarbons. Because silica gel chromatography is a method capable of com-pletely separating the aromatic and saturated hydrocarbons in creosote and in creosote blends with coal tar, it provides the objective advantage of giving an estimate of the least desirable group of compounds, wholly in-dependent of source.
Six methods for petroleum hydrocarbon analysis by column chromatography have been described by ASTM (3); two are designed for use with high-boiling samples-dieselfuel oil and viscous oils used as rubber extenders. The method (7) for viscous oils is of particular interest to creosote analysis in that provision is made for separation of a sample into four frac-tions, all of which can be recovered separately and measured quantitatively. An adsorbent clay, in addition to silica gel, is used for this purpose. The method proposed for fuel oils (6) is essentially the same as that of Drisko and Hochman (17, 18), but with provision for recovery of the “aromatics” by desorption with a polar solvent mixture.
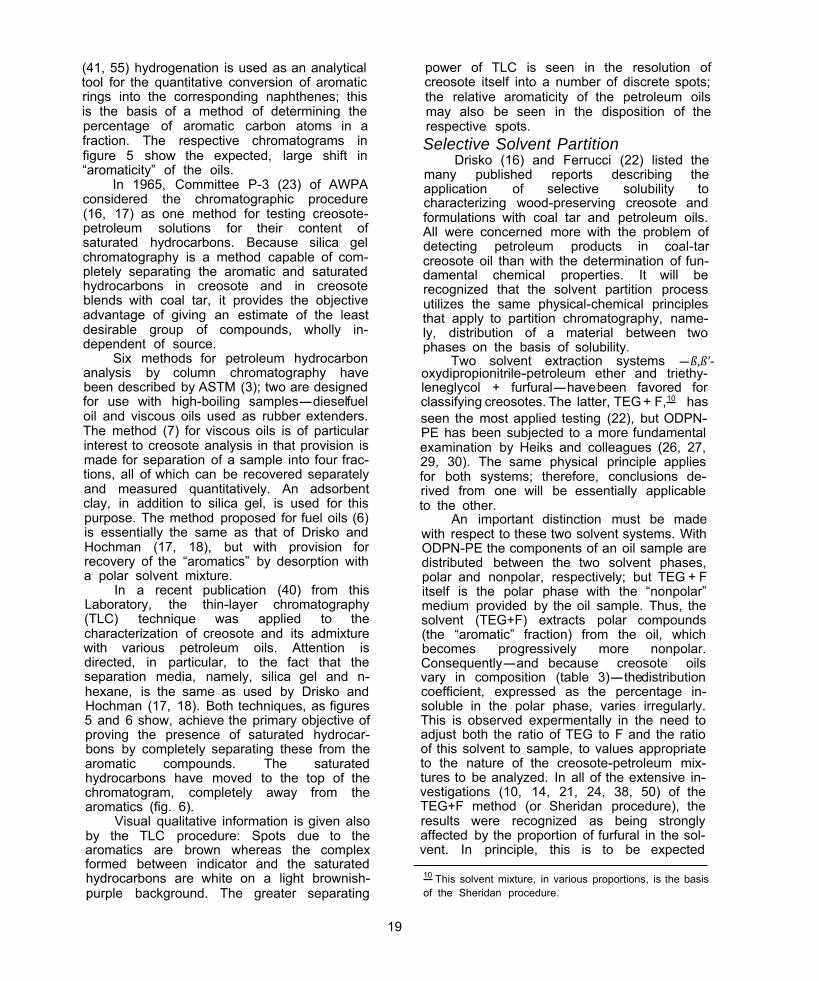
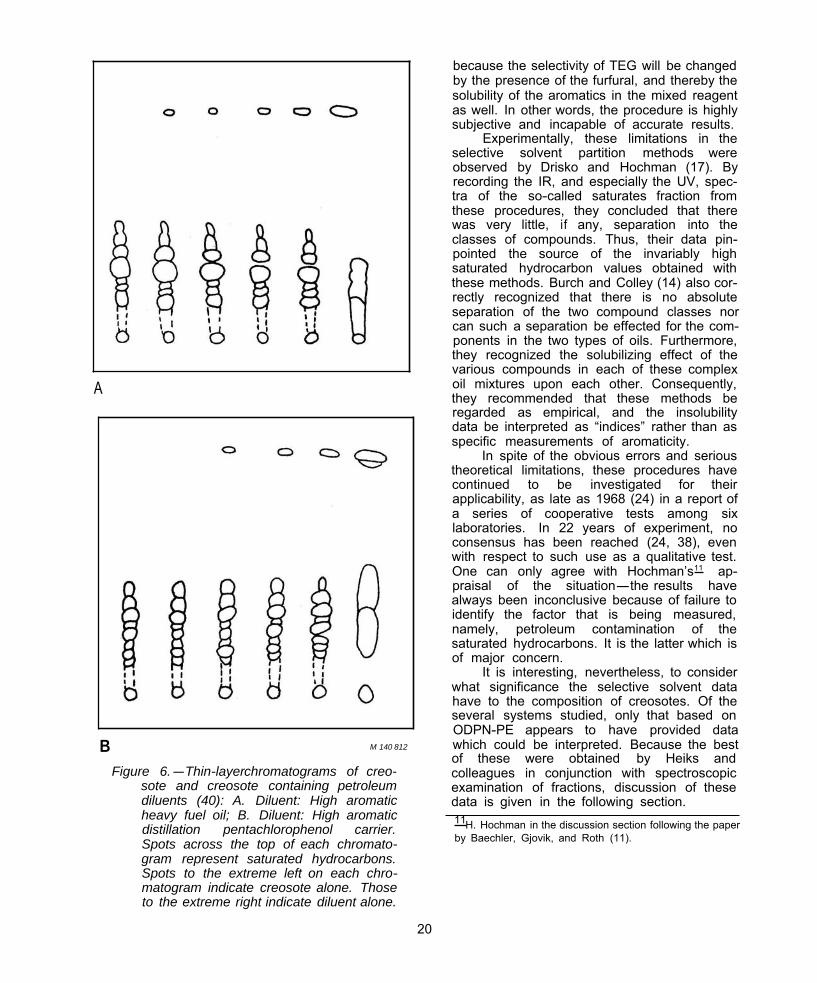
In a recent publication (40) from this Laboratory, the thin-layer chromatography (TLC) technique was applied to the characterization of creosote and its admixture with various petroleum oils. Attention is directed, in particular, to the fact that the separation media, namely, silica gel and n-hexane, is the same as used by Drisko and Hochman (17, 18). Both techniques, as figures 5 and 6 show, achieve the primary objective of proving the presence of saturated hydrocar-bons by completely separating these from the aromatic compounds. The saturated hydrocarbons have moved to the top of the chromatogram, completely away from the aromatics (fig. 6).
Visual qualitative information is given also by the TLC procedure: Spots due to the aromatics are brown whereas the complex formed between indicator and the saturated hydrocarbons are white on a light brownish-purple background. The greater separating
power of TLC is seen in the resolution of creosote itself into a number of discrete spots; the relative aromaticity of the petroleum oils may also be seen in the disposition of the respective spots. Selective Solvent Partition
Drisko (16) and Ferrucci (22) listed the many published reports describing the application of selective solubility to characterizing wood-preserving creosote and formulations with coal tar and petroleum oils. All were concerned more with the problem of detecting petroleum products in coal-tar creosote oil than with the determination of fun-damental chemical properties. It will be recognized that the solvent partition process utilizes the same physical-chemical principles that apply to partition chromatography, name-ly, distribution of a material between two phases on the basis of solubility.
Two solvent extraction systems -ß,ß'oxydipropionitrile-petroleum ether and triethy-leneglycol + furfural-havebeen favored for classifying creosotes. The latter, TEG + F,10 has seen the most applied testing (22), but ODPN-PE has been subjected to a more fundamental examination by Heiks and colleagues (26, 27, 29, 30). The same physical principle applies for both systems; therefore, conclusions de-rived from one will be essentially applicable to the other.
An important distinction must be made with respect to these two solvent systems. With ODPN-PE the components of an oil sample are distributed between the two solvent phases, polar and nonpolar, respectively; but TEG + F itself is the polar phase with the “nonpolar” medium provided by the oil sample. Thus, the solvent (TEG+F) extracts polar compounds (the “aromatic” fraction) from the oil, which becomes progressively more nonpolar. Consequently-and because creosote oils vary in composition (table 3)-thedistribution coefficient, expressed as the percentage in-soluble in the polar phase, varies irregularly. This is observed expermentally in the need to adjust both the ratio of TEG to F and the ratio of this solvent to sample, to values appropriate to the nature of the creosote-petroleum mix-tures to be analyzed. In all of the extensive in-vestigations (10, 14, 21, 24, 38, 50) of the TEG+F method (or Sheridan procedure), the results were recognized as being strongly affected by the proportion of furfural in the sol-vent. In principle, this is to be expected
10 This solvent mixture, in various proportions, is the basis of the Sheridan procedure.
19
A
B M 140 812
Figure 6.-Thin-layerchromatograms of creosote and creosote containing petroleum diluents (40): A. Diluent: High aromatic heavy fuel oil; B. Diluent: High aromatic distillation pentachlorophenol carrier. Spots across the top of each chromatogram represent saturated hydrocarbons. Spots to the extreme left on each chromatogram indicate creosote alone. Those to the extreme right indicate diluent alone.
because the selectivity of TEG will be changed by the presence of the furfural, and thereby the solubility of the aromatics in the mixed reagent as well. In other words, the procedure is highly subjective and incapable of accurate results.
Experimentally, these limitations in the selective solvent partition methods were observed by Drisko and Hochman (17). By recording the IR, and especially the UV, spec-tra of the so-called saturates fraction from these procedures, they concluded that there was very little, if any, separation into the classes of compounds. Thus, their data pin-pointed the source of the invariably high saturated hydrocarbon values obtained with these methods. Burch and Colley (14) also cor-rectly recognized that there is no absolute separation of the two compound classes nor can such a separation be effected for the com-ponents in the two types of oils. Furthermore, they recognized the solubilizing effect of the various compounds in each of these complex oil mixtures upon each other. Consequently, they recommended that these methods be regarded as empirical, and the insolubility data be interpreted as “indices” rather than as specific measurements of aromaticity.
In spite of the obvious errors and serious theoretical limitations, these procedures have continued to be investigated for their applicability, as late as 1968 (24) in a report of a series of cooperative tests among six laboratories. In 22 years of experiment, no consensus has been reached (24, 38), even with respect to such use as a qualitative test. One can only agree with Hochman’s11 ap-praisal of the situation-the results have always been inconclusive because of failure to identify the factor that is being measured, namely, petroleum contamination of the saturated hydrocarbons. It is the latter which is of major concern.
It is interesting, nevertheless, to consider what significance the selective solvent data have to the composition of creosotes. Of the several systems studied, only that based on ODPN-PE appears to have provided data which could be interpreted. Because the best of these were obtained by Heiks and colleagues in conjunction with spectroscopic examination of fractions, discussion of these data is given in the following section. 11H. Hochman in the discussion section following the paper by Baechler, Gjovik, and Roth (11).
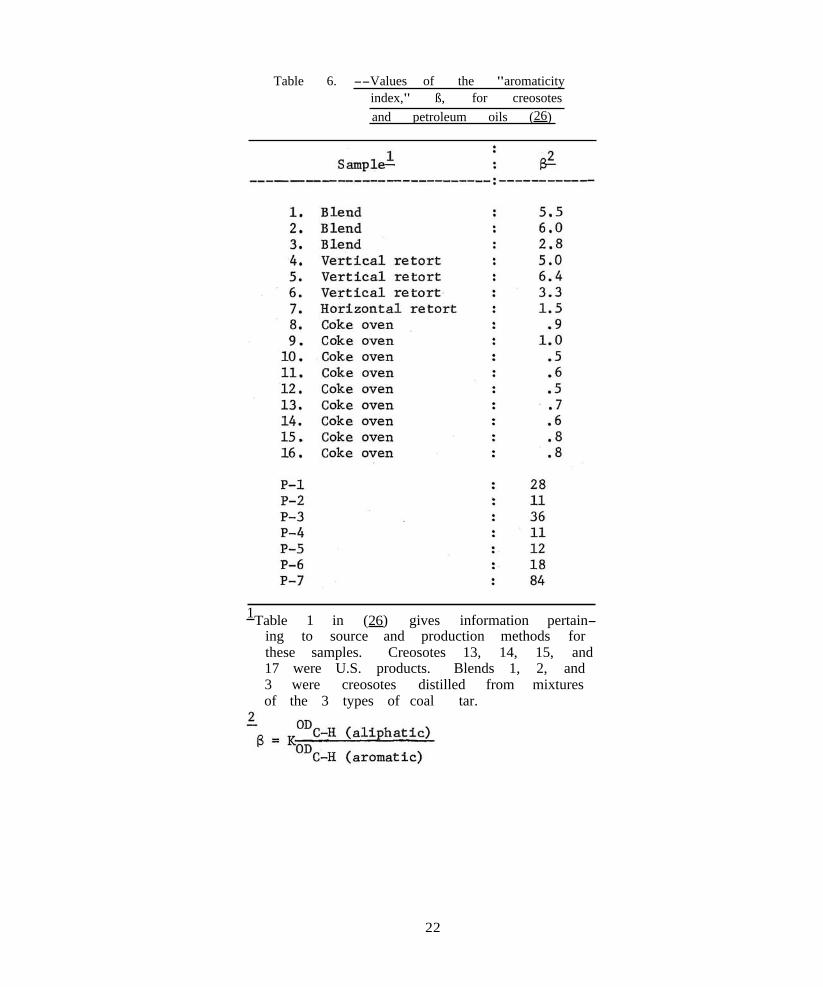
troscopy to study the fundamental chemical nature of creosote. His objective was to deter-mine whether, and how, creosote oils differed among each other and from the types of petroleum oils and derivatives used in ad-mixture with creosote oils. Although the spec-troscopic results were principally qualitative in nature, he evolved a procedure for evaluating the oils quantitatively in terms of an “aromaticity index,” ß. This index was defined (26) as the ratio of aliphatic C-H (i.e., CH2 + CH3) to aromatic C-H, where the concentra-tion of each structure was taken as propor-tional to optical density (OD). Thus,
OD ß = K C-H (aliphatic)
OD C-H (aromatic) and the more aromatic is the sample, the lower is the value of ß. This is illustrated by the data summarized in table 6 , where several creosotes are compared with petroleum oils.
The high ß values in the case of the petroleum oils indicate greater amounts of aliphatic subsitution on aromatic nuclei and/or free aliphatic materials in the oils. Had the samples been chromatographed first through a silica gel column to remove the saturated, aliphatic fraction, the ß values would have been more specific with respect to aromaticity of hybrid molecules such as that illustrated by figure 4. Drisko (15) used the method to analyze creosote extracted from marine pilings; but no relationship could be found between service life (of a creosoted pile) and the ß ratio of the extracted oil. Both in-vestigations show the value of IR in comparing different creosotes and the latter with petroleum oils.
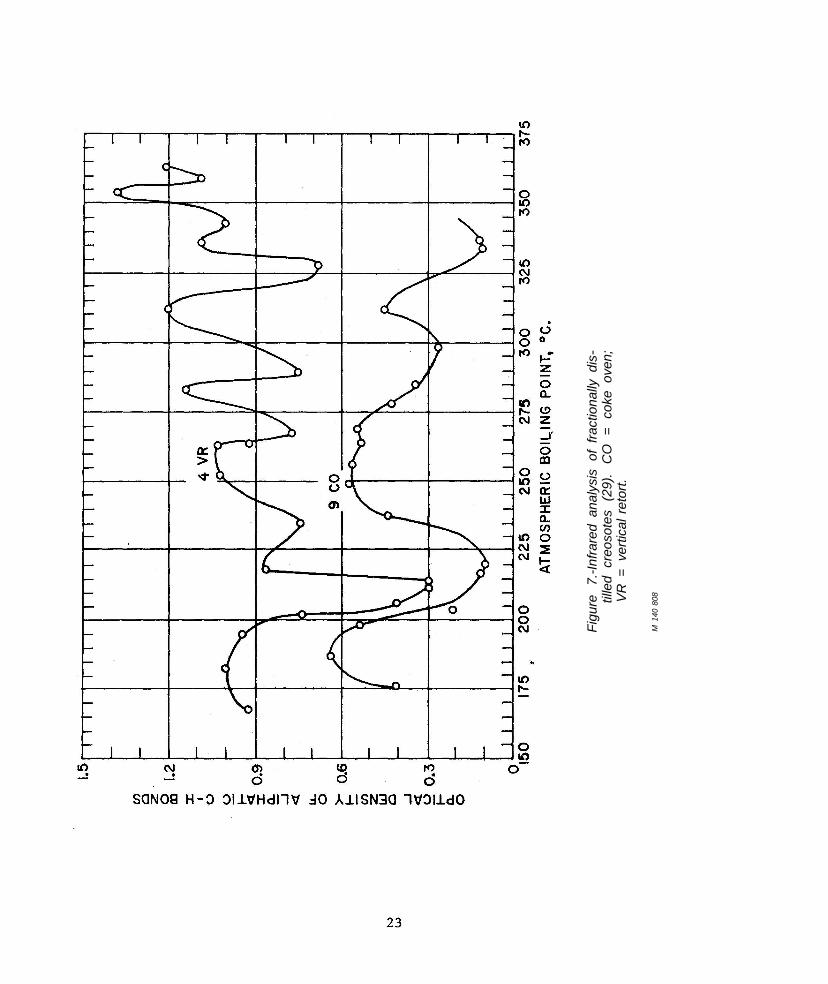
Heiks (26, 29) also fractionated some of the creosotes (table 6) by distillation and selective solvent extraction (ODPN-PE). The IR data for the composition of the extracted frac-tions showed that unsubstituted and slightly substituted aromatics concentrated in the polar, ODPN phase, but that the petroleum ether phase also contained aromatic carbon. Two creosotes, a vertical retort and a coke oven, were analytically distilled into closely cut fractions (1 pct by volume). The distribution of aliphatic C-H bonds as a function of at-mospheric boiling point is shown in figure 7. The wide fluctuations in optical density throughout all fractions point to the ubiquitous
occurrence of such substituents upon the aromatic compounds found in creosotes. Such evidence may be cited as an explanation for the fact that the ß ratio could not be related to service life-there is relatively little, or no, preferential loss from wood on the basis of carbon type, rather aromatic and nonaromatic compounds must tend to be removed in ap-proximately equal amounts with molecular weight the significant variable.
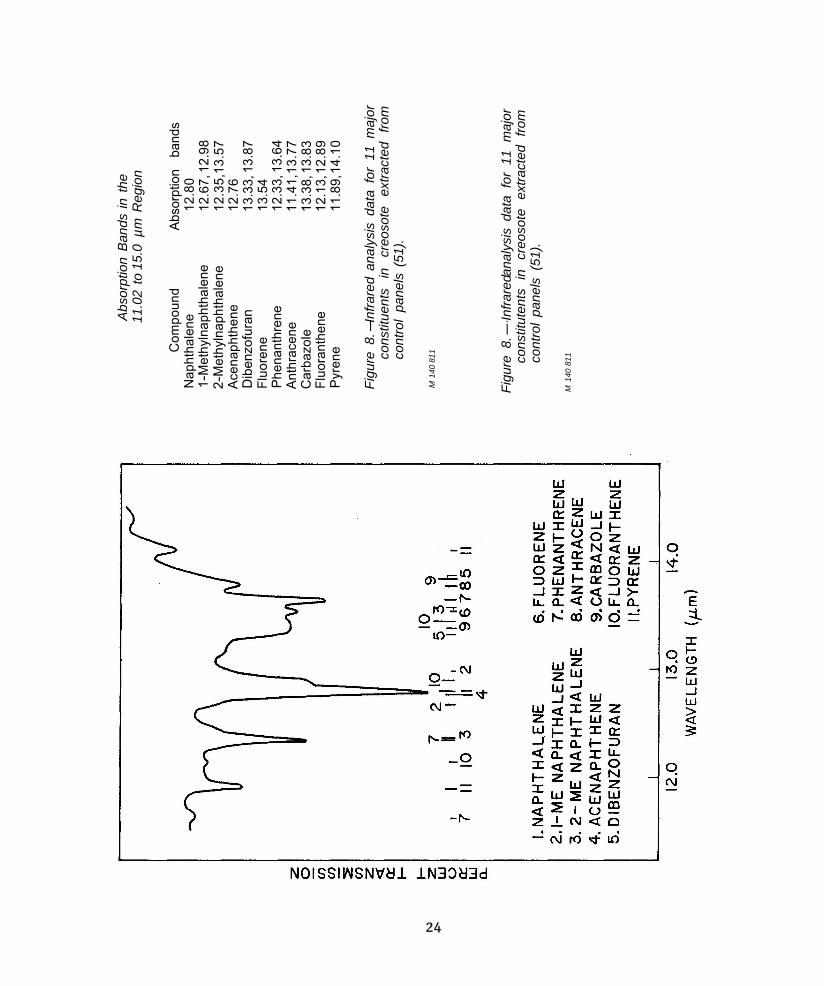
In the application of infrared spec-troscopy to analysis of whole creosotes, Sweeney et al. (51, 52) observed that the strongest and most characteristic bands oc-curred in the region of 11.0 to 14.0 µm. The strong absorption bands which they used for their analysis (51) were identified with 11 major compounds (fig. 8). More recently (24) it has been reported that creosotes absorb strongly also at wavelengths of 8.40, 16.10, and 21.05 µm in addition to those above.
In discussing the IR method, Sweeney et al. (52) point out an interesting effect which may be expected to be true for any very com-plex mixture in which the majority of con-stituents is present at very low concentrations. Except for the 11 major components (table 3), the remaining hundreds of compounds which comprise the rest of a creosote must each be present in amounts less than 1 percent. The structural effect of such a (residual) mixture is that of a neutral filter-thereare no discrete absorption bands. Obviously, petroleum oils must exhibit similar spectral properties. For either oil, major components will exhibit characteristic spectra above the background absorption. It will be apparent then that the ex-tent to which IR may be used to uniquely characterize an oil, or oils, will be a function of the number and kinds of major components present (as observed (51)). Beyond this point, various methods of concentration or separa-tion or both must precede spectroscopic ex-amination.
Heiks et al. (28) investigated the use of X-ray diffraction as a method for identifying chemical compounds in creosote oils. The technique appears to be best suited for the verification of pure compounds, in particular, ones which are very similar. It suffers from the restriction common to other analytical methods, namely, of being relative; that is, dif-fraction patterns must be compared with the patterns for known compounds in order to es-tablish an identity.
21
Table 6. --Values of the "aromaticity index," ß, for creosotes and petroleum oils (26)
1Table 1 in (26) gives information pertaining to source and production methods for these samples. Creosotes 13, 14, 15, and 17 were U.S. products. Blends 1, 2, and 3 were creosotes distilled from mixtures of the 3 types of coal tar.
22
Figu
re
7.-In
frare
d an
alys
is o
f fra
ctio
nally
dis
til
led
creo
sote
s (2
9).
CO
=
coke
ove
n;
VR
= v
ertic
al r
etor
t.
M 1
40 8
08
Com
poun
d N
apht
hale
ne
1 -M
ethy
lnap
htha
lene
2-
Met
hyln
apht
hale
ne
Acen
apht
hene
D
iben
zofu
ran
Fluo
rene
Ph
enan
thre
ne
Anth
race
ne
Car
bazo
le
Fluo
rant
hene
Py
rene
Abs
orpt
ion
Ban
ds in
the
11
.02
to 1
5.0
µm R
egio
n
Abso
rptio
n ba
nds
12.8
0 12
.67,
12.
98
12.3
5,13
.57
12.7
6 13
.33,
13.
87
13.5
4 12
.33,
13.
64
11.4
1,13
.77
13.3
8, 1
3.83
12
.13,
12.
89
11.8
9, 14
.10
Figu
re 8
.-In
frare
d an
alys
is d
ata
for
11 m
ajor
co
nstit
uent
s in
cr
eoso
te
extra
cted
fro
m
cont
rol
pane
ls (
51).
M 1
40 8
11
Figu
re 8
.--In
frare
dana
lysi
s da
ta f
or 1
1 m
ajor
co
nstit
uten
ts
in
creo
sote
ex
tract
ed
from
co
ntro
l pa
nels
(51
).
M 1
40 8
11
Gas Chromatography Creosote
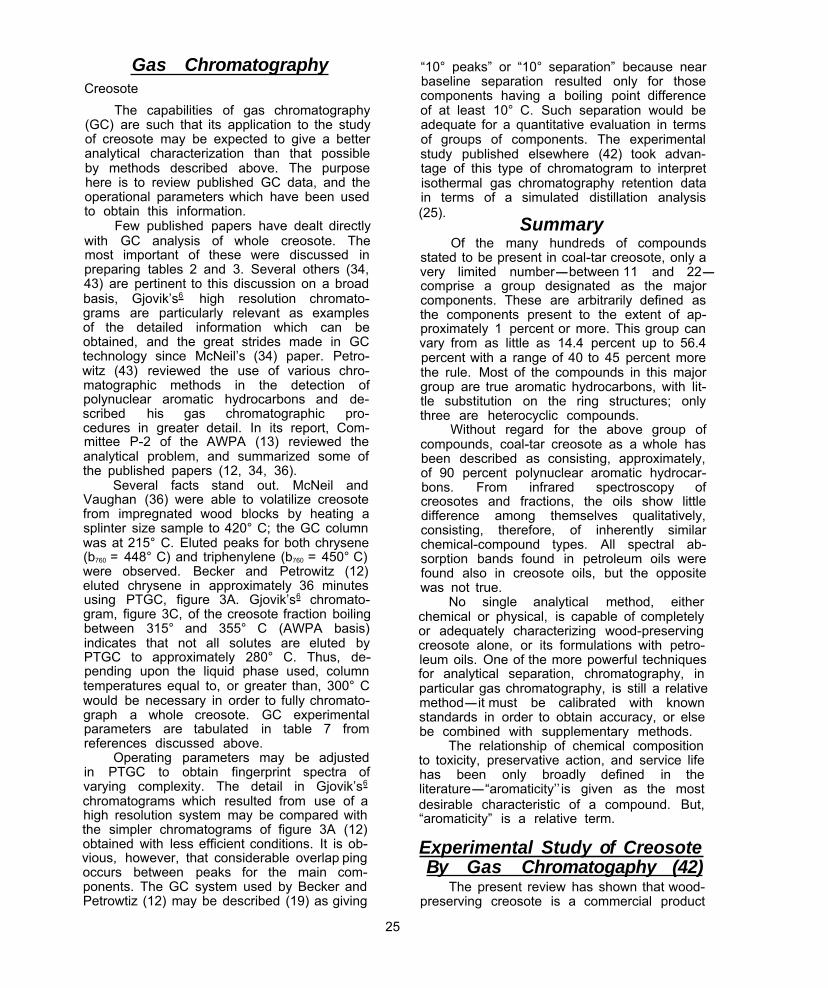
The capabilities of gas chromatography (GC) are such that its application to the study of creosote may be expected to give a better analytical characterization than that possible by methods described above. The purpose here is to review published GC data, and the operational parameters which have been used to obtain this information.
Few published papers have dealt directly with GC analysis of whole creosote. The most important of these were discussed in preparing tables 2 and 3. Several others (34, 43) are pertinent to this discussion on a broad basis, Gjovik’s6 high resolution chromato-grams are particularly relevant as examples of the detailed information which can be obtained, and the great strides made in GC technology since McNeil’s (34) paper. Petro-witz (43) reviewed the use of various chro-matographic methods in the detection of polynuclear aromatic hydrocarbons and de-scribed his gas chromatographic pro-cedures in greater detail. In its report, Com-mittee P-2 of the AWPA (13) reviewed the analytical problem, and summarized some of the published papers (12, 34, 36).
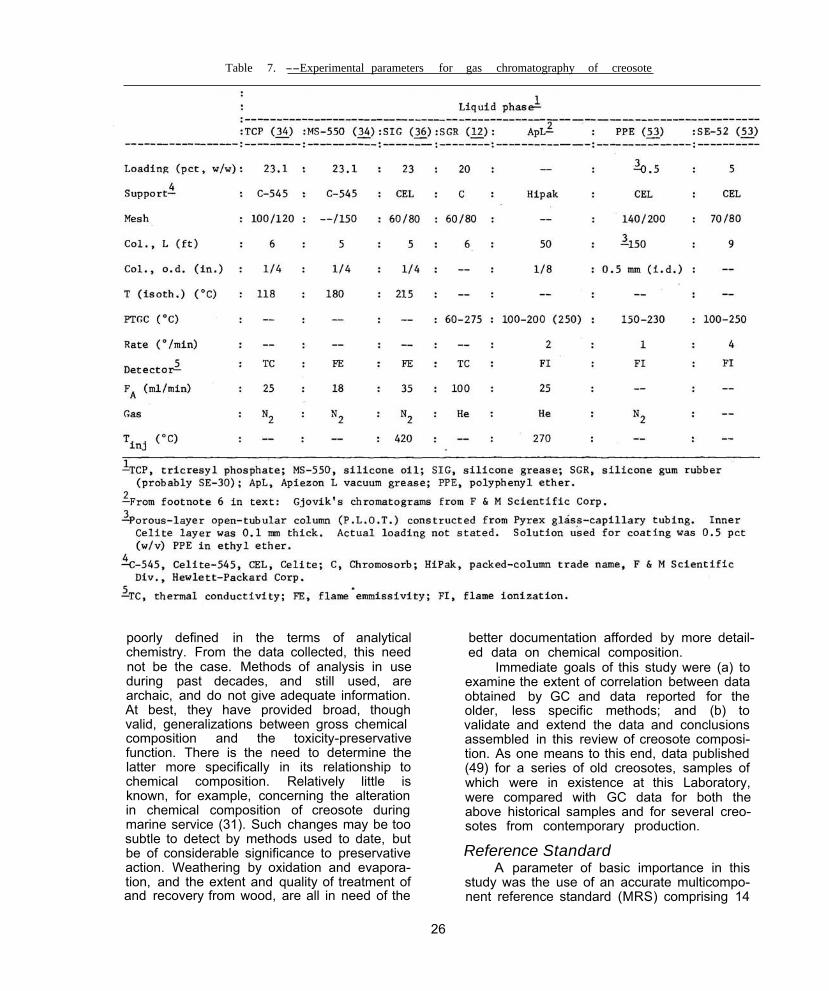
Several facts stand out. McNeil and Vaughan (36) were able to volatilize creosote from impregnated wood blocks by heating a splinter size sample to 420° C; the GC column was at 215° C. Eluted peaks for both chrysene (b760 = 448° C) and triphenylene (b760 = 450° C) were observed. Becker and Petrowitz (12) eluted chrysene in approximately 36 minutes using PTGC, figure 3A. Gjovik’s6 chromato-gram, figure 3C, of the creosote fraction boiling between 315° and 355° C (AWPA basis) indicates that not all solutes are eluted by PTGC to approximately 280° C. Thus, de-pending upon the liquid phase used, column temperatures equal to, or greater than, 300° C would be necessary in order to fully chromato-graph a whole creosote. GC experimental parameters are tabulated in table 7 from references discussed above.
Operating parameters may be adjusted in PTGC to obtain fingerprint spectra of varying complexity. The detail in Gjovik’s6
chromatograms which resulted from use of a high resolution system may be compared with the simpler chromatograms of figure 3A (12) obtained with less efficient conditions. It is ob-vious, however, that considerable overlap ping occurs between peaks for the main com-ponents. The GC system used by Becker and Petrowtiz (12) may be described (19) as giving
“10° peaks” or “10° separation” because near baseline separation resulted only for those components having a boiling point difference of at least 10° C. Such separation would be adequate for a quantitative evaluation in terms of groups of components. The experimental study published elsewhere (42) took advan-tage of this type of chromatogram to interpret isothermal gas chromatography retention data in terms of a simulated distillation analysis (25).
Summary Of the many hundreds of compounds
stated to be present in coal-tar creosote, only a very limited number-between 11 and 22-comprise a group designated as the major components. These are arbitrarily defined as the components present to the extent of ap-proximately 1 percent or more. This group can vary from as little as 14.4 percent up to 56.4 percent with a range of 40 to 45 percent more the rule. Most of the compounds in this major group are true aromatic hydrocarbons, with lit-tle substitution on the ring structures; only three are heterocyclic compounds.
Without regard for the above group of compounds, coal-tar creosote as a whole has been described as consisting, approximately, of 90 percent polynuclear aromatic hydrocar-bons. From infrared spectroscopy of creosotes and fractions, the oils show little difference among themselves qualitatively, consisting, therefore, of inherently similar chemical-compound types. All spectral ab-sorption bands found in petroleum oils were found also in creosote oils, but the opposite was not true.
No single analytical method, either chemical or physical, is capable of completely or adequately characterizing wood-preserving creosote alone, or its formulations with petro-leum oils. One of the more powerful techniques for analytical separation, chromatography, in particular gas chromatography, is still a relative method-it must be calibrated with known standards in order to obtain accuracy, or else be combined with supplementary methods.
The relationship of chemical composition to toxicity, preservative action, and service life has been only broadly defined in the literature-“aromaticity’’ is given as the most desirable characteristic of a compound. But, “aromaticity” is a relative term.
Experimental Study of Creosote By Gas Chromatogaphy (42)
The present review has shown that wood-preserving creosote is a commercial product
25
Table 7. --Experimental parameters for gas chromatography of creosote
poorly defined in the terms of analytical chemistry. From the data collected, this need not be the case. Methods of analysis in use during past decades, and still used, are archaic, and do not give adequate information. At best, they have provided broad, though valid, generalizations between gross chemical composition and the toxicity-preservative function. There is the need to determine the latter more specifically in its relationship to chemical composition. Relatively little is known, for example, concerning the alteration in chemical composition of creosote during marine service (31). Such changes may be too subtle to detect by methods used to date, but be of considerable significance to preservative action. Weathering by oxidation and evapora-tion, and the extent and quality of treatment of and recovery from wood, are all in need of the
better documentation afforded by more detail-ed data on chemical composition.
Immediate goals of this study were (a) to examine the extent of correlation between data obtained by GC and data reported for the older, less specific methods; and (b) to validate and extend the data and conclusions assembled in this review of creosote composi-tion. As one means to this end, data published (49) for a series of old creosotes, samples of which were in existence at this Laboratory, were compared with GC data for both the above historical samples and for several creo-sotes from contemporary production.
Reference Standard A parameter of basic importance in this
study was the use of an accurate multicompo-nent reference standard (MRS) comprising 14
26
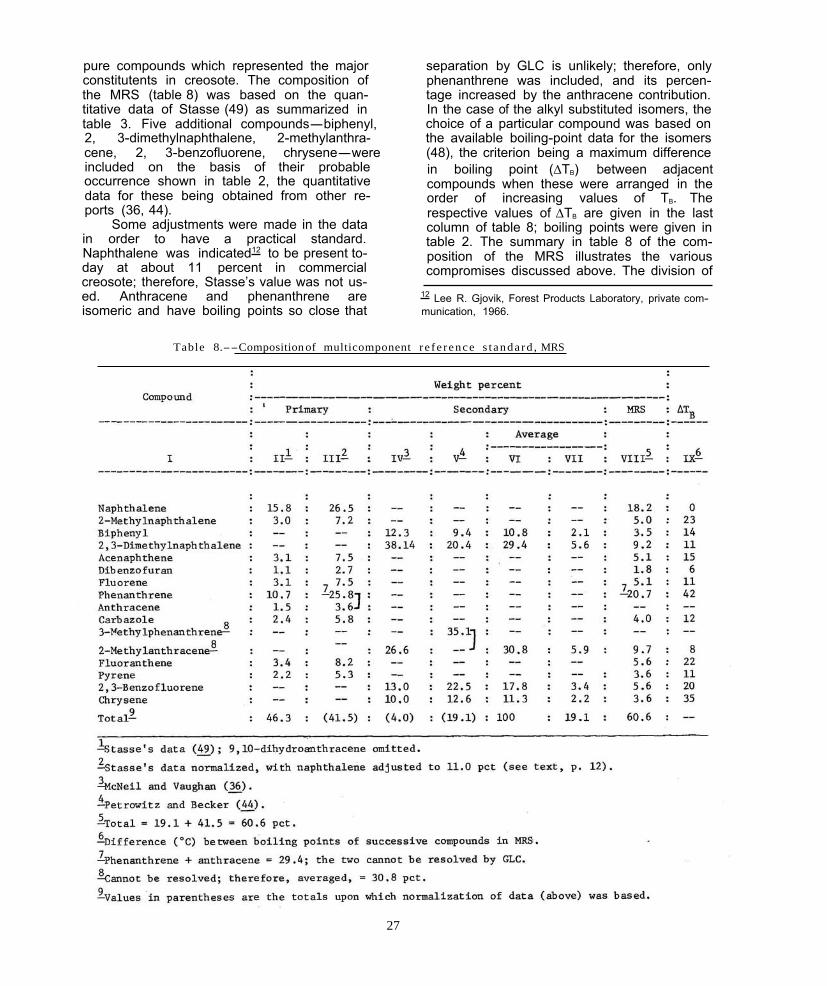
pure compounds which represented the major separation by GLC is unlikely; therefore, only constitutents in creosote. The composition of phenanthrene was included, the MRS (table 8) was based on the quan- tage increased by the anthracene contribution. titative data of Stasse (49) as summarized in In the case of the alkyl substituted isomers, the table 3. Five additional compounds-biphenyl, choice of a particular compound was based on 2, 3-dimethylnaphthalene, 2-methylanthra- the available boiling-point data for the isomers cene, 2, 3-benzofluorene, chrysene-were (48), the criterion being a maximum difference included on the basis of their probable in boiling point (∆TB) occurrence shown in table 2, the quantitative compounds when these were arranged in the data for these being obtained from other re- order of increasing ports (36, 44). respective values of ∆TB
Some adjustments were made in the data column of table 8; boiling points were given in in order to have a practical standard. table 2. The summary in table 8 of the com-Naphthalene was indicated12 to be present to- position of the MRS day at about 11 percent in commercial compromises discussed above. The division of creosote; therefore, Stasse’s value was not us-ed. Anthracene and phenanthrene are 12 Lee R. Gjovik, Forest Products Laboratory, private com-isomeric and have boiling points so close that munication, 1966.
Table 8.--Composition of multicomponent r e fe rence s t anda rd , MRS
and its percen-
between adjacent
values of TB. The are given in the last
illustrates the various
27
the MRS into two subgroups (Primary and later to be of convenience in the experimental Secondary) is somewhat arbitrary, though study (42). Thus, based on the quantitative guided in part by the fact that, of all published data used, the 14 components of the MRS were quantitative data, Stasse’s (49) represents the estimated to represent 60.6 (41.5 + 19.1) mostcomprehensiveand self-consistent found. percent of a whole creosote oil. The subdivision into two standards was found
Literature Cited 1. American Society for Testing and Materials
1958. Symposium on composition of petroleum oils. STP 224. Philadelphia, Pa.
2. 1965. Hydrocarbon analysis. A symposium. STP 389. Philadelphia, Pa.
3. 1968. Manual on hydrocarbon analysis. STP 332A. Philadelphia, Pa.
4. 1968. Analysis of viscous oils. Chap. III, p. 36. STP 332A. Philadelphia, Pa.
5. 1968. Carbon-type composition of insulating oils of petroleum origin. D 2140-66, p. 315
STP 332A. Philadelphia, Pa.
6. 1968. Proposed method of test, p. 538, STP 332A. Philadelphia, Pa.
7. 1968. Characteristic groups in rubber extender and processing oils by the precipitation
method. D 2007-65T, p. 294, STP 332A. Philadelphia, Pa.
8. American Wood-Preservers’ Association 1971. The AWPA Book of Standards. 1971 ed. Washington, D.C.
9. Andrews, J.W. 1952. Volatility of some compounds in creosote produced from high temperature tar. Proc.
Amer. Wood-Preservers’ Assoc. 48: 85-97.
10. Baechler, R.H., and Roth, H.G. 1962. Detection of petroleum in coal-tar creosote. I. A comparison of the TEG-F test with the
specific gravity test. U.S. Forest Prod. Lab. Rep. No. WP-59. Madison, Wis.
11. , Gjovik, L.R., and Roth, H.G. 1969. Studies of several methods for determining suitability of creosote for marine use. Proc.
Amer. Wood-Preservers’ Assoc. 65: 16.
12. Becker, G., and Petrowitz, H.J. 1964. Zur frage der Teerölabgabe aus Leitungsmasten (“On the question of bleeding of
creosote from utility poles”). Holz-Zentralblatt 90(156): 2628.
13. Best C.W. 1967. Creosote and creosote-coal tar solutions. Proc. Amer. Wood-Preservers’ Assoc. 6 3
108-124; rep. of Comm. P-2, appendix B, p. 119.
14. Burch, J.E., and Colley, R.H. 1961. A new method for characterizing mixtures of creosote and petroleum oils. Forest Prod.
J. 11(4): 197.
15. Drisko, R.W. 1962. Analysis of creosote by infrared spectroscopy. U.S. Naval Civ. Eng. Lab. Tech. Rep.
R-198. Published in Forest Prod. J. 13(4): 156 (1963).
28
16. 1963. Creosote analysis by the TEG-F, chromatographic, and spectrophotometric methods.
U.S. Naval Civ. Eng. Lab. Tech. Rep. R-243. June 13. Published in Forest Prod. J. 14(3): 119 (1964).
17. , and Hochman, H. 1960. A chromatographic method for the separation of saturated hydrocarbons from creosote.
Corrosion 16(8): 405t.
18. , and Hochman, H. 1960. Symposium on treated wood for marine use. Amer. Soc. for Testing and Materials, p. 22,
STP 275.
19. Eggertsen, F.T., Groennings, S., and Holst, J.J. 1960. Analytical distillation by GC programed temperature operation. Anal. Chem. 32(8): 904.
20. Erickson, G.L. 1960, Recent developments on creosote. Proc. Amer. Wood-Preservers’ Assoc. 56: 138.
21. Ferrucci, A.P. 1962. Proc. Amer. Wood-Preservers’ Assoc. 58: 135-137. Rep. of Comm. P-3.
22. 1964. Proc. Amer. Wood-Preservers’ Assoc. 60: 151-153. Rep. of Comm. P-3.
23. 1965. Proc. Amer. Wood-Preservers’ Assoc. 61: 56-58. Rep. of Comm. P-3.
24. 1968. Proc. Amer. Wood-Preservers’ Assoc. 64: 148. Rep. of Comm. P-3.
25. Harris, W.E., and Habgood, H.W. 1966. Programed temperature gas chromatography. Chap. 9, p. 266. John Wiley and Sons,
Inc., New York, N.Y.
26. Heiks, R.E. 1952. Investigation of the fundamental characteristics of creosote oils. I. Preliminary studies.
Proc. Amer. Wood-Preservers’ Assoc. 48: 53-80.
27. , Blum, S.E., and Burch, J.E. 1953. A method for the detection of petroleum products in a coal-tar creosote oil. Proc. Amer.
28.
29. , Blum, S.E., and Burch, J.E.
Wood-Preservers’ Assoc. 49: 26-37.
, Blum, S.E., and Burch, J.E. 1953. Investigation of the fundamental characteristics of creosote oils; A method of identifica-
tion . . . through . . . 2, 4, 7-trinitrofluorene complexes. Proc. Amer. Wood-Preservers’ Assoc. 49: 18-24.
1954. The development of a new solvent extraction method for characterizing coal-tar creosotes and petroleum derivatives and its application in wood preservation. Rec. Ann. Conv. Brit. Wood-Preserving Assoc., pp. 123-145.
30. , Blum, S.E., Burch, J.E., and Jentgen, R.L. 1955. Rapid solvent extraction method for detecting admixture of petroleum or petroleum
derivatives and coal-tar creosote. Proc. Amer. Wood-Preservers’ Assoc. 51: 18-25.
31. Hochman, H. 1967. Creosoted wood in a marine environment-a summary report. Proc. Amer. Wood-
Preservers’ Assoc. 63: 138.
32. International Union of Pure and Applied Chemistry 1960. Definitive rules for nomenclature of organic chemistry. J. Amer. Chem. SOC. 82: 5545.
33. McNeil, D. 1952. Some notes on the chemical composition of coal-tar creosote. Rec. Ann. Conv. Brit.
Wood-Preserving Assoc., pp. 147-161.
29
34. 1959. Further studies on the composition of wood preserving creosote. Rec. Ann. Conv. Brit.
Wood-Preserving Assoc., pp. 136-150.
35. 1969. Encyclopedia of Chemical Technology, 2d ed., vol. 19, p. 653. Intersci. Publ., New York
N.Y.
36. , and Vaughan, G.A. 1964. The identification and estimation of organic preservative in timber. Rec. Ann. Conv. Brit.
Wood-Preserving Assoc., pp. 3-24.
37. Martin, S.W. 1949. Characterization of creosote oils. Proc. Amer. Wood-Preservers’ Assoc. 45: 100.
38. Mayfield, P.B. 1950. Analysis of creosote-petroleum solutions used in wood preserving. Proc. Amer. Wood-
Preservers’ Assoc. 46: 62-67.
39. 1951. Toxic elements of high temperature coal-tar creosote. Proc. Amer. Wood-Preservers’
Assoc. 47: 62-85.
40. Moore, W.E., Effland, M.J., and Roth, H.G. 1968. Detection of petroleum oil diluents in coal-tar creosote by thin-layer chromatography.
J. Chromatogr. 38: 522.
41. Nes, H. van, and Westen, H.A. van 1951. Aspects of the constitution of mineral oils. Elsevier, N.Y.
42. Nestler, F.H. Max 1974. Characterization of wood-preserving coal-tar creosote by gas-liquid chromatography.
Anal. Chem. 46(1):46.
43. Petrowitz, H.J. 1964. Uber den Nachweis mehrkerniges aromatisches kohlen-wasserstoffe mit hilfe chro-