53
The Climate of Malta: statistics, trends and analysis 1951-2010 Charles Galdies National Statistics Office, Malta 2011
The Climate of Malta: statistics, trends and analysis
1951-2010
Charles Galdies
National Statistics Office, Malta 2011
Published by the
National Statistics Office Lascaris
Valletta, VLT2000 Malta
Tel.: (+356) 25997000 Fax: (+356) 25997205 e-mail: [email protected]
http://www.nso.gov.mt
CIP Data The Climate of Malta: statistics, trends and analysis, 1951-2010. – Valletta: National Statistics Office, 2011 viii, 45p. ISBN: 978-99957-29-19-6 (print) 978-99957-29-20-2 (online) For further information, please contact: Unit B4: Environment and Resources Directorate B: Business Statistics National Statistics Office Lascaris Valletta VLT2000 Malta Tel: (+356) 25997309 NSO publications are available from: Unit D2: External Cooperation and Communication Directorate D: Resources and Support Services National Statistics Office Lascaris Valletta VLT2000 Malta Tel: (+356) 25997219 Fax: (+356) 25997205 ______________________________________
Printed at the Government Printing Press
Cover image: Gozo Cliffs. Malta Tourism Authority (www.visitmalta.com); Clive Vella.

Acknowledgements
This work is based on the observations conducted throughout the years by the Malta Airport MetOffice. The involvement of all staff engaged by the MetOffice since its establishment at Luqa Airport is therefore duly recognised. Acknowledgements are also due to the staff members of the National Statistics Office for their cooperation and commitment to the processing of this book from inception to publication.
The Malta Airport MetOffice makes effective use of its observations by monitoring current weather patterns and their rate of change. It also monitors the variability of the local climate, especially on a monthly and annual timescale, so as to build local climate statistics. The vast increase in the flow of data and data management has become a central issue for the MetOffice in order to make better weather forecasts. As it strives to gather more measurements, the collection and quality control procedures are becoming important components of the whole data management exercise. Increased effort is being devoted to making the most effective use of the available resources of data and to developing new methods to improve the system. The Malta Airport MetOffice is Malta’s Official Weather Service, accredited to the World Meteorological Organisation, and ISO 9001:2008 certified. Constantly updated information direct from seven automatic weather stations around Malta and Gozo, together with information from the Airport weather station, a five-day forecast, a detailed and constantly updated three-day forecast for mariners, the UV index, and Satellite images are available online: www.maltairport.com/weather. A monthly newsletter is also available online.
The National Statistics Office collects data on a wide range of social, economic and environmental topics, in response to local and international obligations. These data are compiled according to the latest European standards and are disseminated by means of news releases and publications both in print and electronic format. Information provided by private individuals and entities is treated as strictly confidential, and is only used for the compilation of statistical reports in aggregated format.
CONTENTS
Page
Foreword vii
1.0 Malta’s climate within a geographical context 3
2.0 Malta’s climate norm 3
2.1 Ambient air temperature 4
2.2 Precipitation 8
2.3 Atmospheric pressure 12
2.4 Relative humidity 13
2.5 Thunderstorms and hail 14
2.6 Fog 15
2.7 Cloud cover 15
2.8 Duration of bright sunshine 16
2.9 Surface wind speed, wind direction and gale events 17
2.10 Wind direction 19
3.0 Malta’s climate anomaly trends 23
3.1 Statistical analysis and the trend anomaly diagram 23
3.2 Trends in the ambient air temperature 24
3.3 Trends in precipitation 31
3.4 Trends in sea level pressure 33
3.5 Trends in wind behaviour 35
3.6 Trends in cloud cover 36
4.0 Remarks 38
4.1 Discontinuities in climate trends 38
4.2 Statistical analysis of climate data 39
4.3 Future research 39
Appendix 1 41
References 45

Foreword Statistics are evolving into a vital tool of modern professional, political and business practice. In order to keep abreast of these developments, the National Statistics Office (NSO) is investing its resources in the coverage of several aspects of Maltese life that complement its activities in traditional statistical domains. It is in this context that the NSO is issuing a publication on climate statistics which should not only be useful for observers of climate change, but also interesting to the general public. The scope of this publication is twofold: to describe the observed climatological data and to make inferences from the data that may assist users of these data. Ranging from ambient air temperature and precipitation, to atmospheric pressure and relative humidity, the statistics found in this publication afford a glimpse of how this Central Mediterranean island’s climate has changed in the recent past. It is evident that Malta’s climate is affected by its geographical location and its size. Both Sicily and the Tunisian peninsula, together with prevailing winds, come into play in the Central Mediterranean region. The surrounding sea also has a seasonal warming or cooling influence. The first part of this publication focuses on Malta’s climate within this geographical context. The second part deals with Malta’s climate anomaly trends and possibly related socio-economic impacts. This analysis compares the weather patterns observed during the period 1951-2010 with Malta’s standard climate and indicates areas where the correlation is strong or weak. This publication should also be seen in the context of the broader Europe 2020 strategy on combating climate change within and outside the EU, by having the right statistics at hand to be able to measure the effectiveness of climate change policies and strategies. I would like to thank Dr Charles Galdies from the Malta Airport MetOffice for this research, together with George Said, Jeffrey Galea and Elizabeth Pizzuto from the NSO for their time and effort. Michael Pace Ross Director General September 2011
vii


1
Malta’s climate within a geographical context

1.0 MALTA’S CLIMATE WITHIN A GEOGRAPHICAL CONTEXT Malta’s climate can be described in the context of the topography of the Mediterranean basin where the flow of the lower atmosphere into the basin occurs mainly through mountain gaps, except over the southern shores east of Tunisia. The seasonal features of the Mediterranean can be traced from the motion and development of the pressure systems over the Atlantic, Eurasia and Africa. While the Mediterranean spring is often a period of indecisive weather, summer is characterised by the intensification of the Azores High which tends to stably extend up to the Central Mediterranean, giving general weather conditions consisting of light surface winds ranging from the northwest to northeast. Autumn is relatively short and leads to wintry conditions in a fairly decisive and quick way. During this season Atlantic depressions move eastwards across northern Europe into the Mediterranean bringing with them waves of cold air. In its path, this cold air comes into contact with warm moist air causing vertical instability, the development of vigorous depressions, rainfall and frequent gales. From time to time the eastward march of travelling depressions is interrupted by cold air coming from the Arctic via the Norwegian Sea or Russia. This great thermal contrast leads to very active depressions. In the Central Mediterranean region both Sicily and the Tunisian peninsula may play an important part on the local weather. Under certain prevailing conditions Sicily can act as a barrier against strong low-level northerly winds. This Italian island can also create local instabilities due to land heating effects or heat lows which may be advected towards the Maltese Islands depending on the prevailing winds. Transient North African low pressure systems have the potential to produce strong winds over the Central Mediterranean. When for example North African lows occur south of the Atlas Mountains, strong easterly to southeasterly winds are likely over the Central Mediterranean resulting in high seas. The presence of the surrounding water mass shapes significantly the climate of the Maltese Islands. The general weather is often cooler and more humid than what is experienced in inland areas of larger land masses. The high thermal capacity of the sea also reduces large fluctuations in the ambient temperature of the islands. But the presence of surrounding warm waters during the end of the summer season is a source of major weather instability when colder air migrates into the Central Mediterranean, thus creating areas with heavy thunderstorms and intense precipitation. Advances of continental tropical air into the Central Mediterranean after a cold spell can give rise to active warm fronts, sometimes producing very active cumulonimbus clouds, copious rainfall and thunderstorm over the Maltese Islands. A period of sirocco in the Central Mediterranean, sometimes lasting for many days, often follows the first autumnal invasion of cold air. 2.0 MALTA’S CLIMATE NORM The description that follows is based on the long-term averages of a number of climatic parameters that have been continuously observed at Luqa Airport by the Malta Airport MetOffice (Galdies, 2010). In view of the lengthy time series during which observations were made from this site, Luqa Airport has long been defined as the reference point for Malta’s climatological data (Station number 16597).
3
According to the World Meteorological Organisation (WMO), climate variables must be processed over agreed uniform periods so as to ensure comparability between data collected at weather stations all over the world as well as to provide a long-term reference value or "normal" with which shorter-term (e.g. monthly weather statistics) data can be compared. For a selected number of their climate stations, WMO Member States prepare climatological normals according to the technical regulations issued by WMO, i.e. as period averages computed for a uniform and relatively long period comprising at least three consecutive ten-year periods (Folland et al., 1990). The standard climate normals used by this document are based on the period 1961-1990 and are Malta’s official reference standard climate norm. The following climate variables are presented in this publication:
ambient air temperature;
precipitation;
atmospheric pressure;
relative humidity;
thunder and hail;
fog events;
cloud cover;
duration of bright sunshine;
winds and gales.
A detailed explanation of each of these variables is beyond the scope of this document and readers are encouraged to refer to general meteorology sources of information. 2.1 Ambient air temperature The climate normals related to temperature are based on the following weather variables: (1) the daily mean temperature, (2) the daily maximum temperature, (3) the night minimum temperature, and (4) the grass-height minimum temperature. At Luqa Airport standardised instrumentation used to measure the air temperature has changed with time, ranging from dedicated thermometers for the measurement of the maximum and minimum air temperatures housed in appropriate screens, to calibrated shielded thermocouples mounted on masts at standard height. Table 1 shows a summary of statistics for the climatic mean temperature. Between the period 1961-1990, the average annual temperature was 18.6 oC and varied from 17.9 °C to 19.7 °C. Figure 1 shows a plot of the monthly means during this same period with the temperature ranging from 12.4 oC (during the winter period) to 26.3 oC (during the summer period).
4
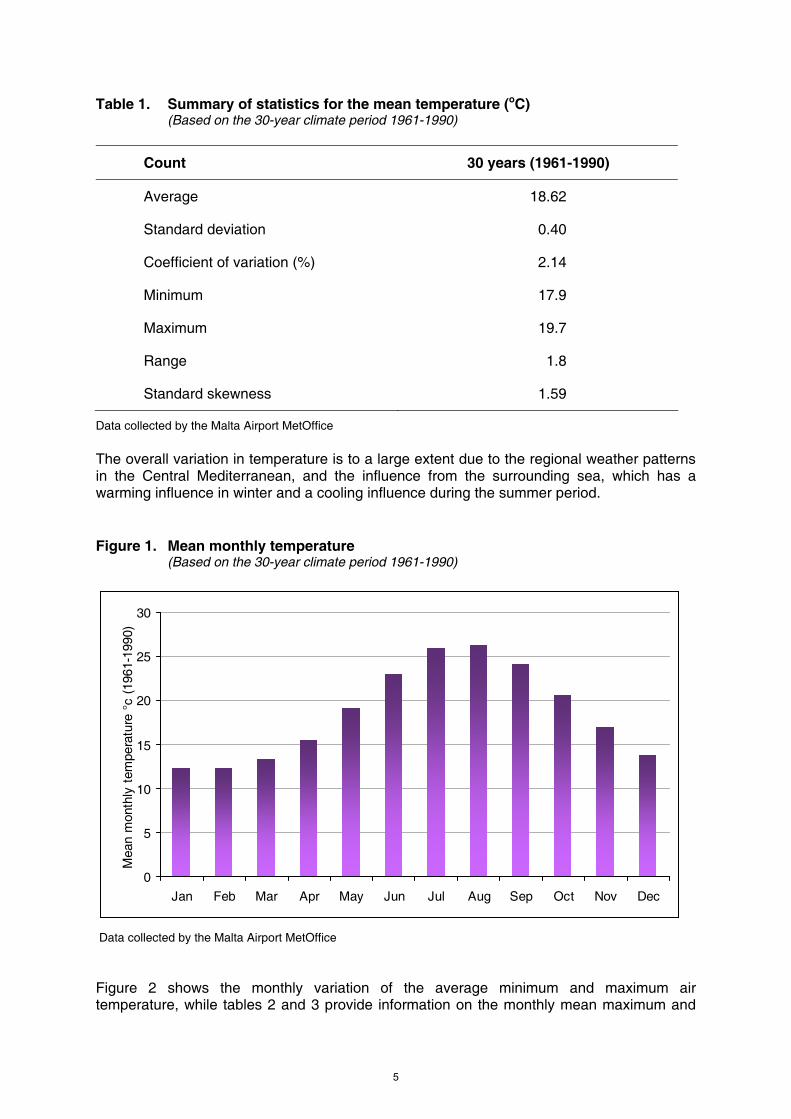
Table 1. Summary of statistics for the mean temperature (oC) (Based on the 30-year climate period 1961-1990)
Count 30 years (1961-1990)
Average 18.62
Standard deviation 0.40
Coefficient of variation (%) 2.14
Minimum 17.9
Maximum 19.7
Range 1.8
Standard skewness 1.59
Data collected by the Malta Airport MetOffice The overall variation in temperature is to a large extent due to the regional weather patterns in the Central Mediterranean, and the influence from the surrounding sea, which has a warming influence in winter and a cooling influence during the summer period. Figure 1. Mean monthly temperature (Based on the 30-year climate period 1961-1990)
0
5
10
15
20
25
30
Jan Feb Mar Apr May Jun Jul Aug Sep Oct Nov Dec
Mea
n m
onth
ly t
empe
ratu
re °
c (1
961-
1990
)
Data collected by the Malta Airport MetOffice Figure 2 shows the monthly variation of the average minimum and maximum air temperature, while tables 2 and 3 provide information on the monthly mean maximum and
5
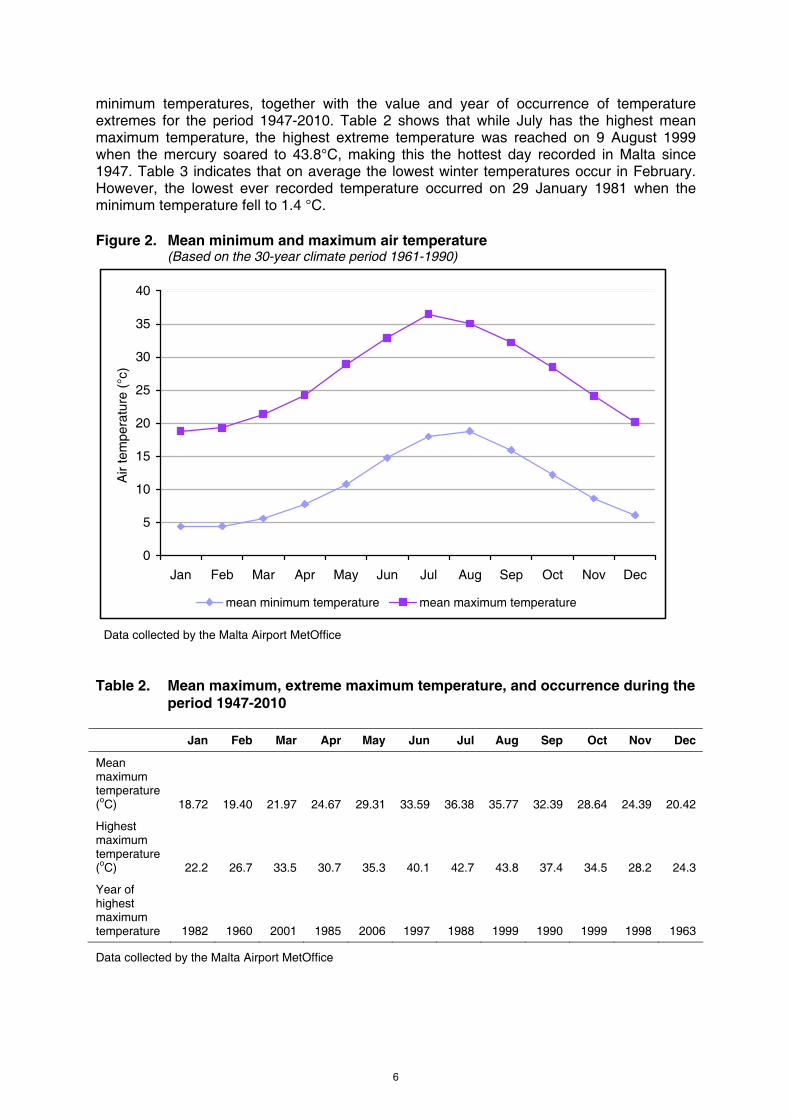
minimum temperatures, together with the value and year of occurrence of temperature extremes for the period 1947-2010. Table 2 shows that while July has the highest mean maximum temperature, the highest extreme temperature was reached on 9 August 1999 when the mercury soared to 43.8°C, making this the hottest day recorded in Malta since 1947. Table 3 indicates that on average the lowest winter temperatures occur in February. However, the lowest ever recorded temperature occurred on 29 January 1981 when the minimum temperature fell to 1.4 °C. Figure 2. Mean minimum and maximum air temperature (Based on the 30-year climate period 1961-1990)
0
5
10
15
20
25
30
35
40
Jan Feb Mar Apr May Jun Jul Aug Sep Oct Nov Dec
Air
tem
pera
ture
(°c
)
mean minimum temperature mean maximum temperature
Data collected by the Malta Airport MetOffice Table 2. Mean maximum, extreme maximum temperature, and occurrence during the
period 1947-2010 Jan Feb Mar Apr May Jun Jul Aug Sep Oct Nov Dec
Mean maximum temperature (oC) 18.72 19.40 21.97 24.67 29.31 33.59 36.38 35.77 32.39 28.64 24.39 20.42
Highest maximum temperature (oC) 22.2 26.7 33.5 30.7 35.3 40.1 42.7 43.8 37.4 34.5 28.2 24.3
Year of highest maximum temperature 1982 1960 2001 1985 2006 1997 1988 1999 1990 1999 1998 1963
Data collected by the Malta Airport MetOffice
6
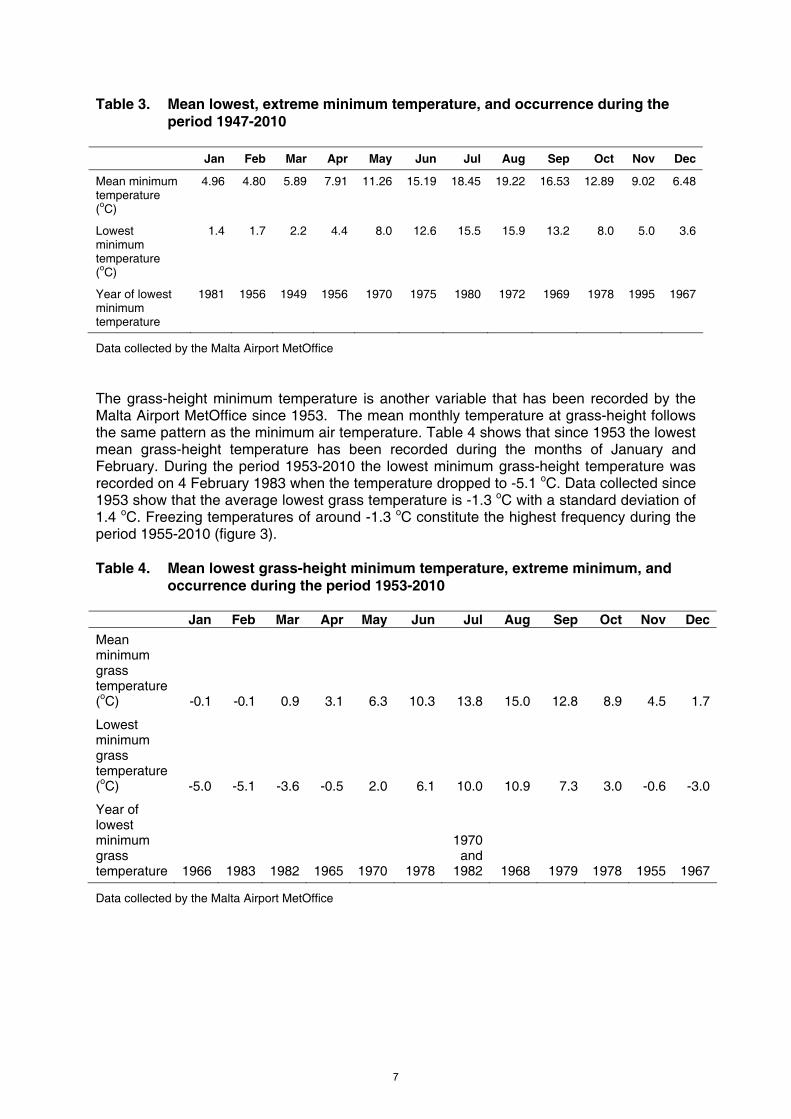
Table 3. Mean lowest, extreme minimum temperature, and occurrence during the period 1947-2010
Jan Feb Mar Apr May Jun Jul Aug Sep Oct Nov Dec
Mean minimum temperature (oC)
4.96 4.80 5.89 7.91 11.26 15.19 18.45 19.22 16.53 12.89 9.02 6.48
Lowest minimum temperature (oC)
1.4 1.7 2.2 4.4 8.0 12.6 15.5 15.9 13.2 8.0 5.0 3.6
Year of lowest minimum temperature
1981 1956 1949 1956 1970 1975 1980 1972 1969 1978 1995 1967
Data collected by the Malta Airport MetOffice The grass-height minimum temperature is another variable that has been recorded by the Malta Airport MetOffice since 1953. The mean monthly temperature at grass-height follows the same pattern as the minimum air temperature. Table 4 shows that since 1953 the lowest mean grass-height temperature has been recorded during the months of January and February. During the period 1953-2010 the lowest minimum grass-height temperature was recorded on 4 February 1983 when the temperature dropped to -5.1 oC. Data collected since 1953 show that the average lowest grass temperature is -1.3 oC with a standard deviation of 1.4 oC. Freezing temperatures of around -1.3 oC constitute the highest frequency during the period 1955-2010 (figure 3). Table 4. Mean lowest grass-height minimum temperature, extreme minimum, and
occurrence during the period 1953-2010 Jan Feb Mar Apr May Jun Jul Aug Sep Oct Nov Dec
Mean minimum grass temperature (oC) -0.1 -0.1 0.9 3.1 6.3 10.3 13.8 15.0 12.8 8.9 4.5 1.7
Lowest minimum grass temperature (oC) -5.0 -5.1 -3.6 -0.5 2.0 6.1 10.0 10.9 7.3 3.0 -0.6 -3.0
Year of lowest minimum grass temperature 1966 1983 1982 1965 1970 1978
1970 and
1982 1968 1979 1978 1955 1967
Data collected by the Malta Airport MetOffice
7
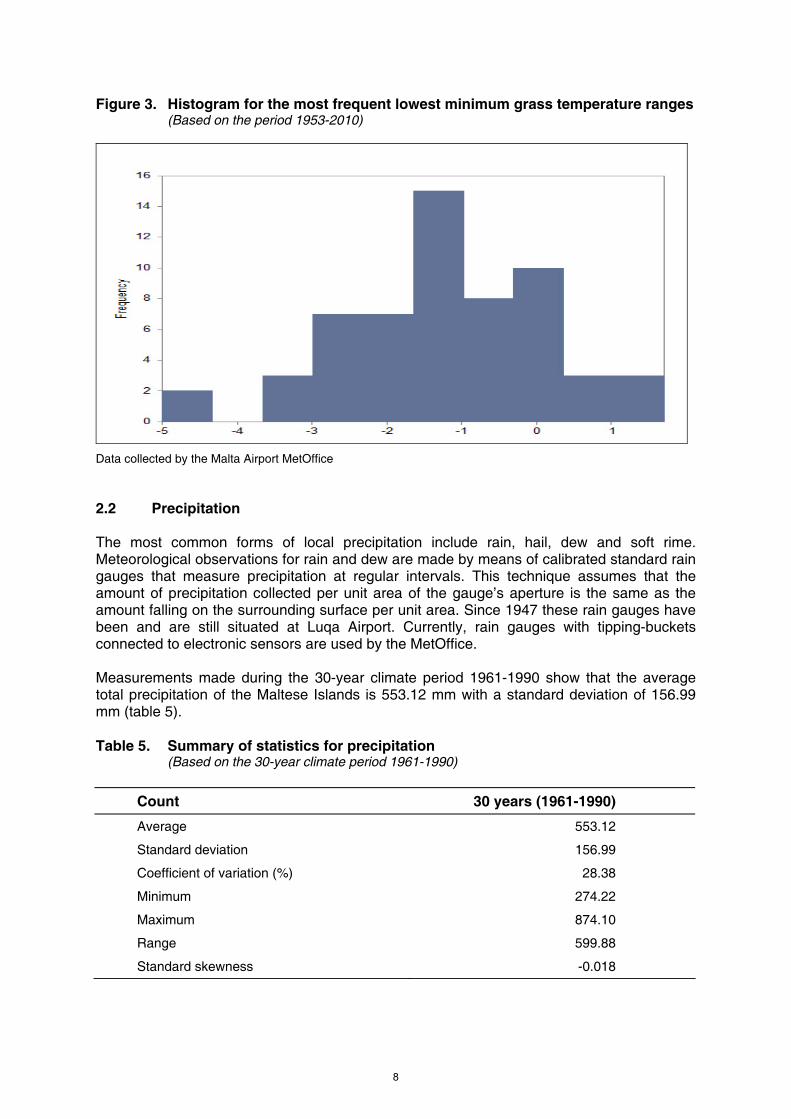
Figure 3. Histogram for the most frequent lowest minimum grass temperature ranges (Based on the period 1953-2010)
Data collected by the Malta Airport MetOffice 2.2 Precipitation The most common forms of local precipitation include rain, hail, dew and soft rime. Meteorological observations for rain and dew are made by means of calibrated standard rain gauges that measure precipitation at regular intervals. This technique assumes that the amount of precipitation collected per unit area of the gauge’s aperture is the same as the amount falling on the surrounding surface per unit area. Since 1947 these rain gauges have been and are still situated at Luqa Airport. Currently, rain gauges with tipping-buckets connected to electronic sensors are used by the MetOffice. Measurements made during the 30-year climate period 1961-1990 show that the average total precipitation of the Maltese Islands is 553.12 mm with a standard deviation of 156.99 mm (table 5). Table 5. Summary of statistics for precipitation (Based on the 30-year climate period 1961-1990)
Count 30 years (1961-1990)
Average 553.12
Standard deviation 156.99
Coefficient of variation (%) 28.38
Minimum 274.22
Maximum 874.10
Range 599.88
Standard skewness -0.018
8
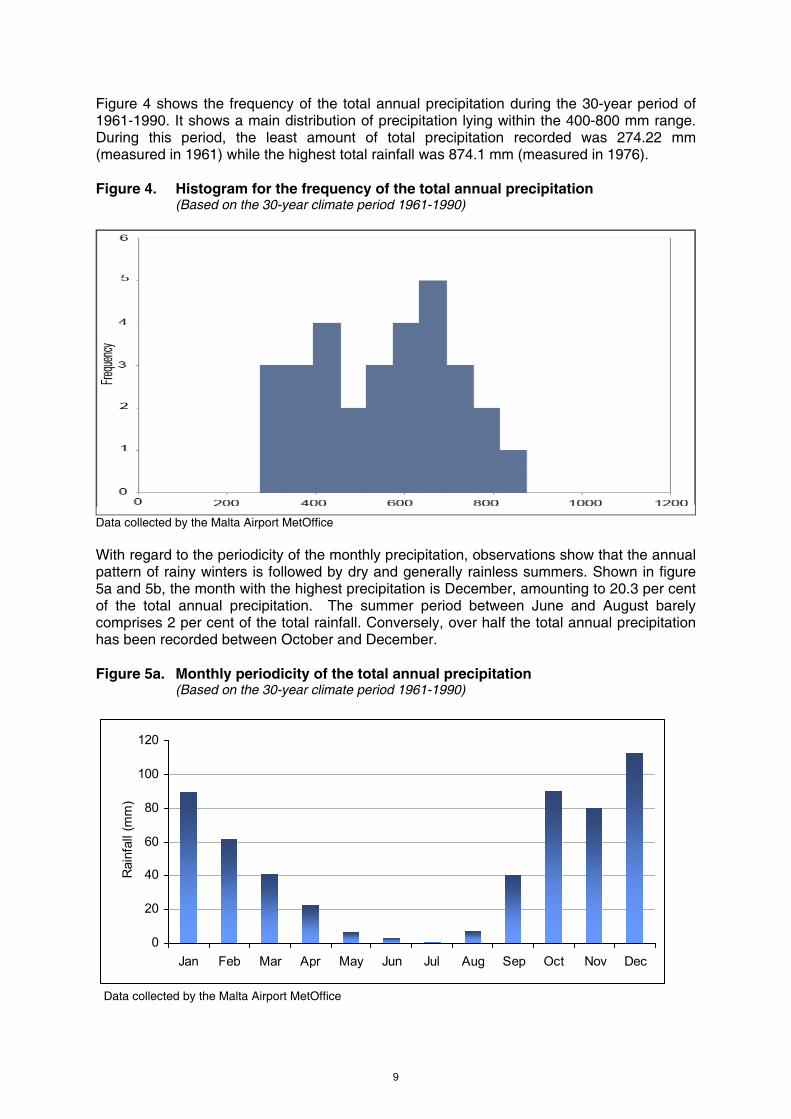
Figure 4 shows the frequency of the total annual precipitation during the 30-year period of 1961-1990. It shows a main distribution of precipitation lying within the 400-800 mm range. During this period, the least amount of total precipitation recorded was 274.22 mm (measured in 1961) while the highest total rainfall was 874.1 mm (measured in 1976). Figure 4. Histogram for the frequency of the total annual precipitation (Based on the 30-year climate period 1961-1990)
Data collected by the Malta Airport MetOffice With regard to the periodicity of the monthly precipitation, observations show that the annual pattern of rainy winters is followed by dry and generally rainless summers. Shown in figure 5a and 5b, the month with the highest precipitation is December, amounting to 20.3 per cent of the total annual precipitation. The summer period between June and August barely comprises 2 per cent of the total rainfall. Conversely, over half the total annual precipitation has been recorded between October and December. Figure 5a. Monthly periodicity of the total annual precipitation (Based on the 30-year climate period 1961-1990)
0
20
40
60
80
100
120
Jan Feb Mar Apr May Jun Jul Aug Sep Oct Nov Dec
Rai
nfal
l (m
m)
Data collected by the Malta Airport MetOffice
9
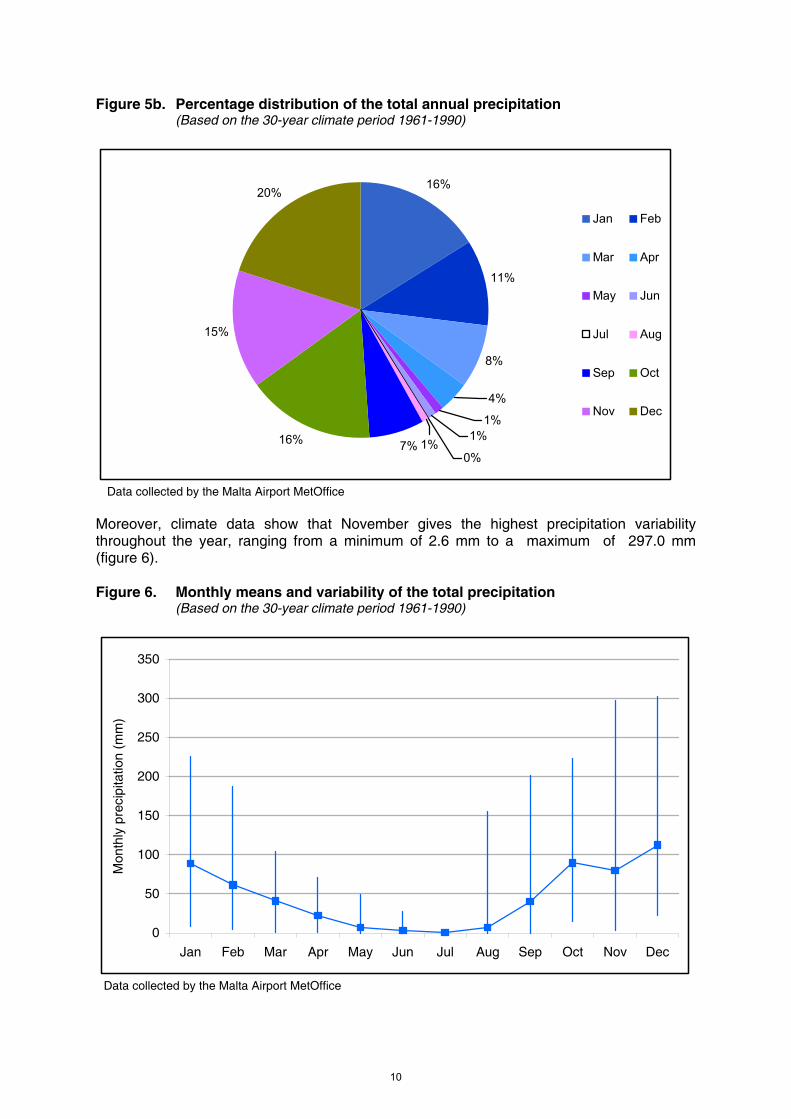
Figure 5b. Percentage distribution of the total annual precipitation (Based on the 30-year climate period 1961-1990)
16%
11%
8%
7%16%
15%
20%
1%0%
1%1%
4%
Jan Feb
Mar Apr
May Jun
Jul Aug
Sep Oct
Nov Dec
Data collected by the Malta Airport MetOffice
Moreover, climate data show that November gives the highest precipitation variability throughout the year, ranging from a minimum of 2.6 mm to a maximum of 297.0 mm (figure 6). Figure 6. Monthly means and variability of the total precipitation (Based on the 30-year climate period 1961-1990)
0
50
100
150
200
250
300
350
Jan Feb Mar Apr May Jun Jul Aug Sep Oct Nov Dec
Mon
thly
pre
cipi
tatio
n (m
m)
Data collected by the Malta Airport MetOffice
10
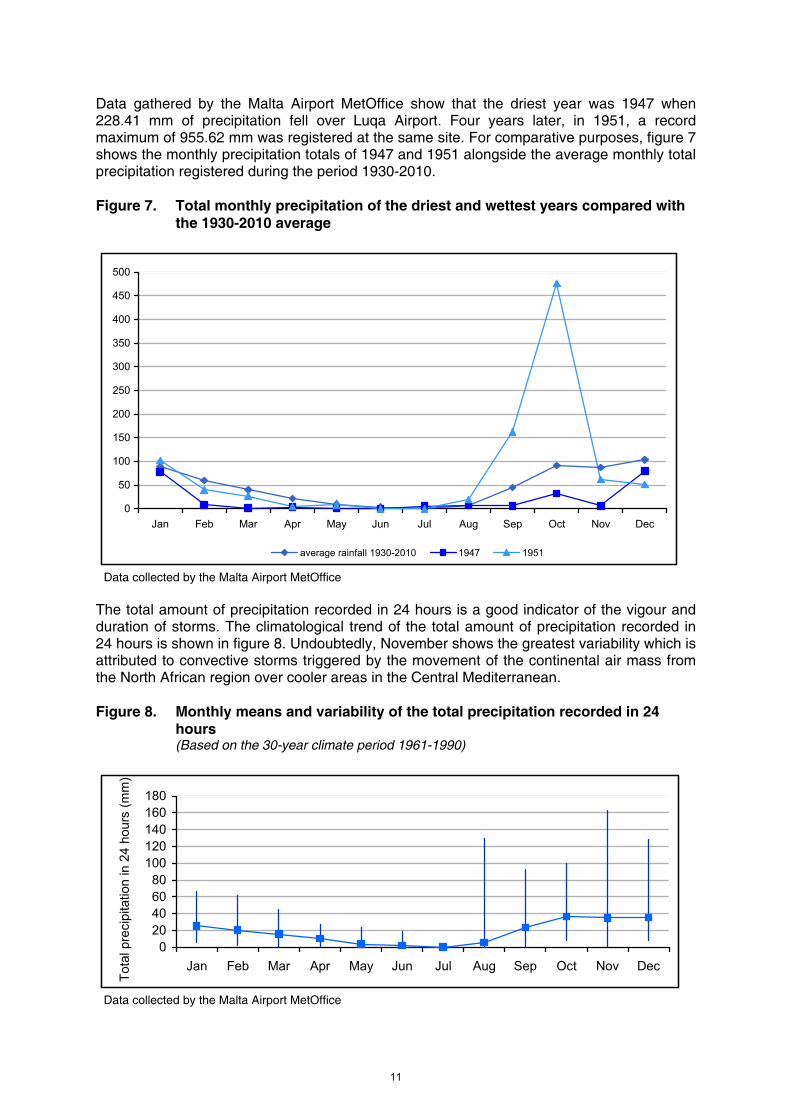
Data gathered by the Malta Airport MetOffice show that the driest year was 1947 when 228.41 mm of precipitation fell over Luqa Airport. Four years later, in 1951, a record maximum of 955.62 mm was registered at the same site. For comparative purposes, figure 7 shows the monthly precipitation totals of 1947 and 1951 alongside the average monthly total precipitation registered during the period 1930-2010. Figure 7. Total monthly precipitation of the driest and wettest years compared with
the 1930-2010 average
0
50
100
150
200
250
300
350
400
450
500
Jan Feb Mar Apr May Jun Jul Aug Sep Oct Nov Dec
average rainfall 1930-2010 1947 1951
Data collected by the Malta Airport MetOffice
The total amount of precipitation recorded in 24 hours is a good indicator of the vigour and duration of storms. The climatological trend of the total amount of precipitation recorded in 24 hours is shown in figure 8. Undoubtedly, November shows the greatest variability which is attributed to convective storms triggered by the movement of the continental air mass from the North African region over cooler areas in the Central Mediterranean. Figure 8. Monthly means and variability of the total precipitation recorded in 24
hours (Based on the 30-year climate period 1961-1990)
020406080
100120140160180
Jan Feb Mar Apr May Jun Jul Aug Sep Oct Nov Dec
Tot
al p
reci
pita
tion
in 2
4 ho
urs
(mm
)
Data collected by the Malta Airport MetOffice
11
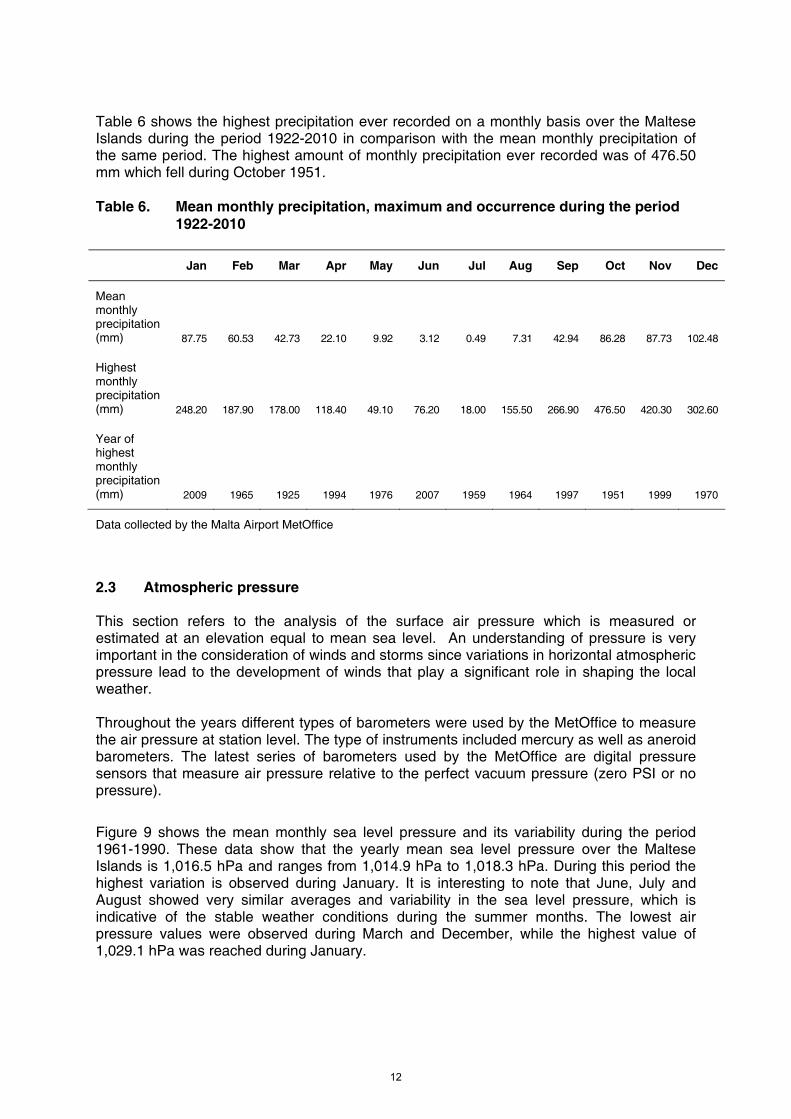
Table 6 shows the highest precipitation ever recorded on a monthly basis over the Maltese Islands during the period 1922-2010 in comparison with the mean monthly precipitation of the same period. The highest amount of monthly precipitation ever recorded was of 476.50 mm which fell during October 1951. Table 6. Mean monthly precipitation, maximum and occurrence during the period
1922-2010
Jan Feb Mar Apr May Jun Jul Aug Sep Oct Nov Dec
Mean monthly precipitation (mm) 87.75 60.53 42.73 22.10 9.92 3.12 0.49 7.31 42.94 86.28 87.73 102.48
Highest monthly precipitation (mm) 248.20 187.90 178.00 118.40 49.10 76.20 18.00 155.50 266.90 476.50 420.30 302.60
Year of highest monthly precipitation (mm) 2009 1965 1925 1994 1976 2007 1959 1964 1997 1951 1999 1970
Data collected by the Malta Airport MetOffice
2.3 Atmospheric pressure This section refers to the analysis of the surface air pressure which is measured or estimated at an elevation equal to mean sea level. An understanding of pressure is very important in the consideration of winds and storms since variations in horizontal atmospheric pressure lead to the development of winds that play a significant role in shaping the local weather. Throughout the years different types of barometers were used by the MetOffice to measure the air pressure at station level. The type of instruments included mercury as well as aneroid barometers. The latest series of barometers used by the MetOffice are digital pressure sensors that measure air pressure relative to the perfect vacuum pressure (zero PSI or no pressure).
Figure 9 shows the mean monthly sea level pressure and its variability during the period 1961-1990. These data show that the yearly mean sea level pressure over the Maltese Islands is 1,016.5 hPa and ranges from 1,014.9 hPa to 1,018.3 hPa. During this period the highest variation is observed during January. It is interesting to note that June, July and August showed very similar averages and variability in the sea level pressure, which is indicative of the stable weather conditions during the summer months. The lowest air pressure values were observed during March and December, while the highest value of 1,029.1 hPa was reached during January.
12
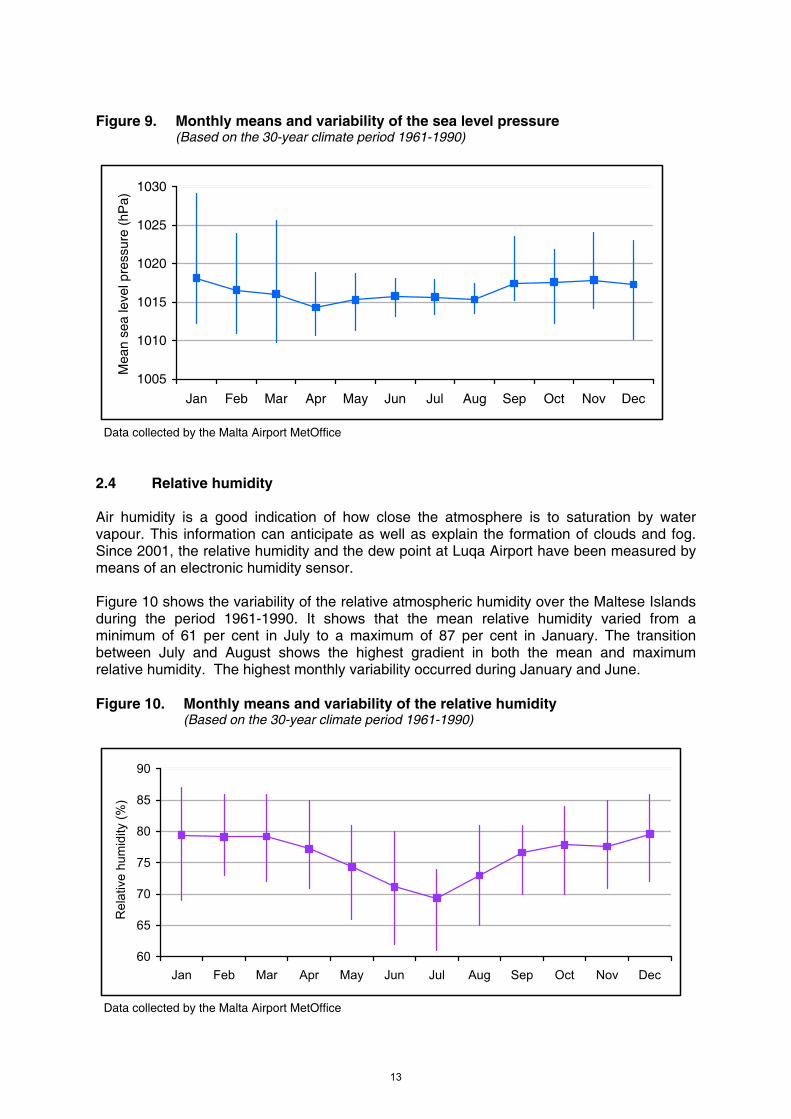
Figure 9. Monthly means and variability of the sea level pressure (Based on the 30-year climate period 1961-1990)
1005
1010
1015
1020
1025
1030
Jan Feb Mar Apr May Jun Jul Aug Sep Oct Nov Dec
Mea
n se
a le
vel p
ress
ure
(hP
a)
Data collected by the Malta Airport MetOffice
2.4 Relative humidity Air humidity is a good indication of how close the atmosphere is to saturation by water vapour. This information can anticipate as well as explain the formation of clouds and fog. Since 2001, the relative humidity and the dew point at Luqa Airport have been measured by means of an electronic humidity sensor. Figure 10 shows the variability of the relative atmospheric humidity over the Maltese Islands during the period 1961-1990. It shows that the mean relative humidity varied from a minimum of 61 per cent in July to a maximum of 87 per cent in January. The transition between July and August shows the highest gradient in both the mean and maximum relative humidity. The highest monthly variability occurred during January and June. Figure 10. Monthly means and variability of the relative humidity (Based on the 30-year climate period 1961-1990)
60
65
70
75
80
85
90
Jan Feb Mar Apr May Jun Jul Aug Sep Oct Nov Dec
Rel
ativ
e hu
mid
ity (
%)
Data collected by the Malta Airport MetOffice
13
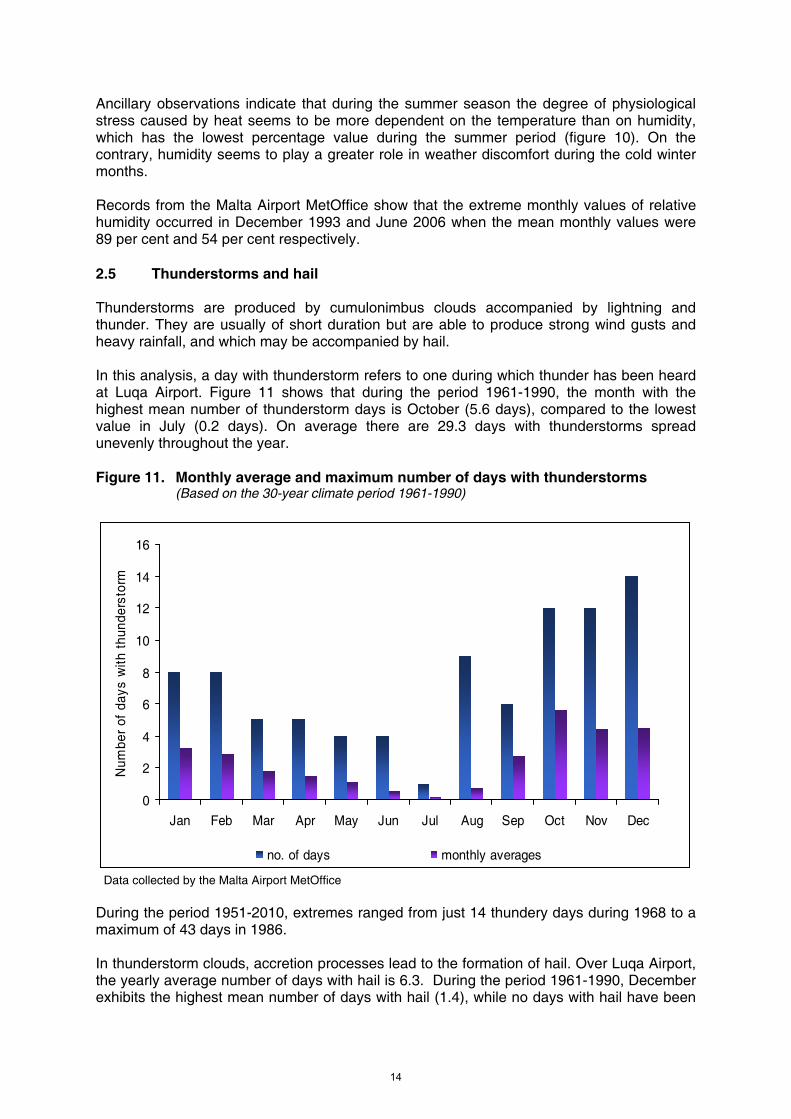
Ancillary observations indicate that during the summer season the degree of physiological stress caused by heat seems to be more dependent on the temperature than on humidity, which has the lowest percentage value during the summer period (figure 10). On the contrary, humidity seems to play a greater role in weather discomfort during the cold winter months. Records from the Malta Airport MetOffice show that the extreme monthly values of relative humidity occurred in December 1993 and June 2006 when the mean monthly values were 89 per cent and 54 per cent respectively. 2.5 Thunderstorms and hail Thunderstorms are produced by cumulonimbus clouds accompanied by lightning and thunder. They are usually of short duration but are able to produce strong wind gusts and heavy rainfall, and which may be accompanied by hail. In this analysis, a day with thunderstorm refers to one during which thunder has been heard at Luqa Airport. Figure 11 shows that during the period 1961-1990, the month with the highest mean number of thunderstorm days is October (5.6 days), compared to the lowest value in July (0.2 days). On average there are 29.3 days with thunderstorms spread unevenly throughout the year. Figure 11. Monthly average and maximum number of days with thunderstorms (Based on the 30-year climate period 1961-1990)
0
2
4
6
8
10
12
14
16
Jan Feb Mar Apr May Jun Jul Aug Sep Oct Nov Dec
Num
ber
of d
ays
with
thu
nder
stor
m
no. of days monthly averages
Data collected by the Malta Airport MetOffice During the period 1951-2010, extremes ranged from just 14 thundery days during 1968 to a maximum of 43 days in 1986. In thunderstorm clouds, accretion processes lead to the formation of hail. Over Luqa Airport, the yearly average number of days with hail is 6.3. During the period 1961-1990, December exhibits the highest mean number of days with hail (1.4), while no days with hail have been
14
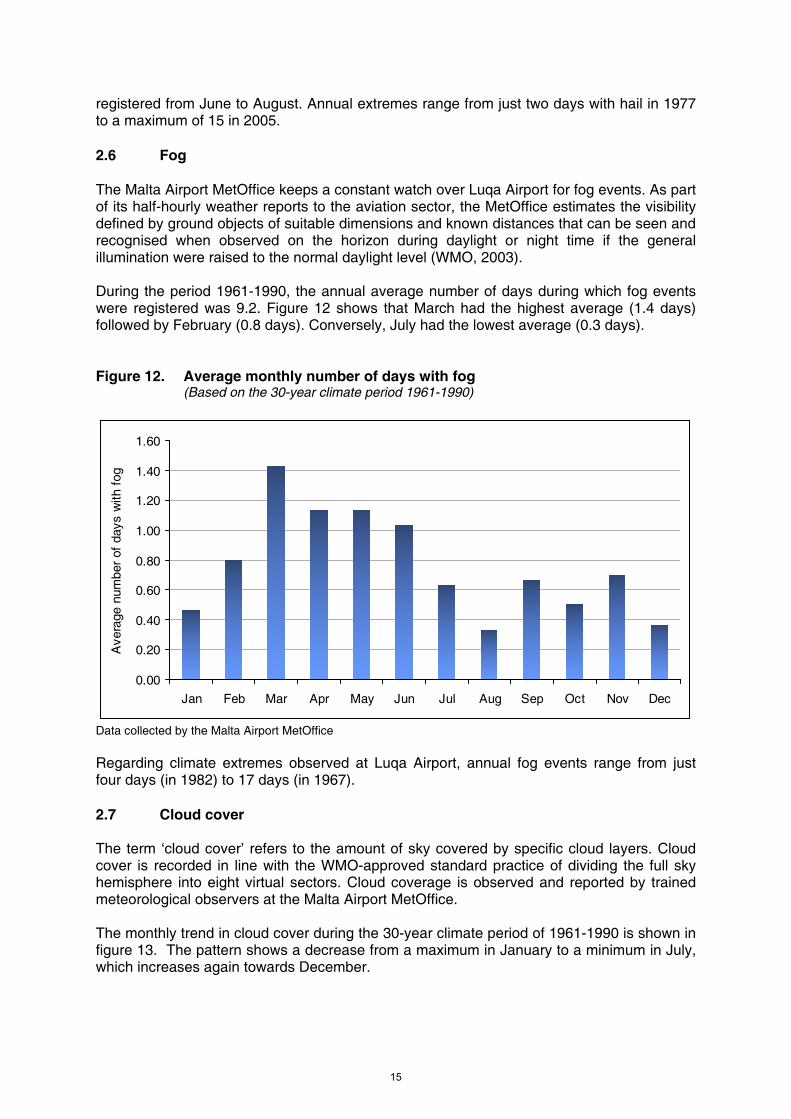
registered from June to August. Annual extremes range from just two days with hail in 1977 to a maximum of 15 in 2005. 2.6 Fog The Malta Airport MetOffice keeps a constant watch over Luqa Airport for fog events. As part of its half-hourly weather reports to the aviation sector, the MetOffice estimates the visibility defined by ground objects of suitable dimensions and known distances that can be seen and recognised when observed on the horizon during daylight or night time if the general illumination were raised to the normal daylight level (WMO, 2003). During the period 1961-1990, the annual average number of days during which fog events were registered was 9.2. Figure 12 shows that March had the highest average (1.4 days) followed by February (0.8 days). Conversely, July had the lowest average (0.3 days). Figure 12. Average monthly number of days with fog (Based on the 30-year climate period 1961-1990)
0.00
0.20
0.40
0.60
0.80
1.00
1.20
1.40
1.60
Jan Feb Mar Apr May Jun Jul Aug Sep Oct Nov Dec
Ave
rage
num
ber
of d
ays
with
fog
Data collected by the Malta Airport MetOffice Regarding climate extremes observed at Luqa Airport, annual fog events range from just four days (in 1982) to 17 days (in 1967). 2.7 Cloud cover The term ‘cloud cover’ refers to the amount of sky covered by specific cloud layers. Cloud cover is recorded in line with the WMO-approved standard practice of dividing the full sky hemisphere into eight virtual sectors. Cloud coverage is observed and reported by trained meteorological observers at the Malta Airport MetOffice. The monthly trend in cloud cover during the 30-year climate period of 1961-1990 is shown in figure 13. The pattern shows a decrease from a maximum in January to a minimum in July, which increases again towards December.
15
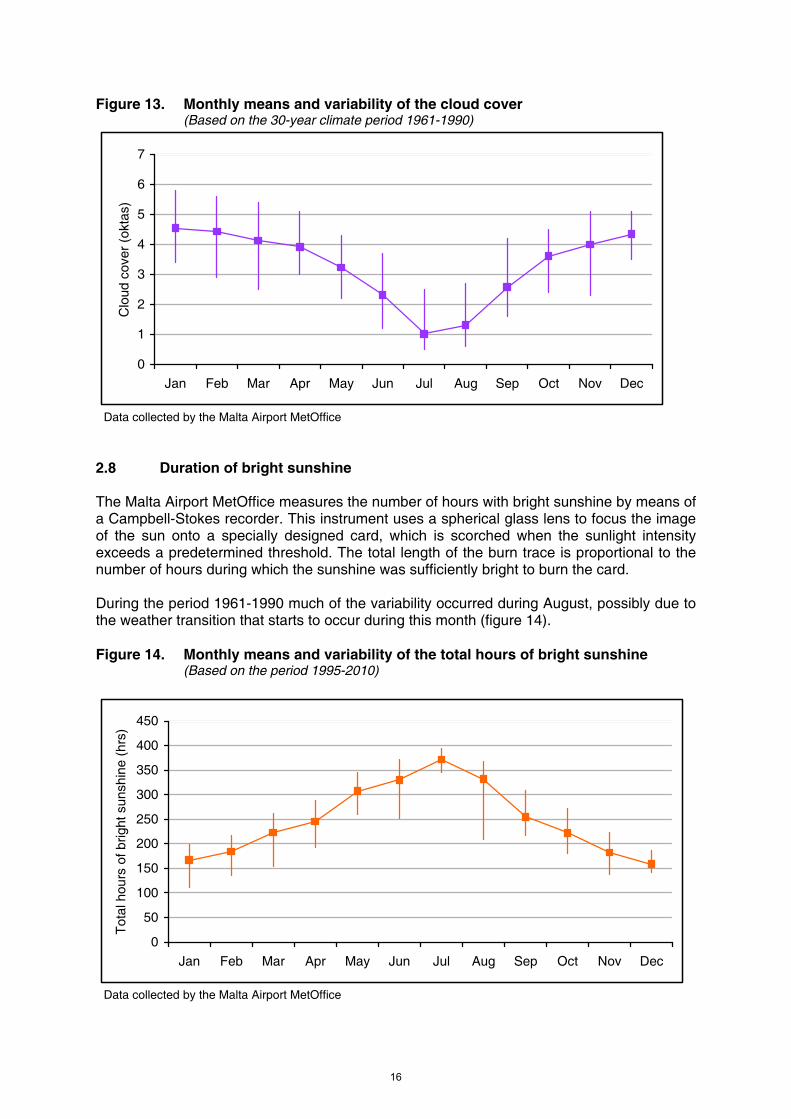
Figure 13. Monthly means and variability of the cloud cover (Based on the 30-year climate period 1961-1990)
0
1
2
3
4
5
6
7
Jan Feb Mar Apr May Jun Jul Aug Sep Oct Nov Dec
Clo
ud c
over
(ok
tas)
Data collected by the Malta Airport MetOffice
2.8 Duration of bright sunshine The Malta Airport MetOffice measures the number of hours with bright sunshine by means of a Campbell-Stokes recorder. This instrument uses a spherical glass lens to focus the image of the sun onto a specially designed card, which is scorched when the sunlight intensity exceeds a predetermined threshold. The total length of the burn trace is proportional to the number of hours during which the sunshine was sufficiently bright to burn the card. During the period 1961-1990 much of the variability occurred during August, possibly due to the weather transition that starts to occur during this month (figure 14). Figure 14. Monthly means and variability of the total hours of bright sunshine (Based on the period 1995-2010)
0
50
100
150
200
250
300
350
400
450
Jan Feb Mar Apr May Jun Jul Aug Sep Oct Nov Dec
Tot
al h
ours
of b
right
sun
shin
e (h
rs)
Data collected by the Malta Airport MetOffice
16
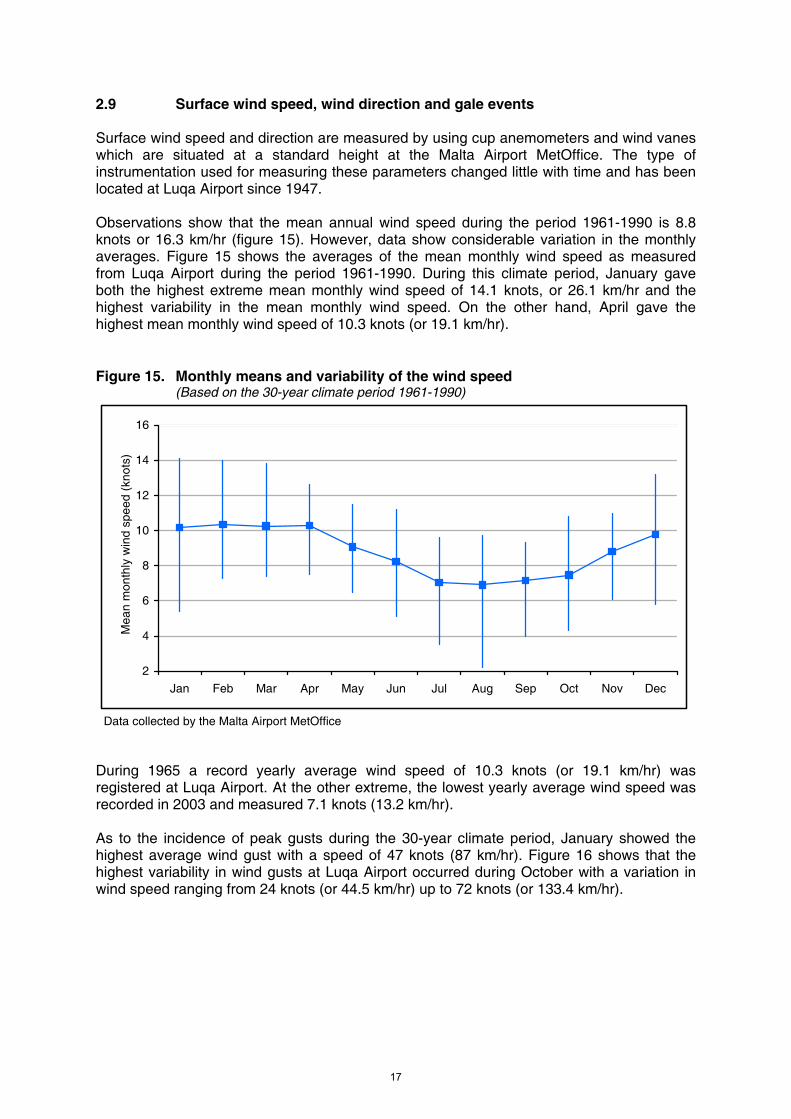
2.9 Surface wind speed, wind direction and gale events Surface wind speed and direction are measured by using cup anemometers and wind vanes which are situated at a standard height at the Malta Airport MetOffice. The type of instrumentation used for measuring these parameters changed little with time and has been located at Luqa Airport since 1947. Observations show that the mean annual wind speed during the period 1961-1990 is 8.8 knots or 16.3 km/hr (figure 15). However, data show considerable variation in the monthly averages. Figure 15 shows the averages of the mean monthly wind speed as measured from Luqa Airport during the period 1961-1990. During this climate period, January gave both the highest extreme mean monthly wind speed of 14.1 knots, or 26.1 km/hr and the highest variability in the mean monthly wind speed. On the other hand, April gave the highest mean monthly wind speed of 10.3 knots (or 19.1 km/hr).
Figure 15. Monthly means and variability of the wind speed (Based on the 30-year climate period 1961-1990)
2
4
6
8
10
12
14
16
Jan Feb Mar Apr May Jun Jul Aug Sep Oct Nov Dec
Mea
n m
onth
ly w
ind
spee
d (k
nots
)
Data collected by the Malta Airport MetOffice
During 1965 a record yearly average wind speed of 10.3 knots (or 19.1 km/hr) was registered at Luqa Airport. At the other extreme, the lowest yearly average wind speed was recorded in 2003 and measured 7.1 knots (13.2 km/hr). As to the incidence of peak gusts during the 30-year climate period, January showed the highest average wind gust with a speed of 47 knots (87 km/hr). Figure 16 shows that the highest variability in wind gusts at Luqa Airport occurred during October with a variation in wind speed ranging from 24 knots (or 44.5 km/hr) up to 72 knots (or 133.4 km/hr).
17
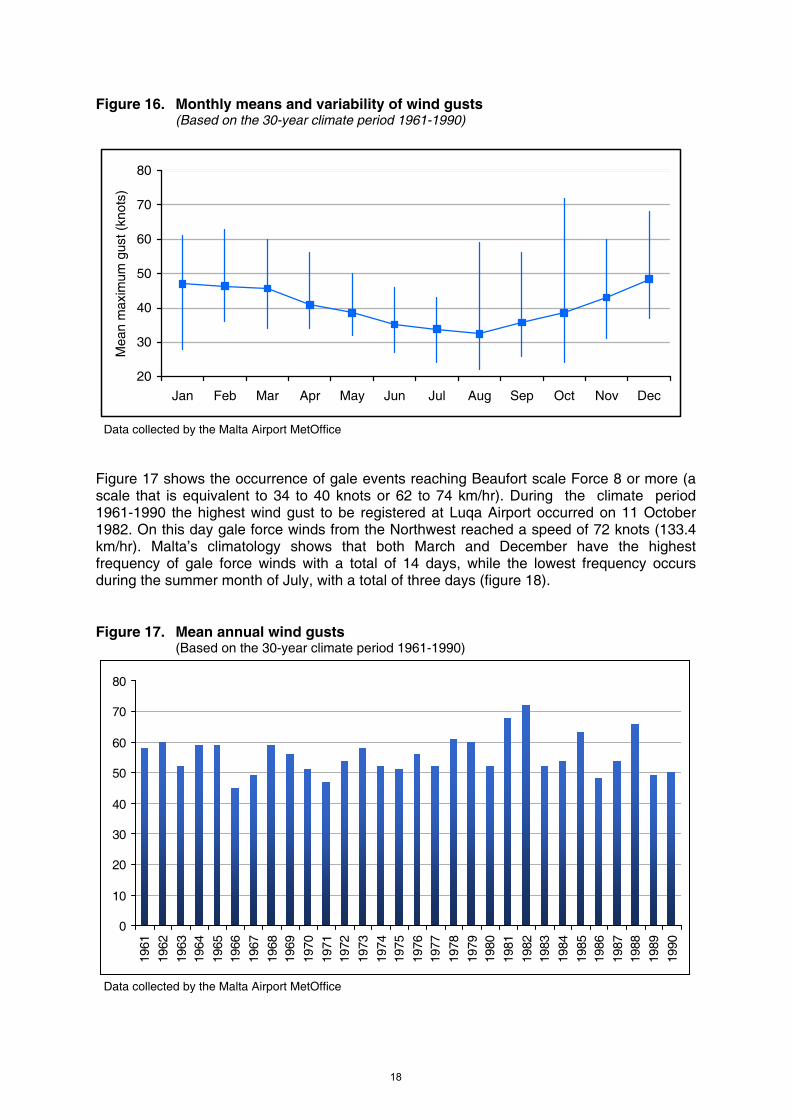
Figure 16. Monthly means and variability of wind gusts (Based on the 30-year climate period 1961-1990)
20
30
40
50
60
70
80
Jan Feb Mar Apr May Jun Jul Aug Sep Oct Nov Dec
Mea
n m
axim
um g
ust (
knot
s)
Data collected by the Malta Airport MetOffice
Figure 17 shows the occurrence of gale events reaching Beaufort scale Force 8 or more (a scale that is equivalent to 34 to 40 knots or 62 to 74 km/hr). During the climate period 1961-1990 the highest wind gust to be registered at Luqa Airport occurred on 11 October 1982. On this day gale force winds from the Northwest reached a speed of 72 knots (133.4 km/hr). Malta’s climatology shows that both March and December have the highest frequency of gale force winds with a total of 14 days, while the lowest frequency occurs during the summer month of July, with a total of three days (figure 18). Figure 17. Mean annual wind gusts (Based on the 30-year climate period 1961-1990)
0
10
20
30
40
50
60
70
80
1961
1962
1963
1964
1965
1966
1967
1968
1969
1970
1971
1972
1973
1974
1975
1976
1977
1978
1979
1980
1981
1982
1983
1984
1985
1986
1987
1988
1989
1990
Data collected by the Malta Airport MetOffice
18
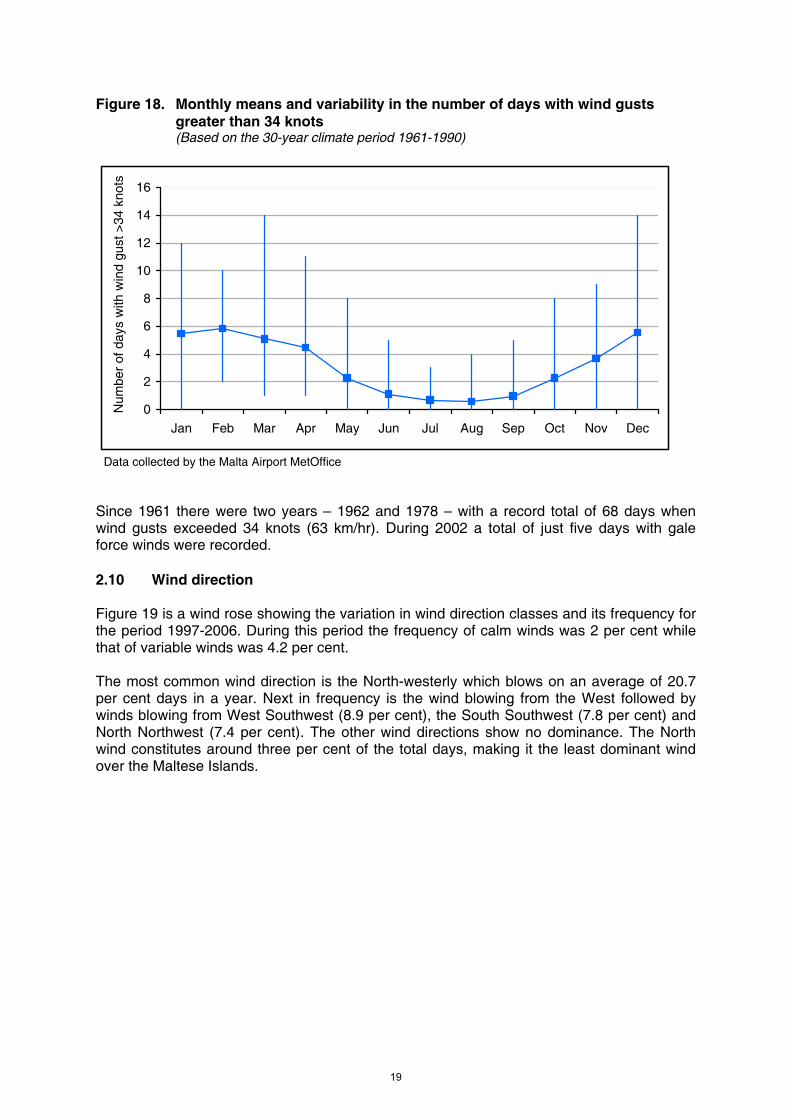
Figure 18. Monthly means and variability in the number of days with wind gusts greater than 34 knots
(Based on the 30-year climate period 1961-1990)
0
2
4
6
8
10
12
14
16
Jan Feb Mar Apr May Jun Jul Aug Sep Oct Nov Dec
Num
ber
of d
ays
with
win
d gu
st >
34 k
nots
Data collected by the Malta Airport MetOffice
Since 1961 there were two years – 1962 and 1978 – with a record total of 68 days when wind gusts exceeded 34 knots (63 km/hr). During 2002 a total of just five days with gale force winds were recorded. 2.10 Wind direction Figure 19 is a wind rose showing the variation in wind direction classes and its frequency for the period 1997-2006. During this period the frequency of calm winds was 2 per cent while that of variable winds was 4.2 per cent. The most common wind direction is the North-westerly which blows on an average of 20.7 per cent days in a year. Next in frequency is the wind blowing from the West followed by winds blowing from West Southwest (8.9 per cent), the South Southwest (7.8 per cent) and North Northwest (7.4 per cent). The other wind directions show no dominance. The North wind constitutes around three per cent of the total days, making it the least dominant wind over the Maltese Islands.
19
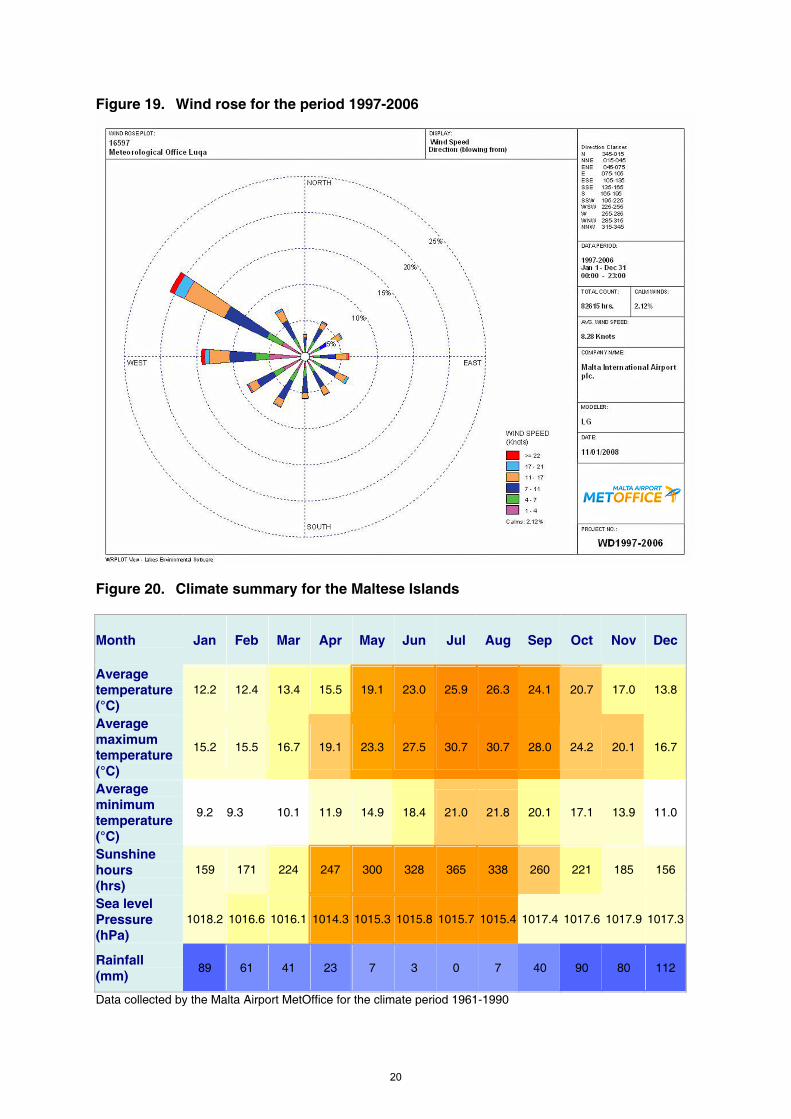
Figure 19. Wind rose for the period 1997-2006
Figure 20. Climate summary for the Maltese Islands
Month Jan Feb Mar Apr May Jun Jul Aug Sep Oct Nov Dec
Average temperature (°C)
12.2 12.4 13.4 15.5 19.1 23.0 25.9 26.3 24.1 20.7 17.0 13.8
Average maximum temperature (°C)
15.2 15.5 16.7 19.1 23.3 27.5 30.7 30.7 28.0 24.2 20.1 16.7
Average minimum temperature (°C)
9.2 9.3 10.1 11.9 14.9 18.4 21.0 21.8 20.1 17.1 13.9 11.0
Sunshine hours (hrs)
159 171 224 247 300 328 365 338 260 221 185 156
Sea level Pressure (hPa)
1018.2 1016.6 1016.1 1014.3 1015.3 1015.8 1015.7 1015.4 1017.4 1017.6 1017.9 1017.3
Rainfall (mm)
89 61 41 23 7 3 0 7 40 90 80 112
Data collected by the Malta Airport MetOffice for the climate period 1961-1990
20
2
Malta’s climate anomaly trends and possibly related socio-economic impacts

3.0 MALTA’S CLIMATE ANOMALY TRENDS The departure of a weather element from its long-period average value as measured at a fixed geographic location provides a measurement of its anomaly at that particular location. Contrary to the daily measurement of weather elements at a single point in time and space, the measurement of climate anomalies takes into account weather patterns over a long period of time. This is the only way to identify climatic changes relative to particular geographical locations. Discerning significant trends within a relatively long time frame is never a straightforward exercise. Short-term, natural fluctuations of the weather above or below the mean tend to be common, which is usually coupled to a certain degree of fluctuation in the recorded data from instrument and measurement errors. In order to reach a reliable pattern of climate tendencies, these errors must be reduced as much as possible, such as by averaging out the measurements. When combined into an overall average, deviations arising due to outliers are smoothened and trends present in the data become more apparent and amenable for analysis and interpretation. International climate centres identify changes in climate trends by comparing changes in weather elements against the locality’s long-term observed climate norm that is averaged over a reference period of 30 years (NCDC, 2010). The same principle is applied here in this document in order to underline the general long-term trends of a number of weather elements for the Maltese Islands. 3.1 Statistical analysis and the trend anomaly diagram In climate studies statistical methods are applied to ensure that climate data are interpreted correctly and that apparent trends are meaningful. The simplest type are linear (or straight line) trends to indicate the presence or absence of a continuous trend over time. Linear trends are widely used in such studies since, when correctly applied, they provide a simple way to characterise the overall change and its magnitude1. Nevertheless, significantly different trends can also occur for particular periods of a single climate data set. Due to the extensive analysis required to assess the presence, and more importantly, the significance of trends, only a limited number of weather elements are considered here. These are: ambient air temperature; precipitation; atmospheric pressure; number of days with gale force winds (or degree of storminess); cloud cover.
The trend analysis for these variables (apart from the number of days with gale force winds2) measured during the period 1951-2010 are discussed and presented graphically to show the anomalies or departure of their mean annual values from the reference climate norm of 1961-1990. In these graphs the zero line represents the normal values derived from the
1 The NSO is aware that common procedures such as linear regression and application of tests of significance
all carry assumptions and limitations for their use for climate analysis. This document analyses mean annual values and their departure from the climate standard. In doing so any individual outlier observations taken at a specific time during the year are significantly smoothened.
2 Digital records related to the number of days with gale force winds are available from 1961 onwards.
23
standard climate; deviations above it represent times when the parameter is above this norm and vice versa. The non-parametric Mann-Kendall test (Sneyers, 1990) was applied to identify the existence of climate trends. This test is a widely used method to discover the presence of trends in climate data (Perry, 2008; Ventura et al., 2002). Statistical significance testing between the last 15 years with the previous period of 1951-1994 was also performed to note any statistically significant variations between these two periods. It is not the scope of this publication to question the possible causes of the underlying climate trends, nor whether such trends are predominantly random or deterministic in nature. This is hindered by (1) the short length of the data available (59 years or less); (2) inadequate knowledge of the statistical properties of such variables; and (3) generally poor understanding of possible linkages between the climate variables and their local, natural modes of variability.
Relationship of climate variables with socio-economic data (Appendix 1) Climate factors such as temperature, rainfall and gale storms can have a significant impact on a number of local socio-economic sectors (WMO, 2010). There can be instances where the weather may directly influence the seasonal and year-to-year changes in economic performance, but an equivalent impact on these sectors can also be due to independent, socio-economic pressures (such as fiscal, taxation, subsidies, etc.) where the end result can mask the impact due to a changing local climate. However, at the global level there is general agreement that there is a strong linkage between weather, society and the economy. Malta’s tourist industry relies, among other factors, on the warm temperatures and mild winters for attracting prospective visitors. Agriculturally, crop yields are observed to increase when growing conditions are ideal. Construction projects advance more rapidly when weather conditions are favourable. Hot or cold weather can affect the health of weak individuals. Energy usage is closely linked to seasonal temperature and humidity fluctuations. In fact, the demand for energy such as electricity and domestic gas increases during hot summers and cold, humid winters. Transportation by sea, land and air can be adversely affected by bad weather conditions.
3.2 Trends in the ambient air temperature Air temperature is one of the most relevant climatic parameters and significant and consistent changes from the norm are among the first signals of a changing climate. Prolonged extreme temperature events over the Maltese Islands may be due to heat waves3, droughts4 or unusually cold spells. Temperature changes affect almost all the climate parameters considered in this publication, directly or indirectly.
3 A basic definition of a heat wave implies that it is an extended period of unusually high atmosphere-related
heat stress, which causes temporary modifications in lifestyle and which may have adverse health consequences for the affected population. The definition used by the Malta Airport MetOffice for heatwave over the Maltese Islands is that recommended by the WMO as being a consecutive 5-day period during which the maximum temperature is 5oC above the average maximum temperature for that particular month.
4 There is no universally accepted definition for drought. This phenomenon is an insidious natural hazard that results from a deficiency in precipitation amounts which, when extended over a season or longer period of time, is insufficient to meet the demands of human activities and the environment. Therefore drought should be considered as a relative, rather than an absolute, condition.
24
3.2.1 Time series analysis
The following is an analysis of the trends of the mean, maximum and minimum ambient temperature measured at Luqa Airport, which is Malta’s climate reference point (Station Number 16597).
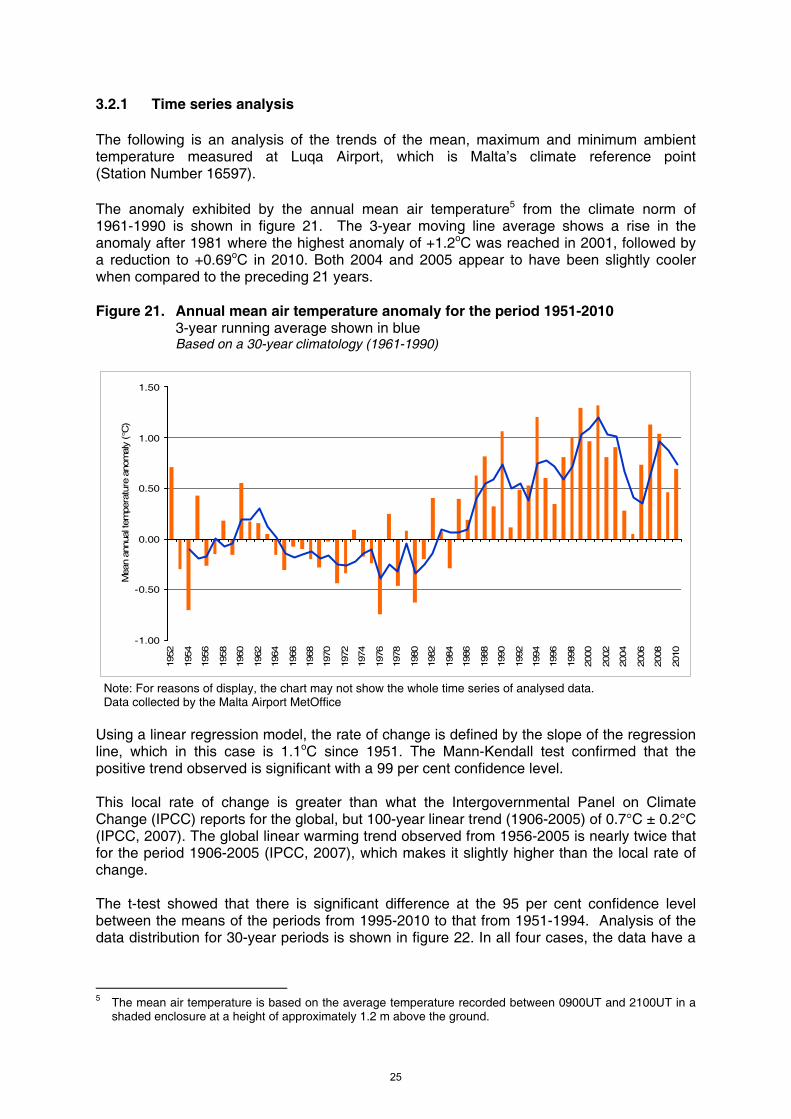
The anomaly exhibited by the annual mean air temperature5 from the climate norm of 1961-1990 is shown in figure 21. The 3-year moving line average shows a rise in the anomaly after 1981 where the highest anomaly of +1.2oC was reached in 2001, followed by a reduction to +0.69oC in 2010. Both 2004 and 2005 appear to have been slightly cooler when compared to the preceding 21 years. Figure 21. Annual mean air temperature anomaly for the period 1951-2010 3-year running average shown in blue Based on a 30-year climatology (1961-1990)
-1.00
-0.50
0.00
0.50
1.00
1.50
1952
1954
1956
1958
1960
1962
1964
1966
1968
1970
1972
1974
1976
1978
1980
1982
1984
1986
1988
1990
1992
1994
1996
1998
2000
2002
2004
2006
2008
2010
Mea
n an
nual
tem
pera
ture
ano
mal
y (°
C)
Note: For reasons of display, the chart may not show the whole time series of analysed data. Data collected by the Malta Airport MetOffice
Using a linear regression model, the rate of change is defined by the slope of the regression line, which in this case is 1.1oC since 1951. The Mann-Kendall test confirmed that the positive trend observed is significant with a 99 per cent confidence level. This local rate of change is greater than what the Intergovernmental Panel on Climate Change (IPCC) reports for the global, but 100-year linear trend (1906-2005) of 0.7°C ± 0.2°C (IPCC, 2007). The global linear warming trend observed from 1956-2005 is nearly twice that for the period 1906-2005 (IPCC, 2007), which makes it slightly higher than the local rate of change. The t-test showed that there is significant difference at the 95 per cent confidence level between the means of the periods from 1995-2010 to that from 1951-1994. Analysis of the data distribution for 30-year periods is shown in figure 22. In all four cases, the data have a
5 The mean air temperature is based on the average temperature recorded between 0900UT and 2100UT in a
shaded enclosure at a height of approximately 1.2 m above the ground.
25
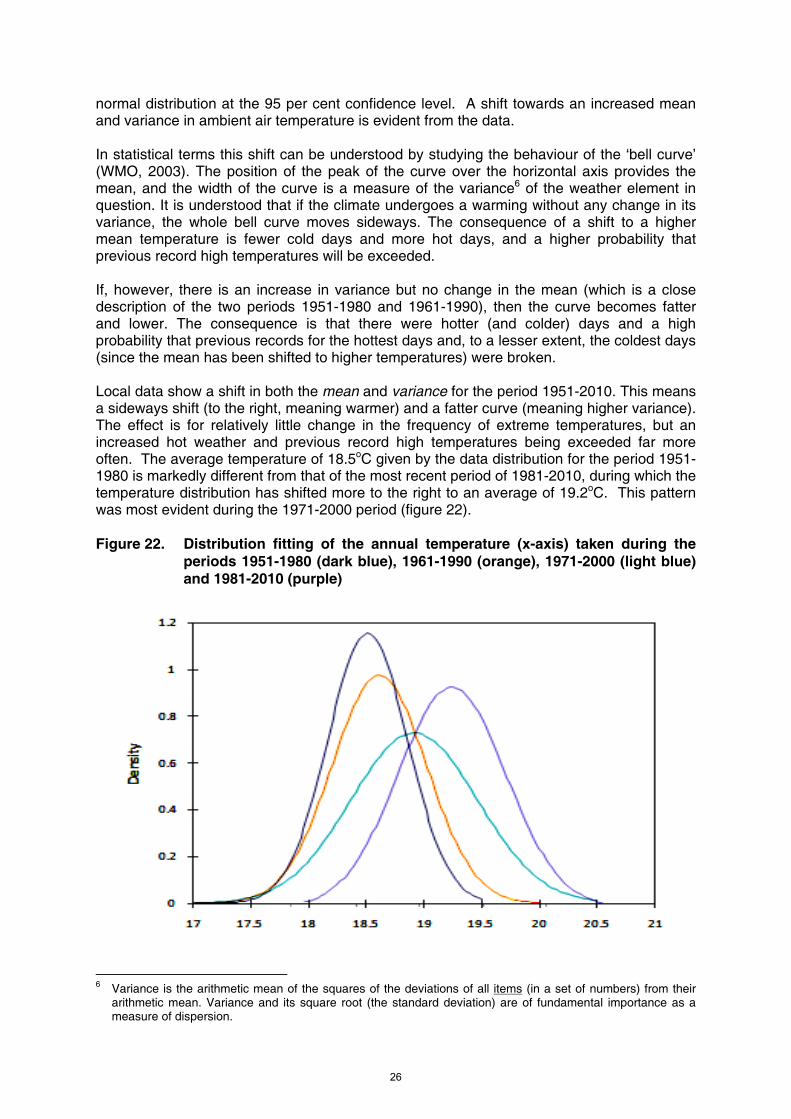
normal distribution at the 95 per cent confidence level. A shift towards an increased mean and variance in ambient air temperature is evident from the data. In statistical terms this shift can be understood by studying the behaviour of the ‘bell curve’ (WMO, 2003). The position of the peak of the curve over the horizontal axis provides the mean, and the width of the curve is a measure of the variance6 of the weather element in question. It is understood that if the climate undergoes a warming without any change in its variance, the whole bell curve moves sideways. The consequence of a shift to a higher mean temperature is fewer cold days and more hot days, and a higher probability that previous record high temperatures will be exceeded. If, however, there is an increase in variance but no change in the mean (which is a close description of the two periods 1951-1980 and 1961-1990), then the curve becomes fatter and lower. The consequence is that there were hotter (and colder) days and a high probability that previous records for the hottest days and, to a lesser extent, the coldest days (since the mean has been shifted to higher temperatures) were broken. Local data show a shift in both the mean and variance for the period 1951-2010. This means a sideways shift (to the right, meaning warmer) and a fatter curve (meaning higher variance). The effect is for relatively little change in the frequency of extreme temperatures, but an increased hot weather and previous record high temperatures being exceeded far more often. The average temperature of 18.5oC given by the data distribution for the period 1951-1980 is markedly different from that of the most recent period of 1981-2010, during which the temperature distribution has shifted more to the right to an average of 19.2oC. This pattern was most evident during the 1971-2000 period (figure 22). Figure 22. Distribution fitting of the annual temperature (x-axis) taken during the
periods 1951-1980 (dark blue), 1961-1990 (orange), 1971-2000 (light blue) and 1981-2010 (purple)
6 Variance is the arithmetic mean of the squares of the deviations of all items (in a set of numbers) from their
arithmetic mean. Variance and its square root (the standard deviation) are of fundamental importance as a measure of dispersion.
26
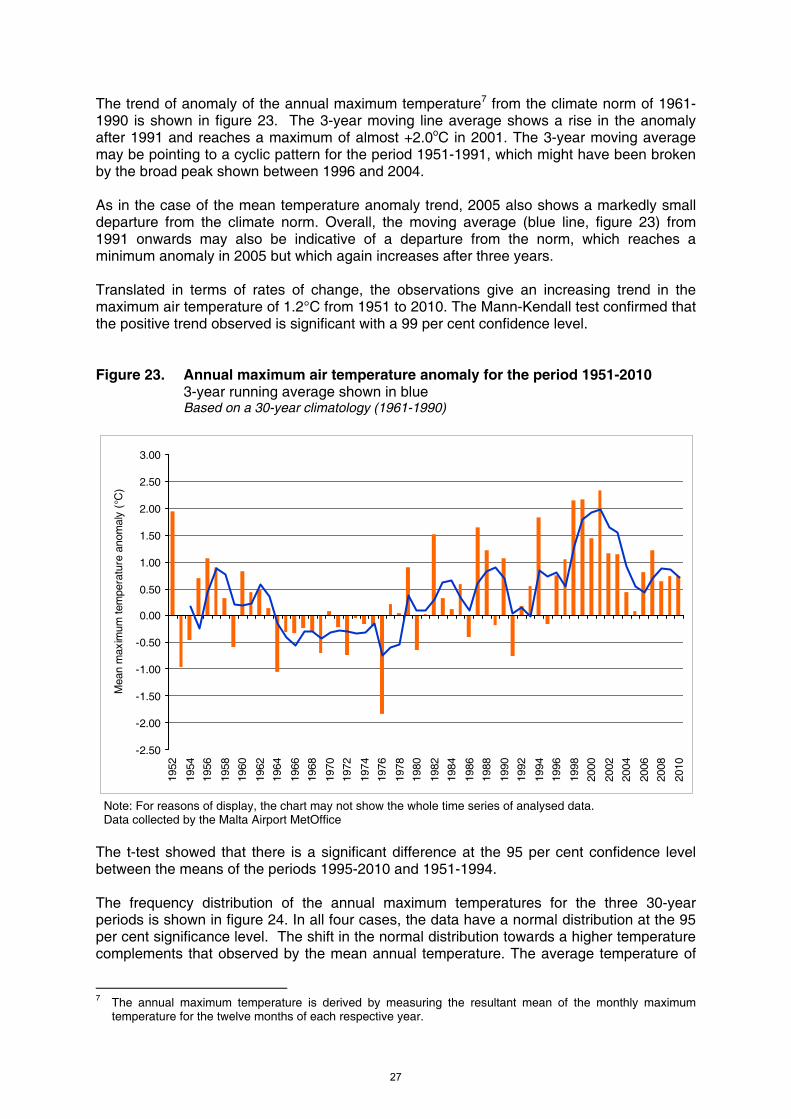
The trend of anomaly of the annual maximum temperature7 from the climate norm of 1961-1990 is shown in figure 23. The 3-year moving line average shows a rise in the anomaly after 1991 and reaches a maximum of almost +2.0oC in 2001. The 3-year moving average may be pointing to a cyclic pattern for the period 1951-1991, which might have been broken by the broad peak shown between 1996 and 2004. As in the case of the mean temperature anomaly trend, 2005 also shows a markedly small departure from the climate norm. Overall, the moving average (blue line, figure 23) from 1991 onwards may also be indicative of a departure from the norm, which reaches a minimum anomaly in 2005 but which again increases after three years. Translated in terms of rates of change, the observations give an increasing trend in the maximum air temperature of 1.2°C from 1951 to 2010. The Mann-Kendall test confirmed that the positive trend observed is significant with a 99 per cent confidence level. Figure 23. Annual maximum air temperature anomaly for the period 1951-2010
3-year running average shown in blue Based on a 30-year climatology (1961-1990)
-2.50
-2.00
-1.50
-1.00
-0.50
0.00
0.50
1.00
1.50
2.00
2.50
3.00
1952
1954
1956
1958
1960
1962
1964
1966
1968
1970
1972
1974
1976
1978
1980
1982
1984
1986
1988
1990
1992
1994
1996
1998
2000
2002
2004
2006
2008
2010
Mea
n m
axim
um te
mpe
ratu
re a
nom
aly
(°C
)
Note: For reasons of display, the chart may not show the whole time series of analysed data. Data collected by the Malta Airport MetOffice
The t-test showed that there is a significant difference at the 95 per cent confidence level between the means of the periods 1995-2010 and 1951-1994. The frequency distribution of the annual maximum temperatures for the three 30-year periods is shown in figure 24. In all four cases, the data have a normal distribution at the 95 per cent significance level. The shift in the normal distribution towards a higher temperature complements that observed by the mean annual temperature. The average temperature of
7 The annual maximum temperature is derived by measuring the resultant mean of the monthly maximum
temperature for the twelve months of each respective year.
27
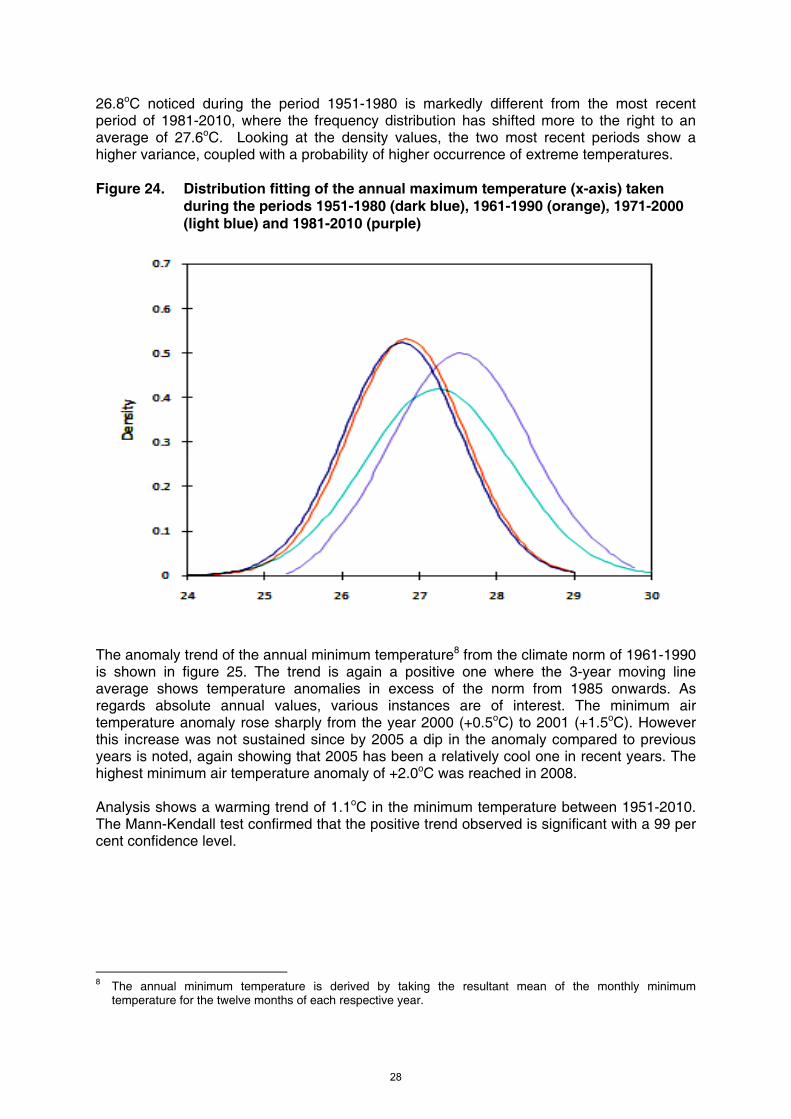
26.8oC noticed during the period 1951-1980 is markedly different from the most recent period of 1981-2010, where the frequency distribution has shifted more to the right to an average of 27.6oC. Looking at the density values, the two most recent periods show a higher variance, coupled with a probability of higher occurrence of extreme temperatures. Figure 24. Distribution fitting of the annual maximum temperature (x-axis) taken
during the periods 1951-1980 (dark blue), 1961-1990 (orange), 1971-2000 (light blue) and 1981-2010 (purple)
The anomaly trend of the annual minimum temperature8 from the climate norm of 1961-1990 is shown in figure 25. The trend is again a positive one where the 3-year moving line average shows temperature anomalies in excess of the norm from 1985 onwards. As regards absolute annual values, various instances are of interest. The minimum air temperature anomaly rose sharply from the year 2000 (+0.5oC) to 2001 (+1.5oC). However this increase was not sustained since by 2005 a dip in the anomaly compared to previous years is noted, again showing that 2005 has been a relatively cool one in recent years. The highest minimum air temperature anomaly of +2.0oC was reached in 2008. Analysis shows a warming trend of 1.1oC in the minimum temperature between 1951-2010. The Mann-Kendall test confirmed that the positive trend observed is significant with a 99 per cent confidence level.
8 The annual minimum temperature is derived by taking the resultant mean of the monthly minimum
temperature for the twelve months of each respective year.
28
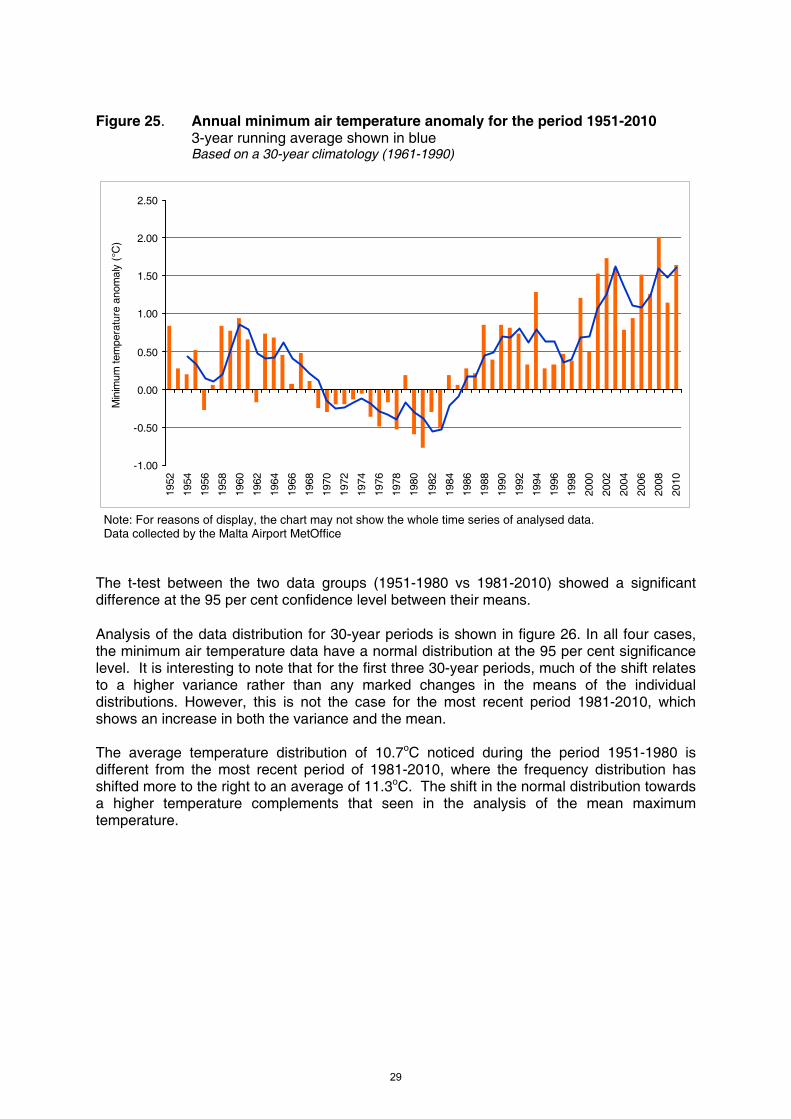
Figure 25. Annual minimum air temperature anomaly for the period 1951-2010
3-year running average shown in blue Based on a 30-year climatology (1961-1990)
-1.00
-0.50
0.00
0.50
1.00
1.50
2.00
2.50
1952
1954
1956
1958
1960
1962
1964
1966
1968
1970
1972
1974
1976
1978
1980
1982
1984
1986
1988
1990
1992
1994
1996
1998
2000
2002
2004
2006
2008
2010
Min
imum
tem
pera
ture
ano
mal
y (°
C)
Note: For reasons of display, the chart may not show the whole time series of analysed data. Data collected by the Malta Airport MetOffice
The t-test between the two data groups (1951-1980 vs 1981-2010) showed a significant difference at the 95 per cent confidence level between their means. Analysis of the data distribution for 30-year periods is shown in figure 26. In all four cases, the minimum air temperature data have a normal distribution at the 95 per cent significance level. It is interesting to note that for the first three 30-year periods, much of the shift relates to a higher variance rather than any marked changes in the means of the individual distributions. However, this is not the case for the most recent period 1981-2010, which shows an increase in both the variance and the mean. The average temperature distribution of 10.7oC noticed during the period 1951-1980 is different from the most recent period of 1981-2010, where the frequency distribution has shifted more to the right to an average of 11.3oC. The shift in the normal distribution towards a higher temperature complements that seen in the analysis of the mean maximum temperature.
29
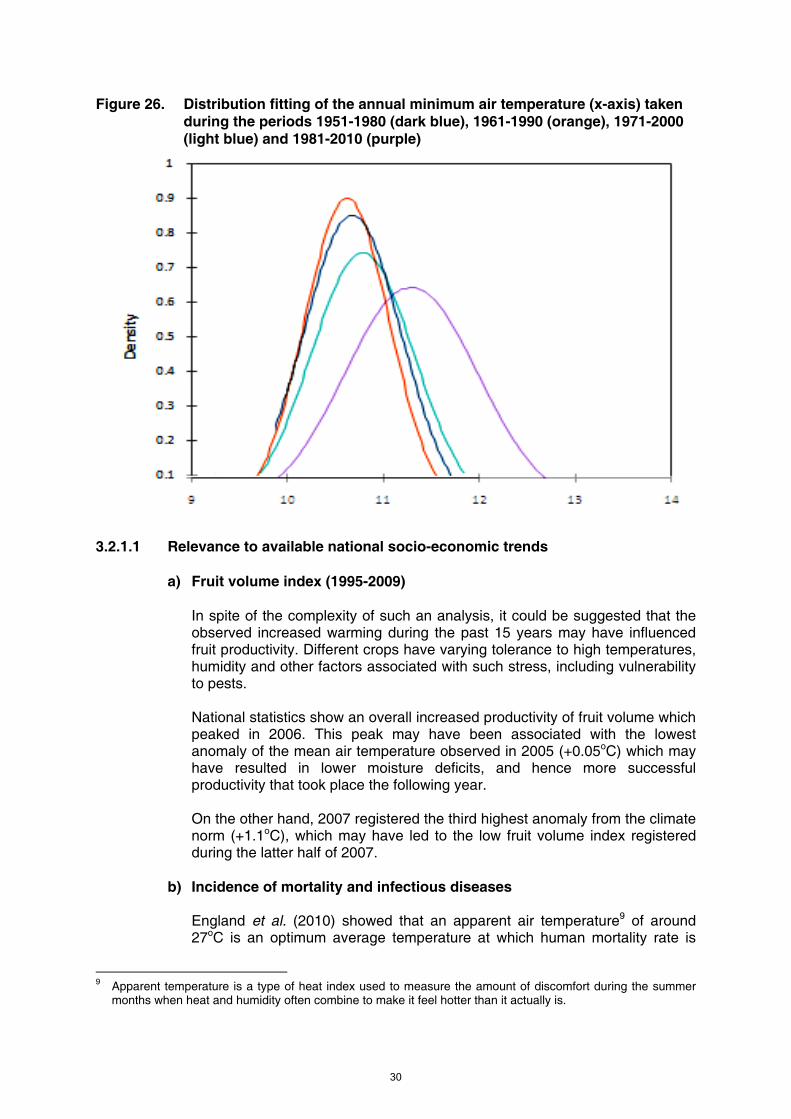
Figure 26. Distribution fitting of the annual minimum air temperature (x-axis) taken during the periods 1951-1980 (dark blue), 1961-1990 (orange), 1971-2000 (light blue) and 1981-2010 (purple)
3.2.1.1 Relevance to available national socio-economic trends
a) Fruit volume index (1995-2009)
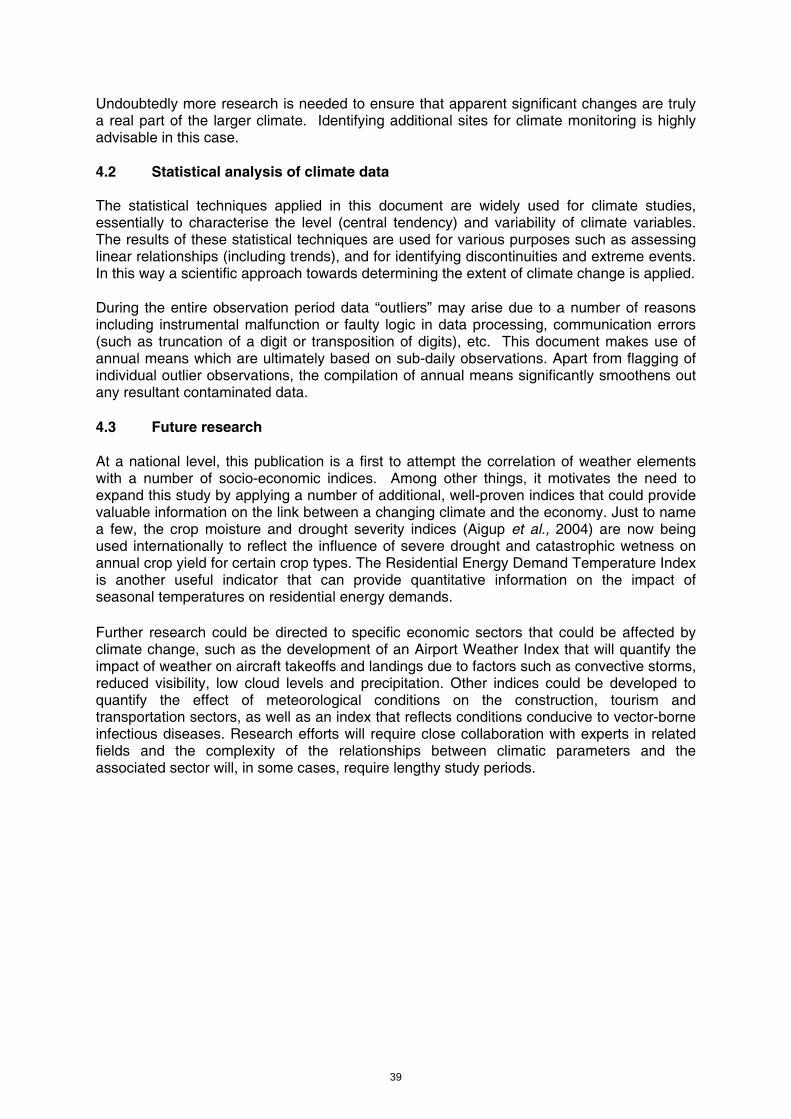
In spite of the complexity of such an analysis, it could be suggested that the observed increased warming during the past 15 years may have influenced fruit productivity. Different crops have varying tolerance to high temperatures, humidity and other factors associated with such stress, including vulnerability to pests.
National statistics show an overall increased productivity of fruit volume which peaked in 2006. This peak may have been associated with the lowest anomaly of the mean air temperature observed in 2005 (+0.05oC) which may have resulted in lower moisture deficits, and hence more successful productivity that took place the following year.
On the other hand, 2007 registered the third highest anomaly from the climate norm (+1.1oC), which may have led to the low fruit volume index registered during the latter half of 2007.
b) Incidence of mortality and infectious diseases
England et al. (2010) showed that an apparent air temperature9 of around 27oC is an optimum average temperature at which human mortality rate is
9 Apparent temperature is a type of heat index used to measure the amount of discomfort during the summer
months when heat and humidity often combine to make it feel hotter than it actually is.
30
lowest. Moreover, the authors demonstrate that at temperatures above this optimal level the daily mortality rate increases more rapidly per degree rise compared to when it drops below 27oC. The relationship between temperature and mortality is of particular relevance to the Maltese Islands in the light of the increased warming of the maximum and minimum air temperature observed since 1951. The increased incidence of high temperatures is mainly of concern to individuals with pre-existing medical conditions, due to increased susceptibility to morbidity which may lead to death.
With regard to specific diseases, Gatt and Calleja (2010) showed the incidence of one case rise in Salmonella infection per two degrees rise in minimum air temperature. The sustained positive trend of the annual minimum air temperature seen during the past years suggests a future scenario where Salmonellosis cases in the local population may increase. During the period 1990-2008, the authors identify two peaks of increased cases of local Salmonella outbreaks, namely 1999 and 2008, with a seasonal pattern that is clearly related to the warmer months of the year. In this regard, it is interesting to note that the yearly minimum air temperature in 2008 showed the highest deviation from the climate norm by +2.0oC, while 1999 showed the ninth highest anomaly up till 2010.
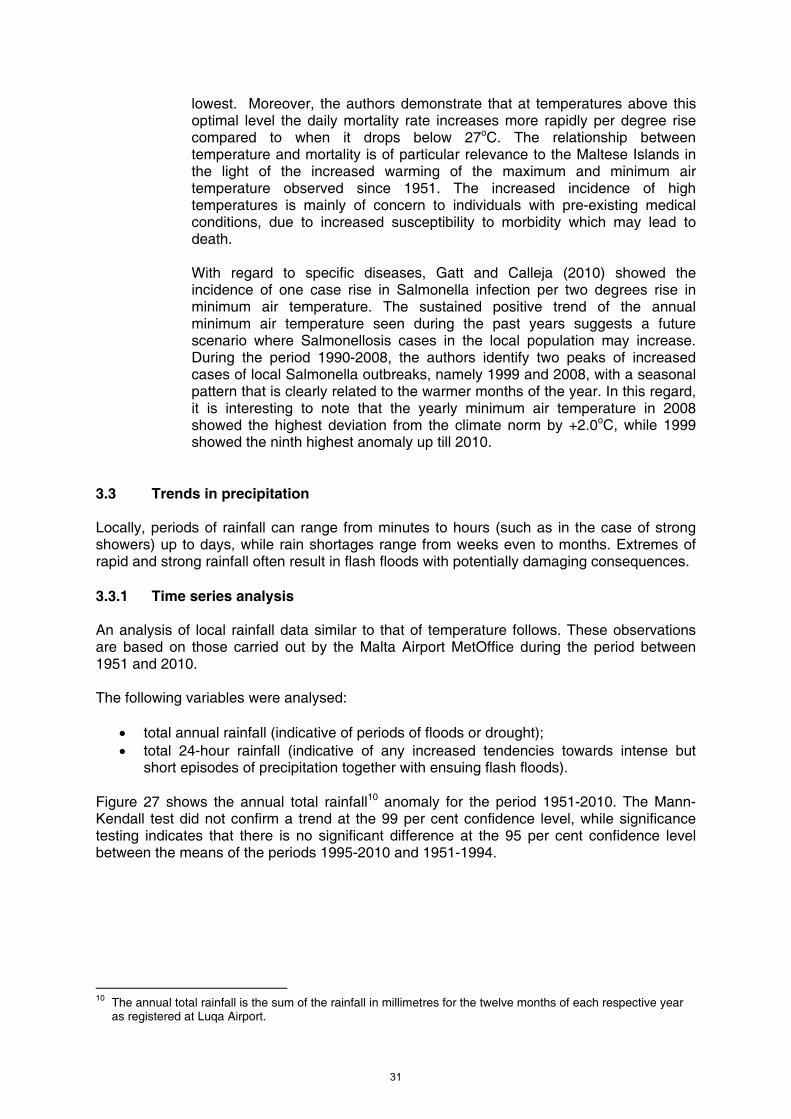
3.3 Trends in precipitation Locally, periods of rainfall can range from minutes to hours (such as in the case of strong showers) up to days, while rain shortages range from weeks even to months. Extremes of rapid and strong rainfall often result in flash floods with potentially damaging consequences. 3.3.1 Time series analysis An analysis of local rainfall data similar to that of temperature follows. These observations are based on those carried out by the Malta Airport MetOffice during the period between 1951 and 2010. The following variables were analysed:
total annual rainfall (indicative of periods of floods or drought); total 24-hour rainfall (indicative of any increased tendencies towards intense but
short episodes of precipitation together with ensuing flash floods). Figure 27 shows the annual total rainfall10 anomaly for the period 1951-2010. The Mann-Kendall test did not confirm a trend at the 99 per cent confidence level, while significance testing indicates that there is no significant difference at the 95 per cent confidence level between the means of the periods 1995-2010 and 1951-1994.
10 The annual total rainfall is the sum of the rainfall in millimetres for the twelve months of each respective year
as registered at Luqa Airport.
31
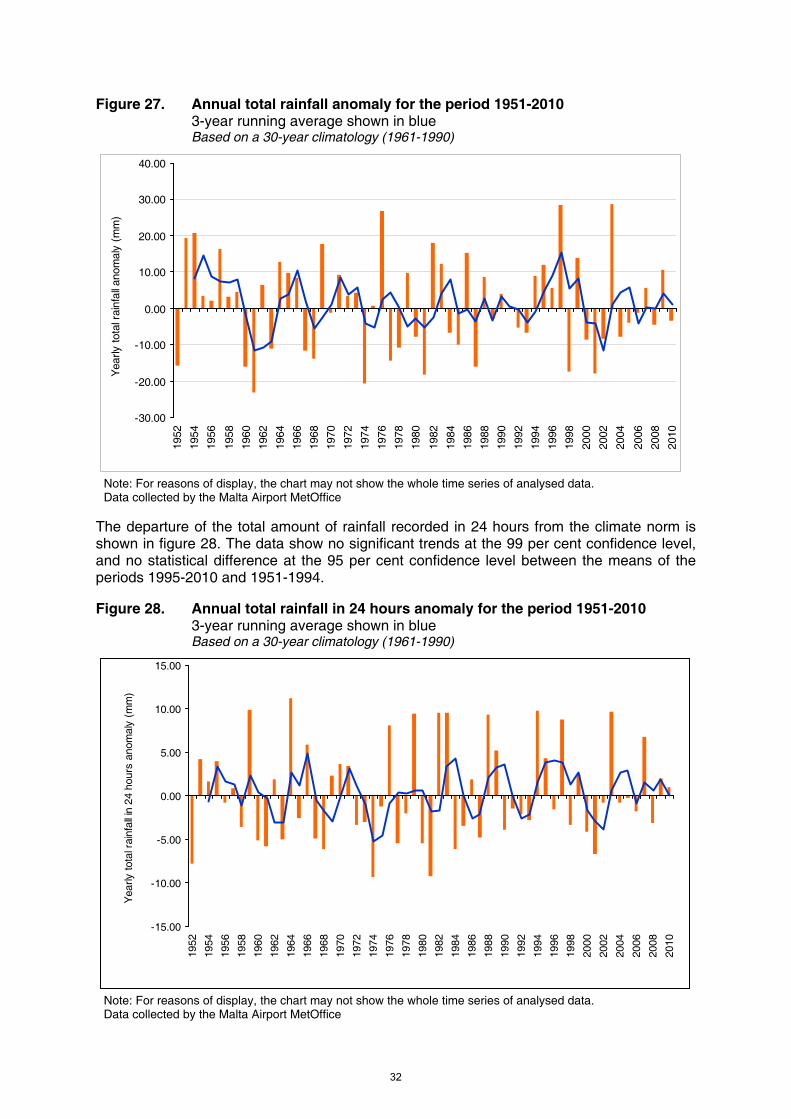
Figure 27. Annual total rainfall anomaly for the period 1951-2010 3-year running average shown in blue
Based on a 30-year climatology (1961-1990)
-30.00
-20.00
-10.00
0.00
10.00
20.00
30.00
40.0019
52
1954
1956
1958
1960
1962
1964
1966
1968
1970
1972
1974
1976
1978
1980
1982
1984
1986
1988
1990
1992
1994
1996
1998
2000
2002
2004
2006
2008
2010
Yea
rly to
tal r
ainf
all a
nom
aly
(mm
)
Note: For reasons of display, the chart may not show the whole time series of analysed data. Data collected by the Malta Airport MetOffice
The departure of the total amount of rainfall recorded in 24 hours from the climate norm is shown in figure 28. The data show no significant trends at the 99 per cent confidence level, and no statistical difference at the 95 per cent confidence level between the means of the periods 1995-2010 and 1951-1994. Figure 28. Annual total rainfall in 24 hours anomaly for the period 1951-2010 3-year running average shown in blue Based on a 30-year climatology (1961-1990)
-15.00
-10.00
-5.00
0.00
5.00
10.00
15.00
1952
1954
1956
1958
1960
1962
1964
1966
1968
1970
1972
1974
1976
1978
1980
1982
1984
1986
1988
1990
1992
1994
1996
1998
2000
2002
2004
2006
2008
2010
Yea
rly to
tal r
ainf
all i
n 24
hou
rs a
nom
aly
(mm
)
Note: For reasons of display, the chart may not show the whole time series of analysed data. Data collected by the Malta Airport MetOffice
32
3.3.1.1 Relevance to national socio-economic trends
Fruit and vegetable volume indices 1995-2009 The socio-economic data available were not sufficient to test for any statistical relationship with suitable indices.
National statistics related to fruit production by volume during the period 1995-2009 provide a general idea on the yearly trends related to fruit productivity. It is expected that a primary factor that contributes to lower fruit volume is tree stress due to drought conditions (Syvertsen and Hanlon, 2008). To strive for consistently high commercial yields, local farmers must therefore incorporate strategies to minimise the negative effects of drought.
Data related to vegetable volume index do not show any levelling or decrease in productivity due to slight increase in air temperature or no increase in rainfall. On the contrary, a gradual rise in productivity from 1995 to 2008 is evident. Factors that have triggered this increased productivity include market forces and other factors such as increased water irrigation practices. A survey conducted by the NSO showed that the volume of water used for irrigation in agriculture for the agricultural year 2008/2009 amounted to 19.1 million cubic metres (NSO, 2010) mainly extracted from the aquifer by means of private boreholes.
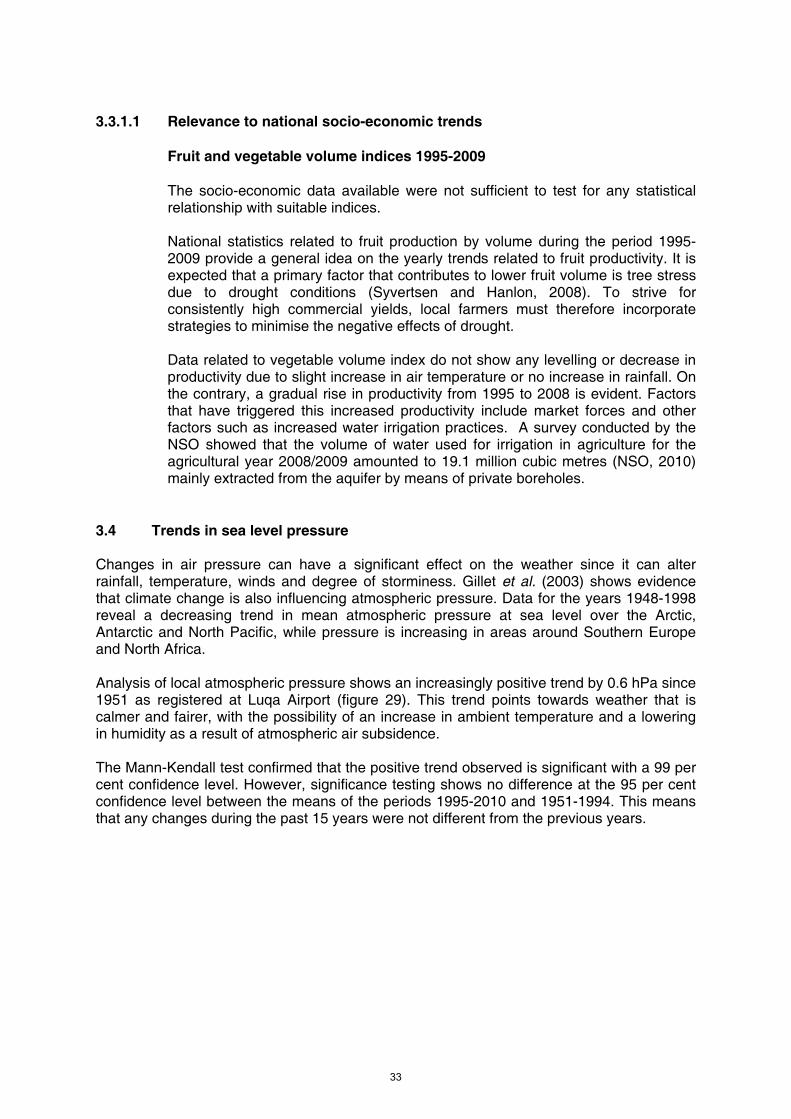
3.4 Trends in sea level pressure Changes in air pressure can have a significant effect on the weather since it can alter rainfall, temperature, winds and degree of storminess. Gillet et al. (2003) shows evidence that climate change is also influencing atmospheric pressure. Data for the years 1948-1998 reveal a decreasing trend in mean atmospheric pressure at sea level over the Arctic, Antarctic and North Pacific, while pressure is increasing in areas around Southern Europe and North Africa. Analysis of local atmospheric pressure shows an increasingly positive trend by 0.6 hPa since 1951 as registered at Luqa Airport (figure 29). This trend points towards weather that is calmer and fairer, with the possibility of an increase in ambient temperature and a lowering in humidity as a result of atmospheric air subsidence. The Mann-Kendall test confirmed that the positive trend observed is significant with a 99 per cent confidence level. However, significance testing shows no difference at the 95 per cent confidence level between the means of the periods 1995-2010 and 1951-1994. This means that any changes during the past 15 years were not different from the previous years.
33
Figure 29. Annual sea level pressure anomaly for the period 1951-2010 3-year running average shown in blue Based on a 30-year climatology (1961-1990)
-3.00
-2.50
-2.00
-1.50
-1.00
-0.50
0.00
0.50
1.00
1.50
2.00
2.50
1952
1954
1956
1958
1960
1962
1964
1966
1968
1970
1972
1974
1976
1978
1980
1982
1984
1986
1988
1990
1992
1994
1996
1998
2000
2002
2004
2006
2008
2010
Mea
n an
nual
sea
leve
l pre
ssur
e an
omal
y (h
Pa )
Note: For reasons of display, the chart may not show the whole time series of analysed data. Data collected by the Malta Airport MetOffice
Analysis shows a normal distribution of the data for the period 1951-1980 with a mean of 1,016.1 hPa, compared to an increased mean of 1,016.7 hPa shown during the period 1981-2010. Distribution fitting for all four periods (i.e. 1951-1980, 1961-1990, 1971-2000, and 1981-2010) shows a small change in variance together with a shift towards an increased mean air pressure. This means there are fewer days with lower air pressures and a higher probability that previous record highs will be exceeded. 3.4.1 Relevance to economic and social trends
a) Total fish landings by volume 1995-2009
Sustained high pressure system coupled with a reduction in storms is beneficial for fishing and general marine activities. Owners of fishing boats need not abandon their fishing trips in fairer weather, resulting in bigger overall catches.
NSO data show that the trend in fish catches by volume11 during the period 1995-2009 has increased from just above 800 to almost 1,000 tonnes. Apart from improved weather conditions, such a trend could also have been influenced by other factors (such as direct financial assistance to fishermen, and an increased demand) which may be masking the subtle trends due to climate.
11 Fish volume refers to the fish landings which pass through the official market.
34
b) Irregular immigration 2002-2009
Calm seas and longer daylight promote waves of irregular immigrants and refugees from the North African coast in hope of gaining a foothold in European countries. Refugees from the sub-Saharan continent have been using this window of opportunity to pour onto overcrowded, barely sea-worthy boats as they attempt to reach European shores.
National statistics on the arrival of these migrants show that during the period 2003-2009 the lowest number of arrivals in terms of both people and boats was in 2003. On the other hand, 2008 was the peak year in arrivals with 84 boats carrying 2,775 migrants. By 2009 arrivals dropped to 17 boats carrying 1,475 people.
These figures show no correspondence with annual climatic fluctuations; nevertheless, on a monthly basis, a good correlation between irregular immigrant arrivals and summer months exists. In 2008 and 2009 arrivals were also registered in winter months. Such arrivals are possibly motivated by a period of fair weather which would make seafaring conditions ideal. However since various factors influence the pattern of illegal immigration, it is difficult to isolate climatic factors from political and other socio-economic factors12.
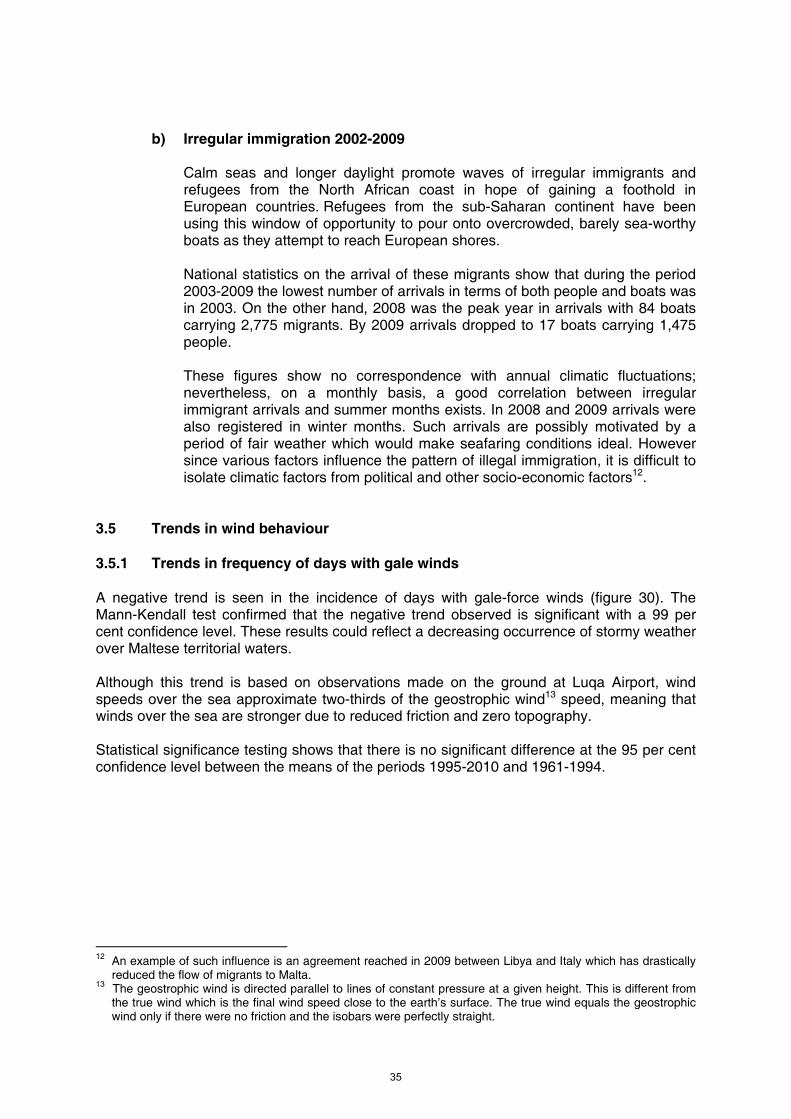
3.5 Trends in wind behaviour 3.5.1 Trends in frequency of days with gale winds A negative trend is seen in the incidence of days with gale-force winds (figure 30). The Mann-Kendall test confirmed that the negative trend observed is significant with a 99 per cent confidence level. These results could reflect a decreasing occurrence of stormy weather over Maltese territorial waters. Although this trend is based on observations made on the ground at Luqa Airport, wind speeds over the sea approximate two-thirds of the geostrophic wind13 speed, meaning that winds over the sea are stronger due to reduced friction and zero topography. Statistical significance testing shows that there is no significant difference at the 95 per cent confidence level between the means of the periods 1995-2010 and 1961-1994. 12 An example of such influence is an agreement reached in 2009 between Libya and Italy which has drastically
reduced the flow of migrants to Malta. 13 The geostrophic wind is directed parallel to lines of constant pressure at a given height. This is different from
the true wind which is the final wind speed close to the earth’s surface. The true wind equals the geostrophic wind only if there were no friction and the isobars were perfectly straight.
35
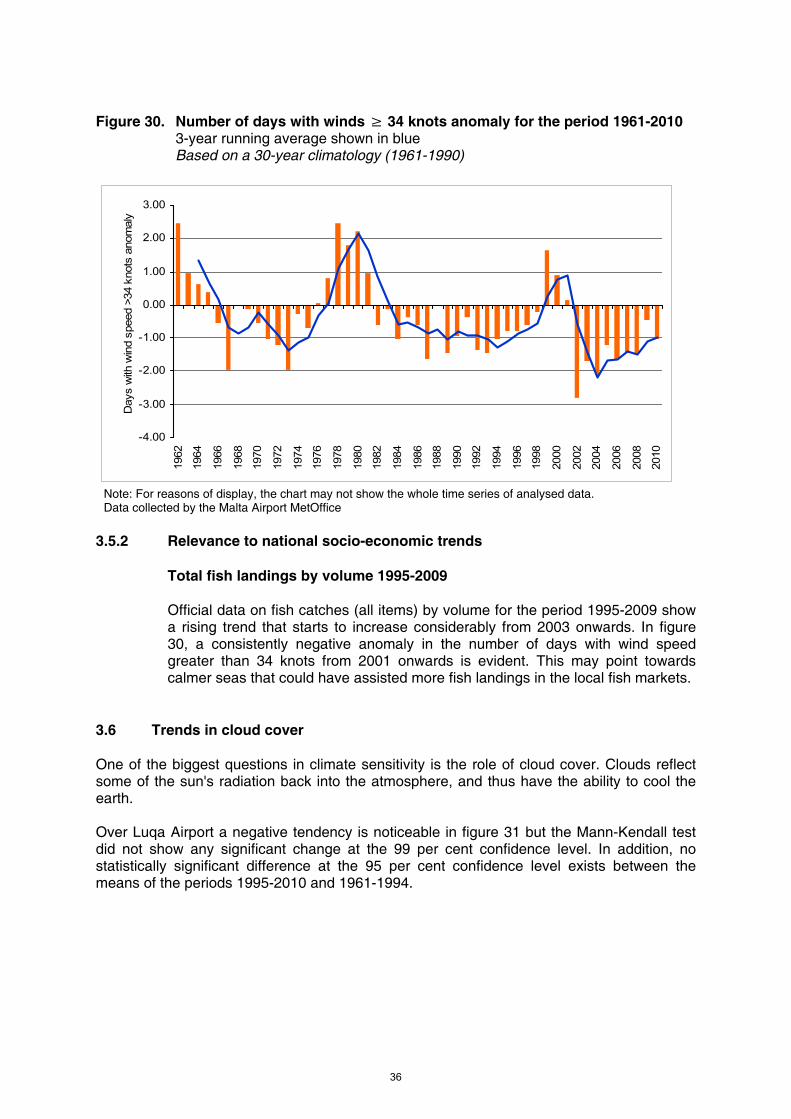
Figure 30. Number of days with winds ≥ 34 knots anomaly for the period 1961-2010 3-year running average shown in blue Based on a 30-year climatology (1961-1990)
-4.00
-3.00
-2.00
-1.00
0.00
1.00
2.00
3.00
1962
1964
1966
1968
1970
1972
1974
1976
1978
1980
1982
1984
1986
1988
1990
1992
1994
1996
1998
2000
2002
2004
2006
2008
2010
Day
s w
ith w
ind
spee
d >3
4 kn
ots
anom
aly
Note: For reasons of display, the chart may not show the whole time series of analysed data. Data collected by the Malta Airport MetOffice
3.5.2 Relevance to national socio-economic trends
Total fish landings by volume 1995-2009 Official data on fish catches (all items) by volume for the period 1995-2009 show a rising trend that starts to increase considerably from 2003 onwards. In figure 30, a consistently negative anomaly in the number of days with wind speed greater than 34 knots from 2001 onwards is evident. This may point towards calmer seas that could have assisted more fish landings in the local fish markets.
3.6 Trends in cloud cover One of the biggest questions in climate sensitivity is the role of cloud cover. Clouds reflect some of the sun's radiation back into the atmosphere, and thus have the ability to cool the earth. Over Luqa Airport a negative tendency is noticeable in figure 31 but the Mann-Kendall test did not show any significant change at the 99 per cent confidence level. In addition, no statistically significant difference at the 95 per cent confidence level exists between the means of the periods 1995-2010 and 1961-1994.
36
Figure 31. Mean annual cloud cover anomaly (in oktas) for the period 1961-2010 3-year running average shown in blue Based on a 30-year climatology (1961-1990)
-0.80
-0.60
-0.40
-0.20
0.00
0.20
0.40
0.60
0.80
1962
1964
1966
1968
1970
1972
1974
1976
1978
1980
1982
1984
1986
1988
1990
1992
1994
1996
1998
2000
2002
2004
2006
2008
2010
Me
an
clo
ud c
ove
r a
no
maly
(o
kta
s)
Note: For reasons of display, the chart may not show the whole time series of analysed data. Data collected by the Malta Airport MetOffice
3.6.1 Relevance to national socio-economic trends
Solar radiation and photovoltaics Although no significant trends are seen in the observed cloud cover, it is technically possible to suppose that a decrease in cloud cover would have a beneficial effect on the amount of electricity generated by photovoltaic cells. Photovoltaic solar panels are inefficient in low sun and cloudy conditions, and typically the output of any industrial module is reduced to 5-20 per cent of its full potential when it operates under such conditions. On a national level no statistical data are available concerning the electricity generation from such modules, mainly since the market share of photovoltaics in Malta is still of a limited nature.
37
4.0 REMARKS
The first part of this publication shows Malta’s climate norm for a number of weather elements, which should constitute official reference information for anyone who is interested in the climate of the Maltese Islands for local or comparative studies. The second part illustrates how a number of weather elements have shown stability or fluctuation when compared to this norm. Therefore there is a logical binding between the two parts of this document.
While certain weather elements show clear signs of departures from Malta’s climate norm, other indicators show no such clear sign with time.
These weather elements were chosen on the basis of our perception of climate. For some of these elements, an upward trend in the annual series is clearly evident. Specific elements are included so as to capture possible changes in the atmospheric circulation which might occur in response to this warming trend. They involve comparing year-to-year changes in the amount of rainfall, atmospheric pressure, degree of storminess, as well as cloud cover.
The behaviour of these elements in future years bears careful watching. Will they maintain current trends, thus demonstrating that the impacts of climate change are a reality in the Maltese Islands? Or will they revert to earlier conditions, suggesting that any trends were simply random behaviour or natural variability?
The linkage between these changing elements and the available socio-economic data is not straightforward. The linkage between weather or climate effect and a selected number of socio-economic trends represented in Appendix 1 could be unrelated, which instead might be more influenced by market or political factors. This highlights the necessity for more specialised work in order to produce specific socio-economic indices that could be linked to a changing climate.
4.1 Discontinuities in climate trends This document identifies a number of discontinuities in the trends of various weather elements. Such discontinuities occur at a change-point when the sequence of values stops sharing a statistical distribution evident in previous years. The most common change-point involves a discontinuity in the mean. However, other ‘external’ factors can contribute to discontinuities in climate-related time series, such as the movement of weather station location, or changes in type of instrumentation or recording practices. These factors must be considered in any climate analysis. Another aspect could be the effect of urbanisation change patterns around Luqa Airport on the local climate. The most noticeable change since 1951 is the gradual replacement of rural and agricultural areas with new urban settlements. Concrete and asphalt heat-up during the day cool only slowly at night14. Buildings and structures also change the ground-level wind flow and create eddies. However, the impact that encroaching urbanisation has on our local meteorological variables such as ambient temperature is hard to quantify.
14 The urban heat island effect is the increased rise in temperature of urbanised areas, resulting in a well-
defined, distinct "warm island" among the "cool sea" represented by the lower temperature of the area’s nearby natural landscape. Though heat islands may form on any rural or urban area, and at any spatial scale, urbanised areas are more likely to give rise to heat islands, since their surfaces are prone to release large quantities of heat. Increased temperature from some small urban areas is partly the result of this effect. At the same time this is not evidence that climate has remained unchanged.
38
Undoubtedly more research is needed to ensure that apparent significant changes are truly a real part of the larger climate. Identifying additional sites for climate monitoring is highly advisable in this case. 4.2 Statistical analysis of climate data The statistical techniques applied in this document are widely used for climate studies, essentially to characterise the level (central tendency) and variability of climate variables. The results of these statistical techniques are used for various purposes such as assessing linear relationships (including trends), and for identifying discontinuities and extreme events. In this way a scientific approach towards determining the extent of climate change is applied. During the entire observation period data “outliers” may arise due to a number of reasons including instrumental malfunction or faulty logic in data processing, communication errors (such as truncation of a digit or transposition of digits), etc. This document makes use of annual means which are ultimately based on sub-daily observations. Apart from flagging of individual outlier observations, the compilation of annual means significantly smoothens out any resultant contaminated data. 4.3 Future research At a national level, this publication is a first to attempt the correlation of weather elements with a number of socio-economic indices. Among other things, it motivates the need to expand this study by applying a number of additional, well-proven indices that could provide valuable information on the link between a changing climate and the economy. Just to name a few, the crop moisture and drought severity indices (Aigup et al., 2004) are now being used internationally to reflect the influence of severe drought and catastrophic wetness on annual crop yield for certain crop types. The Residential Energy Demand Temperature Index is another useful indicator that can provide quantitative information on the impact of seasonal temperatures on residential energy demands.
Further research could be directed to specific economic sectors that could be affected by climate change, such as the development of an Airport Weather Index that will quantify the impact of weather on aircraft takeoffs and landings due to factors such as convective storms, reduced visibility, low cloud levels and precipitation. Other indices could be developed to quantify the effect of meteorological conditions on the construction, tourism and transportation sectors, as well as an index that reflects conditions conducive to vector-borne infectious diseases. Research efforts will require close collaboration with experts in related fields and the complexity of the relationships between climatic parameters and the associated sector will, in some cases, require lengthy study periods.
39


Appendix 1

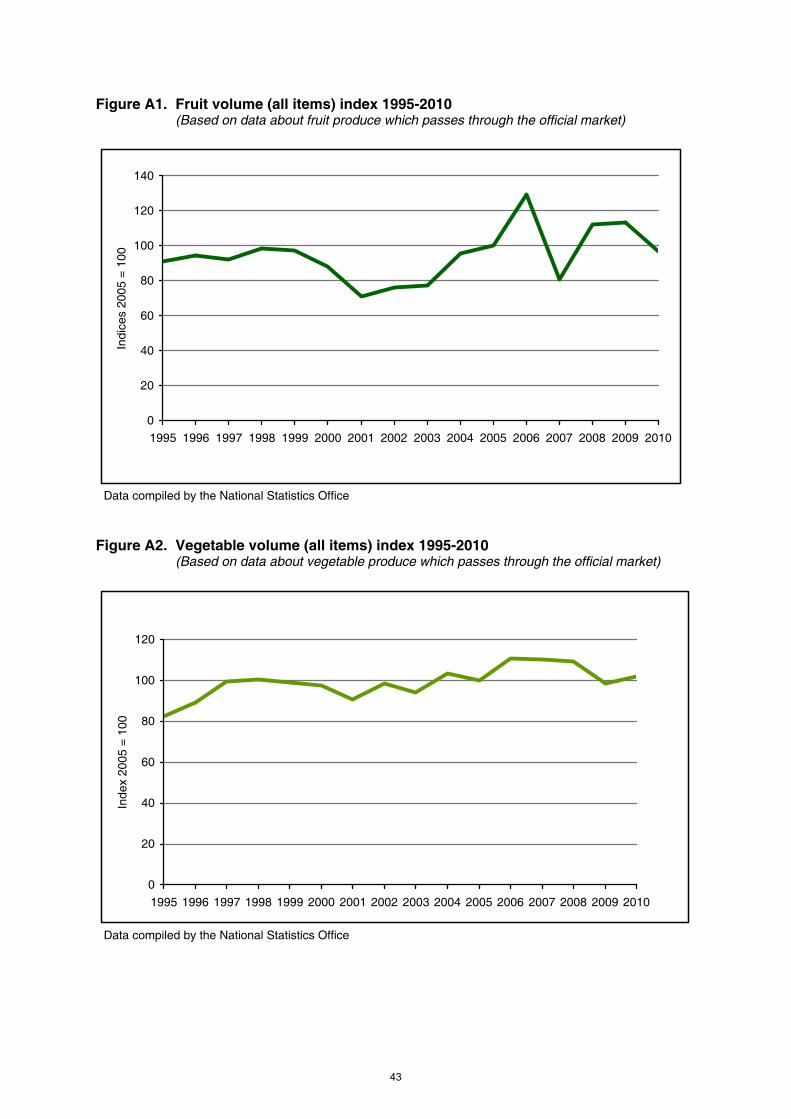
Figure A1. Fruit volume (all items) index 1995-2010 (Based on data about fruit produce which passes through the official market)
0
20
40
60
80
100
120
140
1995 1996 1997 1998 1999 2000 2001 2002 2003 2004 2005 2006 2007 2008 2009 2010
Indi
ces
2005
= 1
00
Data compiled by the National Statistics Office
Figure A2. Vegetable volume (all items) index 1995-2010 (Based on data about vegetable produce which passes through the official market)
0
20
40
60
80
100
120
1995 1996 1997 1998 1999 2000 2001 2002 2003 2004 2005 2006 2007 2008 2009 2010
Inde
x 20
05 =
100
Data compiled by the National Statistics Office
43
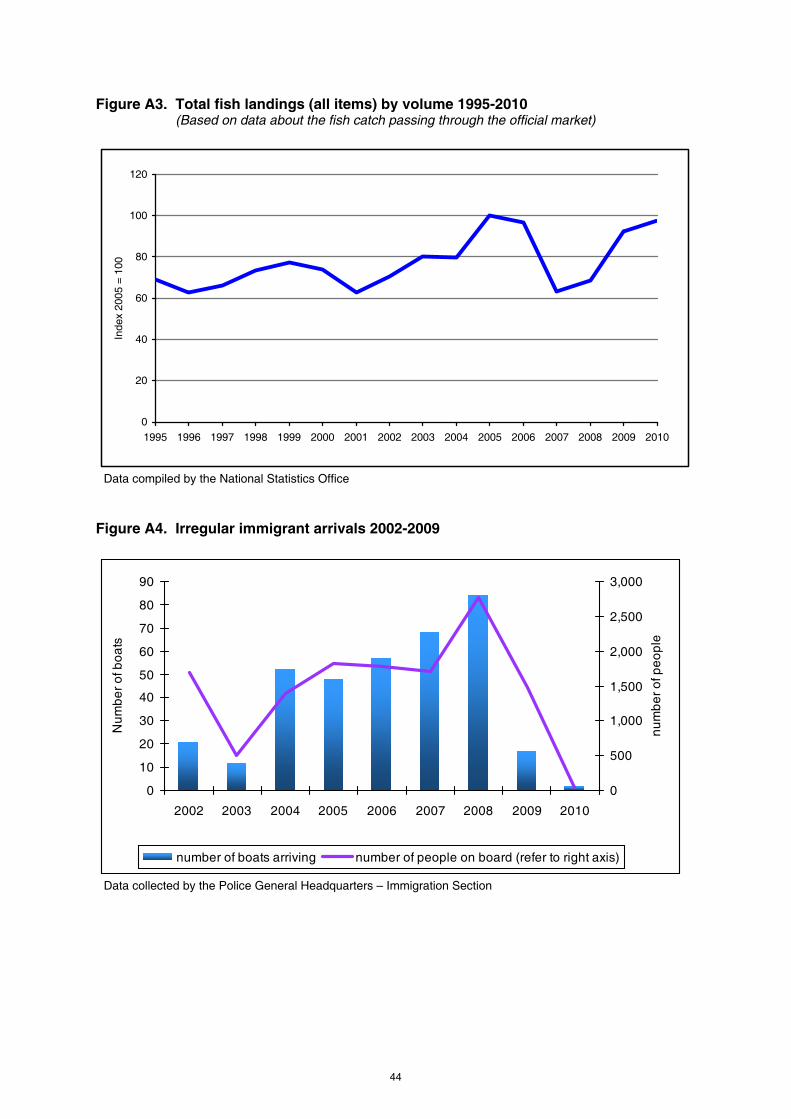
Figure A3. Total fish landings (all items) by volume 1995-2010 (Based on data about the fish catch passing through the official market)
0
20
40
60
80
100
120
1995 1996 1997 1998 1999 2000 2001 2002 2003 2004 2005 2006 2007 2008 2009 2010
Inde
x 20
05 =
100
Data compiled by the National Statistics Office
Figure A4. Irregular immigrant arrivals 2002-2009
0
10
20
30
40
50
60
70
80
90
2002 2003 2004 2005 2006 2007 2008 2009 2010
Nu
mb
er
of b
oa
ts
0
500
1,000
1,500
2,000
2,500
3,000
nu
mb
er
of p
eo
ple
number of boats arriving number of people on board (refer to right axis)
Data collected by the Police General Headquarters – Immigration Section
44
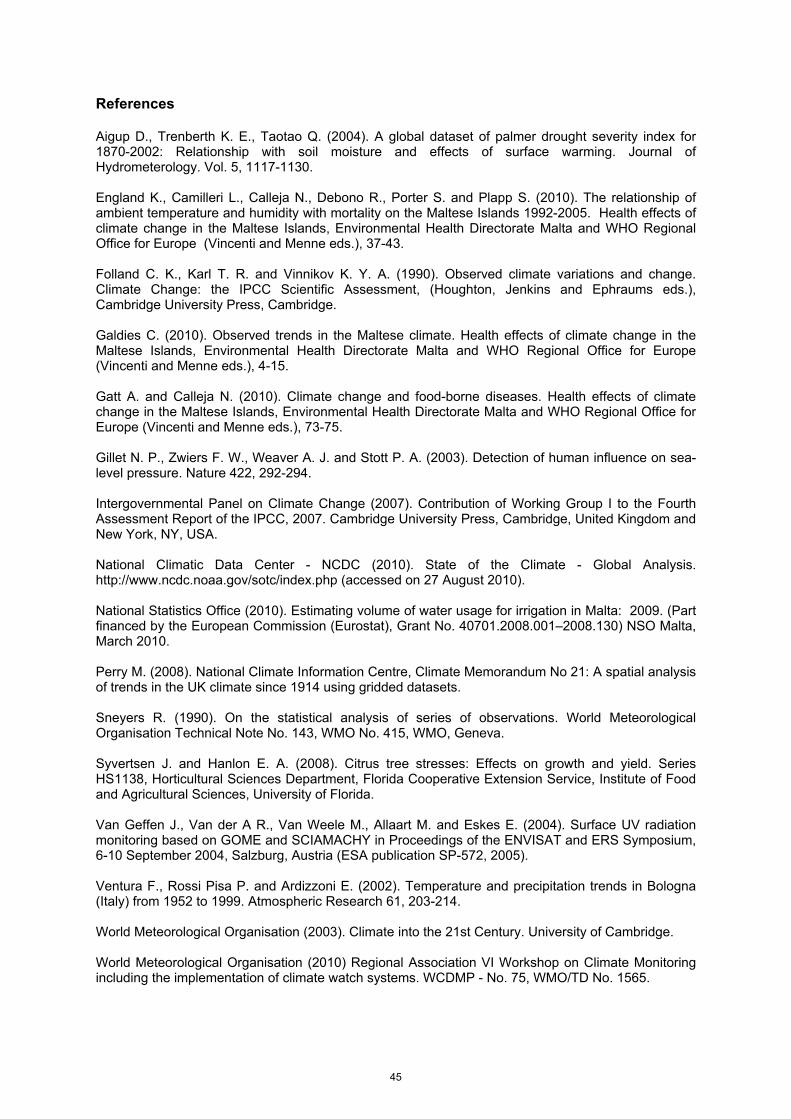
References Aigup D., Trenberth K. E., Taotao Q. (2004). A global dataset of palmer drought severity index for 1870-2002: Relationship with soil moisture and effects of surface warming. Journal of Hydrometerology. Vol. 5, 1117-1130. England K., Camilleri L., Calleja N., Debono R., Porter S. and Plapp S. (2010). The relationship of ambient temperature and humidity with mortality on the Maltese Islands 1992-2005. Health effects of climate change in the Maltese Islands, Environmental Health Directorate Malta and WHO Regional Office for Europe (Vincenti and Menne eds.), 37-43. Folland C. K., Karl T. R. and Vinnikov K. Y. A. (1990). Observed climate variations and change. Climate Change: the IPCC Scientific Assessment, (Houghton, Jenkins and Ephraums eds.), Cambridge University Press, Cambridge. Galdies C. (2010). Observed trends in the Maltese climate. Health effects of climate change in the Maltese Islands, Environmental Health Directorate Malta and WHO Regional Office for Europe (Vincenti and Menne eds.), 4-15. Gatt A. and Calleja N. (2010). Climate change and food-borne diseases. Health effects of climate change in the Maltese Islands, Environmental Health Directorate Malta and WHO Regional Office for Europe (Vincenti and Menne eds.), 73-75. Gillet N. P., Zwiers F. W., Weaver A. J. and Stott P. A. (2003). Detection of human influence on sea-level pressure. Nature 422, 292-294. Intergovernmental Panel on Climate Change (2007). Contribution of Working Group I to the Fourth Assessment Report of the IPCC, 2007. Cambridge University Press, Cambridge, United Kingdom and New York, NY, USA. National Climatic Data Center - NCDC (2010). State of the Climate - Global Analysis. http://www.ncdc.noaa.gov/sotc/index.php (accessed on 27 August 2010). National Statistics Office (2010). Estimating volume of water usage for irrigation in Malta: 2009. (Part financed by the European Commission (Eurostat), Grant No. 40701.2008.001–2008.130) NSO Malta, March 2010. Perry M. (2008). National Climate Information Centre, Climate Memorandum No 21: A spatial analysis of trends in the UK climate since 1914 using gridded datasets. Sneyers R. (1990). On the statistical analysis of series of observations. World Meteorological Organisation Technical Note No. 143, WMO No. 415, WMO, Geneva. Syvertsen J. and Hanlon E. A. (2008). Citrus tree stresses: Effects on growth and yield. Series HS1138, Horticultural Sciences Department, Florida Cooperative Extension Service, Institute of Food and Agricultural Sciences, University of Florida. Van Geffen J., Van der A R., Van Weele M., Allaart M. and Eskes E. (2004). Surface UV radiation monitoring based on GOME and SCIAMACHY in Proceedings of the ENVISAT and ERS Symposium, 6-10 September 2004, Salzburg, Austria (ESA publication SP-572, 2005). Ventura F., Rossi Pisa P. and Ardizzoni E. (2002). Temperature and precipitation trends in Bologna (Italy) from 1952 to 1999. Atmospheric Research 61, 203-214. World Meteorological Organisation (2003). Climate into the 21st Century. University of Cambridge. World Meteorological Organisation (2010) Regional Association VI Workshop on Climate Monitoring including the implementation of climate watch systems. WCDMP - No. 75, WMO/TD No. 1565.
45


