+ All Categories
Home > Documents > The clipped wing generation -...

The clipped wing generation -...

Date post: 05-Jun-2018
Category:
Upload: dangdat
View: 220 times
Download: 0 times
Share this document with a friend
22
The clipped wing generation Analysis of adults living at home with their parents From the Shelter policy library July 2014 www.shelter.org.uk © 2014 Shelter. All rights reserved. This document is only for your personal, non-commercial use. You may not copy, reproduce, republish, post, distribute, transmit or modify it in any way. This document contains information and policies that were correct at the time of publication.
Transcript

The clipped wing generation

Analysis of adults living at home with their parents From the Shelter policy library July 2014 www.shelter.org.uk © 2014 Shelter. All rights reserved. This document is only for your personal, non-commercial use. You may not copy, reproduce, republish, post, distribute, transmit or modify it in any way. This document contains information and policies that were correct at the time of publication.

The clipped wing generation

DOWNLOADED FROM THE SHELTER WEBSITE www.shelter.org.uk

© 2014 Shelter 2

Contents Adults living at home – Where and why? .............................................................................3

Summary ..............................................................................................................................3

Map .......................................................................................................................................4

Background ...........................................................................................................................5

What does this research tell us that is new?..........................................................................5

Methodology .........................................................................................................................5

Census ..............................................................................................................................5

Survey ...............................................................................................................................6

Limitations .........................................................................................................................6

How many adults are living at home and where are they concentrated? ...............................7

Why are adults living at home? ........................................................................................... 20

The impact of living at home with your parents into adulthood ............................................ 22

Conclusion .......................................................................................................................... 22

The clipped wing generation

DOWNLOADED FROM THE SHELTER WEBSITE www.shelter.org.uk

© 2014 Shelter 3

Adults living at home – Where and why?

Summary

Shelter commissioned exclusive tables from the Census 2011 and a YouGov survey of adults living at home with their parents. This was to better understand:

The exact locations where adults living at home with their parents is most common

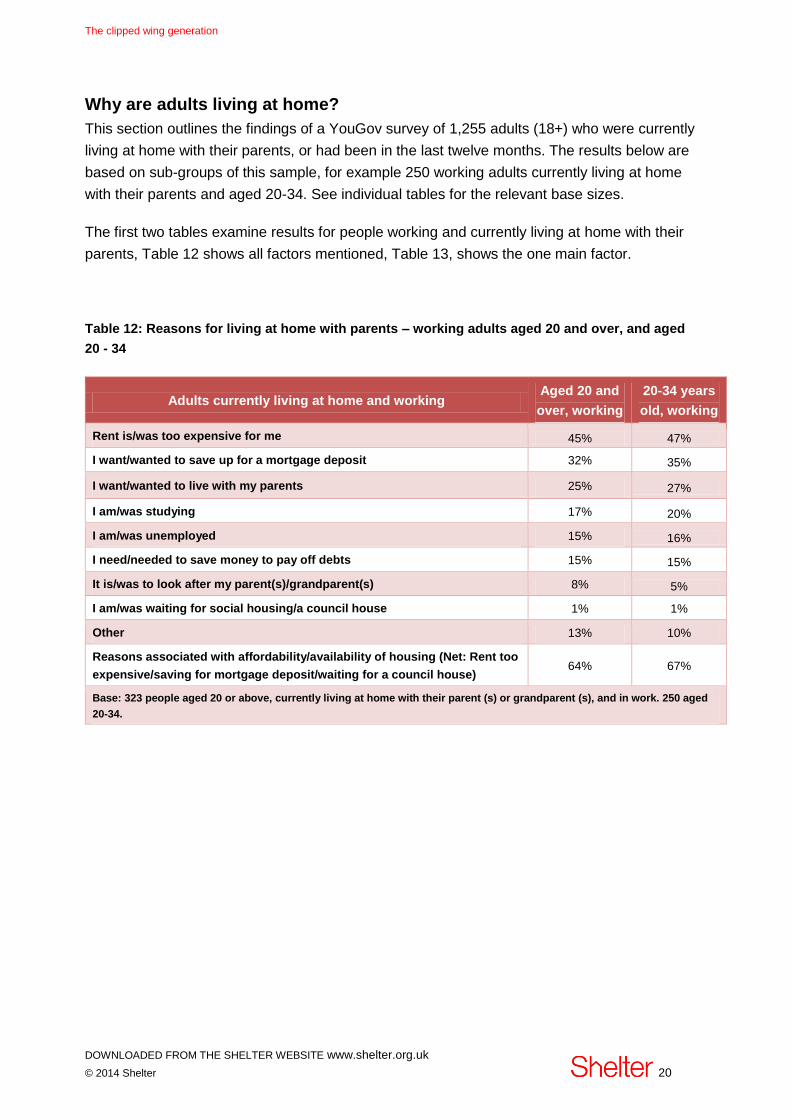
The main reasons that lie behind families living in this way This adds rich detail to the national and regional statistics on adults living at home with their parents that are already published by the ONS. In common with the ONS, the new analysis focuses on people aged 20 – 34 years old, and this report particularly focuses on working people living in this way. This new research has revealed:

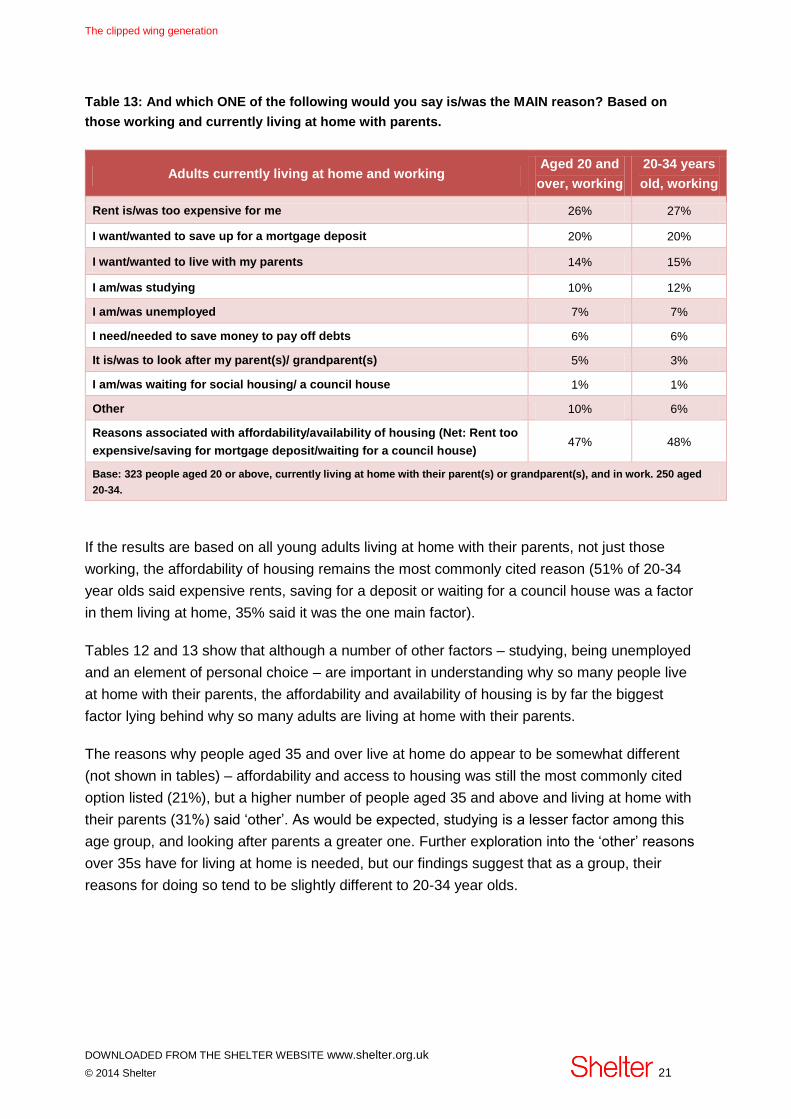
The lack of affordable housing1 is by far the main reason that people aged 20 – 34 and in work give for living at home with their parents. Among this group 67% said housing affordability was a factor in their living arrangements, and nearly half (48%) said it was the one main factor. Less than three in ten working adults aged 20-34 and living at home with their parents say they want to live with them (27%) – meaning that for 73%, it is in no way a desired choice.

Over half of working adults aged 20 – 34 who live at home with their parents (52%) are worried that this is holding them back from having an independent life.

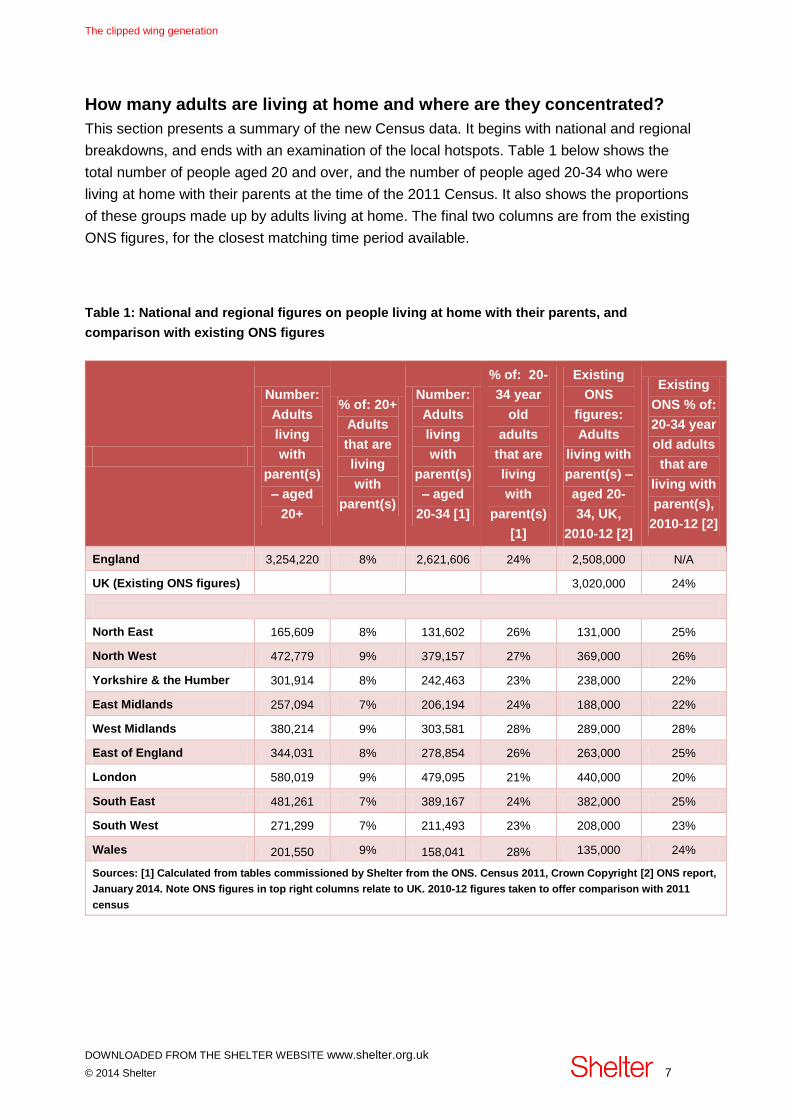
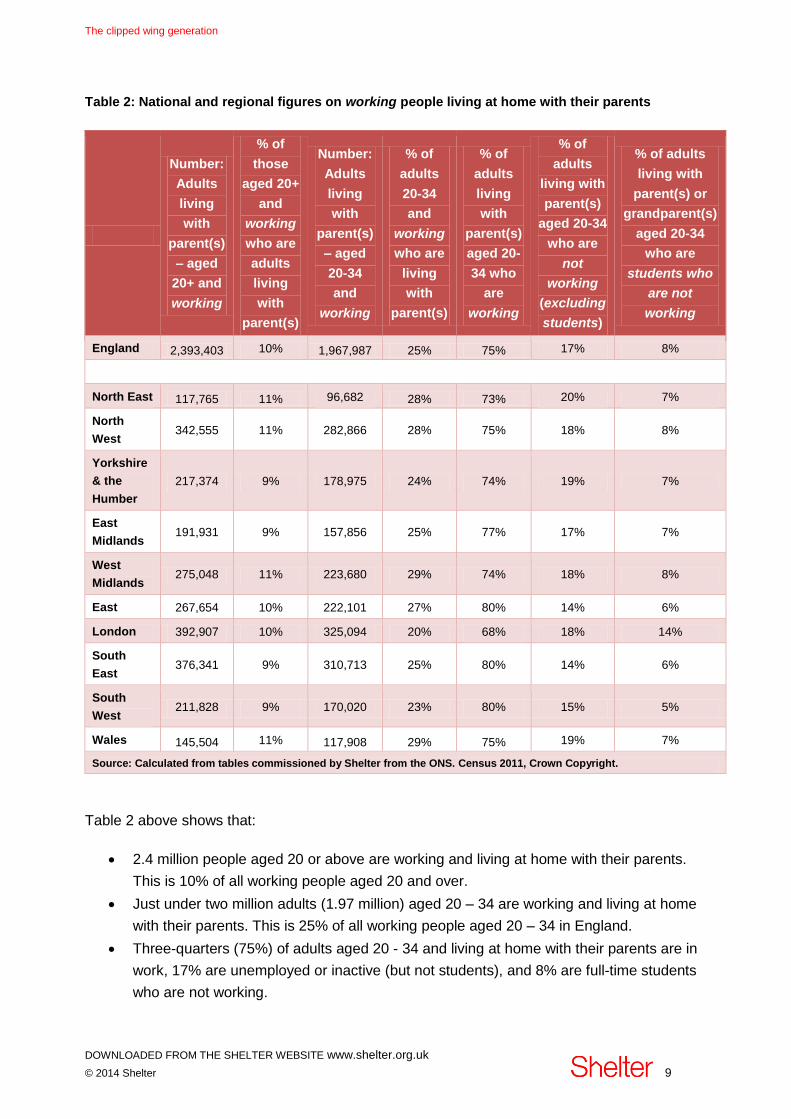
The majority (75%) of young adults living at home with their parents were working. Of the 2.62 million people aged 20 - 34 that were living at home with their parents at the time of the 2011 Census, nearly 2 million (1.97 million) of these were working.

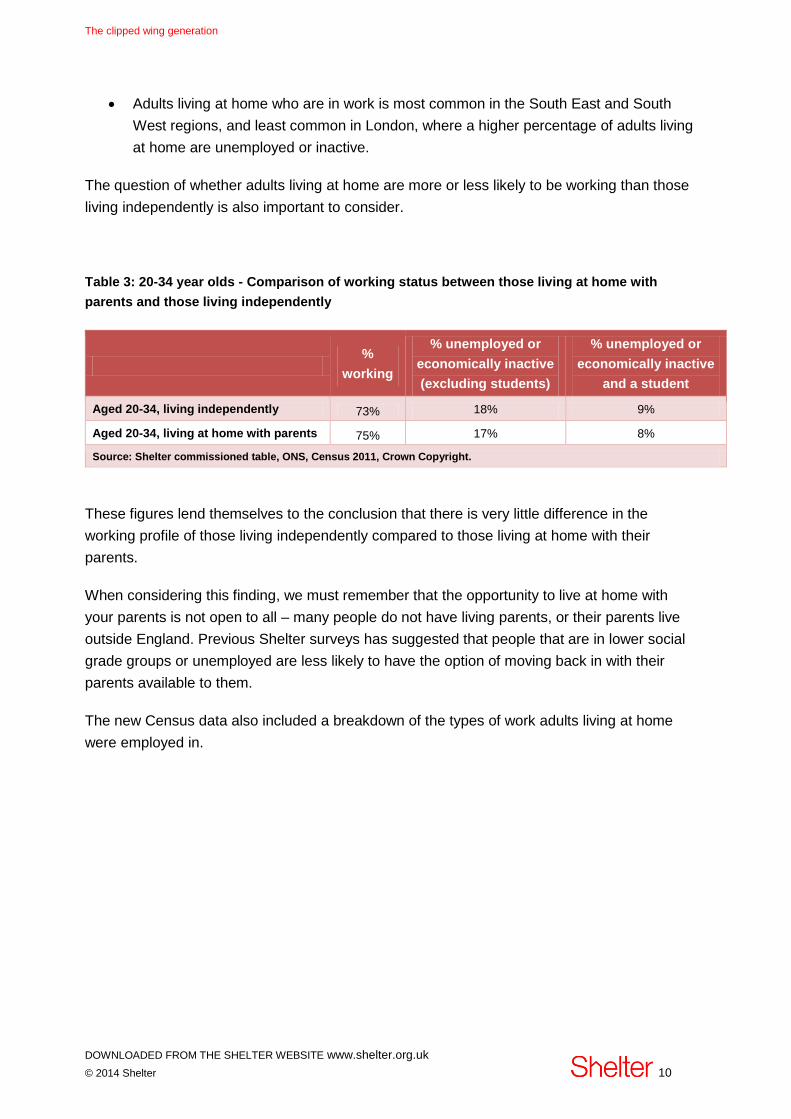
There is very little difference in the breakdown of working between the living at home and living independently populations.

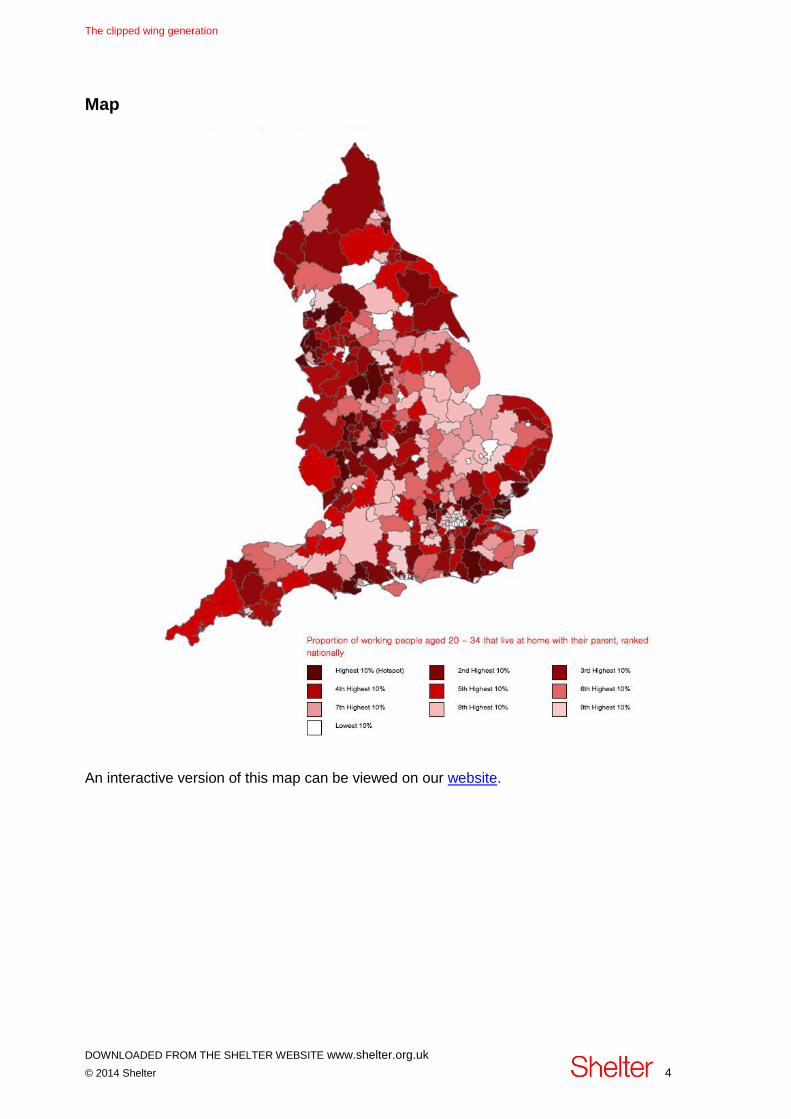
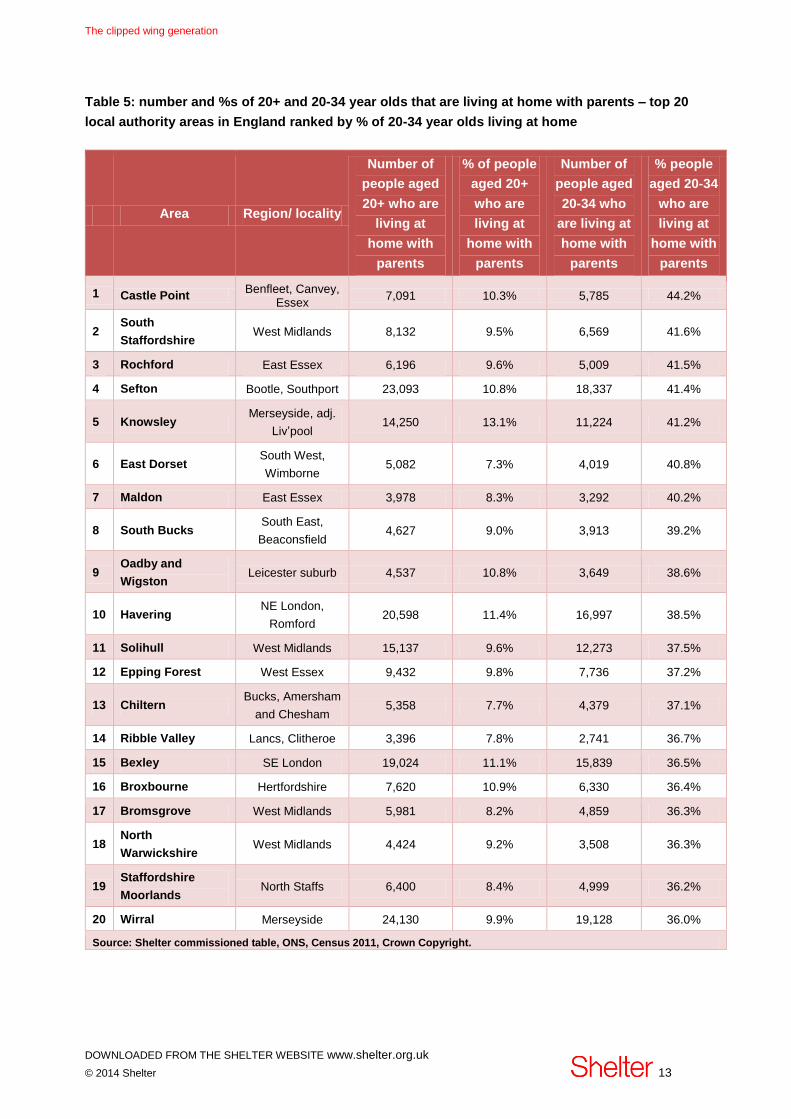
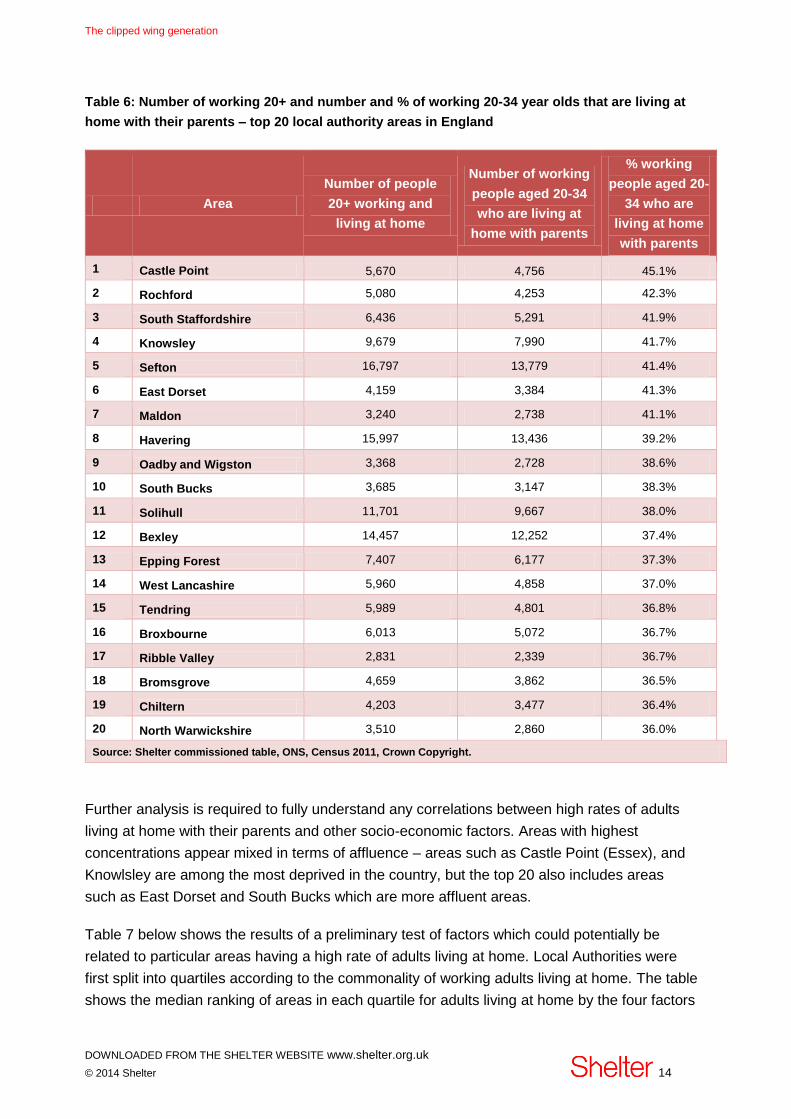
There are concentrations of local authority areas with high proportions of adults living at home in East Essex, West Essex/ Hertfordshire, Merseyside/ Lancashire and the West Midlands. In these hotspots, 4 in 10 or more working people aged 20-34 were living at home with their parents. Many of these areas are on or near established commuter routes, but some, such as the top hotspot in East Essex, are a considerable distance from the nearest major city.

Although we know from the YouGov survey that the availability and affordability of housing is the main reason lying behind why many adults are living at home in their 20s and 30s, the local areas where this is most common do not appear to be correlated to low wages or high rents. The closest relationship found is that areas with high proportions of working adults living at home also have high proportions of people in the right age range to have children aged 20 – 34. Young adults priced out of our major cities appear, simply, to be concentrated in the areas where their parents live.

1 When asked ‘Which, if any, of the following are/were reasons why you live/lived with your parent(s)/ grandparent(s) at their home in the last 12 months? (Please tick all that apply)’, answered: Rent too expensive or saving for mortgage deposit or waiting for a council house’

The clipped wing generation

DOWNLOADED FROM THE SHELTER WEBSITE www.shelter.org.uk

© 2014 Shelter 4

Map

An interactive version of this map can be viewed on our website.

The clipped wing generation

DOWNLOADED FROM THE SHELTER WEBSITE www.shelter.org.uk

© 2014 Shelter 5

Background

The topic of adults living in the parental home into their 20s and 30s has gained particular

currency since the latest publication of the ONS figures on this in January 2014. This showed

a significant upward trend in the numbers of people with these living arrangements in the UK,

with a record number in 2013. The annual ONS report is extremely revealing, but has

limitations. It does not report below the regional level, and is subject to a margin of error and

limitations on how it can be broken down, because it is based on sample surveys.

Additionally, little is known for certain about the reasons why so many young adults are living

in this way. There is debate over the extent to which the cost of housing, personal choice or

other factors are responsible.

What does this research tell us that is new?

For the first time, the Census figures give a definitive set of national, regional and local figures

on adults living at home with their parents, which are not subject to sampling error.

Other new details include splitting non-working students out from others not working and data

on the types of professions adults living at home are working in.

The Census figures do not reveal anything about the reasons why people are living in this way

and the YouGov survey was commissioned to understand this better. The survey data reveals

in detail the reasons why adults live at home with their parents and examines some of the

impacts this has on the whole family.

Methodology

Census

Shelter commissioned the ONS to generate bespoke tables showing a detailed breakdown of

adults living at home with their parents by age, working status and local authority area and

complimentary tables showing the whole population with the same breakdowns in order to

calculate the percentage results based on the Census in this report. All Census data is Crown

Copyright. The full tables are publicly available on the ONS website2.

The Census tables are based on non-dependent children – these are people living in the

family home with their parents and/or grandparents3 who are aged 18 or over, or are aged 16-

17 but are not in full-time education. If a person moves into their parent’s home to care for

2 http://www.ons.gov.uk/ons/about-ons/business-transparency/freedom-of-information/what-can-i-request/published-ad-hoc-data/index.html 3 For simplicitly we refer to ‘living at home with parents’ throughout this report, but grandparents are always included in this definition.

The clipped wing generation

DOWNLOADED FROM THE SHELTER WEBSITE www.shelter.org.uk

© 2014 Shelter 6

them this would be included, but if a parent moves into a home their child owns or rents to be

cared for this would not count. This is the standard ONS definition of an ‘adult living at home’

and is the same base definition that is used in ONS figures on this topic. In common with the

ONS, the report focuses on the 20-34 age group, primarily to aid consistent comparison with

the wider population4, but also because our survey results suggests the reasons why those

over 35 live at home with their parents are somewhat different. In this report, we particularly

focus on people who are working and living at home with their parents. This report focuses on

data for England, but full data for Wales is available via the ONS website.

Survey

Shelter commissioned YouGov to carry out a survey of 1,255 adults (18+) who were currently

living at home with their parents, or had been in the last twelve months. 1,036 of these were

aged 20 or above, and 250 were aged 20-34, working and currently living at home with their

parents. Parents who have themselves had an adult child living with them in the last two years

were surveyed separately (760). Fieldwork was undertaken between 20th and 24th June 2014.

Total sample size was 9,370 adults. The figures were weighted to be representative of all UK

adults (aged 18+). The survey was carried out online.

Sample sizes are quoted on tables and charts throughout this report.

Limitations

This research focused only on those adults who are able to live at home with their parents.

However, it is very important to consider that not all people have an equal – or even any –

opportunity to be an adult living at home. Many people living in England do not have living

parents (particularly further up the age range), or their parents may be living outside the UK. If

a person’s parents are living in the UK, factors such as the size of their home and its location

will influence the feasibility of a person living in their home.

4 This is because of the demographic differences between different local areas, particularly differences in the age profile of the 20+ population. If we use all people 20 and above to compare, areas with higher populations aged in their 70s and older will likely appear to have a smaller %s of adults living at home – at the top of the age range people are very unlikely to have parents alive, but also their own children will be in the older age groups where living at home is rarer. Additionally the 20+ population includes retired people and is not useful for comparisons of the working population.

The clipped wing generation

DOWNLOADED FROM THE SHELTER WEBSITE www.shelter.org.uk

© 2014 Shelter 7

How many adults are living at home and where are they concentrated?

This section presents a summary of the new Census data. It begins with national and regional

breakdowns, and ends with an examination of the local hotspots. Table 1 below shows the

total number of people aged 20 and over, and the number of people aged 20-34 who were

living at home with their parents at the time of the 2011 Census. It also shows the proportions

of these groups made up by adults living at home. The final two columns are from the existing

ONS figures, for the closest matching time period available.

Table 1: National and regional figures on people living at home with their parents, and

comparison with existing ONS figures

Number:

Adults

living

with

parent(s)

– aged

20+

% of: 20+

Adults

that are

living

with

parent(s)

Number:

Adults

living

with

parent(s)

– aged

20-34 [1]

% of: 20-

34 year

old

adults

that are

living

with

parent(s)

[1]

Existing

ONS

figures:

Adults

living with

parent(s) –

aged 20-

34, UK,

2010-12 [2]

Existing

ONS % of:

20-34 year

old adults

that are

living with

parent(s),

2010-12 [2]

England 3,254,220 8% 2,621,606 24% 2,508,000 N/A

UK (Existing ONS figures) 3,020,000 24%

North East 165,609 8% 131,602 26% 131,000 25%

North West 472,779 9% 379,157 27% 369,000 26%

Yorkshire & the Humber 301,914 8% 242,463 23% 238,000 22%

East Midlands 257,094 7% 206,194 24% 188,000 22%

West Midlands 380,214 9% 303,581 28% 289,000 28%

East of England 344,031 8% 278,854 26% 263,000 25%

London 580,019 9% 479,095 21% 440,000 20%

South East 481,261 7% 389,167 24% 382,000 25%

South West 271,299 7% 211,493 23% 208,000 23%

Wales 201,550 9% 158,041 28% 135,000 24%

Sources: [1] Calculated from tables commissioned by Shelter from the ONS. Census 2011, Crown Copyright [2] ONS report,

January 2014. Note ONS figures in top right columns relate to UK. 2010-12 figures taken to offer comparison with 2011

census

The clipped wing generation

DOWNLOADED FROM THE SHELTER WEBSITE www.shelter.org.uk

© 2014 Shelter 8

Table 1 above shows us that:

In total there were 3.25 million people aged 20 or older living as adults in the family

home in England.

2.62 million were aged 20-34. This is the ONS definition of an adult living at home, and

is the basis of their annual reports.

When compared like-for-like, the new Census figures are very close to the sample

survey based figures previously published by ONS, at both national and regional

levels. This suggests that we can be confident in the accuracy of the previously

published data, and also suggests that the new data is based on the same definitions

as that already published by ONS, and can be reliably broken down further.

When this group is defined as aged 20-34, London has the lowest percentage of adults

living at home (21%). This is in common with the annual ONS findings. However, when

all adults aged 20 or above are included, London has the highest percentage of adults

living at home, at 9.4%. This is driven by a relatively high number of people (100,000)

aged over 35 in London who live with their parents.

Understanding the size of the working population that are living at home with their parents, and

whether there are differences in the breakdown of working and not working between those

living at home and independently is also important. Tables 2, 3 and 4 examine working people

living at home with their parents in more detail.

The clipped wing generation

DOWNLOADED FROM THE SHELTER WEBSITE www.shelter.org.uk

© 2014 Shelter 9

Table 2: National and regional figures on working people living at home with their parents

Number:

Adults

living

with

parent(s)

– aged

20+ and

working

% of

those

aged 20+

and

working

who are

adults

living

with

parent(s)

Number:

Adults

living

with

parent(s)

– aged

20-34

and

working

% of

adults

20-34

and

working

who are

living

with

parent(s)

% of

adults

living

with

parent(s)

aged 20-

34 who

are

working

% of

adults

living with

parent(s)

aged 20-34

who are

not

working

(excluding

students)

% of adults

living with

parent(s) or

grandparent(s)

aged 20-34

who are

students who

are not

working

England 2,393,403 10% 1,967,987 25% 75% 17% 8%

North East 117,765 11% 96,682 28% 73% 20% 7%

North

West 342,555 11% 282,866 28% 75% 18% 8%

Yorkshire

& the

Humber

217,374 9% 178,975 24% 74% 19% 7%

East

Midlands 191,931 9% 157,856 25% 77% 17% 7%

West

Midlands 275,048 11% 223,680 29% 74% 18% 8%

East 267,654 10% 222,101 27% 80% 14% 6%

London 392,907 10% 325,094 20% 68% 18% 14%

South

East 376,341 9% 310,713 25% 80% 14% 6%

South

West 211,828 9% 170,020 23% 80% 15% 5%

Wales 145,504 11% 117,908 29% 75% 19% 7%

Source: Calculated from tables commissioned by Shelter from the ONS. Census 2011, Crown Copyright.

Table 2 above shows that:

2.4 million people aged 20 or above are working and living at home with their parents.

This is 10% of all working people aged 20 and over.

Just under two million adults (1.97 million) aged 20 – 34 are working and living at home

with their parents. This is 25% of all working people aged 20 – 34 in England.

Three-quarters (75%) of adults aged 20 - 34 and living at home with their parents are in

work, 17% are unemployed or inactive (but not students), and 8% are full-time students

who are not working.

The clipped wing generation

DOWNLOADED FROM THE SHELTER WEBSITE www.shelter.org.uk

© 2014 Shelter 10

Adults living at home who are in work is most common in the South East and South

West regions, and least common in London, where a higher percentage of adults living

at home are unemployed or inactive.

The question of whether adults living at home are more or less likely to be working than those

living independently is also important to consider.

Table 3: 20-34 year olds - Comparison of working status between those living at home with

parents and those living independently

%

working

% unemployed or

economically inactive

(excluding students)

% unemployed or

economically inactive

and a student

Aged 20-34, living independently 73% 18% 9%

Aged 20-34, living at home with parents 75% 17% 8%

Source: Shelter commissioned table, ONS, Census 2011, Crown Copyright.

These figures lend themselves to the conclusion that there is very little difference in the

working profile of those living independently compared to those living at home with their

parents.

When considering this finding, we must remember that the opportunity to live at home with

your parents is not open to all – many people do not have living parents, or their parents live

outside England. Previous Shelter surveys has suggested that people that are in lower social

grade groups or unemployed are less likely to have the option of moving back in with their

parents available to them.

The new Census data also included a breakdown of the types of work adults living at home

were employed in.

The clipped wing generation

DOWNLOADED FROM THE SHELTER WEBSITE www.shelter.org.uk

© 2014 Shelter 11

Table 4: Working adults living at home with parents – types of job/ profession using Standard

Occupational Classification5

Number of

adults

living with

parents,

20+, by

profession

(SOC)

% of people

aged 20 +

and working

in these

professions

that are

adults living

at home

with parents

Number of

adults

living with

parents,

20-34, by

profession

(SOC)

% of people

working in

these

professions

aged 20-34

that are

adults living

at home

with parents

All in work 2,393,403 10% 1,967,987 25%

Managers, directors and senior officials 134,189 5% 103,300 17%

Professional occupations 246,843 6% 202,218 14%

Associate professional and technical occupations

307,782 10% 263,948 21%

Administrative and secretarial occupations 292,097 10% 237,978 28%

Skilled trades occupations 324,110 12% 255,513 31%

Caring, leisure and other service occupations 228,267 10% 201,128 26%

Sales and customer service occupations 353,183 19% 321,272 38%

Process, plant and machine operatives 352,388 16% 225,520 29%

Elementary occupations 344,592 14% 275,400 30%

Source: Shelter commissioned table, ONS, Census 2011, Crown Copyright. Based on SOC classifications, see below for

more detail on SOC classification.

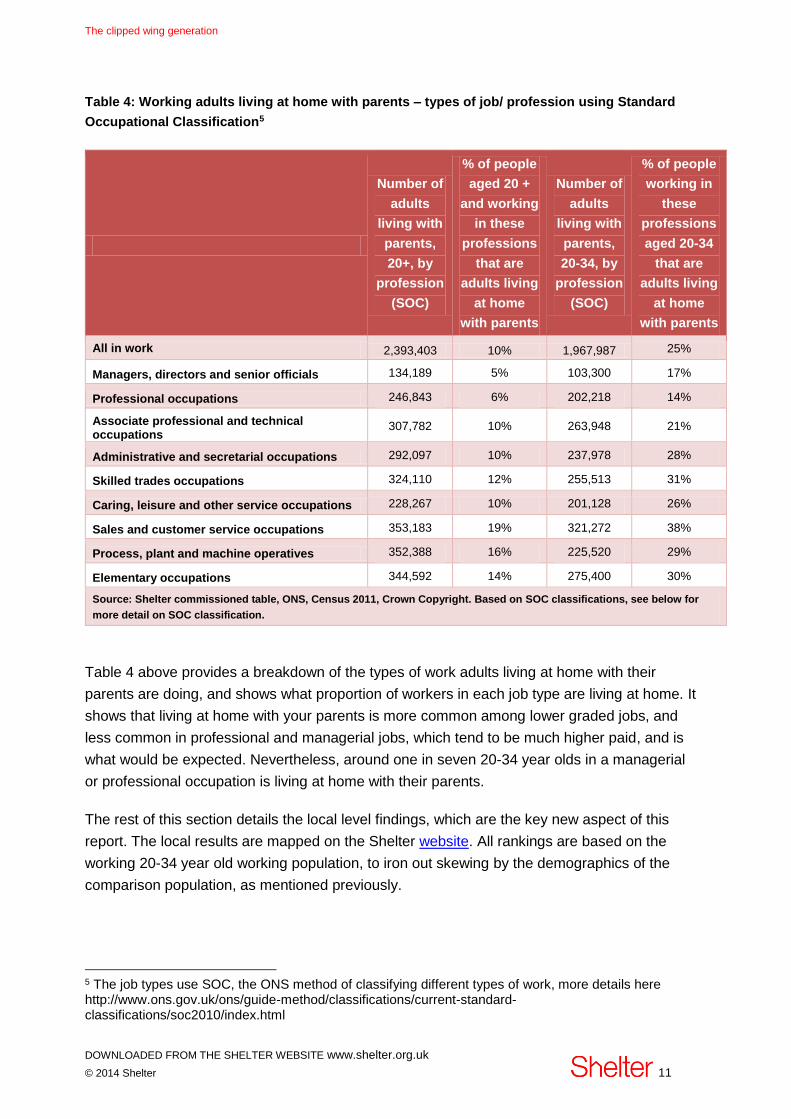
Table 4 above provides a breakdown of the types of work adults living at home with their

parents are doing, and shows what proportion of workers in each job type are living at home. It

shows that living at home with your parents is more common among lower graded jobs, and

less common in professional and managerial jobs, which tend to be much higher paid, and is

what would be expected. Nevertheless, around one in seven 20-34 year olds in a managerial

or professional occupation is living at home with their parents.

The rest of this section details the local level findings, which are the key new aspect of this

report. The local results are mapped on the Shelter website. All rankings are based on the

working 20-34 year old working population, to iron out skewing by the demographics of the

comparison population, as mentioned previously.

5 The job types use SOC, the ONS method of classifying different types of work, more details here http://www.ons.gov.uk/ons/guide-method/classifications/current-standard-classifications/soc2010/index.html

The clipped wing generation

DOWNLOADED FROM THE SHELTER WEBSITE www.shelter.org.uk

© 2014 Shelter 12

Hotspots of adult children living at home are spread all over England, and include a range of

types of areas, although some interesting concentrations include:

East Essex

Merseyside and Lancashire

West Midlands

The hotspots are very similar regardless of whether we analyse by all adults living at home

(see table 5), or just those working (see table 6).

The clipped wing generation

DOWNLOADED FROM THE SHELTER WEBSITE www.shelter.org.uk

© 2014 Shelter 13

Table 5: number and %s of 20+ and 20-34 year olds that are living at home with parents – top 20

local authority areas in England ranked by % of 20-34 year olds living at home

Area Region/ locality

Number of

people aged

20+ who are

living at

home with

parents

% of people

aged 20+

who are

living at

home with

parents

Number of

people aged

20-34 who

are living at

home with

parents

% people

aged 20-34

who are

living at

home with

parents

1 Castle Point Benfleet, Canvey,

Essex 7,091 10.3% 5,785 44.2%

2 South

Staffordshire West Midlands 8,132 9.5% 6,569 41.6%

3 Rochford East Essex 6,196 9.6% 5,009 41.5%

4 Sefton Bootle, Southport 23,093 10.8% 18,337 41.4%

5 Knowsley Merseyside, adj.

Liv’pool 14,250 13.1% 11,224 41.2%

6 East Dorset South West,

Wimborne 5,082 7.3% 4,019 40.8%

7 Maldon East Essex 3,978 8.3% 3,292 40.2%

8 South Bucks South East,

Beaconsfield 4,627 9.0% 3,913 39.2%

9 Oadby and

Wigston Leicester suburb 4,537 10.8% 3,649 38.6%

10 Havering NE London,

Romford 20,598 11.4% 16,997 38.5%

11 Solihull West Midlands 15,137 9.6% 12,273 37.5%

12 Epping Forest West Essex 9,432 9.8% 7,736 37.2%

13 Chiltern Bucks, Amersham

and Chesham 5,358 7.7% 4,379 37.1%

14 Ribble Valley Lancs, Clitheroe 3,396 7.8% 2,741 36.7%

15 Bexley SE London 19,024 11.1% 15,839 36.5%

16 Broxbourne Hertfordshire 7,620 10.9% 6,330 36.4%

17 Bromsgrove West Midlands 5,981 8.2% 4,859 36.3%

18 North

Warwickshire West Midlands 4,424 9.2% 3,508 36.3%

19 Staffordshire

Moorlands North Staffs 6,400 8.4% 4,999 36.2%

20 Wirral Merseyside 24,130 9.9% 19,128 36.0%

Source: Shelter commissioned table, ONS, Census 2011, Crown Copyright.

The clipped wing generation

DOWNLOADED FROM THE SHELTER WEBSITE www.shelter.org.uk

© 2014 Shelter 14

Table 6: Number of working 20+ and number and % of working 20-34 year olds that are living at

home with their parents – top 20 local authority areas in England

Area

Number of people

20+ working and

living at home

Number of working

people aged 20-34

who are living at

home with parents

% working

people aged 20-

34 who are

living at home

with parents

1 Castle Point 5,670 4,756 45.1%

2 Rochford 5,080 4,253 42.3%

3 South Staffordshire 6,436 5,291 41.9%

4 Knowsley 9,679 7,990 41.7%

5 Sefton 16,797 13,779 41.4%

6 East Dorset 4,159 3,384 41.3%

7 Maldon 3,240 2,738 41.1%

8 Havering 15,997 13,436 39.2%

9 Oadby and Wigston 3,368 2,728 38.6%

10 South Bucks 3,685 3,147 38.3%

11 Solihull 11,701 9,667 38.0%

12 Bexley 14,457 12,252 37.4%

13 Epping Forest 7,407 6,177 37.3%

14 West Lancashire 5,960 4,858 37.0%

15 Tendring 5,989 4,801 36.8%

16 Broxbourne 6,013 5,072 36.7%

17 Ribble Valley 2,831 2,339 36.7%

18 Bromsgrove 4,659 3,862 36.5%

19 Chiltern 4,203 3,477 36.4%

20 North Warwickshire 3,510 2,860 36.0%

Source: Shelter commissioned table, ONS, Census 2011, Crown Copyright.

Further analysis is required to fully understand any correlations between high rates of adults

living at home with their parents and other socio-economic factors. Areas with highest

concentrations appear mixed in terms of affluence – areas such as Castle Point (Essex), and

Knowlsley are among the most deprived in the country, but the top 20 also includes areas

such as East Dorset and South Bucks which are more affluent areas.

Table 7 below shows the results of a preliminary test of factors which could potentially be

related to particular areas having a high rate of adults living at home. Local Authorities were

first split into quartiles according to the commonality of working adults living at home. The table

shows the median ranking of areas in each quartile for adults living at home by the four factors

The clipped wing generation

DOWNLOADED FROM THE SHELTER WEBSITE www.shelter.org.uk

© 2014 Shelter 15

tested – wages, rents, the proportion of 45-64 year olds in the local population, and index of

multiple deprivation ranking.

Table 7: Adults living at home, wages, rents, % of population aged 45-64, and IMD ranking

Local Authority Areas

in Quartiles: Adults

aged 20-34 working and

living at home

Median

ranking:

Median wage

Median ranking:

Median 1

bedroom flat rent

Median ranking:

% 45-64 year

olds in total

population

Median ranking: Index

of Multiple Deprivation rank (2010)

Quartile 1 (highest rates) 153 153 89 200

Q2 177 199 102 166

Q3 178 196 154 154

Q4 (lowest rates) 136 93 272 118

Sources: Shelter commissioned table, ONS, Census 2011, Crown Copyright. Wages: ASHE survey, ONS, 2013. Rents: VOA,

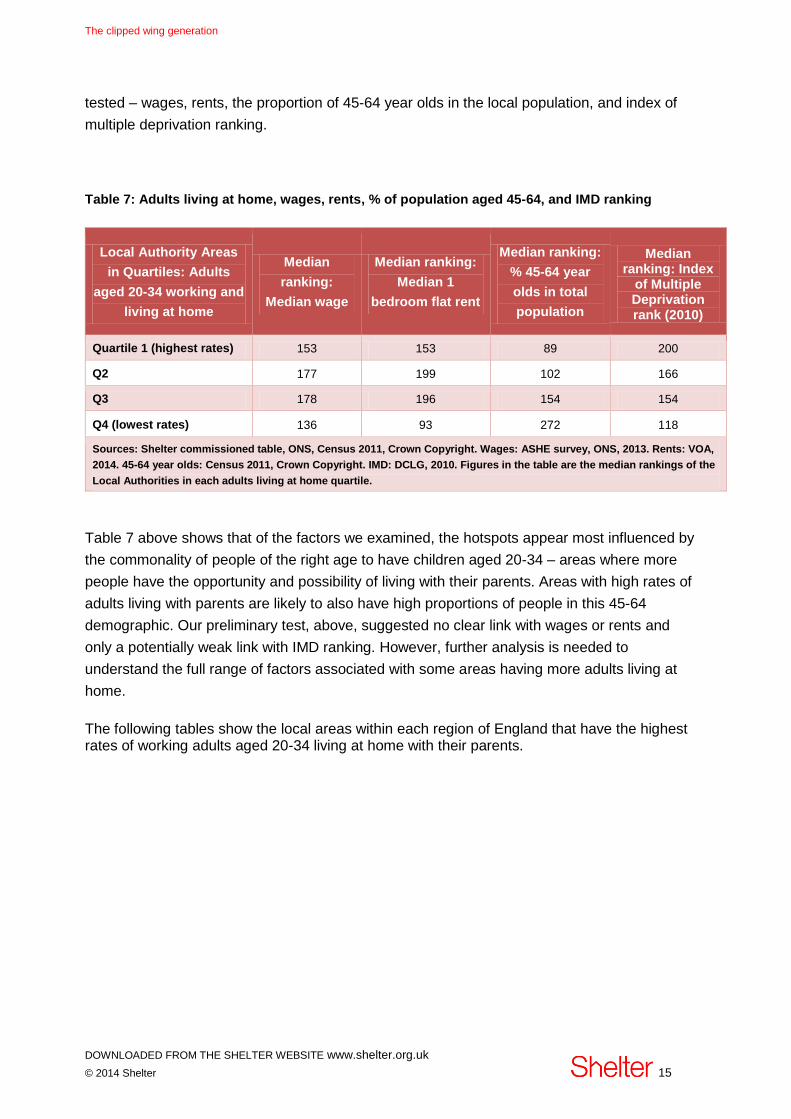
2014. 45-64 year olds: Census 2011, Crown Copyright. IMD: DCLG, 2010. Figures in the table are the median rankings of the

Local Authorities in each adults living at home quartile.

Table 7 above shows that of the factors we examined, the hotspots appear most influenced by

the commonality of people of the right age to have children aged 20-34 – areas where more

people have the opportunity and possibility of living with their parents. Areas with high rates of

adults living with parents are likely to also have high proportions of people in this 45-64

demographic. Our preliminary test, above, suggested no clear link with wages or rents and

only a potentially weak link with IMD ranking. However, further analysis is needed to

understand the full range of factors associated with some areas having more adults living at

home.

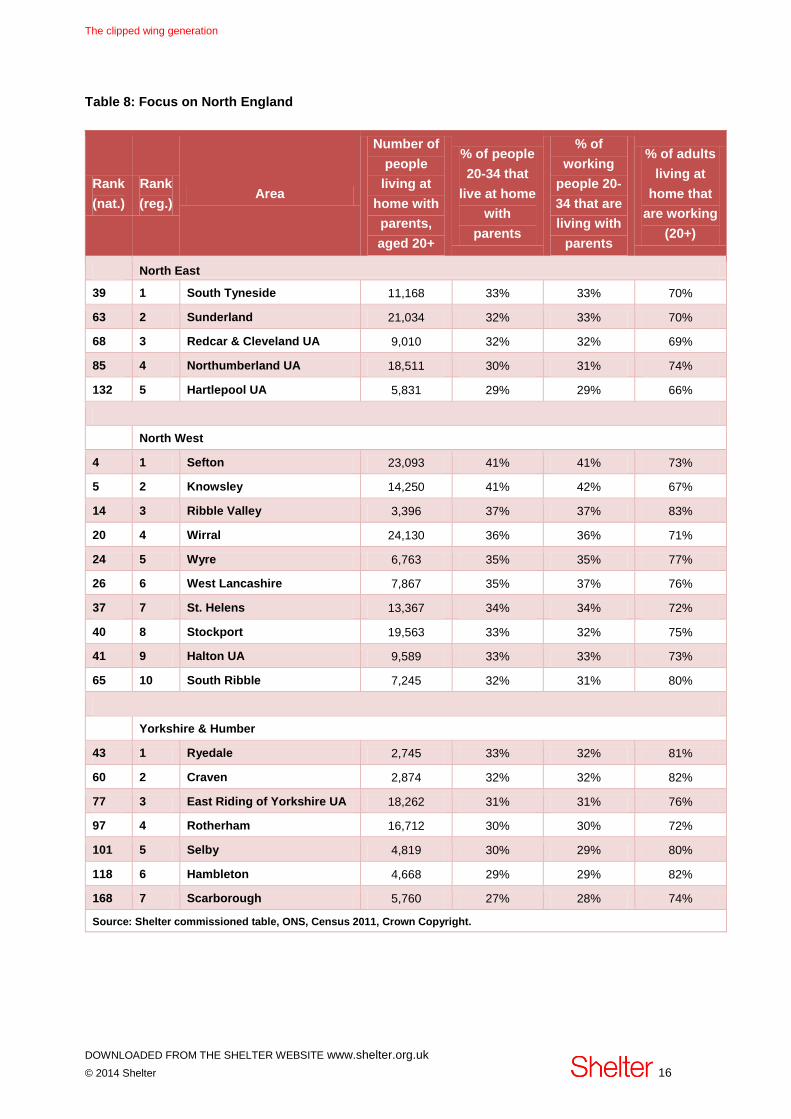
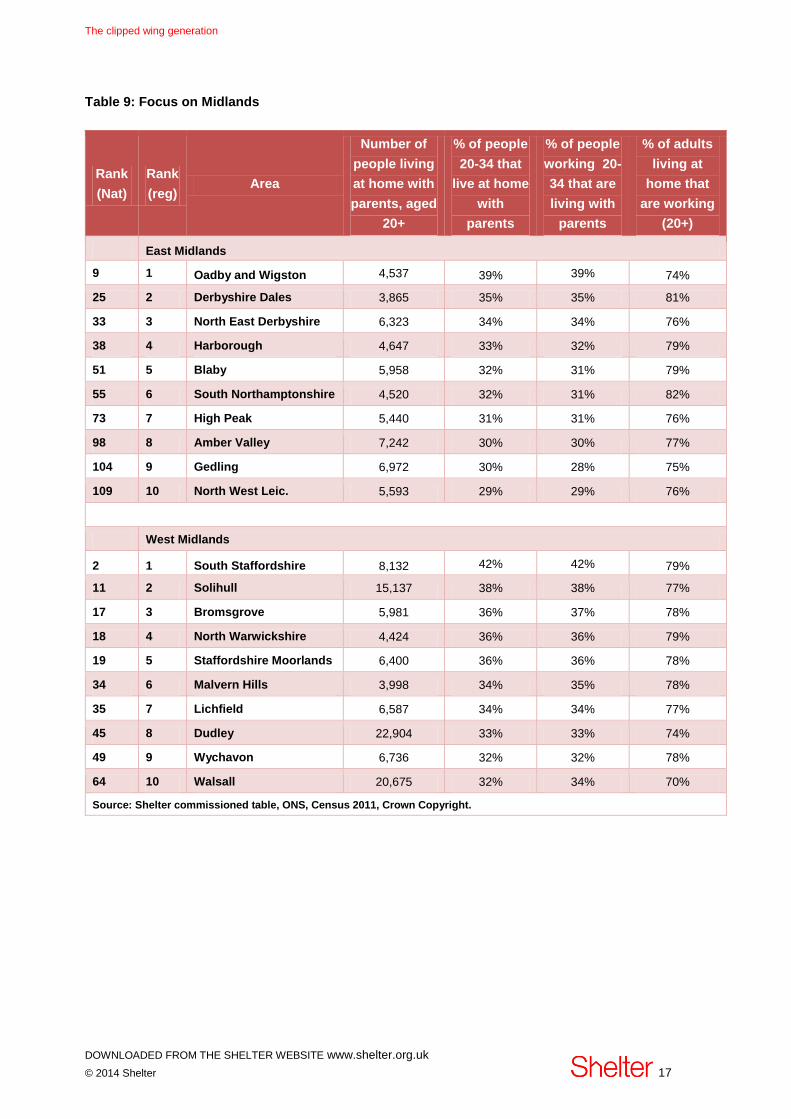
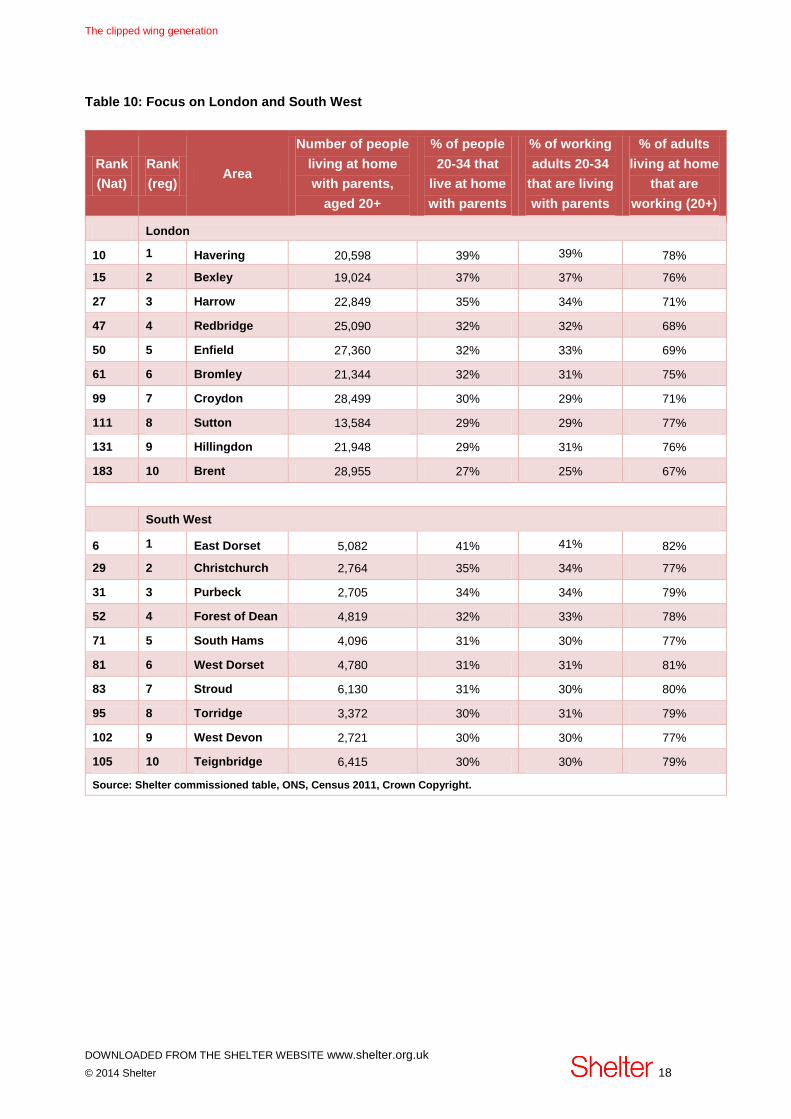
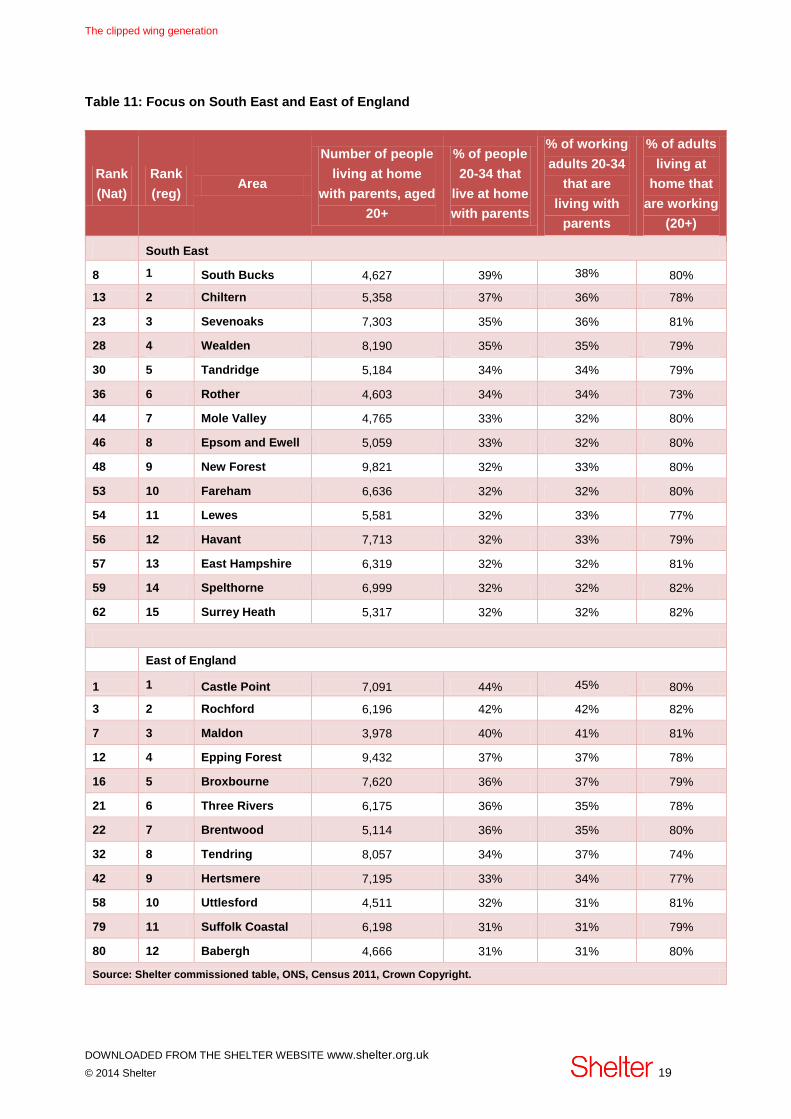
The following tables show the local areas within each region of England that have the highest rates of working adults aged 20-34 living at home with their parents.

The clipped wing generation

DOWNLOADED FROM THE SHELTER WEBSITE www.shelter.org.uk

© 2014 Shelter 16

Table 8: Focus on North England

Rank

(nat.)

Rank

(reg.) Area

Number of

people

living at

home with

parents,

aged 20+

% of people

20-34 that

live at home

with

parents

% of

working

people 20-

34 that are

living with

parents

% of adults

living at

home that

are working

(20+)

North East

39 1 South Tyneside 11,168 33% 33% 70%

63 2 Sunderland 21,034 32% 33% 70%

68 3 Redcar & Cleveland UA 9,010 32% 32% 69%

85 4 Northumberland UA 18,511 30% 31% 74%

132 5 Hartlepool UA 5,831 29% 29% 66%

North West

4 1 Sefton 23,093 41% 41% 73%

5 2 Knowsley 14,250 41% 42% 67%

14 3 Ribble Valley 3,396 37% 37% 83%

20 4 Wirral 24,130 36% 36% 71%

24 5 Wyre 6,763 35% 35% 77%

26 6 West Lancashire 7,867 35% 37% 76%

37 7 St. Helens 13,367 34% 34% 72%

40 8 Stockport 19,563 33% 32% 75%

41 9 Halton UA 9,589 33% 33% 73%

65 10 South Ribble 7,245 32% 31% 80%

Yorkshire & Humber

43 1 Ryedale 2,745 33% 32% 81%

60 2 Craven 2,874 32% 32% 82%

77 3 East Riding of Yorkshire UA 18,262 31% 31% 76%

97 4 Rotherham 16,712 30% 30% 72%

101 5 Selby 4,819 30% 29% 80%

118 6 Hambleton 4,668 29% 29% 82%

168 7 Scarborough 5,760 27% 28% 74%

Source: Shelter commissioned table, ONS, Census 2011, Crown Copyright.

The clipped wing generation

DOWNLOADED FROM THE SHELTER WEBSITE www.shelter.org.uk

© 2014 Shelter 17

Table 9: Focus on Midlands

Rank

(Nat)

Rank

(reg) Area

Number of

people living

at home with

parents, aged

20+

% of people

20-34 that

live at home

with

parents

% of people

working 20-

34 that are

living with

parents

% of adults

living at

home that

are working

(20+)

East Midlands

9 1 Oadby and Wigston 4,537 39% 39% 74%

25 2 Derbyshire Dales 3,865 35% 35% 81%

33 3 North East Derbyshire 6,323 34% 34% 76%

38 4 Harborough 4,647 33% 32% 79%

51 5 Blaby 5,958 32% 31% 79%

55 6 South Northamptonshire 4,520 32% 31% 82%

73 7 High Peak 5,440 31% 31% 76%

98 8 Amber Valley 7,242 30% 30% 77%

104 9 Gedling 6,972 30% 28% 75%

109 10 North West Leic. 5,593 29% 29% 76%

West Midlands

2 1 South Staffordshire 8,132 42% 42% 79%

11 2 Solihull 15,137 38% 38% 77%

17 3 Bromsgrove 5,981 36% 37% 78%

18 4 North Warwickshire 4,424 36% 36% 79%

19 5 Staffordshire Moorlands 6,400 36% 36% 78%

34 6 Malvern Hills 3,998 34% 35% 78%

35 7 Lichfield 6,587 34% 34% 77%

45 8 Dudley 22,904 33% 33% 74%

49 9 Wychavon 6,736 32% 32% 78%

64 10 Walsall 20,675 32% 34% 70%

Source: Shelter commissioned table, ONS, Census 2011, Crown Copyright.

The clipped wing generation

DOWNLOADED FROM THE SHELTER WEBSITE www.shelter.org.uk

© 2014 Shelter 18

Table 10: Focus on London and South West

Rank

(Nat)

Rank

(reg) Area

Number of people

living at home

with parents,

aged 20+

% of people

20-34 that

live at home

with parents

% of working

adults 20-34

that are living

with parents

% of adults

living at home

that are

working (20+)

London

10 1 Havering 20,598 39% 39% 78%

15 2 Bexley 19,024 37% 37% 76%

27 3 Harrow 22,849 35% 34% 71%

47 4 Redbridge 25,090 32% 32% 68%

50 5 Enfield 27,360 32% 33% 69%

61 6 Bromley 21,344 32% 31% 75%

99 7 Croydon 28,499 30% 29% 71%

111 8 Sutton 13,584 29% 29% 77%

131 9 Hillingdon 21,948 29% 31% 76%

183 10 Brent 28,955 27% 25% 67%

South West

6 1 East Dorset 5,082 41% 41% 82%

29 2 Christchurch 2,764 35% 34% 77%

31 3 Purbeck 2,705 34% 34% 79%

52 4 Forest of Dean 4,819 32% 33% 78%

71 5 South Hams 4,096 31% 30% 77%

81 6 West Dorset 4,780 31% 31% 81%

83 7 Stroud 6,130 31% 30% 80%

95 8 Torridge 3,372 30% 31% 79%

102 9 West Devon 2,721 30% 30% 77%

105 10 Teignbridge 6,415 30% 30% 79%

Source: Shelter commissioned table, ONS, Census 2011, Crown Copyright.

The clipped wing generation

DOWNLOADED FROM THE SHELTER WEBSITE www.shelter.org.uk

© 2014 Shelter 19

Table 11: Focus on South East and East of England

Rank

(Nat)

Rank

(reg) Area

Number of people

living at home

with parents, aged

20+

% of people

20-34 that

live at home

with parents

% of working

adults 20-34

that are

living with

parents

% of adults

living at

home that

are working

(20+)

South East

8 1 South Bucks 4,627 39% 38% 80%

13 2 Chiltern 5,358 37% 36% 78%

23 3 Sevenoaks 7,303 35% 36% 81%

28 4 Wealden 8,190 35% 35% 79%

30 5 Tandridge 5,184 34% 34% 79%

36 6 Rother 4,603 34% 34% 73%

44 7 Mole Valley 4,765 33% 32% 80%

46 8 Epsom and Ewell 5,059 33% 32% 80%

48 9 New Forest 9,821 32% 33% 80%

53 10 Fareham 6,636 32% 32% 80%

54 11 Lewes 5,581 32% 33% 77%

56 12 Havant 7,713 32% 33% 79%

57 13 East Hampshire 6,319 32% 32% 81%

59 14 Spelthorne 6,999 32% 32% 82%

62 15 Surrey Heath 5,317 32% 32% 82%

East of England

1 1 Castle Point 7,091 44% 45% 80%

3 2 Rochford 6,196 42% 42% 82%

7 3 Maldon 3,978 40% 41% 81%

12 4 Epping Forest 9,432 37% 37% 78%

16 5 Broxbourne 7,620 36% 37% 79%

21 6 Three Rivers 6,175 36% 35% 78%

22 7 Brentwood 5,114 36% 35% 80%

32 8 Tendring 8,057 34% 37% 74%

42 9 Hertsmere 7,195 33% 34% 77%

58 10 Uttlesford 4,511 32% 31% 81%

79 11 Suffolk Coastal 6,198 31% 31% 79%

80 12 Babergh 4,666 31% 31% 80%

Source: Shelter commissioned table, ONS, Census 2011, Crown Copyright.

The clipped wing generation

DOWNLOADED FROM THE SHELTER WEBSITE www.shelter.org.uk

© 2014 Shelter 20

Why are adults living at home?

This section outlines the findings of a YouGov survey of 1,255 adults (18+) who were currently

living at home with their parents, or had been in the last twelve months. The results below are

based on sub-groups of this sample, for example 250 working adults currently living at home

with their parents and aged 20-34. See individual tables for the relevant base sizes.

The first two tables examine results for people working and currently living at home with their

parents, Table 12 shows all factors mentioned, Table 13, shows the one main factor.

Table 12: Reasons for living at home with parents – working adults aged 20 and over, and aged

20 - 34

Adults currently living at home and working Aged 20 and

over, working

20-34 years

old, working

Rent is/was too expensive for me 45% 47%

I want/wanted to save up for a mortgage deposit 32% 35%

I want/wanted to live with my parents 25% 27%

I am/was studying 17% 20%

I am/was unemployed 15% 16%

I need/needed to save money to pay off debts 15% 15%

It is/was to look after my parent(s)/grandparent(s) 8% 5%

I am/was waiting for social housing/a council house 1% 1%

Other 13% 10%

Reasons associated with affordability/availability of housing (Net: Rent too

expensive/saving for mortgage deposit/waiting for a council house) 64% 67%

Base: 323 people aged 20 or above, currently living at home with their parent (s) or grandparent (s), and in work. 250 aged

20-34.

The clipped wing generation

DOWNLOADED FROM THE SHELTER WEBSITE www.shelter.org.uk

© 2014 Shelter 21

Table 13: And which ONE of the following would you say is/was the MAIN reason? Based on

those working and currently living at home with parents.

Adults currently living at home and working Aged 20 and

over, working

20-34 years

old, working

Rent is/was too expensive for me 26% 27%

I want/wanted to save up for a mortgage deposit 20% 20%

I want/wanted to live with my parents 14% 15%

I am/was studying 10% 12%

I am/was unemployed 7% 7%

I need/needed to save money to pay off debts 6% 6%

It is/was to look after my parent(s)/ grandparent(s) 5% 3%

I am/was waiting for social housing/ a council house 1% 1%

Other 10% 6%

Reasons associated with affordability/availability of housing (Net: Rent too

expensive/saving for mortgage deposit/waiting for a council house) 47% 48%

Base: 323 people aged 20 or above, currently living at home with their parent(s) or grandparent(s), and in work. 250 aged

20-34.

If the results are based on all young adults living at home with their parents, not just those

working, the affordability of housing remains the most commonly cited reason (51% of 20-34

year olds said expensive rents, saving for a deposit or waiting for a council house was a factor

in them living at home, 35% said it was the one main factor).

Tables 12 and 13 show that although a number of other factors – studying, being unemployed

and an element of personal choice – are important in understanding why so many people live

at home with their parents, the affordability and availability of housing is by far the biggest

factor lying behind why so many adults are living at home with their parents.

The reasons why people aged 35 and over live at home do appear to be somewhat different

(not shown in tables) – affordability and access to housing was still the most commonly cited

option listed (21%), but a higher number of people aged 35 and above and living at home with

their parents (31%) said ‘other’. As would be expected, studying is a lesser factor among this

age group, and looking after parents a greater one. Further exploration into the ‘other’ reasons

over 35s have for living at home is needed, but our findings suggest that as a group, their

reasons for doing so tend to be slightly different to 20-34 year olds.

The clipped wing generation

DOWNLOADED FROM THE SHELTER WEBSITE www.shelter.org.uk

© 2014 Shelter 22

The impact of living at home with your parents into adulthood

The YouGov survey also explored the impact that living at home into adulthood had. These

results will be added to this report, once released to the media. The result below formed part

of our media release in July and can be included here:

Being held back from having an independent life was the most commonly cited impact,

with 52% of working adults aged 20-34 and living at home agreeing that this is a worry

for them.

Conclusion

Adults living at home with their parents into their 20s and 30s, even if working, is just one of

the many symptoms of the housing crisis. This report reveals the numbers, exact locations and

reasons why for the first time, showing just how critical it is for us to build the affordable

housing needed by this and future generations of young people.

Liam Reynolds

Research Officer

July 2014


Recommended