40
The Communications Market 2016 5 5 Internet and online content 177
The Communications Market 2016
5
5 Internet and online content
177

Contents 5.1 Key market developments in internet and online content 179
5.1.1 Sector overview 179 5.1.2 Use of social media in the UK 180
5.2 Internet and devices 189
5.2.1 Introduction 189 5.2.2 Take-up and use of internet-enabled devices 189 5.2.3 Digital inclusion 194
5.3 Online content 197
5.3.1 comScore 197 5.3.2 Overview 198 5.3.3 Search engines 204 5.3.4 Online video-sharing services 205 5.3.5 Online retail and mobile payments 207 5.3.6 Online news 209 5.3.7 Online advertising 210
178

5.1 Key market developments in internet and online content 5.1.1 Sector overview Almost nine in ten (86%) of UK adults now have internet access at home, and this is highest among those aged under 55. The UK is becoming increasingly connected via the smartphone; research suggests that it is the most widely-used device by UK adults for accessing the internet. Since 2015, the number of UK adults owning a smartphone has increased to 71%, overtaking laptops (64%). Ownership is highest among younger adults, at more than nine in ten under-34s.
2015 was the first year in which the smartphone was considered to be the most important device for accessing the internet among all adults, overtaking the laptop. Consistent with high take-up, UK adults continued to consider the smartphone their most important device for internet access in 2016; more than a third (36%) of UK internet users agreed with this. UK adults aged under 55 were the most likely to consider the smartphone as their most important device for internet access, particularly the 16-34s. In contrast, over-55s were more likely to consider the laptop their most important device for internet access.
The wide availability and use of smartphones, and of mobile devices more generally, reflects the increased connectivity of the UK. As a result of a more connected and converged landscape, people can use their devices for a wide range of services and activities. Retail is one such example; in March 2016, more internet users visited online retailers on mobile devices than on laptops and desktops. Mobile devices can also be used for financial services; in March 2016, nearly a third (30%) of mobile internet users used their device to access their bank accounts, and 20% used their device to pay/transfer money electronically.
Convergence has also contributed to the popularity of social media, a notable feature of the UK’s connected landscape. Social media sites such as Facebook provide a place for people to network, message and share multi-media content (like videos and pictures). Social media is a popular activity, particularly among young adults: our Digital Day 2016 study shows that 99% of 16-24s use social media74 at least weekly in 2016. With the exception of the over-65s, the majority of people use social media at least weekly. The mobile phone is the most popular device for social media use in 2016: 50% of all adults’ time using social media is spent on a mobile phone. Adults aged under 45 spend most of their social media time on a mobile phone, while over-45s spend more of their social media time on a computer than on any other device.
The popularity of using mobile devices for online activities is reflected in the increased expenditure in mobile advertising. Total mobile advertising expenditure grew by 60.3% year on year, to £2.6bn, in 2015. Mobile search advertising spend grew by 63.6% to £1.3bn, with mobile display advertising spend up by 58.8% to £1.3bn. Total UK expenditure on internet advertising increased by 16.4% year on year, to £8.6bn in 2015. The increased spend in mobile advertising is likely to be one of the drivers behind this growth (along with increased spend in online video and the increased use of digital advertising among press brands).
74 Social media is defined as activity through Facebook, Twitter, LinkedIn, Instagram, YouTube, or any 'other social media site'. Each time a respondent recorded having done certain activities in their diary, they were asked if it was through any of these services.
179

Figure 5.1 UK internet and online content market: key statistics
Source:1Ofcom consumer research,2 comScore MMX Multi-Platform, UK, data taken for March 2015 and March 2016; 3IAB/PwC Digital Adspend Note: With the exception of internet, and internet on mobile phone, take-up data, all data relate to the calendar year, so 2016 data are currently unavailable. Note: Caution is advised in comparing values before and after February 2011 because of a change in comScore methodology.
In this chapter of the Communications Market Report we examine developments in internet and online content. Reflecting the reality of convergence, we discuss aspects of some of these developments in more detail in other sections of this document, in particular those relating to audio-visual content and audio content.
This chapter focuses on three core areas:
• Section 5.1.2: this section examines changes in the use of social media. The section primarily draws upon findings from Ofcom’s 2016 Digital Day study.
• Section 1.1: this section considers internet access. We examine the proportion of adults who have internet access, the devices they use to access the internet and the main activities people use the internet for. We also consider those who do not use the internet at all, and their reasons for not having an internet connection.
• Section 1.1: this section provides an overview of consumption of online content. We examine the most popular online services, websites and apps. We look at consumer behaviour unique to the internet, such as online video, video gaming, retail, mobile payments and online news. Finally, we look at changes in advertising revenues.
5.1.2 Use of social media in the UK Social media can be understood as websites and/or applications that enable users to create or share content, and to participate in social networking. Social media platforms now integrate and combine different types of services and functionalities (such as messaging, social networking and online video) that have historically been limited to discrete websites or apps.
This section is dedicated to examining social media in the light of the findings of Ofcom’s 2016 Digital Day study – a diary-based research study that aims to understand how people interact with communications on a day-to-day basis. The section also uses data provided by
UK internet and online content market 2009 2010 2011 2012 2013 2014 2015 2016
1Internet take-up (%) 73 75 77 79 80 82 85 86
1Laptop take-up (%) 44 51 55 61 62 63 65 64
1Smartphone take-up (%) n/a n/a 27 39 51 61 66 71
1Tablet take-up (%) n/a n/a 2 11 24 44 54 59
1Consideration that the smartphone is the most important device for internet access (%)
n/a n/a n/a n/a 15 23 33 36
2Total digital audience (million) n/a n/a n/a n/a n/a n/a 47.5 50.3
3Digital advertising expenditure (£bn) 3.6 4.1 4.8 5.4 6.3 7.3 8.6 n/a
3Mobile advertising expenditure (£m) 38 83 203 529 1021 1631 2627 n/a
180

comScore,75 which gives an indication as to the most commonly-used social media networks.
Facebook attracted the largest digital audience, of the selected comparator social networking sites, in April 2016
Here, we use comScore to look at the total number of measured unique users for a number of social networking services in April 2016.76
Facebook continues to be the largest social network service in the UK. In April 2016, it attracted a digital audience of 38.9 million (more than three-quarters of active internet users). This was larger than that of LinkedIn (21.8 million) and Twitter (20.9 million).
The unique audiences for LinkedIn, Instagram, Pinterest and Snapchat have grown since 2015. However, the unique audience for some social networking sites has declined; the unique audience for Google+ has fallen year on year, down by 7.4 million to 12.8 million as of April 2016. The unique audiences of Facebook and Twitter have also fallen.
Figure 5.2 Digital audience of selected social networking services: April 2015 and April 2016
Source: comScore MMX Multi-Platform, UK, April 2015 and April 2016 Note: Entities cited from comScore MMX Multi-Platform: [P] Facebook , [P] LinkedIn , [M] Twitter (w/ history) , [M] INSTAGRAM.COM, [C] Google+ , [P] PINTEREST.COM . MMX Multi-Platform includes laptop/desktop browsing, laptop/desktop video streams and mobile use. Mobile use includes Android smartphones and iOS smartphones and tablets. Only those entities that have been tagged as part of the census network report Android tablet usage data.
Facebook Messenger attracted the largest number of mobile users in April 2016
In recent years, the network infrastructure has become much more developed, enabling superfast broadband and 4G technology. As a result, the infrastructure can now support more advanced forms of communication. A variety of mobile apps are available in the market which allow people to communicate in a range of different media formats (such as picture,
75 See section 5.3.1 for an overview of comScore and its products. 76 The digital audience of social networking sites includes those who may have been browsing the site but do not actually use the site, or have an account for that site.
Unique audience (millions) and reach as a % of total digital audience
41.1
20.7
21.6
14.1
20.2
9.4
6.8
38.9
21.8
20.9
16.5
12.8
11.5
7.1
0
10
20
30
40
50
Facebook LinkedIn TWITTER.COM (w/history)
INSTAGRAM.COM Google+ PINTEREST.COM Snapchat, Inc (w/history)
Apr-15Apr-16
86% 78% 44% 44% 46% 42% 30% 33% 43% 26% 20% 23% 14% 14%
181

video and audio), in addition to conventional text. Given their diverse functionalities, such as the ability to set up group chats and to send and receive data, some mobile messaging apps can be seen as a substitute for traditional telecoms services.
Our research indicates that instant messaging services are already being used instead of other, older methods of communication. Ofcom’s 2016 Digital Day research shows that the proportion of people using instant messaging services has grown from 28% in 2014 to 43% in 2016, and that 21% of people are using photo or video messaging services, up from 14% in 2014. Over the same period, the proportion of people emailing has fallen by 7pp to 70%, and the proportion of people texting has fallen by 8pp to 63%.
Looking at data from comScore on the unique audiences of mobile users for selected mobile messaging apps, Facebook Messenger attracted the largest number of mobile users in April 2016, with a unique audience of 22.5 million (a reach of 64% across the UK mobile population). WhatsApp77 attracted the second highest number of mobile users, with 16.7 million unique visitors and a reach of 47% across the UK mobile population. Of all the selected comparator mobile messaging apps, Kik Messenger attracted the lowest number of mobile users.
Use of all mobile messaging apps in April 2016 was highest among the younger age groups. More than eight in ten (81%) of the mobile audience aged 18-24, and 75% of those aged 25-34 (compared with 45% of over-55s) used Facebook Messenger in April 2016. Use of WhatsApp was broadly similar among the 18-24s and the 25-34s (60% and 63% respectively). However, a greater age disparity was seen in the use of Snapchat; this was particularly high among 18-24s (61%, compared to 25% of 25-34s).
Figure 5.3 Mobile audience of selected mobile messaging apps: April 2016
Source: comScore Mobile Metrix, UK, April 2016 Note: Mobile use includes Android smartphones and iOS smartphones and tablets. Only those entities that have been tagged as part of the census network report Android tablet usage data. comScore entities used were: [S] Facebook Messenger (Mobile App), [C] WhatsApp Messenger (Mobile app). [M] Snapchat (Mobile App) (w/history), [S] Skype (Mobile App), [M] Kik Messenger (Mobile App) Note: Changes were made to comScore Mobile Metrix methodology in January 2016. comScore entities were affected to varying degrees.
77 WhatsApp was acquired by Facebook in February 2014.
22.5
16.7
6.94.6
1.50
5
10
15
20
25
FacebookMessenger (Mobile
App)
WhatsAppMessenger (Mobile
App)
Snapchat (MobileApp) (w/ history)
Skype (Mobile App) Kik Messenger(Mobile App)
Unique audience (millions) and reach as % total mobile audience
64% 47% 20% 13% 4%
182

Use of social media was near-universal among 16-24 year olds in 2016 More than six in ten (64%) UK adults claimed to use social media78 in 2016, and its use accounted for 8% of all time spent on media and communications. Weekly reach of social media varies markedly by age; those aged 16-24 are by far the most prevalent users. Social media had a near-universal reach among this age group, with 99% claiming to use it. For the 16-24s, social media accounted for 18% of all time spent using media and communications – a much greater proportion than for all adults (8%). On average, 16-24s spent 2 hours 26 minutes per day using social media in 2016 - noticeably higher than the average time spent by all adults (1 hour 16 minutes). Use of social media declines with age: the lowest use is among over-65s. Twenty-four per cent of this group claimed to use social media in 2016; their use of such services made up 1% of their total time spent using media and communications.
Figure 5.4 Social media use, by age group
Source: Ofcom Digital Day 2016 Adult diary: Chart shows the proportion of adults who recorded communicating through a social network ing site (D) or using a social media site for certain types of media activity (E2) across their diary week. Proportion of media and comms time is calculated from the durations of these activities (B2). Base: Adults aged 16+ (1512), 16-24 (129), 25-34 (189), 35-44 (282), 45-54 (299), 55-64 (259), 65+ (354)
Those aged 16-24 spent a large proportion of their communication time on social networking, and less time on email and phone calls, than the older age groups
The 16-24s spent a larger proportion of their time than the older age groups communicating via social networking: 27% for 16-24s vs. 18% among UK adults as a whole. In line with this,
78 Digital Day 2016 defines social media as communicating (excluding checking updates) and consuming media (including short video clips on e.g. YouTube, news sites; streamed online music; music videos; games; sports news/updates; other websites or apps; other activities). Sites include: Facebook, Twitter, LinkedIn, Instagram, YouTube and/or other social media site.
64%
99%
84%77%
64%
51%
24%
8%18%
8% 7% 6% 5% 1%
Adults 16+ 16-24 25-34 35-44 45-54 55-64 65+
Weekly reach
Proportion of allmedia and commstime
Reach and proportion of time spent on social media (%)
183

16-24s spend less time than older age groups communicating via phone or video calls (8% vs. 20% for the UK average) and emailing (14% vs. 35% for the UK average).
Figure 5.5 Proportion of time spent communicating attributed to activities, by age group
Source: Ofcom Digital Day 2016 Adult diary: Chart shows the proportion of all communication time (B2) attributed to each activity (D) by age group. Base: Adults aged 16+ (1512), 16-24 (129), 25-34 (189), 35-44 (282), 45-54 (299), 55-64 (259), 65+ (354)
Half of all adults’ social media time was spent using social media on a mobile phone
The mobile phone is the most popular device for using social media, among adults who used any social media during their diary week. Of the total time spent by all adults on this activity in 2016, 50% of it was on mobile phones. Just over a third (34%) of all adults’ social media time was spent on a computer, and 13% using a tablet.
There is a clear divergence between younger and older adults in the devices they use for social media. Mobile phones were the most widely-used device for social media among all under-45s, and highest of all among 16-24s, accounting for 61% of their total time using social media. In contrast, over-45s were more likely to use computers and tablets for social media. Over-65s were more likely to use a computer; 71% of their social media time was spent on this device.
Proportion of communicating time (%)
34%14%
37% 43% 40% 43% 43%
20%
8%
21%21% 26% 25%
39%19%
35%
18%14% 7% 8%
3%18%27%
13% 13% 17% 17%10%
11% 15% 11% 8% 9% 8% 6%
Adults 16+ 16-24 25-34 35-44 45-54 55-64 65+
Texting
Social networking
Instant/photo/videomessaging
Phone or video calls
Emailing
2h 10m 4h 14m 2h 34m 2h 27m 2h 10m 1h 24m 0h 43mAverage daily minutes spent
communicating*
184

Figure 5.6 Proportion of social media time attributed to devices, by age group
Source: Ofcom Digital Day 2016 Adult diary: Chart shows the proportion of all social media time (B2) attributed to each activity by age group. *The average daily minutes figure is among those who used social media at all across their diary week on any device (sum figure) Base: Adults aged 16+ who used any social media during their diary week (991)
Adults spent almost half of their social media time communicating through a social networking site in 2016
In 2016, UK adults spent nearly half (46%) of their social media time communicating on a social networking site.79 More than a quarter (27%) of their social media time was spent browsing/ checking updates, and 13% was attributed to watching short video clips. However, there was variation across the age groups in how they spent their social media time on other activities.
Social media can also be used for playing games. Those who play games on social media can share their progress in the game with their friends, and invite them to play. Many games are available free of charge, with some offering optional features for purchase. Time spent using social media for gaming increases with age, with the over-55s spending a greater proportion of their social media time on this activity than younger people. This contrast is highlighted at either end of the age range: the over-65s spent 16% of their social media time playing games, compared to just 1% spent by16-24s.
In contrast, use of social media time for content-related activities decreases with age: 19% of 16-24s’ social media time was spent watching short online clips, compared to 7% of the over-65s’ time. The younger age groups also attributed more of their social media time to music videos than adults aged 65 and over.
79 This includes activities such as commenting on statuses or posts, and sending messages (via browser or app), but excludes checking updates.
50%
61%
57%
56%
32%
22%
4%
34%
29%
25%
29%
42%
53%
71%
13%
5%
12%
13%
26%
24%
23%
3%
4%
6%
1%
1%
1%
2%
Adults16+
16-24
25-34
35-44
45-54
55-64
65+
Mobile phone Computer Tablet TV set (inc connected devices)
35m
58m
1h
1h
1h 1m
2h 26m
1h 16m
Average daily minutes on social
media*Proportion of social media time (%)
185

Figure 5.7 Proportion of social media time attributed to activities, by age group
Source: Ofcom Digital Day 2016 Base: Adults aged 16+ who used any social media during their diary week (991) Adult diary: Chart shows the proportion of all social media time (B2) attributed to each activity, by age group. *The average daily minutes figure is among those who used social media at all across their diary week (net figure) Note: ‘Other’ consists of streamed music, sports/news updates and other online news
Nearly a third of mobile internet users posted photos on social media in April 2016
As seen in Figure 5.6, adults who used social media spent half of their social media time on a mobile phone. To understand the most popular types of social media behaviour among mobile phone users, we used data from comScore’s MobiLens Plus product.80
Among those who accessed the internet using a mobile phone, nearly a third had posted photos on social media in April 2016. Other forms of generating and sharing content were less popular; 16% of mobile internet users posted links to websites and 14% posted videos.
A fifth of mobile internet users had read posts by organisations/ brands/ events, and nearly as many (19%) had read posts by public figures or celebrities on social media. Check-in features, which enable users to post their physical location, had been used by 13% of mobile internet users in April 2016.
80 See 5.3.1 for an explanation of MobiLens Plus.
46%
47%
38%
40%
56%
46%
48%
27%
20%
36%
34%
28%
25%
26%
13%
19%
13%
10%
4%
6%
7%
6%
8%
6%
5%
4%
1%
0%
5%
1%
2%
6%
6%
17%
16%
4%
5%
4%
4%
3%
4%
2%
Adults16+
16-24
25-34
35-44
45-54
55-64
65+
Communicating Browsing/checking updates Short online clips Music videos Gaming Other
Average daily minutes on social
media*
35m
58m
1h
1h
1h 1m
2h 26m
1h 16m
Proportion of social media time (%)
186
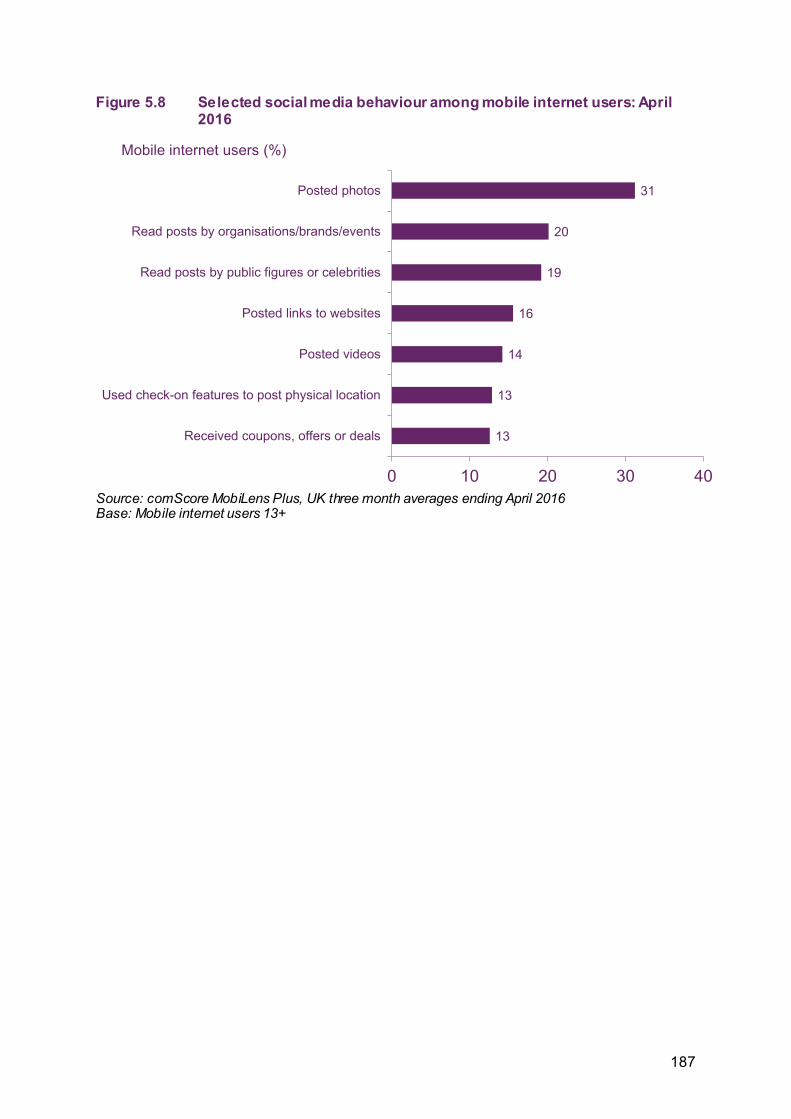
Figure 5.8 Selected social media behaviour among mobile internet users: April 2016
Source: comScore MobiLens Plus, UK three month averages ending April 2016 Base: Mobile internet users 13+
13
13
14
16
19
20
31
0 10 20 30 40
Received coupons, offers or deals
Used check-on features to post physical location
Posted videos
Posted links to websites
Read posts by public figures or celebrities
Read posts by organisations/brands/events
Posted photos
Mobile internet users (%)
187


5.2 Internet and devices 5.2.1 Introduction In this section we consider internet access as a whole, as well as the take-up of internet-enabled devices.
5.2.2 Take-up and use of internet-enabled devices Almost nine in ten UK adults had home internet access in 2016
In 2016, 86% of UK adults claimed to have internet access at home, via any device. Take-up of internet access varies by age: more than 90% of adults aged under 55 claimed to have internet access at home (broadly in line with previous years), although among those aged 55-64, access had increased by 5pp (to 87%) since 2015. Those aged 75 and over had the lowest incidence of internet access; less than half (45%) claimed to have it.
It seems that more adults are using their mobile phones to access the internet at home: while the proportion of households with fixed broadband remained stable between 2015 and 2016 (at 78% and 79% respectively), the proportion of adults using a smartphone to access the internet at home has increased from 61% to 66%.
Figure 5.9 Proportion of adults with home internet access
Source: Ofcom Technology Tracker, H1 2016 Base: All adults aged 16+ (n=3737) Significance testing: Arrows indicate any significant differences at the 95% confidence level between UK 2015 and UK 2016, between each age group in 2015 and 2016 and between each socio-economic group in 2015 and 2016. QE2: Do you or does anyone in your household have access to the internet at home (via any device, e.g. PC, laptop, mobile phone etc.)?
Smartphones are the most widely-owned internet-enabled device among UK households
The ownership of smartphones has increased since 2015. In 2016, 71% of UK households claimed to own a smartphone, up 5pp year on year. Laptops were the second most commonly-owned device among households, at 64%, followed by tablets, at 59%, up 5pp year on year.
82
94 92 89
78
67
32
90
80
67
8591 94 94
8275
40
9284
70
8692 93 93
87
77
45
9286
74
0
20
40
60
80
100
UK 16-24 25-34 35-54 55-64 65-74 75+ ABC1 C2 DE
2014 2015 2016Proportion of adults (%)
189

The largest increase in take-up was of smart TVs; ownership increased by 7pp in the year to 2016, to 27% of households. Household ownership of games consoles and desktops fell between 2015 and 2016 to 42% (down by 5pp) and to 31% (down by 3pp) respectively. The decline in desktop ownership could be due to the increase in tablet ownership among households.
Since their inclusion in the study in 2015, ownership of smart watches has grown by 2pp year on year, to 5% of households.
Figure 5.10 Ownership of internet-enabled devices
Source: Ofcom Technology Tracker, H1 2016 Base: Adults aged 16+ n = 3737 Note: IP-enabled devices include laptop, games console (Xbox 360, PS3, Wii/Wii U), desktop PC, smartphone, portable games console (Nintendo DS range, PlayStation Portable/Vita), VOD STB (all Virgin TV customers, Sky+ HD, BT TV, TalkTalk TV), e-reader, tablet, netbook, smart TV, and HDMI device (Roku, Chromecast, Now TV). *E-reader and smart watch take-up stated here is per household, while elsewhere in the report we state figures by individual take-up. Smart watches were not included in the survey before 2015. Significance testing: Arrows indicate any significant differences at the 95% confidence level between UK 2015 and UK 2016.
Smartphones are the most commonly-owned internet-enabled device among under-55s
Adults under 55 were more likely to own a smartphone in 2016, compared to the UK overall. The difference in the ownership of smartphones between younger and older age groups is stark: twice as many 16-24s and 25-34s owned a smartphone (90% and 91% respectively) than over-55s (42%). Over-55s were less likely than adults in the UK overall to own a smartphone (42% vs. 71%).
Laptops and tablets were second and third choices, respectively, among 16-24s and 35-54s. Among 25-34s, take-up of these two devices was level, at 67% each. In contrast, laptops were the most commonly-owned devices among over-55s.
190

Figure 5.11 Take-up of internet-enabled devices, by age
Source: Ofcom Technology Tracker, H1 2016 Base: Adults aged 16+, 16-24 n = 519, 25-34 n = 604, 35-54 n = 1172, 55+ n = 1442 Note: Ranked by overall household ownership Internet-connected dongle or set-top box includes NOW TV set-top box, Roku, Google Chrome, Amazon Fire TV stick, Amazon Fire TV, Apple TV Significance testing: Arrows indicate any significant differences at the 95% confidence level between UK 2016 and each age group
AB households were more likely than the UK overall to own internet-enabled devices
AB households were more likely than those in the UK overall to own the following internet-enabled devices: smartphone, laptop, tablet, desktop, e-reader, smart TV and netbook. The exceptions to this were games consoles, VoD boxes, internet-connected dongles/ set-top boxes and smart watches; for these devices, AB households had ownership levels comparable to the UK overall.
In contrast, DE households were less likely than the UK overall to own the majority of internet-enabled devices, with the exception of a games console or a smart watch, which were comparable to the UK overall.
Proportion of adults (%)90
7163 64
3829 27 29 29
11 7 7
91
67 6759
38
2025
30 26
5 6 7
8374 70
55
4237
31 3227
10 6 7
4250
43
12
29 3226
19
5 4 3 20
20
40
60
80
100S
mar
tph
one
Lapt
op
Tabl
et
Gam
esC
onso
le
VO
DB
ox
Des
ktop
E-re
ader
Sm
art
TV
Por
tabl
e G
ames
Con
sole
Net
book
Inte
rnet
-con
nect
ed d
ongl
e or
set-t
op b
ox*
Sm
art W
atch
16-24 25-34 35-54 55+
191

Figure 5.12 Take-up of internet-enabled devices, by socio-economic group
Source: Ofcom Technology Tracker, H1 2016 Base: Adults aged 16+, AB n = 797, C1 n = 1122, C2 n = 791, DE n = 1022 Note: Ranked by overall household ownership Internet-connected dongle or set-top box includes NOW TV set-top box, Roku, Google Chrome, Amazon Fire TV stick, Amazon Fire TV, Apple TV Significance testing: Arrows indicate any significant differences at the 95% confidence level between UK 2016 and each socio-economic group
Smartphones were considered to be the most important device for internet access in 2016
More than a third (36%) of UK internet users considered smartphones to be their most important device for accessing the internet in 2016. This continues the trend that was observed in 2015 (Figure 5.14), the first year in which the smartphone overtook the laptop as the most important device for internet access (33% vs. 30% in 2015).
UK internet users aged 16-24 and 25-34 were more likely than the UK overall to consider the smartphone as their most important device for internet access, and the 25-34s were more likely to select this in 2016 than in 2015 (56% vs. 46%). These age groups were the least likely to select a laptop, a desktop or a tablet as their most important device for internet access, compared to the UK overall, in 2016.
In contrast, the over-55s were more likely than the UK overall to consider laptops, desktops or tablets as their most important device for internet access. This age group were less likely
Proportion of adults (%)
76 7867
40 40 4338 34
1911 7 7
7467 63
43 39 3529 27
20
7 5 6
7162 63
4841
27 28 26 22
6 6 4
62
4843 39
2518 14
20 17
4 3 4
0
20
40
60
80
100S
mar
tph
one
Lapt
op
Tabl
et
Gam
esC
onso
le
VO
DB
ox
Des
ktop
E-re
ader
Sm
art
TV
Por
tabl
e G
ames
Con
sole
Net
book
Inte
rnet
-con
nect
ed d
ongl
e or
set-t
op b
ox*
Sm
art W
atch
AB C1 C2 DE
192

than all other groups to own a smartphone (see Figure 5.11) and they were less likely to consider it as their most important device for internet access; just over one in ten (12%) chose this device in 2016.
Figure 5.13 Most important device for internet access
Source: Ofcom Technology Tracker, H1 2016 Base: All adults aged 16+ who use the internet at home or elsewhere (n = 3100 UK). Significance testing: Arrows indicate any significant differences at the 95% confidence level between males and females, between UK 2016 and each age group and between UK 2016 and each socio-economic group. QE40: Which is the most important device you use to connect to the internet, at home or elsewhere? ‘Other’ responses include: netbook, games console, e-reader, TV set, smart watch, other portable/ handheld device, other device, none and ‘don’t know’.
Figure 5.14 Most important device for internet access: 2013-2016
Source: Ofcom Technology Tracker, Q1 2013-2014, H1 2015-2016 Base: All adults aged 16+ who use the internet at home or elsewhere (2016 n = 3100 UK). Significance testing: Arrows indicate any significant differences at the 95% confidence level between 2016 and 2015 for each device. QE40: Which is the most important device you use to connect to the internet, at home or elsewhere?
36 34 3856 56
3512
28 37 40 42
29 29 2923 21
31
36
35 28 24 28
20 18 2211 15
24
2520 20 24 17
12 16 8 7 4 923 14 12 9 10
0%
20%
40%
60%
80%
100%
UK
Mal
e
Fem
ale
16-2
4
25-3
4
35-5
4
55+
AB C1
C2
DE
Gender Age group Social group
Other
Desktop
Tablet
Laptop
Smartphone
Internet users (%)
Internet users (%)
15%
46%
8%
28%23%
40%
15%20%
33%30%
19%14%
36%
29%
20%
12%
0%
10%
20%
30%
40%
50%
Smartphone Laptop Tablet Desktop
2013201420152016
193

5.2.3 Digital inclusion One in ten UK adults do not intend to take up the internet in 2016
Fourteen per cent of UK adults did not have access to the internet at home in 2016. Ten per cent of adults claimed that they did not intend to get the internet in the next 12 months (a decrease of 2pp since 2015), with the older age groups driving this - 83% of those who did not intend to get it were aged 55 and over.
Two per cent of UK adults said they did not know whether they would get the internet in the next 12 months, the same proportion as said they were likely to take up the internet in the next 12 months (2%).
Figure 5.15 Internet take-up and intentions: 2016
Source: Ofcom Technology Tracker, H1 2016 Base: All adults aged 16+ (n = 3737). Significance testing: Arrows indicate any significant differences at the 95% confidence level between 2016 and 2015. QE2: Do you or does anyone in your household have access to the internet at home (via any device)?/ QE24: How likely are you to get internet access at home in the next 12 months?
Among UK adults without internet access at home, half do not think they need it
Half of UK adults who did not have access to the internet at home in 2016 said they did not think they needed it. This was the most frequently-cited reason, and was driven by the over-55s, who were the most likely to say this (90%).
The next most frequently-cited reasons for not having home internet access were that the respondent did not want to own a computer (22%), or that they felt they were too old to use the internet (21%). The majority of respondents who claimed to be too old were aged 65 and over (94%).
Just under two in ten adults (18%) without home internet access did not believe they had the knowledge or skills to use it. The proportion of respondents claiming not to have the internet at home because it was too expensive has decreased since 2015 (21% in 2015 vs. 15% in 2016).
194
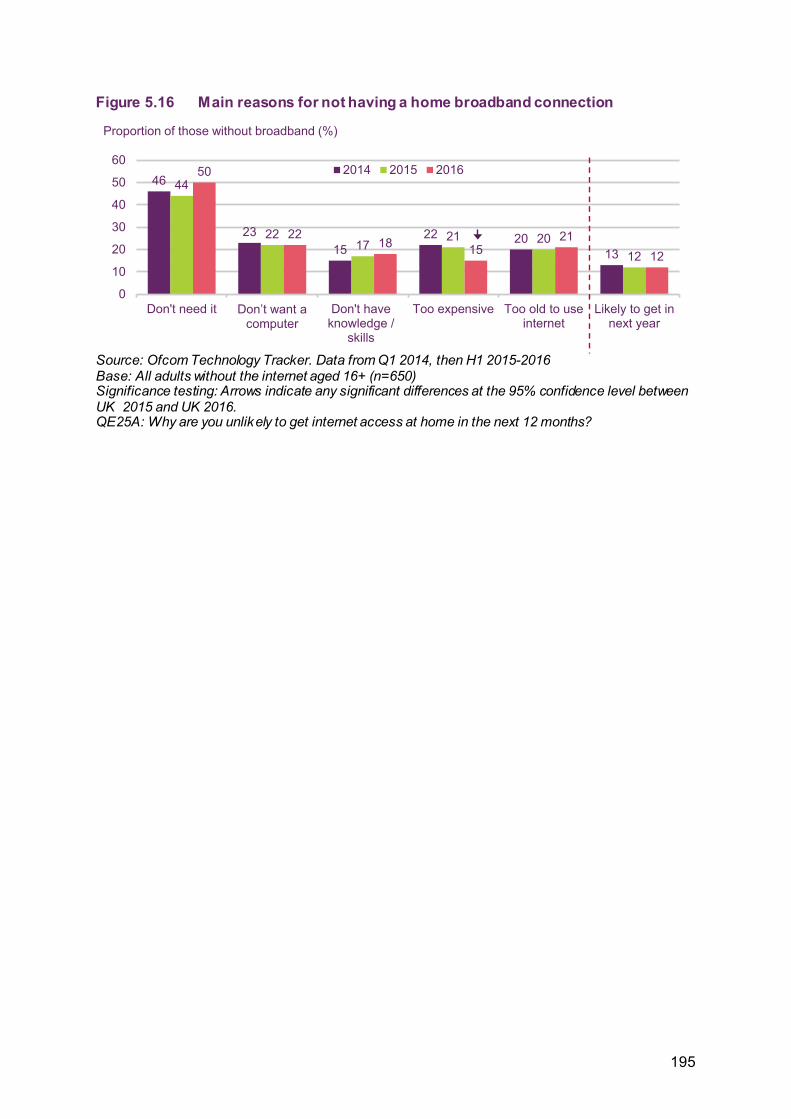
Figure 5.16 Main reasons for not having a home broadband connection
Source: Ofcom Technology Tracker. Data from Q1 2014, then H1 2015-2016 Base: All adults without the internet aged 16+ (n=650) Significance testing: Arrows indicate any significant differences at the 95% confidence level between UK 2015 and UK 2016. QE25A: Why are you unlikely to get internet access at home in the next 12 months?
Proportion of those without broadband (%)
46
2315
22 2013
44
2217
21 2012
50
2218 15
2112
0
10
20
30
40
50
60
Don't need it Don’t want a computer
Don't haveknowledge /
skills
Too expensive Too old to useinternet
Likely to get innext year
2014 2015 2016
195

5.3 Online content This next section explores the content and services that people access online, including use of search engines, use of online video-sharing services and use of financial payment services.
5.3.1 comScore To inform our analysis of people’s use of online content and services in the UK, we have drawn on data collected by comScore. comScore is a global multi-platform measurement tool which measures the online behaviour of audience, brands and consumers.
The UK Online Measurement Company (UKOM) was formed in 2009 with a mandate from the advertising industry to establish measurement standards for digital media. UKOM appointed comScore as its exclusive partner for online media audience measurement in the UK in 2012. comScore will continue as UKOM’s exclusive data supplier until at least March 2018.
This chapter draws mainly on three comScore sources:
1. For analysis of laptop and desktop computer internet activity only, we use comScore Media Metrix (MMX) which employs comScore’s Unified Digital Measurement (UDM) methodology, explained below.
2. For analysis of mobile internet and app activity only, on Android and iOS smartphones, iPads and Android tablets, we use comScore Mobile Metrix, which also employs comScore’s Unified Digital Methodology for Android and iOS smartphones and iPads. Android tablet use is captured on tagged entities.
3. For analysis of internet activity across platforms, we use comScore MMX Multi-Platform, which provides metrics on desktop video.
Finally, mobile phone user behaviour is supplemented by consumer research from comScore MobiLens Plus (this is not part of the data suite endorsed by UKOM).
Methodology comScore’s Unified Digital Methodology (UDM) combines panel and census measurement techniques to obtain digital audience measurement statistics. UDM uses comScore’s global measurement panel to determine audience reach and demographics. Census-level activity is captured from publishers’ digital content, such as on websites, videos and computer and mobile applications. comScore combines census-level data with those captured from the panel to help provide a more accurate view of audiences and their consumption habits. This approach allows comScore to capture more accurate consumption activity from publishers, and attribute this to audience demographics in a way that is not affected by cookie deletion, blocking, and rejection.
Metrics Throughout this report we make reference to a number of metrics, as defined below:
Unique audience – the total number of unique persons who visited a website or used an application at least once in a given month. Persons visiting the same website more than once in the month are counted only once in this measure.
197

Active audience – the total number of people who visited any website or used any application at least once in a given month; i.e. the number of people online and using any specific platform in a given month, no matter which website or app they used.
Digital audience – the active audience across all digital platforms (laptop/desktop computers, Android and iOS smartphones, iPads and, for those sites who have tagged in comScore’s census network, Android tablets).
Active reach – the proportion of the active audience made up by the unique audience of a website.
Time spent per month – the average time spent browsing a website per unique visitor per month (excludes time spent watching online video and listening to streamed music).
Dictionary
Each of the entities reported by comScore is attributed to a level in comScore’s Client Focused Dictionary. Several entities (including apps) can exist within one service (e.g. BBC Sport and BBC iPlayer) and comScore’s dictionary defines how these entities are structured and related to each other. It is client-focused because comScore’s clients define how their websites appear in reports according to this dictionary. All comScore reports use the same six-tiered dictionary structure, as explained below:
Property [P] - The highest level of reporting within the dictionary. Properties represent all full domains (i.e. felmont.com), pages (i.e. sports.felmont.com/tennis), applications or online services under common ownership or majority ownership for a single legal entity. A property may also contain any digital media content that is not majority-owned but has been legally signed over for reporting purposes by the majority owner.
Media Title [M] - A Media Title is an editorially and brand-consistent collection of content in the digital landscape that provides the marketplace with a view of online user behaviour. This may represent a domain, a group of domains, online service or application.
Channel [C], SubChannel [S], Group [G] and SubGroup [SG] - Within a Media Title there may be grouped URLs of editorially consistent content that make up a Channel. For some of the largest Media Titles, Channels themselves may be broad, and Subchannels, Groups and Subgroups within the larger Channels may prove useful for categorisation within the comScore Dictionary.
5.3.2 Overview The UK’s total digital audience stood at 50.3 million people in March 2016
The total UK digital audience (i.e. the online audience active on laptops, desktops and mobile devices81), amounted to 50.3 million in March 2016. The audience for laptop and desktops was 46.5 million in March 2016, while the mobile audience was 35.1 million.
81 This includes smartphones and tablets.
198

Figure 5.17 Active internet audience: March 2016
Source: comScore MMX, UK, home and work panel, March 2016; comScore MMX Multi-Platform, UK, March 2016; comScore Mobile Metrix UK, March 2016 Note: ‘Digital audience’ is the unique audience across desktop/laptops and mobile. Mobile audience includes Android smartphones and iOS smartphones and tablets. Only those entities that have been tagged as part of the census network report Android tablet usage data.
The average time spent online on smartphones was higher than on laptops and desktops in March 2016
The total digital audience spent an average of 81.8 hours online in March 2016. The average time spent online by a smartphone internet user in March 2016 was 59.6 hours.82 This is noticeably more than the average time spent online by internet users on laptops and desktops (30.7 hours in March 2016).83
82 Average time spent on smartphones is calculated by taking the total time spent online on smartphones in a given month and then dividing it by the total number of people who access the internet on a smartphone in a given month. 83 Average time spent on laptops and desktops is calculated by dividing the total time spent online on laptops and desktops in a given month by all the total number of laptop and desktop internet users in a given month.
50.346.5
35.1
0
10
20
30
40
50
60
Total digital audience Laptop and desktop audience Mobile audience
Million
199
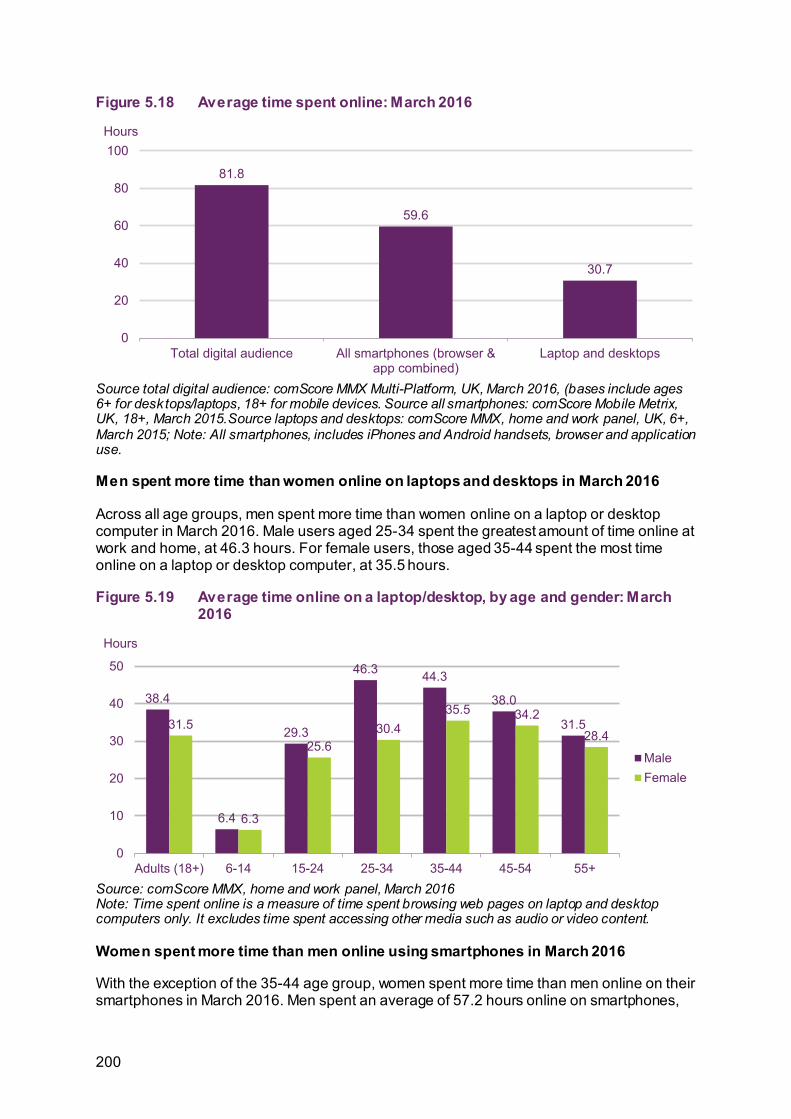
Figure 5.18 Average time spent online: March 2016
Source total digital audience: comScore MMX Multi-Platform, UK, March 2016, (bases include ages 6+ for desktops/laptops, 18+ for mobile devices. Source all smartphones: comScore Mobile Metrix, UK, 18+, March 2015.Source laptops and desktops: comScore MMX, home and work panel, UK, 6+, March 2015; Note: All smartphones, includes iPhones and Android handsets, browser and application use.
Men spent more time than women online on laptops and desktops in March 2016
Across all age groups, men spent more time than women online on a laptop or desktop computer in March 2016. Male users aged 25-34 spent the greatest amount of time online at work and home, at 46.3 hours. For female users, those aged 35-44 spent the most time online on a laptop or desktop computer, at 35.5 hours.
Figure 5.19 Average time online on a laptop/desktop, by age and gender: March 2016
Source: comScore MMX, home and work panel, March 2016 Note: Time spent online is a measure of time spent browsing web pages on laptop and desktop computers only. It excludes time spent accessing other media such as audio or video content.
Women spent more time than men online using smartphones in March 2016
With the exception of the 35-44 age group, women spent more time than men online on their smartphones in March 2016. Men spent an average of 57.2 hours online on smartphones,
81.8
59.6
30.7
0
20
40
60
80
100
Total digital audience All smartphones (browser &app combined)
Laptop and desktops
Hours
38.4
6.4
29.3
46.3 44.3
38.0
31.531.5
6.3
25.630.4
35.5 34.2
28.4
0
10
20
30
40
50
Adults (18+) 6-14 15-24 25-34 35-44 45-54 55+
MaleFemale
Hours
200

compared to 62.1 hours for women. For both men and women, the 18-24 age group spent the most time online, at 70 hours for men and 79 hours for women. Adults aged 55 and over spent the least amount of time online using their smartphones. The observation that younger adults spend more time online on their smartphones correlates with the high take-up of smartphones within this age group (Figure 5.11). It also supports the high proportion of the younger age groups who consider the smartphone to be their most important device for internet access (Figure 5.13).
Figure 5.20 Average time online on a smartphone, by age and gender: March 2016
Source: comScore Mobile Metrix, March 2016. Browser and application access combined. Note: Includes Android and iOS smartphones Note: Changes were made to comScore Mobile Metrix methodology in January 2016. comScore entities were affected to varying degrees.
Sending and receiving email remains the most common internet activity, after general browsing
In 2016, general browsing was the most popular internet activity, with 81% of adults claiming to have used the internet for this in the past week. Sending and receiving email was the second most popular activity, with 75% of adults claiming to have done this in the past week. The least common activity was using the internet to remotely control or monitor household appliances, sometimes described as a ‘smart-home’ application.
57.2
70.0
61.2 63.2
47.940.2
62.1
79.0
68.9
60.4
52.248.7
0
20
40
60
80
Adults (18+) 18-24 25-34 35-44 45-54 55+
MaleFemale
Hours
201

Figure 5.21 Claimed use of the internet for selected activities
Source: Ofcom Technology Tracker, H1 2016 Base: All adults aged 16+ who use the internet at home or elsewhere (n = 3100 UK) QE5A: Which, if any, of these do you use the internet for?
Google’s services attracted nearly 48 million UK visitors in March 2016
To identify the organisation with the largest total online audience across all of their services, we report an organisation’s comScore Property (the sites and apps owned by the organisation).
Google’s services were visited by 47.7 million users in the UK in March 2016, with Facebook and Microsoft attracting a similar number of users (39 million and 38.9 million unique users respectively). The unique audience of the Google Sites comScore Property reflects the high audience for the services that are captured within this, including Google Search and YouTube.
Four of the ten most popular comScore internet Properties in the UK were organisations based in the UK: the BBC, Sky’s sites, Trinity Mirror Group and Mail Online/ Daily Mail. The four UK organisations in the top ten were all related to media and communications: broadcasters (BBC sites and Sky sites) and publishers (Trinity Mirror Group and Mail Online/Daily Mail).
210121314
1115161818
2213
273130
174142
5150
4075
8196
16
87613
1111
1215
1122
141113
2712
15713
2712
72
316
202020
242627
303333
3541424344
535758
6367
8788
98
0% 20% 40% 60% 80% 100%
Remotely control/monitor household appliancesStreaming audio services
Listening to radioAccessing file through a cloud service
Use TwitterTrading/auctions
Finding/ downloading info for collegeUploading/ adding content to internet
Making voice calls using a VoIP service (e.g. Skype)Downloading music
Playing gamesUsing local council/ Government websites
Watching short video clipsAccessing news
Finding/ downloading info for workFinding health information
Instant messagingTV/ Video viewing
Using social networking sitesBanking
Purchasing goods/servicesSending and receiving email
General surfing/browsingAny
Used in the past week
Use less often
202

Figure 5.22 Top ten most popular comScore Properties among the total digital audience: March 2016
Source: comScore MMX Multi-Platform, UK, March 2016 All sites listed are at the property level [P]. Please note MMX Multi-Platform includes laptop/desktop browsing, laptop/desktop video streams, on-network and Wi-Fi mobile browsing and app use. Note: Starting with July 2013 data, comScore added tablet data to the mobile data field of MMX Multi-Platform. Only those entities that have been tagged as part of the census network report tablet usage data.
People spent most time browsing websites and apps owned by Google
In March 2016, UK visitors to Google-owned sites84 and apps spent nearly 42 billion minutes on them across laptop, desktops and mobile devices. The second most popular Property by time spent was Facebook (36.4 billion minutes); this includes Facebook, Messenger, Instagram and WhatsApp.
There were two Properties that were not among the ten most popular in terms of their digital audience size, but were among the ten most popular by time spent: Apple Inc. and Twitter.
84 Google-owned sites include Google Search, Google Maps, Gmail and YouTube.
47.7
39.0 38.9 37.0 36.932.6 30.3 28.4 27.5 27.3
0
10
20
30
40
50
60
Google Sites Facebook MicrosoftSites
AmazonSites
BBC Sites Yahoo Sites eBay Sky Sites Trinity MirrorGroup
MailOnline/Daily
Unique audience (millions)
203

Figure 5.23 Top ten comScore properties among the total digital audience, by time spent: March 2016
Source: comScore MMX Multi-Platform, UK, March 2016 Note: All sites listed are at the property level [P]. Time spent online is a measure of time spent laptop/desktop webpage browsing and on-network and Wi-Fi mobile browsing and application data. It excludes time spent accessing audio content
5.3.3 Search engines Google Search was the most-visited search engine in March 2016
Google Search had a digital audience of 39.3 million across all platforms in March 2016, constituting an active reach of 78% of the total digital audience. The second most visited search engine was Microsoft’s search engine, Bing, followed by Yahoo Search. The same ranking is seen across laptop and desktop audiences, as well as across the mobile audience.
Figure 5.24 Audience of search engines: March 2016
Source: comScore MMX Multi-Platform, comScore MMX, comScore Mobile Metrix, UK, March 2016 MMX Multi-Platform includes laptop/desktop browsing, laptop/desktop video streams and mobile use. ‘Total mobile’ includes Android smartphones and iOS smartphones and tablets. Only those entities that have been tagged as part of the census network report Android tablet usage data. Note: Changes were made to comScore Mobile Metrix methodology in January 2016. comScore entities were affected to varying degrees.
1.9
2.4
3.0
3.7
5.1
5.6
9.4
9.5
36.4
41.9
0 5 10 15 20 25 30 35 40 45
Sky Sites
Amazon Sites
eBay
Yahoo Sites
Microsoft Sites
BBC Sites
Apple Inc.
Google Sites
Total Minutes (billions)
39.3
21.3
13.0
35.2
18.7
11.7
19.5
5.62.8
0
10
20
30
40
50
Google Search [C] Bing [C] Yahoo Search [C]
Total digital audience Laptop and desktop audience Mobile audienceUnique audience (millions)
204
5.3.4 Online video-sharing services In this section we examine take-up and use of online video sharing sites in the UK, such as YouTube and Vimeo. These online video sites generally include other features and functionalities, such as the ability to comment on videos or share them on other social media sites such as Facebook and Twitter.
YouTube’s digital audience is higher on mobile devices than on desktops and laptops
Of all the selected online video sharing sites, YouTube had the largest digital audience in the UK, at 41 million in March 2016 (an active reach of 82% across the total digital audience). YouTube had a greater audience on mobile devices (which includes tablets) than on laptops and desktops in March 2016. The total mobile audience for YouTube was 3.4 million higher than the audience on laptops and desktops (27.6 million vs. 24.2 million respectively). YouTube’s active reach across the mobile audience was 55%, 7pp higher than the reach on laptops and desktops (48%). One reason why YouTube’s mobile audience is greater than its laptop and desktop audience is likely to be because the YouTube app is generally pre-installed on Android mobile devices.
Vimeo had the second largest unique audience in March 2016, at 17.4 million. As with YouTube, Vimeo’s mobile audience (8.8 million) and reach (18%) was higher on mobile devices than on laptops and desktops (2.2 million, with a reach of 4%). Vine, MSN Video and Twitch.TV were among the online video sites which had the lowest unique audiences and active reach in April 2016. Twitch.TV had the lowest unique audience overall, at 2.4 million (5% active reach), and had a similar unique audience across mobile devices and laptop and desktops (1 million and 1.4 million respectively). This could be due to the nature of the service and its appeal to a more select audience than other video sharing sites.85
85 Twitch.TV is a live streaming video platform that is targeted at video gamers. It allows users to watch live streams of users playing video games, and to broadcast their own streams. The service has a particularly high reach among younger age groups. In March 2016 16% of Twitch.TV’s digital audience was aged 18-24 (for cohorts between the ages of 25 and 55 and over, reach was less than 10%). Reach was particularly high among males aged 18-24, at 25% (compared with 6% of females aged 18-24).
205
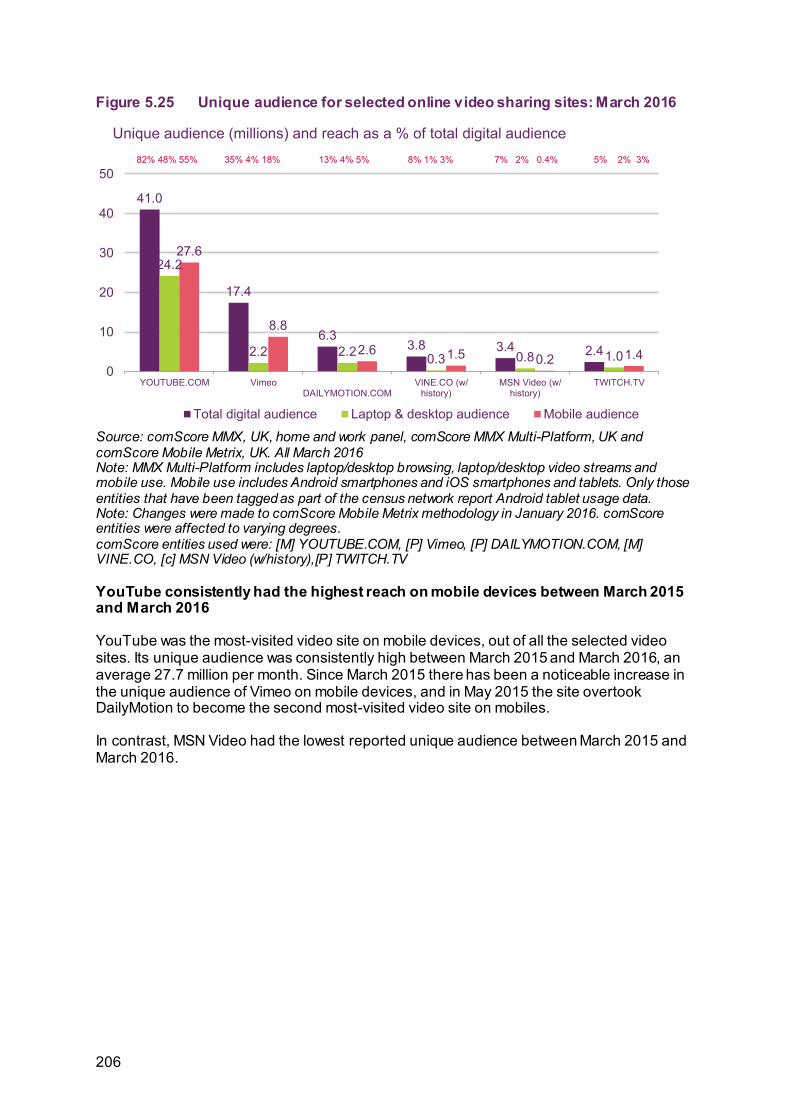
Figure 5.25 Unique audience for selected online video sharing sites: March 2016
Source: comScore MMX, UK, home and work panel, comScore MMX Multi-Platform, UK and comScore Mobile Metrix, UK. All March 2016 Note: MMX Multi-Platform includes laptop/desktop browsing, laptop/desktop video streams and mobile use. Mobile use includes Android smartphones and iOS smartphones and tablets. Only those entities that have been tagged as part of the census network report Android tablet usage data. Note: Changes were made to comScore Mobile Metrix methodology in January 2016. comScore entities were affected to varying degrees. comScore entities used were: [M] YOUTUBE.COM, [P] Vimeo, [P] DAILYMOTION.COM, [M] VINE.CO, [c] MSN Video (w/history),[P] TWITCH.TV
YouTube consistently had the highest reach on mobile devices between March 2015 and March 2016
YouTube was the most-visited video site on mobile devices, out of all the selected video sites. Its unique audience was consistently high between March 2015 and March 2016, an average 27.7 million per month. Since March 2015 there has been a noticeable increase in the unique audience of Vimeo on mobile devices, and in May 2015 the site overtook DailyMotion to become the second most-visited video site on mobiles.
In contrast, MSN Video had the lowest reported unique audience between March 2015 and March 2016.
41.0
17.4
6.33.8 3.4 2.4
24.2
2.2 2.2 0.3 0.8 1.0
27.6
8.8
2.6 1.5 0.2 1.40
10
20
30
40
50
YOUTUBE.COM VimeoDAILYMOTION.COM
VINE.CO (w/history)
MSN Video (w/history)
TWITCH.TV
Total digital audience Laptop & desktop audience Mobile audience
Unique audience (millions) and reach as a % of total digital audience82% 48% 55% 35% 4% 18% 13% 4% 5% 8% 1% 3% 7% 2% 0.4% 5% 2% 3%
206

Figure 5.26 Unique audience of selected online video sharing sites on mobile phones: March 2015 to March 2016
Source: comScore Mobile Metrix, March 2015-March 2016 Note: Mobile use includes Android smartphones and iOS smartphones and tablets. Only those entities that have been tagged as part of the census network report Android tablet usage data. comScore entities used were: [M] YOUTUBE.COM, [P] Vimeo, [P] DAILYMOTION.COM, [M] VINE.CO (w/history), [P] TWITCH.TV, [c] MSN Video (w/history). Note: Changes were made to comScore Mobile Metrix methodology in January 2016. comScore entities were affected to varying degrees.
5.3.5 Online retail and mobile payments In this section we examine take-up and use of online retail sites and mobile payment services in the UK.
Almost two-thirds of the UK digital population visited Amazon in April 2016
Of all the selected online retail services, Amazon had the largest digital audience across all devices (laptops, desktops and mobile devices), at 32.5 million visitors in April 2016 (65% of the total digital audience). eBay was the second most popular online retail site visited in April 2016, with 29.2 million visitors (65% of the total digital audience), followed by Argos with 14 million visitors (48% of the total digital audience).
With the exception of John Lewis, Marks & Spencer and Next, more people accessed online retail services on mobile devices rather than on laptops and desktops.
0
10
20
30
40
Mar-2015 Apr-2015 May-2015 Jun-2015 Jul-2015 Aug-2015 Sep-2015 Oct-2015 Nov-2015 Dec-2015 Jan-2016 Feb-2016 Mar-2016
YOUTUBE.COM Vimeo DAILYMOTION.COM
VINE.CO (w/ history) TWITCH.TV MSN Video (w/ history)
Unique audience (millions)
207

Figure 5.27 Digital audience of selected online retail services: April 2016
Source: comScore MMX Multi-Platform, comScore MMX, comScore Mobile Metrix UK, April 2016 Note: MMX Multi-Platform includes laptop/desktop browsing, laptop/desktop video streams and mobile use. Mobile use includes Android smartphones and iOS smartphones and tablets. Only those entities than have been tagged as part of the census network report Android tablet usage data. comScore entities used were: [M] Amazon, [M] eBay sites, [M] Argos, [M] TESCO.COM*, [M] MARKSANDSPENCER.COM, [M] Asda, [M] John Lewis, [M] NEXT.CO.UK, [M](u) ASOS.COM and [M] DEBENHAMS.COM. *Indicates that the entity has assigned traffic to certain pages in the domain to other entities Note: Changes were made to comScore Mobile Metrix methodology in January 2016. comScore entities were affected to varying degrees.
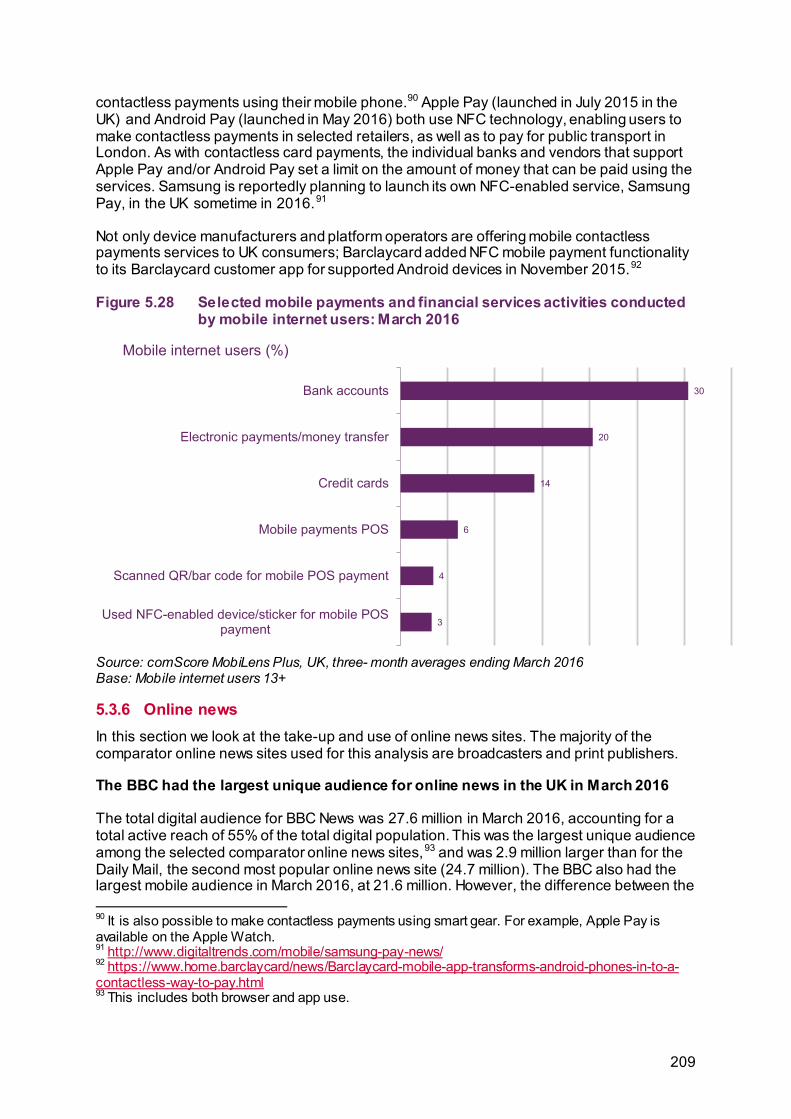
Three in ten mobile internet users accessed their bank account via their mobile phone in March 2016
Thirty per cent of mobile internet users accessed their bank account via their mobile phone at least once a month (using a three-month average). This is more than double the proportion of mobile internet users who accessed their credit card accounts via their mobile phone (14%). Electronic payments/ money transfers were also a popular activity; two in ten (20%) mobile internet users used their mobile phone to do this activity at least once a month. This is a stark difference to the 6% who made a mobile payment at a physical point of sale (POS).86
A similar proportion of mobile internet users made mobile payments using near-field communications (NFC)87 and QR codes88 (4% and 3% respectively). A range of mobile payment services are available in the UK89 that use NFC technology to allow users to make
86 This figure is of total net mobile payments at a point of sale. There may be some overlap in those who used QR codes and NFC technology to make payments. 87 NFC technology allows users to make payments by holding their NFC-equipped phone against a reader that can also be used to read contactless payment cards and tickets. 88 QR codes are a type of two-dimensional barcodes and can be used as an alternative to NFC technology for mobile payments. 89 Note, the whole range of available contactless payment services is not covered by comScore MobiLens Plus.
4.7
4.8
5.3
5.3
6.5
8.4
11.6
14.0
29.2
32.5
2.4
2.9
2.6
3.2
3.6
3.6
4.8
6.6
17.9
20.4
2.8
2.4
3.2
2.7
3.6
5.7
8.2
9.2
19.9
23.3
0 10 20 30 40
DEBENHAMS.COM
NEXT.CO.UK
ASOS.COM
John Lewis
MARKSANDSPENCER.COM
Asda
TESCO.COM*
Argos
eBay Sites
Amazon
Mobile audienceDesktops & LaptopsTotal digital audience
Unique audience (millions)
208
contactless payments using their mobile phone.90 Apple Pay (launched in July 2015 in the UK) and Android Pay (launched in May 2016) both use NFC technology, enabling users to make contactless payments in selected retailers, as well as to pay for public transport in London. As with contactless card payments, the individual banks and vendors that support Apple Pay and/or Android Pay set a limit on the amount of money that can be paid using the services. Samsung is reportedly planning to launch its own NFC-enabled service, Samsung Pay, in the UK sometime in 2016.91
Not only device manufacturers and platform operators are offering mobile contactless payments services to UK consumers; Barclaycard added NFC mobile payment functionality to its Barclaycard customer app for supported Android devices in November 2015.92
Figure 5.28 Selected mobile payments and financial services activities conducted by mobile internet users: March 2016
Source: comScore MobiLens Plus, UK, three- month averages ending March 2016 Base: Mobile internet users 13+
5.3.6 Online news In this section we look at the take-up and use of online news sites. The majority of the comparator online news sites used for this analysis are broadcasters and print publishers.
The BBC had the largest unique audience for online news in the UK in March 2016
The total digital audience for BBC News was 27.6 million in March 2016, accounting for a total active reach of 55% of the total digital population. This was the largest unique audience among the selected comparator online news sites,93 and was 2.9 million larger than for the Daily Mail, the second most popular online news site (24.7 million). The BBC also had the largest mobile audience in March 2016, at 21.6 million. However, the difference between the
90 It is also possible to make contactless payments using smart gear. For example, Apple Pay is available on the Apple Watch. 91 http://www.digitaltrends.com/mobile/samsung-pay-news/ 92 https://www.home.barclaycard/news/Barclaycard-mobile-app-transforms-android-phones-in-to-a-contactless-way-to-pay.html 93 This includes both browser and app use.
3
4
6
14
20
30
Used NFC-enabled device/sticker for mobile POSpayment
Scanned QR/bar code for mobile POS payment
Mobile payments POS
Credit cards
Electronic payments/money transfer
Bank accounts
Mobile internet users (%)
209

mobile audience for the Daily Mail, at 19.6 million, was much smaller than the difference between the total digital audiences for these two entities.
Of all the selected comparator news sites, the Huffington Post had the lowest unique total digital audience and mobile audience.
The most popular news sites in the UK are those provided by organisations with a presence on other media, typically print or broadcast. The Independent is now the digital-only news site with the highest reach, following the closure of its print operations in March 2016.
Figure 5.29 Unique audience and reach of selected news services: March 2016
Source: comScore MMX Multi-Platform and Mobile Metrix, UK, March 2016 Note: MMX Multi-Platform includes laptop/desktop browsing, laptop/desktop video streams and mobile use. Mobile includes Android smartphones and iOS smartphones and tablets. Only those entities that have been tagged as part of the census network report Android tablet usage data. comScore entities used were: [C] BBC News, [M] DAILYMAIL.CO.UK, [P] The Guardian, [C] MIRROR.CO.UK, [M] TELEGRAPH.CO.UK, [M] INDEPENDENT.CO.UK, [P] BUZZFEED.COM, [M] METRO.CO.UK, [M] ITV News, [C] The Sun UK, [M] VICE.COM, [C] HUFFINGTONPOST.CO.UK* *Indicates that the entity has assigned traffic to certain pages in the domain to other entities Note: Changes were made to comScore Mobile Metrix methodology in January 2016. comScore entities were affected to varying degrees.
5.3.7 Online advertising In this section we use data reported by the AA WARC Expenditure Report April 2016 and the IAB/PwC Digital Adspend 2015, which draws on data reported by the industry to IAB/PwC. We also use comScore’s MobiLens Plus product to determine the reach of, and attitudes to, particular types of advertising among mobile internet users.
2.2
2.4
3.1
7.6
9.0
11.6
13.5
16.2
15.8
18.4
19.6
21.6
3.3
3.8
5.4
8.4
10.6
13.6
16.2
19.2
20.5
23.3
24.7
27.6
0 5 10 15 20 25 30
HUFFINGTONPOST.CO.UK*
VICE.COM
The Sun UK
ITV News
METRO.CO.UK
BUZZFEED.COM
INDEPENDENT.CO.UK
MIRROR.CO.UK
TELEGRAPH.CO.UK
The Guardian
DAILYMAIL.CO.UK
BBC News
Total digital audience Mobile audience
Unique audience (millions) / Total active reach (%)
55%
49%
46%
41%
38%
32%
27%
21%
17%
11%
7%
7%
210

Total UK internet advertising expenditure increased by 17.3% in 2015
Total UK expenditure on internet advertising grew by 17.3% to £8.6bn in 2015. Internet advertising continues to be the largest type of ad spend in the UK,94 and accounted for 41.1% of the total estimated UK advertising spend in 2015. Estimated advertising spend on TV reached £5.3bn (including digital spend) in 2015, the majority of which was spot advertising, at £4.7bn.
Among the press brands, digital advertising stood at £702m in 2015, exceeding the total ad spend for radio (£592m) and cinema (£238m). Within the press brand category, digital advertising expenditure on regional news brands rose by 14.8% in 2015 to £199m, while digital advertising expenditure on magazines rose by 6.1% to £283m. National news brand digital spend grew by 2.5% in 2015 to £220m.
Figure 5.30 UK advertising expenditure: 2015
Source: AA/WARC Expenditure Report, April 2016 Note: ‘Press brands’ is a consolidation of magazine brands and national and regional news brands. Total digital advertising spend is double-counted in digital TV spend (broadcaster VOD revenue), and in ‘press brands’ digital spend. Note: The AA/WARC data are net of discounts, and includes agency commission, but excludes production costs.
Paid-for search remains the highest type of expenditure, accounting for 51% of total digital advertising expenditure in 2015
In the following sections, we use data from the IAB/PwC Digital Adspend 2015 report. Following the conventions of this report, we are highlighting the published like-for-like comparisons; these include figures from companies which submitted figures in both 2014 and 2015.
Total estimated digital advertising expenditure grew by 16.4% year on year, from £7.3bn to £8.6bn in 2015. Paid-for search advertising accounted for half of digital ad spend, at £4.4bn (51% of total digital ad spend), a 15.3% year-on-year increase.
94 Internet has been the largest ad channel in the UK since 2011.
2636
5095
702
175
238
592
1059
1861
3338
5270
8606
0 5000 10000
Cinema
Radio
Out of home
Direct mail
Press brands
TV
Internet
Non-digitalDigital
Expenditure (£ millions)
211

Display advertising was the fastest-growing type of digital ad spend, increasing by 24.5% year on year to £3bn in 2015 (a 35% share of total digital ad spend). Banner adverts were the largest type of display advertising, at £1.4bn, and accounted for 48% of display advertising spend. Content and native advertising accounted for a quarter (26%) of display advertising (£776m, up 49.8% year on year), followed by online video95 at 23% of display advertising (£711m, up 51% year on year).
Figure 5.31 Digital advertising expenditure by type: 2009-2015
Source: IAB / PwC Digital Adspend 2009-2015
Pre-post roll advertising was the highest source of online video revenue in 2015
Pre-post roll advertising96 remained the highest source of online video revenue, generating £711m in 2015 (up 23.9% year on year). Revenue generated from viral video & other advertising97 fell by 34.6% year on year, from £34m to £21m.98 Outstream / in-read video99 (a new category added in 2015) generated £148m in 2015.
95 Includes outstream / in-read video advertising (new for 2015), pre-post roll and viral video & other. 96 These are the video adverts which are shown before, during and after a user plays a video on a website or app. 97 This includes ‘viral’ video content as well as videos served in a social environment such as Facebook or Twitter. 98 The drop in ‘viral video & other’ between 2014 and 2015 is because social revenues were re-categorised from this to ‘outstream / in-read’ video. The fall could also be due to inconsistencies between the years in terms of the number of media owners submitting revenues into that category. There is some re-classification, but a change in submitters will tend to have a more noticeable effect on a small category like ‘viral video’. 99 This includes static ads that appear in-feed or in-stream. Two examples of this are social in-feed (e.g. Facebook) and also within news sites. Revenue for video in-feed ads or in-stream should be included in social video if on a social media platform, or in outstream / in-read if on a non-social platform.
Expenditure (£ millions)
772 1,051 1,280 1,479 1,825 2,421 3,033658 718 759 818
8821,050
1,115
2,0972,245
2,7083,087
3,471
3,768
4,355
3284
7564
79
96
103
3,5594,097
4,8225,448
6,2587,335
8,606
0
2000
4000
6000
8000
10000
2009 2010 2011 2012 2013 2014 2015
OtherPaid for searchClassifiedsDisplay
212

Figure 5.32 Digital display video advertising revenue: 2009-2015
Source: IAB / PwC Digital Adspend 2009 -2015 Note: ‘Viral video’ was originally named ‘social video’. It was changed to ‘viral video’ in 2015 to avoid confusion with video hosted on social media sites. It was also combined with ‘other’ video in 2015. ‘Out stream / in-read video’ is a new category for 2015, which includes video advertising on social media sites such as Facebook and Twitter.
Mobile display advertising expenditure grew by 58.8% to £1.3bn in 2015
Total mobile advertising expenditure grew by 60.3% (£996m) year on year to £2.6bn in 2015. Mobile search advertising spend grew by 63.6% in 2015 to £1.3bn, while mobile display advertising spend rose by 58.8% to £1.3bn.
Figure 5.33 Mobile advertising expenditure: 2011-2015
Source: IAB / PwC Digital Adspend 2011 -2015
£ millions
28 53 105178
288437
542
1322
22
34
21
148
28 53118
200
310
471
711
0
200
400
600
800
1000
2009 2010 2011 2012 2013 2014 2015
Out stream / in readViral video + otherPre-post roll
Expenditure (£ millions)
137365
581800
1,306
60
153
424
812
1,297
6
11
16
19
24
203
529
1,021
1,631
2,627
0
500
1000
1500
2000
2500
3000
2011 2012 2013 2014 2015
Other
Display
Search
213

The majority of mobile internet users experienced display advertising in April 2016
This next section focuses on data from comScore’s MobiLens Plus product.
A quarter of mobile internet users experienced display advertising in April 2016 (three-month average). Display advertising on websites uses various media, such as images, audio, video and text, to communicate the advertising message to the end-user. Video advertising was the second most common type of advertising experienced by mobile internet users, at 15%.
Push notifications were experienced by the fewest mobile internet users, at 12% in April 2016. Push notifications are message alerts that automatically appear on-screen on mobile devices. They originate from apps which are installed by the mobile user on their device. Users do not have to be using the app itself, and their device can be locked, but will still receive these notifications. Push notifications therefore reach only those mobile users who have installed apps, and typically users are given the choice to opt in to receive notifications. This may explain the low proportion of mobile internet users who have experienced push notifications.
Figure 5.34 Type of advertising experienced by mobile internet users: April 2016
Source: comScore MobiLens Plus, UK, three-month averages ending April 2016 Base: Mobile internet users 13+
25
15 14 1412
0
10
20
30
Display Video Email SMS Push notifications
Mobile internet users (%)
214

Ad blocking While digital and mobile advertising continue to be growing areas of expenditure for advertisers, research suggests that this can be disruptive to the consumer experience. Ad blocking is a means of blocking these forms of advertising. Ad-blocking technology either hides online advertising, or stops adverts from being loaded on a webpage.
The majority of ad blocking occurs on laptop and desktops, where it is simple and effective. One of the most common forms of ad blocking is at the browser level; tools can be downloaded and added as an extension to a web browser, and these filter out content according to a set of criteria. It is slightly more difficult to block advertising on mobile devices, because the owner of the operating system has control over the software installed on the device. In addition, ad blockers which filter out adverts at a browser level would not be effective in blocking advertisements that appear within mobile applications. However, some options are available.100
Research suggests that consumers seek to use ad blockers because they dislike certain types of more intrusive ad formats, rather than a dislike of the adverts themselves. They often find them intrusive, irrelevant and distracting from the online experience.101
Consumer research estimates that 22% of online adults are currently using ad blockers in the UK. Of these, 26% are doing so on smartphones, and 21% on tablets. The most common use of ad blocking is on laptops and desktops (72% and 41% respectively).102
100 Enders Analysis 101 Enders Analysis 102 IAB Ad blocking Software Consumer Usage and Attitudes, Wave 4, February 2016
215


![[2013] Ofcom - The Communications Market Report 2013](https://static.documents.pub/doc/80x56/5568613bd8b42a203d8b49c7/2013-ofcom-the-communications-market-report-2013.jpg)


