66
The Communications Market 2015 2 2 Television and audio- visual 143
The Communications Market 2015
2
2 Television and audio-visual
143

Contents
2.1 Key market developments in TV and audio-visual 145
2.1.1 Industry metrics and summary 145 2.1.2 TV industry revenue up 3.1% in 2014 to £13.2bn 147 2.1.3 Internet-connected TVs on the rise while HD growth slows and 3D falters 151 2.1.4 The majority of TV viewing is of traditional live TV, but this has recently
declined 156
2.2 The TV and audio-visual industries 163
2.2.1 Summary 163 2.2.2 Television industry revenue 164 2.2.3 TV revenue among multichannel genres 170 2.2.4 Spend on UK television programmes 171 2.2.5 UK independent sector 172 2.2.6 Spend on first-run UK-originated content by the main five PSB channels 174 2.2.7 Television output on the PSB channels 175 2.2.8 Television output and spend in the multichannel sector 181
2.3 The TV and audio-visual viewer 185
2.3.1 Summary 185 2.3.2 Platform take-up 187 2.3.3 Consumer attitudes towards television 205
144

2.1 Key market developments in TV and audio-visual 2.1.1 Industry metrics and summary Figure 2.1 Industry metrics
Source: Ofcom/broadcasters/Advertising Association/Warc/BARB/GfK. Note: Expressed in nominal terms. Public funds include DCMS grant to S4C, as well as BBC funding that is allocated to TV (including the proportion of licence fee revenue that goes to S4C). Broadcaster share as a proportion of total display advertising spend excludes direct mail and classified ads and is based on Advertising Association/Warc Expenditure Report. The AA/Warc data are net of discounts, and includes agency commission, but excludes production costs. Spend on originations includes spend on nations and regions programming (not Welsh or Gaelic language programmes but some Irish language). TV viewing based on BARB analysis of viewing to scheduled TV programmes such as those listed in TV listings magazines or on electronic programme guides (EPG) on TV sets. Minutes spent watching TV per day declined by 11 minutes year on year although values appear not to equate to 11 minutes due to rounding.
This section examines key developments and trends seen in the UK television market during the past year. However, for detailed analysis of developments in video on demand, and changes in viewing to broadcast TV, please refer to sections 1.5.3 and 1.5.4 in the Market in Context chapter.
• The UK television industry generated £13.2bn in revenue during 2014, an increase of 3.1% (£392m) year on year. Pay-TV subscription revenue continued to be one of the main drivers behind the industry’s growth, with a 1.9% increase year on year and a compound annual growth of 5.2% over the last five years.
• Broadcast-based TV advertising revenue increased by 3.9% in 2014 to reach £3.8bn. The largest proportional increase was among the multichannels (excluding the PSB portfolio channels) where advertising revenues increased by 7.7% year on year, to reach over £1bn for the first time since Ofcom began reporting. The PSB
UK television industry 2009 2010 2011 2012 2013 2014
Total TV industry revenue (£bn) 11.1 11.8 12.4 12.5 12.8 13.2
Proportion of revenue generated by public funds 23% 22% 21% 21% 20% 21%
Proportion of revenue generated by advertising 28% 30% 29% 28% 29% 29%
Proportion of revenue generated by subscriptions 42% 43% 44% 44% 46% 45%
Broadcaster share of total display advertising spend 41% 42% 43% 43% 43% 44%
Spend on originated output by 5 main networks (£bn) 2.4 2.5 2.5 2.6 2.5 2.6
Digital TV take-up (% all households) 88% 92% 94% 96% 95% 93%
Proportion of DTV homes with pay satellite or cable 53% 56% 51% 51% 52% 51%
Minutes spent watching TV per day (per person aged 4+) 225 242 242 241 232 220
Share of the main five channels in all homes 58% 56% 54% 52% 51% 51%
Number of channels broadcasting in the UK 490 510 515 529 527 536
145
portfolio channels also experienced gains in net advertising revenue in 2014, increasing by 2.2% to £653m.
• Broadcast TV advertising has held up well as a proportion of all display advertising. According to WARC, total display advertising expenditure (i.e. including all forms of media such as press, online and TV) stood at £10.6bn in 2014, of which broadcaster display advertising accounted for 43.5%, an increase of 2.5 percentage points over the past five years, despite increased competition from online display advertising.
• Online TV revenue in the UK has increased rapidly in the past five years but still represents only a small proportion of total TV revenues. According to data from IHS, revenue from online TV grew by 38% in 2014 to £793m, with income from online TV subscriptions increasing by 53% to £317m, driven by the increasing popularity of services such as Netflix and Amazon Prime Instant Video.
• Ofcom estimates that the BBC allocated £2.7bn to its television services in 2014, an increase of 5.1% since 2013. This is mainly due to the BBC’s TV coverage of major sporting events in 2014 compared to 2013, most notably the FIFA World Cup in Brazil and the Commonwealth Games in Glasgow. The cost of the licence fee remained unchanged at £145.50.
• Over half (56%) of UK TV homes had a TV connected to the internet, either via a set-top box or a smart TV, at the end of 2014. However, this figure is likely to be higher when other third-party devices, which can also be used to connect TVs to the internet, such as games consoles or streaming devices (e.g. Now TV or Chromecast), are included.
• Two-thirds (64%) of TV homes now have a digital video recorder (DVR), although in the past year this figure has increased by only two percentage points (from 62% in 2014) suggesting that the penetration of DVRs may be beginning to plateau.
• Growth in take-up of HDTV services has slowed, and 3DTV is failing to gain traction. Take-up of HDTV services increased marginally, by four percentage points, from 53% in 2014 to 57% in 2015. Despite 3D services having been available since 2010, less than one in ten (7%) of UK TV homes in 2015 claimed to watch TV content in 3D.
• Viewing to traditional live television as it is broadcast fell from 3 hours 45 minutes (225 minutes) per person per day in 2010 to 3 hours 13 minutes (193 minutes) in 2014. Watching programmes previously recorded on devices47 or through catch-up services48 (time-shifted) among all individuals has grown over the same period (from 17 minutes a day to 27 minutes a day), but the main way people watch programmes continues to be at the time of broadcast (88%).
47 These include DVRs such as Sky+, TiVo, Freeview+ and Freesat+, DVD recorders or video cassette recorders, as well through catch-up players, including games consoles and smart TVs. Viewing up to seven days after broadcast is reported by BARB. 48 Broadcaster catch-up services such as BBC iPlayer, ITV on demand, 4OD, Demand 5 etc. Viewing up to seven days after broadcast is reported by BARB.
146
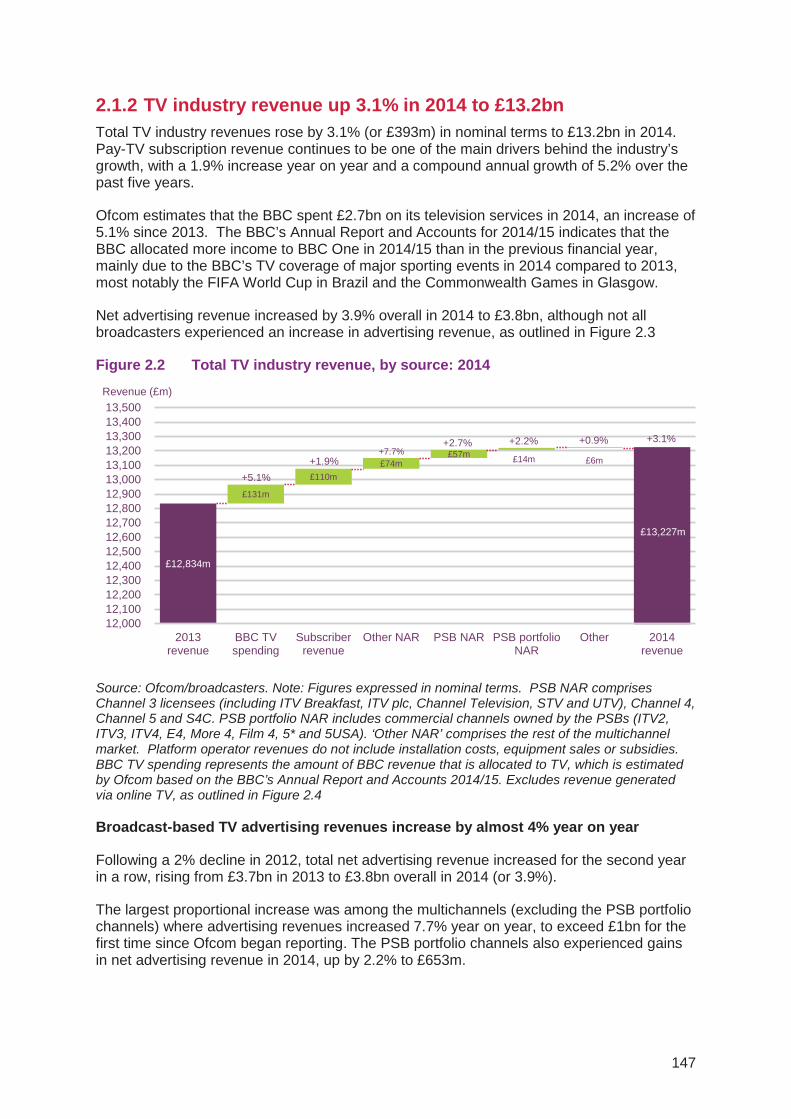
2.1.2 TV industry revenue up 3.1% in 2014 to £13.2bn Total TV industry revenues rose by 3.1% (or £393m) in nominal terms to £13.2bn in 2014. Pay-TV subscription revenue continues to be one of the main drivers behind the industry’s growth, with a 1.9% increase year on year and a compound annual growth of 5.2% over the past five years.
Ofcom estimates that the BBC spent £2.7bn on its television services in 2014, an increase of 5.1% since 2013. The BBC’s Annual Report and Accounts for 2014/15 indicates that the BBC allocated more income to BBC One in 2014/15 than in the previous financial year, mainly due to the BBC’s TV coverage of major sporting events in 2014 compared to 2013, most notably the FIFA World Cup in Brazil and the Commonwealth Games in Glasgow.
Net advertising revenue increased by 3.9% overall in 2014 to £3.8bn, although not all broadcasters experienced an increase in advertising revenue, as outlined in Figure 2.3
Figure 2.2 Total TV industry revenue, by source: 2014
Source: Ofcom/broadcasters. Note: Figures expressed in nominal terms. PSB NAR comprises Channel 3 licensees (including ITV Breakfast, ITV plc, Channel Television, STV and UTV), Channel 4, Channel 5 and S4C. PSB portfolio NAR includes commercial channels owned by the PSBs (ITV2, ITV3, ITV4, E4, More 4, Film 4, 5* and 5USA). ‘Other NAR’ comprises the rest of the multichannel market. Platform operator revenues do not include installation costs, equipment sales or subsidies. BBC TV spending represents the amount of BBC revenue that is allocated to TV, which is estimated by Ofcom based on the BBC’s Annual Report and Accounts 2014/15. Excludes revenue generated via online TV, as outlined in Figure 2.4
Broadcast-based TV advertising revenues increase by almost 4% year on year
Following a 2% decline in 2012, total net advertising revenue increased for the second year in a row, rising from £3.7bn in 2013 to £3.8bn overall in 2014 (or 3.9%).
The largest proportional increase was among the multichannels (excluding the PSB portfolio channels) where advertising revenues increased 7.7% year on year, to exceed £1bn for the first time since Ofcom began reporting. The PSB portfolio channels also experienced gains in net advertising revenue in 2014, up by 2.2% to £653m.
£12,834m
£13,227m
£131m
£110m£74m
£57m £14m £6m
12,00012,10012,20012,30012,40012,50012,60012,70012,80012,90013,00013,10013,20013,30013,40013,500
2013revenue
BBC TVspending
Subscriberrevenue
Other NAR PSB NAR PSB portfolioNAR
Other 2014revenue
Revenue (£m)
+7.7%
+5.1%
+2.7% +2.2% +0.9%
+1.9%
+3.1%
147

Income obtained by advertising among the commercial PSBs varied by broadcaster. ITV/ STV/ UTV had the largest increase, with advertising revenues increasing by 6.1% to £1.3bn, while Channel 4 and Channel 5 had year-on-year declines of 0.6% and 5.7% respectively.
Figure 2.3 Advertising revenue, by share: 2013-2014
Source: Ofcom/broadcasters. Note: TV advertising includes revenues that broadcasters receive from the sale of advertisements on screen (net of agency fees) and excludes video on demand. Totals may not equal the sum of the components due to rounding. ITV1/Channel 3 includes ITV Plc, STV, UTV and Channel Television.
Online TV revenue continues to increase steeply but still represents only a small proportion of total TV revenue
Ofcom’s calculation of TV revenue includes the traditional revenue sources of subscription fees, advertising revenue and public funding. However, online TV revenue in the UK has increased rapidly in the past five years, from £95m in 2009 to £793m in 2014, according to data from IHS. Although still small relative to the overall TV market in terms of revenue, income from online TV grew by 38% year on year.
The subscription model for online audio-visual content access saw continued growth in 2014, as its revenue grew by 53% to reach £317m, driven predominantly by the increased popularity of services such as Netflix and Amazon Prime Instant Video. The subscription model now represents the principal contributor to overall online TV revenues, accounting for 40% of the total.
The free-to-view (FTV) business model represents the second largest segment, contributing £240m in 2014. The principal driver of this revenue stream is advertising, and catch-up services such as ITV Player, All 4 and Demand 5 are all funded wholly or in part by this business model.
The download-to-own business model (DTO) experienced further growth in 2014, up by 28% year on year to £155m, while pay-per-view increased 42% to £81m in 2014.
£m
£1,247m £1,323m
£485m £483m£303m £285m
£968m £1,043m
£639m £653m£50m £51m
0
1,000
2,000
3,000
4,000
2013 2014
ITV Breakfast
PSB portfoliochannelsOther multichannels
Channel 5
Channel 4/S4C
ITV1/STV/UTV
£ 3,838m£3,693m 1-year change (%)3.9%
6.1%
-5.7%
1.4%
-0.6%
2.2%
7.7%
148

Figure 2.4 Online TV revenues
Source: IHS. Note: FTV (free to view) refers to services delivering online video free to the consumer. Number of FTV streams includes both ad-supported services and services funded through other means (such as BBC iPlayer). FTV revenues include advertising revenues only. PPV (pay-per-view) refers to a method of renting digital content whereby customers commonly choose content on ‘a la carte’ basis and pay to watch it for a limited period. The category includes all content consumed on an on-demand basis, including traditional PPV (such as live sports) and VoD. DTO (download-to-own) refers to a method of obtaining content that gives the customer ownership over the files they have downloaded, allowing them to use the content as many times as they like. Includes only revenue from long form video content and excludes revenues generated from online usergenerated content.
Figure 2.5 compares advertising and sponsorship income obtained via traditional broadcast TV with advertising revenue generated via free-to-view online TV services such as ITV Player and All 4.
The chart illustrates that although online TV advertising revenues have grown significantly in the past five years; to £240m in 2014, they still represent only a very small proportion (5.6%) of the total TV advertising and sponsorship market; and the vast majority of TV advertising income is still generated via traditional broadcast television.
Figure 2.5 Total cross-platform advertising and sponsorship revenue
Source: Ofcom/broadcasters/IHS. All figures are nominal
Annual Growth
38%
26%
53%
42%
28%£33m £66m £75m £92m £121m £155m£25m £38m£57m
£81m
£23m £25m
£104m
£207m
£317m
£32m
£74m£113m
£145m
£190m
£240m
£95m
£180m£238m
£379m
£574m
£793m
0
100
200
300
400
500
600
700
800
900
2009 2010 2011 2012 2013 2014
FTV Ad Revenues
Subscriptions
PPV transactions
DTO transactions
£m
£3,143m£3,491m £3,630m £3,547m £3,693m £3,838m
£189m
£179m£176m £184m
£192m£208m
£74m£113m £145m
£190m£240m
£3,364m
£3,745m£3,919m £3,876m
£4,075m£4,285m
0
1,000
2,000
3,000
4,000
5,000
2009 2010 2011 2012 2013 2014
FTV Online AdRevenues
All BroadcasterSponsorship
All BroadcasterNAR
Annual Growth
5.2%
26.2%
8.2%
3.9%
£m
149

Broadcast TV advertising has held up well as a proportion of all display advertising
According to WARC, total display advertising expenditure (i.e. including all forms of media such as press, online and TV) stood at £10.6bn in 2014, of which broadcaster display advertising spend accounted for 43.5%.
Despite the increase of online advertising, broadcaster advertising revenue as a proportion of all display advertising has proved resilient, increasing by 2.5 percentage points over the past five years.
Figure 2.6 Broadcaster percentage share of all display advertising expenditure
Source: AA/Warc Expenditure Report. Note: Total display advertising expenditure includes television ads, TV sponsorship, TV VoD, radio, out of home, cinema, national and regional press display, internet and consumer magazines but does not include response advertising such as direct mail or classified ads. Broadcaster display ads include broadcast-based TV advertising, sponsorship and online VoD ad revenue. Figures are nominal.
£bn
41.0% 41.6% 42.6% 43.2% 43.1% 43.5%
59.0%58.4% 57.4% 56.8% 56.9%
56.5%
£8.5bn£9.6bn £9.8bn £9.8bn £10.0bn
£10.6bn
0
2
4
6
8
10
12
2009 2010 2011 2012 2013 2014
All other displayadvertising
Broadcasterdisplay ad spend
150

2.1.3 Internet-connected TVs on the rise while HD growth slows and 3D falters
Smart TV: ‘Smart TV’ refers to a stand-alone television set with inbuilt internet functionality. Users connect to the internet via a broadband router or modem. Smart TVs are produced by consumer electronics manufacturers including Samsung, Sony, Panasonic and LG. The definition does not include television sets connected to the internet via a third-party device such as a set-top box, a games console or a laptop/PC.
TV connected via other device: Internet-enabled set-top boxes are third-party devices which enable reception of digital television broadcasts via an existing aerial, satellite dish or cable to a television, in addition to connecting the television set to the internet via a router. Internet-enabled set-top boxes include Virgin TiVo, Sky+, YouView and Freesat receivers. It is also possible to connect television sets to the internet via a third-party device other than a set-top box, such as via a games console, tablet, laptop/PC or Blu-ray/DVD player.
Over-the-top content: Over-the-top content refers to video, audio, and other media content delivered over the internet rather than via a service provider’s network. The consumer accesses this content via an internet connection independently of his or her contract with a network operator.
Over half (56%) of adults had a connected TV at the end of 2014 Ofcom’s TechnologyTracker indicates that take-up of smart TVs (with in-built internet connectivity) among UK TV homes stood at 21% at the start of 2015, a figure which has almost doubled over the past year (from 12% in 2014).
However, the most popular method for connecting a TV to the internet is via a set-top box (such as a Sky+, Virgin TiVo or YouView box). Research from media consultancy 3 Reasons estimates that 56% of UK TV homes had a TV connected to the internet, either via a set-top box or a smart TV, at the end of 2014. However, this figure is likely to be higher when other third-party devices which can also be used to connect TVs to the internet, such as games consoles or streaming devices (e.g. Chromecast) are included.
Figure 2.7 Take-up of smart TVs among UK TV households
Source: Ofcom Technology Tracker, W1 2015. Base: All adults aged 16+ with a TV in the household (n = 3616). QH15(QH62): Are any of your TV sets 'smart TVs'?
712
21
0
5
10
15
20
25
2013 2014 2015
Smart TVownership
% of UK TV homes
151
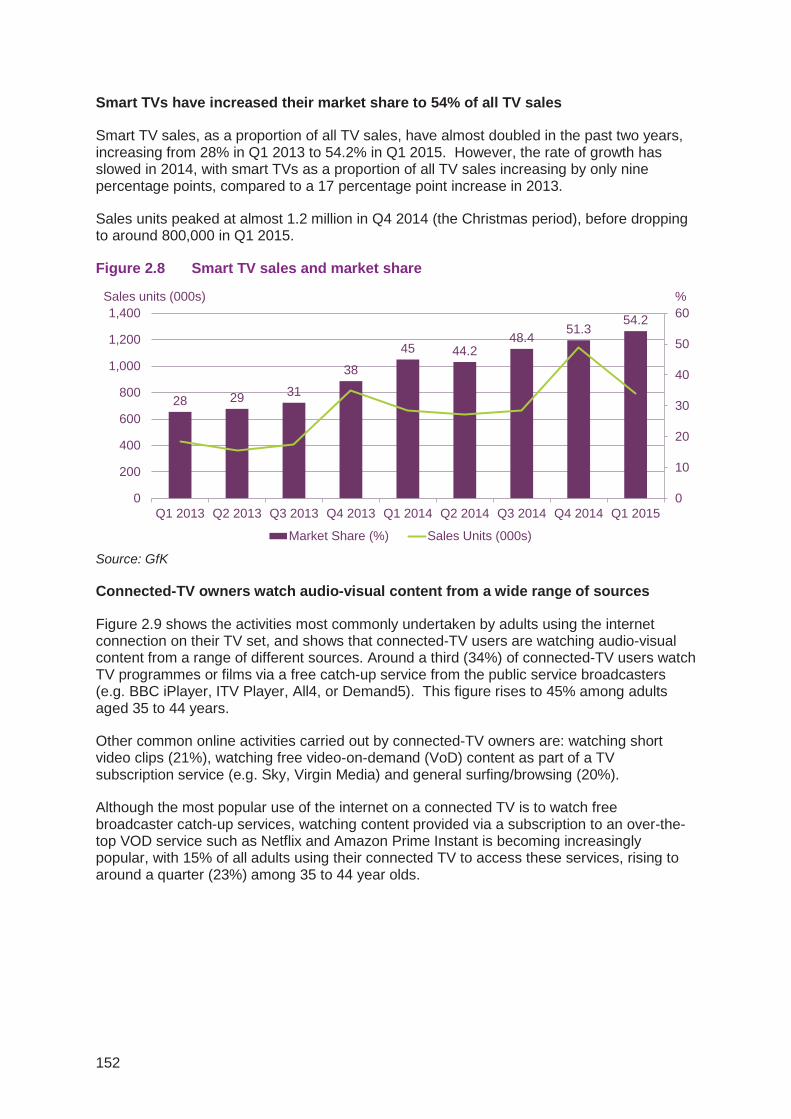
Smart TVs have increased their market share to 54% of all TV sales
Smart TV sales, as a proportion of all TV sales, have almost doubled in the past two years, increasing from 28% in Q1 2013 to 54.2% in Q1 2015. However, the rate of growth has slowed in 2014, with smart TVs as a proportion of all TV sales increasing by only nine percentage points, compared to a 17 percentage point increase in 2013.
Sales units peaked at almost 1.2 million in Q4 2014 (the Christmas period), before dropping to around 800,000 in Q1 2015.
Figure 2.8 Smart TV sales and market share
Source: GfK
Connected-TV owners watch audio-visual content from a wide range of sources
Figure 2.9 shows the activities most commonly undertaken by adults using the internet connection on their TV set, and shows that connected-TV users are watching audio-visual content from a range of different sources. Around a third (34%) of connected-TV users watch TV programmes or films via a free catch-up service from the public service broadcasters (e.g. BBC iPlayer, ITV Player, All4, or Demand5). This figure rises to 45% among adults aged 35 to 44 years.
Other common online activities carried out by connected-TV owners are: watching short video clips (21%), watching free video-on-demand (VoD) content as part of a TV subscription service (e.g. Sky, Virgin Media) and general surfing/browsing (20%).
Although the most popular use of the internet on a connected TV is to watch free broadcaster catch-up services, watching content provided via a subscription to an over-the-top VOD service such as Netflix and Amazon Prime Instant is becoming increasingly popular, with 15% of all adults using their connected TV to access these services, rising to around a quarter (23%) among 35 to 44 year olds.
28 29 31
38
45 44.248.4
51.354.2
0
10
20
30
40
50
60
0
200
400
600
800
1,000
1,200
1,400
Q1 2013 Q2 2013 Q3 2013 Q4 2013 Q1 2014 Q2 2014 Q3 2014 Q4 2014 Q1 2015
Market Share (%) Sales Units (000s)
Sales units (000s) %
152

Figure 2.9 Activities undertaken on a connected TV, by age
Source: Ofcom Media Tracker 2014. Base: All respondents (2074); 16-24 (297); 25-34 (331); 35-44 (333); 45-54 (333) 55-64 (318); 65+ (462). Only responses >3% labelled. Prompted, multicode. Q7/ Q9C/ Q10C/ Q11C/ Q13 - And which, if any of these devices have been connected to your home broadband service as well as a TV set in the home in the last 12 months to view something on the TV screen?
As illustrated in Figure 2.10, the most common reason among connected-TV users for watching free catch-up services is to watch programmes that they missed at the time of broadcast (78%), although around a third (32%) also turn to catch-up services if there is nothing they want to watch on scheduled TV when they want to watch television.
Figure 2.10 Reason for using catch-up TV via a connected TV, by age
Source: Ofcom Media Tracker. Base: Those using broadcaster catch-up services through connected TV (659); 16-34 (252); 35+ (407). Unprompted, multicode. Showing responses of 5% or more among all adults. Significance testing shows any difference between age groups. Q16 - You said that you use broadcaster catch-up services. What would you say are the reasons that you use the broadcaster?
34 42 42 45 37 3013
2129 26 28
27
11
3
20
24 2530
25
11
5
20
24 2326
28
12
5
15
22 2123
17
7
12
13 1817
18
7
9
11 1212
11
7
All 16-24 25-34 35-44 45-54 55-64 65+
Online PPV or download to own(e.g. iTunes)
Paid VOD content through TVservice
Online subscription services(e.g. Netflix)
Browse online
Free VOD content through TVservice
Clips through websites (e.g.YouTube)
Broadcaster catch-up services
Any of These44% 54% 51% 56% 60% 36% 17%
78
32 31
13 11 10 7
80
34 30
13 12 10 10
76
31 32
12 10 10 6
0%
20%
40%
60%
80%
100%
I missed theprogramme/ filmwhen it was on
TV and I use it tocatch up
I use it whenthere is nothingon 'normal' TVthat I want to
watch
I want to watchthe programme/film at a time that
suits me
Somebody waswatching
something elseon the TV at thetime it was on soI used it to catch
up
Just to passsome time/ relax
The programme/film was
recommended tome by someone I
know
There is a goodchoice
of programmes/films
All Adults(16+)
16-34
35+
% of catch-up TV users
153

Two-thirds of TV homes have a DVR, but growth has slowed in the past year
Data from Ofcom’s Technology Tracker indicates that around two-thirds (64%) of adults with a television in the household now own a digital video recorder (DVR)49. However, in the past year this figure has increased by only two percentage points, from 62% in 2014, suggesting that penetration of DVRs may be beginning to slow. Sky+ is the most prevalent DVR among owners of these devices, at 33%, followed by Virgin’s TiVo (or older V+ box) at 13%, and Freeview at 12%.
Figure 2.11 Take-up of DVRs, by platform
Source: Ofcom Technology Tracker, Q1 2013-2015 Base: All adults aged 16+ with a TV in the household: 2013 (3661), 2014 (3635), 2015 (3616) Q: Does your household have Sky+? Q: Does your (Sky+,Virgin TiVo,YouView etc.) set-top box allow you to record and store TV programmes, and also pause and rewind live TV programmes?
There is a similar picture when looking at take-up of high-definition (HD) TVs and HDTV services. Over the past three years penetration of HD-ready TVs has remained almost unchanged; three-quarters (76%) of TV homes owned these devices in 2015. While take-up of HDTV services has increased, from 50% to 57% over the three-year period, growth appears to be slowing, with only a four percentage point increase year on year, from 53% in 2014 to 57% in 2015.
49 This figure differs from the 73.2% for 2014 quoted in Figure 2.15, which is based on BARB data and is the total television viewing audience aged 4+ who have access to a DVR.
% of UK homes with a TV
54%
31%
11%
9% 7%
2%
62%
34%
12%
13%
6% 4%
64%
33%
13%
12%
7% 5%
0%
20%
40%
60%
80%
100%
Total DVR take-up
Sky+ Virgin TiVo or V+ Freeview DVR YouView Broadband TV(BT Vision orTalkTalk TV)
2013
2014
2015
154

Figure 2.12 Take-up of HD-ready TVs and HDTV services
Source: Ofcom Technology Tracker, Q1 2013-2015 Base: All adults aged 16+ with a TV in the household: 2013 (3661), 2014 (3635), 2015 (3616) QH3(QH53): Is the MAIN TV in your household an HDTV set or HD ready? QH4 (QH54) Although you have an HDTV ready set, to actually watch TV channels and programmes that are broadcast in high definition, you need an HD set-top box or a TV with built-in HDTV receiver. For the main TV set, does your household have an HDTV service - from either Sky, Virgin Media, Freesat or Freeview?
3DTV has yet to gain traction
Figure 2.13 shows ownership among UK TV homes of televisions capable of receiving broadcasts in 3D, as well as the proportion of TV homes who watch TV programmes or movies in 3D via these devices. 3D services have been available since 2010. However, less than one in ten (7%) UK TV homes in 2015 claimed to watch TV content in 3D, a figure which has risen only slightly since Ofcom began tracking it in 2013 (4%).
3DTV The popularity of 3D in cinema has risen and fallen over the past 10 years, but it reached a peak in 2009 when James Cameron’s Avatar became the highest-grossing film of all time. The following year saw the launch of the UK’s first 3D channel, Sky 3D, and the first 3DTVs went on sale to the public. The BBC joined the 3D trend in 2011, broadcasting the finals of Wimbledon on its HD channel live in 3D.
However, the BBC announced that it would halt its development of 3D programming in 2013 and Sky 3D moved to an on-demand-only service in June this year. The disappointing take-up of 3DTV may be due in part to the inconvenience of the viewing experience. Most consumer 3DTVs use active shutter technology to achieve a 3D effect which requires viewers to wear glasses. This may be a drawback at a time when more and more consumers are ‘multi-tasking’ their media and communications activities.
% of UK homes with a TV
50%
53%
57%
75%
75%
76%
0% 20% 40% 60% 80% 100%
2013
2014
2015
Have HD readyTV
Have HDTVservice
155

Figure 2.13 Take-up and use of 3D-ready TVs
Source: Ofcom Technology Tracker, Q1 2013-2015 Base: All adults aged 16+ with a TV in the household: 2013 (3661), 2014 (3635), 2015 (3616) QH4 (QH57). Is the main TV in your household 3D ready? if necessary - By this I mean that the TV can display pictures in 3D from specific channels (such as Sky 3D) or when watching 3D DVDs or Blu-ray discs or when playing 3D video games. / QH5 (QH58). Do you or anyone in your household watch 3D content on your TV - whether from 3D TV channels, 3D DVDs or Blu-ray discs or 3D video games?
2.1.4 The majority of TV viewing is of traditional live TV, but this has recently declined
Watching programmes on traditional TV50 has fallen since 2010
In recent years there has been an overall decline in time spent watching any TV on TV sets, and most of this reduction has come from watching traditional TV (programmes and films live at the time of broadcast). Traditional TV is still the preferred way of viewing TV, but it has experienced a 31.6 minute decline per person a day (14%) since its peak in 2010 (Figure 2.14).
Use of online video-on-demand services is explored in detail within the Market in Context chapter, while the Changes in TV viewing habits section (also within the Market in Context chapter) takes a detailed look at the second year of decline in traditional TV viewing. The focus of this section is the split between watching traditional TV and deferring watching a programme until later (time-shifted viewing, within seven days of the broadcast)51.
50 Traditional TV viewing refers to TV programmes watched live at the time of broadcast on the TV set. 51 In BARB analysis, time-shifted viewing refers to viewing of programmes that have been shown on TV up to seven days after broadcast. Recordings through devices such as DVRs (for example Sky+ or TiVo), DVD recorders and VCRs are captured, as well viewing to catch-up players (such as BBC iPlayer) through games consoles, smart TVs, or computers and laptops attached to the TV screen.
% of UK homes with a TV
4%
5%
7%
8%
10%
13%
0% 20% 40% 60% 80% 100%
2013
2014
2015
Have 3D ready TV
Watch 3D content
156

Figure 2.14 Traditional TV viewing vs. time-shifted minutes: all individuals
Source: BARB, Network, Some variation in figures due to rounding. New BARB panel introduced 1 Jan 2010. As a result pre- and post-panel change data must be treated with caution (see dotted line).
Figure 2.15 shows that among the TV population as a whole, the proportion of total TV viewing time spent watching time-shifted programming has grown incrementally each year, to reach 12% in 2014. Consequently, the proportion of traditional TV viewing has fallen steadily each year, from 93% of viewing in 2010 to 88% in 2014.
Among the total viewing population aged 4+ who have access to digital video recorders (DVRs), (73% in 2014, according to BARB) and have the flexibility to create their own library of programmes and films and watch them to fit around their lives, viewing habits have also changed. Time spent watching traditional TV has declined from 86% in 2010 to 83% in 2014 while viewing recorded programmes has grown slightly, from 14% of total viewing in 2010 to 17% in 2014 (Figure 2.15).
Figure 2.15 DVR take-up and time-shifted viewing: all individuals and individuals in DVR homes
Source: BARB, Network. New BARB panel introduced 1 Jan 2010. As a result pre- and post-panel change data must be treated with caution (see dotted line).
211.9 215.4 211.7 224.9 219.2 216.4 205.6 193.3
5.8 9.1 13.217.2 22.2 24.2
26.227.2
0
50
100
150
200
250
2007 2008 2009 2010 2011 2012 2013 2014
Time-shift
Traditional/live
218 224 225 242 241 240 232 220 Minutes per person/per day
Aver
age
min
s/da
y
11%
24%
37%
48%
61%65% 69%
73%
15% 15% 15% 14% 15% 16% 16% 17%
3% 4% 6% 7% 9% 10% 11% 12%
0%
20%
40%
60%
80%
100%
2007 2008 2009 2010 2011 2012 2013 2014
DVR owners as % ofpopulation
Time-shifted viewingamong DVRindividuals
Time-shifted viewingamong all individuals
157

The 25-34 age group time-shift almost a quarter of their TV viewing
There are larger differences when comparing the two types of viewing by age-group. People aged 25-34 with a DVR watched more of their TV programmes and films in time-shifted mode, compared to all other age groups, and to the average for all individuals, while the oldest (65+) age group watched the fewest of their TV programmes this way (Figure 2.16).
Differences between the age groups in take-up of recording devices such as DVRs, and use of catch-up services, as well as factors such as employment status and life-stage (working/retired, with young children/grown-up children) all affect the amount of leisure time people have available, including time to watch television, and may explain the contrast in viewing behaviours between the younger and older age groups.
However, a constant factor across all age groups is that watching traditional TV makes up the majority of all TV viewing time, and while the proportion of time spent watching programmes other than at the time of broadcast has grown, viewing programmes live (traditional TV viewing) remains the preferred way overall of watching TV programmes and films.
Figure 2.16 Proportion of time-shifted viewing, by age: DVR individuals
Source: BARB, Network, DVR owners 4+, all TV homes. Note: A new BARB panel was introduced in 2010. As a result, pre- and post-panel change data must be compared with caution.
Up to a third of drama viewing is time-shifted
There are some pronounced distinctions when looking at the type of genres that are watched live compared to time-shifted. While news and significant events such as sport and national celebrations (which might be seen as more time-sensitive) tend to be watched at the time of broadcast, drama and soaps are time-shifted by up to one-third (Figure 2.17). While the trend for some genres (such as news, sport, current affairs and religious programming) to be viewed live (on traditional TV) has not changed much since 2008, there have been more marked changes in other genres. Drama and soaps were the most time-shifted genres, both in 2008 and in 2014, but viewing of these programmes other than at the time of broadcast has increased substantially. Time-shifting of drama: other (which includes US and other international programmes) increased by 23 percentage points (pp); from 9%
17%19% 19% 18%
21%22%
23%24%
13%
16%18%
16%
19% 19% 19%20%
20%18% 17%
15%17% 17%
19%20%
15% 15% 15%14%
15% 16% 16%17%
14% 14%15%
12%
14% 15%16%
17%
13% 13% 13% 13%15% 15%
16% 17%
12%13%
14%13% 13% 14%
15% 16%
12% 11%10% 10%
11% 11% 12% 12%
0%
5%
10%
15%
20%
25%
2007 2008 2009 2010 2011 2012 2013 2014
25-34
16-24
35-44
Individuals
45-54
Children
55-64
65+
Proportion of viewing (%)
158

in 2008 to 32% in 2014. Recorded and catch-up viewing of UK soaps grew by 18pp; from 6% to 23%, across the same period, while time-shifted viewing of UK drama programming was up by 15pp from 7% to 22% in 2014. As time-shifting becomes more prevalent generally, most other genres have seen an increased proportion of viewing after the initial time of broadcast.
Figure 2.17 Proportion of time-shifted viewing, by genre: all individuals
Source: BARB, individuals 4+, Network Plus 2008, Network 2014. Network programming based on 4+ area filter. Ranked on proportion of programme genre watched time-shifted, descending. Genre groupings are based on BARB genre codings, categorised by Ofcom. Sports events featured in four of the top five programmes in 2014
Research from Thinkbox52 looked at how and why viewers choose between watching TV live or on demand (VOD) and why they watch different types of online video. It identified six need-states that drive the different forms of TV viewing. The research found that traditional live TV fulfils each of the need states, but particularly comfort (such as shared family time), indulgence (in personal favourites) and relaxation. It was also found to be a key provider of shared experiences and social connection. VOD was found to satisfy personal need states, specifically indulging and escaping, more than the social needs.
These types of factors may influence the kind of programmes which are most watched live. Of the top five most watched programmes overall (live plus time-shifted) in 2014, sports events attracted not only the largest viewing numbers but were almost entirely watched live at the time of broadcast, and were also mainly watched with other people (Figure 2.18).
The top five most-watched programmes among those who own a DVR were the same as for the general population overall (albeit with a slightly different ranking), with DVR-owning viewers also tending to watch the World Cup and the Great British Bake-Off final live as opposed to time-shifted. Those who did not watch the Great British Bake-Off final at the time of broadcast chose to watch the concluding episode as soon as possible after transmission.
52 Thinkbox’s Screen Life: TV in Demand research was conducted in 2013 and looked at the six reasons that people watch TV http://www.thinkbox.tv/research/screen-life-tv-in-demand-summary/
0%
5%
10%
15%
20%
25%
30%
35%
Total time-shifted 2008 Pp increase in time-shift 2008-2014
Time-shifted viewing as % of total viewing to genre, 2008 vs 2014
32% 23% 22% 17% 16% 15% 15% 14% 14% 12% 11% 11% 11% 11% 10% 9% 8% 8% 7% 5% 4% 2% 2% 2% 0% 0%
159
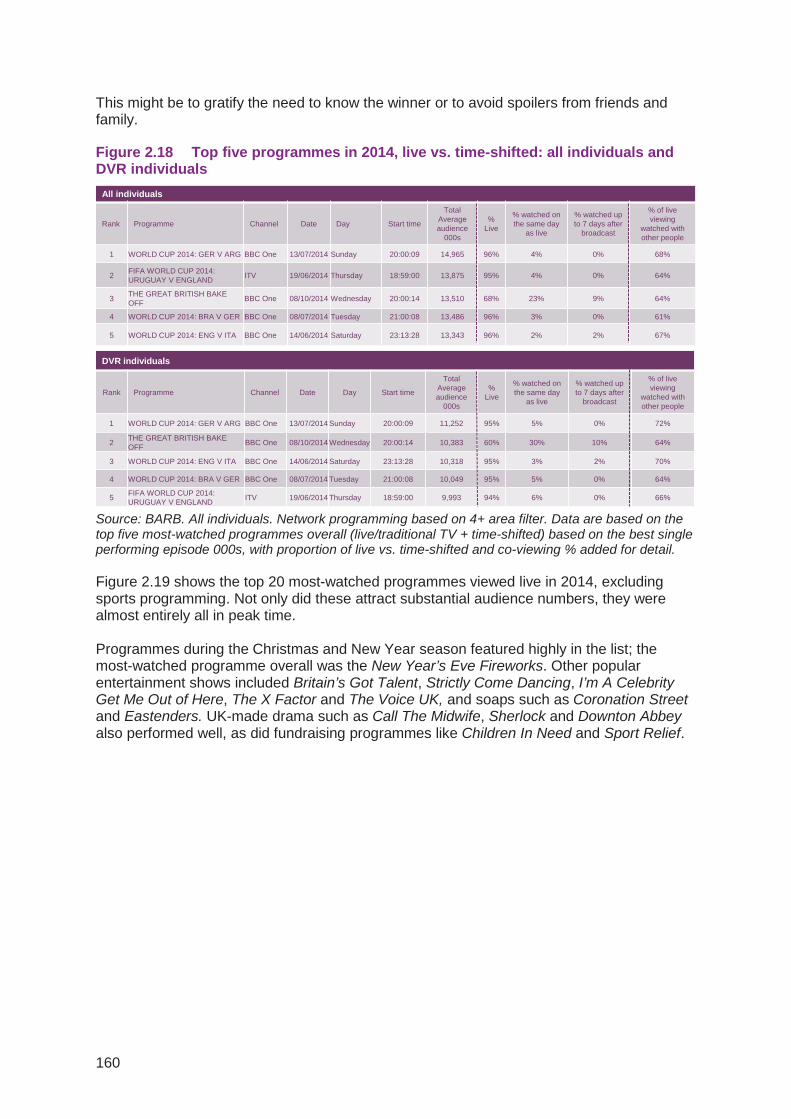
This might be to gratify the need to know the winner or to avoid spoilers from friends and family.
Figure 2.18 Top five programmes in 2014, live vs. time-shifted: all individuals and DVR individuals
Source: BARB. All individuals. Network programming based on 4+ area filter. Data are based on the top five most-watched programmes overall (live/traditional TV + time-shifted) based on the best single performing episode 000s, with proportion of live vs. time-shifted and co-viewing % added for detail.
Figure 2.19 shows the top 20 most-watched programmes viewed live in 2014, excluding sports programming. Not only did these attract substantial audience numbers, they were almost entirely all in peak time. Programmes during the Christmas and New Year season featured highly in the list; the most-watched programme overall was the New Year’s Eve Fireworks. Other popular entertainment shows included Britain’s Got Talent, Strictly Come Dancing, I’m A Celebrity Get Me Out of Here, The X Factor and The Voice UK, and soaps such as Coronation Street and Eastenders. UK-made drama such as Call The Midwife, Sherlock and Downton Abbey also performed well, as did fundraising programmes like Children In Need and Sport Relief.
All individuals
Rank Programme Channel Date Day Start time
Total Average audience
000s
% Live
% watched on the same day
as live
% watched up to 7 days after
broadcast
% of live viewing
watched with other people
1 WORLD CUP 2014: GER V ARG BBC One 13/07/2014 Sunday 20:00:09 14,965 96% 4% 0% 68%
2 FIFA WORLD CUP 2014: URUGUAY V ENGLAND ITV 19/06/2014 Thursday 18:59:00 13,875 95% 4% 0% 64%
3 THE GREAT BRITISH BAKE OFF BBC One 08/10/2014 Wednesday 20:00:14 13,510 68% 23% 9% 64%
4 WORLD CUP 2014: BRA V GER BBC One 08/07/2014 Tuesday 21:00:08 13,486 96% 3% 0% 61%
5 WORLD CUP 2014: ENG V ITA BBC One 14/06/2014 Saturday 23:13:28 13,343 96% 2% 2% 67%
DVR individuals
Rank Programme Channel Date Day Start time
Total Average audience
000s
% Live
% watched on the same day
as live
% watched up to 7 days after
broadcast
% of live viewing
watched with other people
1 WORLD CUP 2014: GER V ARG BBC One 13/07/2014 Sunday 20:00:09 11,252 95% 5% 0% 72%
2 THE GREAT BRITISH BAKE OFF BBC One 08/10/2014 Wednesday 20:00:14 10,383 60% 30% 10% 64%
3 WORLD CUP 2014: ENG V ITA BBC One 14/06/2014 Saturday 23:13:28 10,318 95% 3% 2% 70%
4 WORLD CUP 2014: BRA V GER BBC One 08/07/2014 Tuesday 21:00:08 10,049 95% 5% 0% 64%
5 FIFA WORLD CUP 2014: URUGUAY V ENGLAND ITV 19/06/2014 Thursday 18:59:00 9,993 94% 6% 0% 66%
160
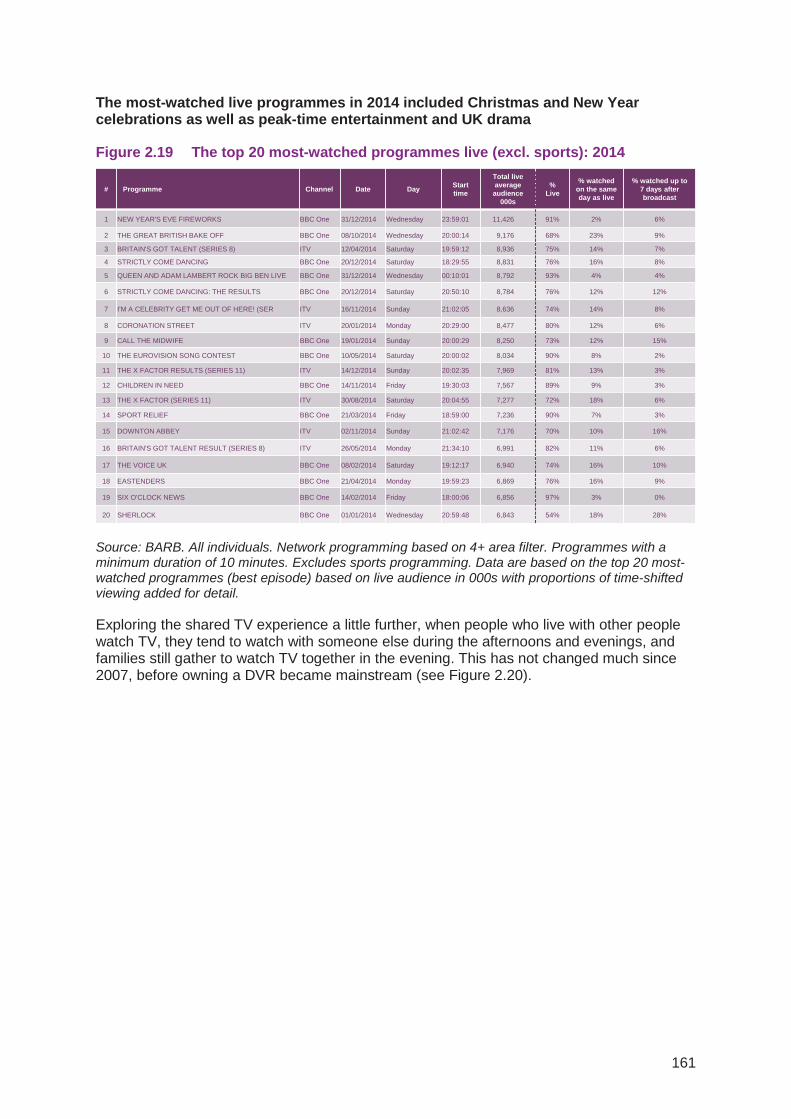
The most-watched live programmes in 2014 included Christmas and New Year celebrations as well as peak-time entertainment and UK drama
Figure 2.19 The top 20 most-watched programmes live (excl. sports): 2014
Source: BARB. All individuals. Network programming based on 4+ area filter. Programmes with a minimum duration of 10 minutes. Excludes sports programming. Data are based on the top 20 most-watched programmes (best episode) based on live audience in 000s with proportions of time-shifted viewing added for detail. Exploring the shared TV experience a little further, when people who live with other people watch TV, they tend to watch with someone else during the afternoons and evenings, and families still gather to watch TV together in the evening. This has not changed much since 2007, before owning a DVR became mainstream (see Figure 2.20).
# Programme Channel Date Day Start time
Total live average
audience 000s
% Live
% watched on the same day as live
% watched up to 7 days after broadcast
1 NEW YEAR'S EVE FIREWORKS BBC One 31/12/2014 Wednesday 23:59:01 11,426 91% 2% 6%
2 THE GREAT BRITISH BAKE OFF BBC One 08/10/2014 Wednesday 20:00:14 9,176 68% 23% 9%
3 BRITAIN'S GOT TALENT (SERIES 8) ITV 12/04/2014 Saturday 19:59:12 8,936 75% 14% 7%
4 STRICTLY COME DANCING BBC One 20/12/2014 Saturday 18:29:55 8,831 76% 16% 8%
5 QUEEN AND ADAM LAMBERT ROCK BIG BEN LIVE BBC One 31/12/2014 Wednesday 00:10:01 8,792 93% 4% 4%
6 STRICTLY COME DANCING: THE RESULTS BBC One 20/12/2014 Saturday 20:50:10 8,784 76% 12% 12%
7 I'M A CELEBRITY GET ME OUT OF HERE! (SER ITV 16/11/2014 Sunday 21:02:05 8,636 74% 14% 8%
8 CORONATION STREET ITV 20/01/2014 Monday 20:29:00 8,477 80% 12% 6%
9 CALL THE MIDWIFE BBC One 19/01/2014 Sunday 20:00:29 8,250 73% 12% 15%
10 THE EUROVISION SONG CONTEST BBC One 10/05/2014 Saturday 20:00:02 8,034 90% 8% 2%
11 THE X FACTOR RESULTS (SERIES 11) ITV 14/12/2014 Sunday 20:02:35 7,969 81% 13% 3%
12 CHILDREN IN NEED BBC One 14/11/2014 Friday 19:30:03 7,567 89% 9% 3%
13 THE X FACTOR (SERIES 11) ITV 30/08/2014 Saturday 20:04:55 7,277 72% 18% 6%
14 SPORT RELIEF BBC One 21/03/2014 Friday 18:59:00 7,236 90% 7% 3%
15 DOWNTON ABBEY ITV 02/11/2014 Sunday 21:02:42 7,176 70% 10% 16%
16 BRITAIN'S GOT TALENT RESULT (SERIES 8) ITV 26/05/2014 Monday 21:34:10 6,991 82% 11% 6%
17 THE VOICE UK BBC One 08/02/2014 Saturday 19:12:17 6,940 74% 16% 10%
18 EASTENDERS BBC One 21/04/2014 Monday 19:59:23 6,869 76% 16% 9%
19 SIX O'CLOCK NEWS BBC One 14/02/2014 Friday 18:00:06 6,856 97% 3% 0%
20 SHERLOCK BBC One 01/01/2014 Wednesday 20:59:48 6,843 54% 18% 28%
161

Figure 2.20 Proportion of traditional TV viewing that is co-viewed, by day part: 2007 and 2014
Source: BARB. Individuals in 2+ households, Network. Based on co-viewing during live/traditional broadcast, split by half-hour time bands.
Traditional TV viewing accounted for 85% of audio-visual viewing of programmes, but is falling
Connectivity continues to spread and more people own a portable device that enables them to watch programmes and films more flexibly, away from the TV screen. Take-up and use of video-on-demand (VoD) services, such as Netflix, NowTV and Amazon Prime Instant Video, have increased. Despite this, traditional live TV viewing continues to be the main way of watching content across all screens. But as the popularity of time-shifted (recorded) viewing and watching VoD has grown, we estimate that its share of all viewing across all devices is beginning to decline (from 92% in the first half of 2010 to 85% in the first half of 2014), whereas recorded content represented 10% of total viewing, and VoD 6% (Figure 2.21).
Figure 2.21 Proportion of all AV viewing: traditional TV viewing vs. DVR and VoD
Source: 3 Reasons’ estimates (including BARB data). Base: All devices, long-form professional AV content. Live includes simulcast. Excludes physical consumption (e.g. DVDs), and short-form
0%
10%
20%
30%
40%
50%
60%
70%
80%
90%
100%
20072014
Peak time
Proportion of co-viewed live viewing across the day by half-hour – individuals in 2+ households, Total TV, 2007 and 2014
85%
86%
87%
88%
88%
89%
90%
91%
92%
10%
10%
9%
9%
9%
9%
8%
7%
6%
6%
4%
4%
3%
3%
2%
2%
2%
2%
0% 50% 100%
H1 2014H2 2013H1 2013H2 2012H1 2012H2 2011H1 2011H2 2010H1 2010
Proportion of viewing minutes across all devices
Live Recorded VOD
162

2.2 The TV and audio-visual industries 2.2.1 Summary This section examines some of the characteristics of the UK’s audio-visual sector in 2014. It focuses on a range of metrics from the broadcast television industry, with key points including:
• The UK television industry generated £13.2bn in revenue during 2014, an increase of £392m (3.1%) on 2013. All income streams saw annual increases, with net advertising revenue increasing by the largest absolute figure (£145m) and BBC income allocated to the licence fee increasing by the greatest proportion (5.1%) since 2013.
• Pay-TV subscription revenue reached £6.0bn in 2014. Subscription revenue continued to contribute the most to the UK television industry in 2014, accounting for 45.3% of total revenue.
• Broadcast-based TV advertising income continued to grow in 2014. There was a 4% (£145m) increase since 2013 in net advertising revenue (NAR), to £3.8bn. All channel groups had annual increases; the commercial multichannels’ NAR was up by 8% (£74m) to exceed £1.0bn for the first time in 2014.
• Spend on content by all UK TV channels in 2014 rose by 9.4% to reach £6.4bn in nominal terms. All channel groups increased their content spend in 2014, with the exception of the BBC portfolio channels, which had a 4% year-on-year decrease. The film and sport channels of the multichannel sector saw the greatest annual increase in spend (18%) to total £2.5bn in 2014.
• Spend on first-run UK-originated programming (network, and nations and regions) by the main five PSB channels increased by 5%, from £2,451m in 2013 to £2,585m in 2014 in nominal terms. Key factors in this increase were the Brazil World Cup and the Glasgow Commonwealth Games.53
• Total broadcast hours of first-run UK-originated programming on the five main channels increased by 1% in 2014. There was a 2.1% increase in original UK content broadcast during non-peak hours in 2014, to give the greatest number of such hours since 2009.
• Entertainment and comedy output continues to displace drama and soaps output on the main five PSB channels during peak hours. The 1,579 hours of entertainment and comedy output broadcast across the main five PSB channels during peak hours in 2014 was higher than at any point since 2009. The corresponding 1,346 hours of drama and soaps output was the lowest figure over the same period.
• Spend on sports content by the commercial multichannel broadcasters54 exceeded £2bn in 2014, following a 21% annual increase in nominal terms. This was the first full year of the current English Premier League rights deal, which
53 Further information on content spend by the PSBs can be found in Ofcom’s PSB Review where figures are adjusted for inflation; http://stakeholders.ofcom.org.uk/consultations/psb-review-3/ 54 This includes the commercial PSB portfolio channels.
163

contributed to sports spend making up 62% of multichannel content spend across the eight mainstream genres.
2.2.2 Television industry revenue The UK TV industry grew by 3.1% year on year and was worth over £13bn in 2014
The UK television industry generated £13.2bn in revenue during 2014, an increase of £392m (or 3.1%) on 2013 in nominal terms. The market grew as a result of increases across all revenue sources: a 5.1% increase in BBC income allocated to TV, a 3.9% increase in net advertising revenue, a 1.9% increase in subscription revenue and a 0.9% increase in all other revenue.
Pay-TV subscription revenue reached £6.0bn in 2014, although the 1.9% year-on-year increase on 2013 was down on the 6.5% annual increase in revenue seen between 2012 and 2013.55
Ofcom estimates that the BBC spent £2.7bn on television services56 in 2014. This is due primarily to the BBC’s TV coverage of major sporting events in 2014, compared to 2013, most notably the FIFA World Cup in Brazil and the Commonwealth Games in Glasgow.
Other revenue has seen a 1.8% annual average decline since 2009, in large part due to the new funding agreement for S4C, which has led to most of its funding coming from licence fee revenue rather than from DCMS. Further analysis of other revenue can be found in Figure 2.27.
55 This was the first year in which Sky included NowTV revenue in its subscription revenues. 56 Based on BBC Annual Report 2014/15 and includes the proportion of licence fee revenue that goes to S4C.
164
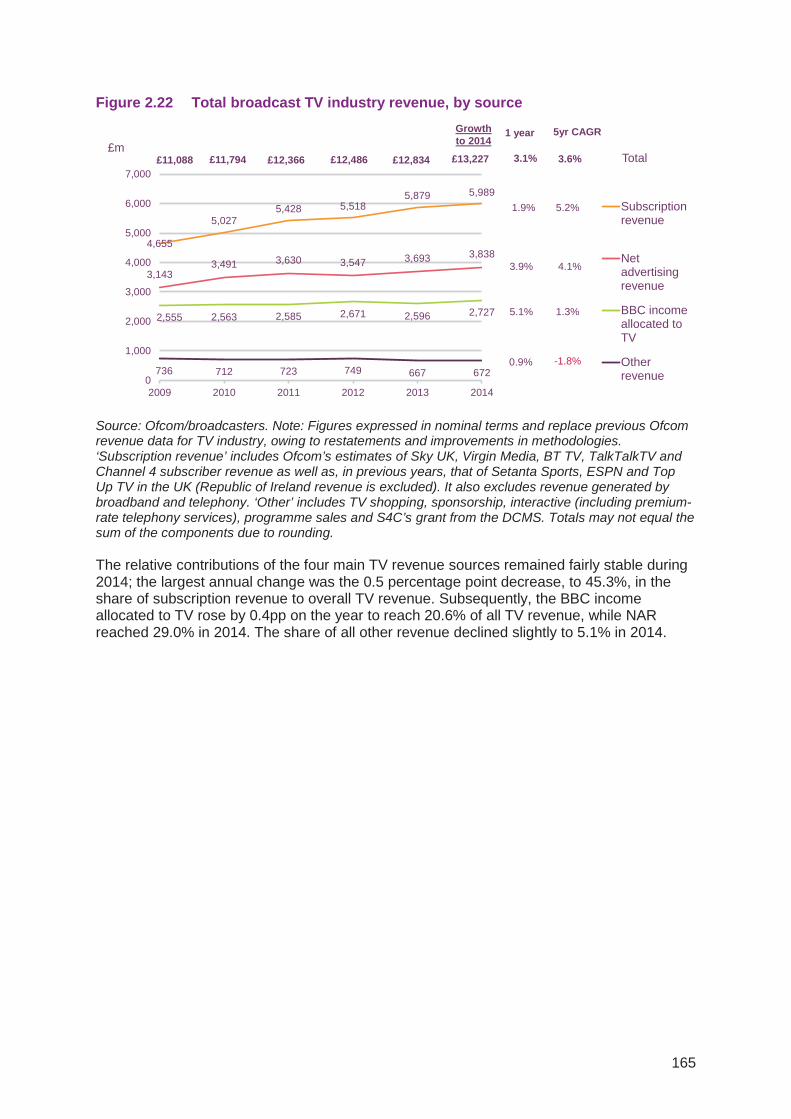
Figure 2.22 Total broadcast TV industry revenue, by source
Source: Ofcom/broadcasters. Note: Figures expressed in nominal terms and replace previous Ofcom revenue data for TV industry, owing to restatements and improvements in methodologies. ‘Subscription revenue’ includes Ofcom’s estimates of Sky UK, Virgin Media, BT TV, TalkTalkTV and Channel 4 subscriber revenue as well as, in previous years, that of Setanta Sports, ESPN and Top Up TV in the UK (Republic of Ireland revenue is excluded). It also excludes revenue generated by broadband and telephony. ‘Other’ includes TV shopping, sponsorship, interactive (including premium-rate telephony services), programme sales and S4C’s grant from the DCMS. Totals may not equal the sum of the components due to rounding.
The relative contributions of the four main TV revenue sources remained fairly stable during 2014; the largest annual change was the 0.5 percentage point decrease, to 45.3%, in the share of subscription revenue to overall TV revenue. Subsequently, the BBC income allocated to TV rose by 0.4pp on the year to reach 20.6% of all TV revenue, while NAR reached 29.0% in 2014. The share of all other revenue declined slightly to 5.1% in 2014.
4,655
5,0275,428 5,518
5,879 5,989
3,1433,491 3,630 3,547 3,693 3,838
2,555 2,563 2,585 2,671 2,596 2,727
736 712 723 749 667 6720
1,000
2,000
3,000
4,000
5,000
6,000
7,000
2009 2010 2011 2012 2013 2014
Subscriptionrevenue
Netadvertisingrevenue
BBC incomeallocated toTV
Otherrevenue
£11,794£11,088
1.9%
3.9%
5.2%
4.1%
0.9% -1.8%
£m1 year 5yr CAGRGrowth
to 2014
£12,366 £12,486 3.1% 3.6%
5.1% 1.3%
£12,834 Total£13,227
165

Figure 2.23 Total broadcast TV industry revenue, by share
Source: Ofcom/broadcasters. Note: Figures expressed in nominal terms and replace previous Ofcom revenue data for TV industry, owing to restatements and improvements in methodologies. ‘Subscription revenue’ includes Ofcom’s estimates of Sky UK, Virgin Media, BT TV, TalkTalkTV and Channel 4 subscriber revenue as well as, in previous years, that of Setanta Sports, ESPN and Top Up TV in the UK (Republic of Ireland revenue is excluded). It also excludes revenue generated by broadband and telephony. ‘Other’ includes TV shopping, sponsorship, interactive (including premium-rate telephony services), programme sales and S4C’s grant from the DCMS. Totals may not equal the sum of the components due to rounding.
The TV platform operators and the commercial multichannels have seen an average annual growth in revenue of around 5% each since 2009
Each sector of the TV industry had an increase in revenue in 2014 compared to 2013. Despite having the lowest annual growth percentage of the four sectors shown in Figure 2.24, at 1.9%, subscription revenue from the platform operators has had the greatest average annual increase in revenue since 2009, at 5.2%. The commercial multichannels (including the commercial PSB portfolio channels) had a 4.8% annual increase, to reach revenue of £2,089m, a CAGR (i.e. average annual increase each year) of 4.8% since 2009.
The main commercial PSB channels had a 2.4% increase in year-on-year revenue to reach £2,414m in 2014, while the publicly-funded channels had a 5.0% annual increase, to £2,734m.
42.0% 42.6% 43.9% 44.2% 45.8% 45.3%
28.3% 29.6% 29.4% 28.4% 28.8% 29.0%
23.0% 21.7% 20.9% 21.4% 20.2% 20.6%
6.6% 6.0% 5.8% 6.0% 5.2% 5.1%0%
10%
20%
30%
40%
50%
2009 2010 2011 2012 2013 2014
Subscriptionrevenue
Net advertisingrevenue
BBC incomeallocated to TV
Other revenue
TV industry revenue shares (%)£11,088m £12,366m£11,794m £12,486m £12,834m £13,227m
166

Figure 2.24 Total TV industry revenue, by sector
Source: Ofcom/broadcasters. Note: Figures expressed in nominal terms and replace previous Ofcom revenue data for TV industry, owing to restatements and improvements in methodologies. The platform operators are Sky UK, Virgin Media, BT TV and TalkTalkTV as well as, in previous years, Setanta Sports, ESPN and Top Up TV in the UK (Republic of Ireland revenue is excluded).The platform operators figures also contain subscription revenue for Channel 4. Main commercial PSB channels comprise ITV/ITV Breakfast, STV, UTV, Channel Television, Channel 4, Channel 5 and S4C. Commercial multichannels comprise all multichannels including the commercial PSB portfolio channels. Publicly-funded channels comprise BBC One, BBC Two, the BBC portfolio channels and S4C. The commercial revenues of S4C are included with the main commercial PSB channels while their licence fee revenue and DCMS grants come under publicly-funded channels. Totals may not equal the sum of the components due to rounding.
Television advertising revenues continued to grow in 2014
TV advertising income increased by 4% (£145m) in 2014 to reach £3.8bn, its highest level in the five-year period since 2009.
All three groups of commercial channels had year-on-year increases in advertising revenues; those of the commercial multichannels had the largest proportional growth at 8% (£74m) to exceed £1bn for the first time in 2014. The commercial PSB channels’ revenue grew by 3% (£57m) in 2014; this can be attributed to the Brazil World Cup during the summer. When combined with the advertising revenue of the commercial PSB portfolio channels (up 2% to total £653m in 2014), total advertising revenue generated by the commercial PSB broadcasters combined made up 72.8% of all TV advertising revenue in 2014, the lowest percentage of any year from 2009 to 2014
Revenue (£m)
£2,656 £2,665 £2,676 £2,755 £2,603 £2,734
£2,126 £2,354 £2,407 £2,334 £2,359 £2,414
£1,650 £1,747 £1,855 £1,879 £1,994 £2,089
£4,655£5,027 £5,428 £5,518 £5,879 £5,989
0
2,000
4,000
6,000
8,000
10,000
12,000
14,000
2009 2010 2011 2012 2013 2014
Platformoperators
Commercialmultichannels
MaincommercialPSB channels
Publicly-fundedchannels
1.9%
2.4%
5.2%
2.6%
4.8%
1 year5yr
CAGR
Growth
4.8%
£11,794£11,088 £12,366 £12,486 £12,834 3.1% 3.6%
0.6%5.0%
£13,227
167

Figure 2.25 TV net advertising revenues, by source: 2009-2014
Source: Ofcom/broadcasters. Note: Figures expressed are in nominal terms and replace previous data published by Ofcom. Commercial PSB channels comprise ITV, STV, UTV, Channel Television, ITV Breakfast, Channel 4, Channel 5 and S4C (and their ‘+1’ channels); Commercial PSB portfolio channels include, where relevant, ITV2, ITV3, ITV4, CITV, ITVBe, ITV Encore, ITV Breakfast 2, E4, More 4, Film 4, 4Seven, Five USA and 5* (and their ‘+1’ channels). For previous years closed channels have also been included. Sponsorship revenue not included. Totals may not equal the sum of the components due to rounding.
The multichannel sector saw the largest proportional growth in TV advertising market share in 2014
The holders of the Channel 3 licences (ITV/ ITV Breakfast/ STV/ UTV) continued to have the largest market share of the TV advertising market in 2014, increasing to 35.8% from their 2013 share of 35.1%. However, the greatest increase in share was in the multichannel sector in 2014, which rose by nearly one percentage point (pp) to total 27.2% in 2014.
In contrast, both Channel 4 and Channel 5 had a reduced share of the TV advertising revenue market in 2014, decreasing by 0.6pp and 0.8pp respectively, while the share of the commercial PSB portfolio channels combined dropped by 0.3pp to 17.0% over the same period.
£1,896m£2,140m £2,178m £2,077m £2,085m £2,141m
£445m£518m £544m £561m £639m £653m
£802m
£834m £908m £910m£968m £1,043m£3,143m
£3,491m£3,630m £3,547m
£3,693m£3,838m
0
1,000
2,000
3,000
4,000
2009 2010 2011 2012 2013 2014
Commercialmultichannels
Commercial PSBportfoliochannels
Commercial PSBchannels
NAR(£m)
3%
1 year 5yr CAGR
Growth
2%
4% 4%
8% 5%
2% 8%
Combined
168

Figure 2.26 TV net advertising revenue market shares: 2013-2014
Source: Ofcom/broadcasters. Note: Totals are expressed in nominal terms. Revenues attributed to ‘+1’ channels are included with those from their main channels.
Broadcaster revenue raised from other sources increased by 1% in 2014
Television revenue from sources other than subscription income, advertising revenue and the licence fee increased by 1% in 2014.
This increase was driven by the £16m (8%) growth in sponsorship revenues, which totalled £208m in 2014, as well as the 19% year-on-year growth in revenue (£7m) generated by interactive services. Growth in these areas helped to offset decreases elsewhere, such as from TV shopping, which saw a 6% decrease (£10m) to total £146m, largely because there were fewer TV shopping channels broadcasting throughout 2014.
An agreement between S4C, the Department for Culture, Media & Sport (DCMS) and the BBC resulted in the financing of S4C being restructured in 2013, and the channel now receives the majority of its funding from the licence fee. As such, S4C’s non-licence fee income decreased by 59% to £8m in 2014.
33.8% 34.5%
1.3% 1.3%13.1% 12.5%
8.2% 7.4%
17.3% 17.0%
26.2% 27.2%
0%
20%
40%
60%
80%
100%
2013 2014
CommercialmultichannelsCommercial PSBportfolio channelsS4C
Channel 5
Channel 4
ITV Breakfast
ITV/STV/UTV
Proportion of NAR£3,693m £3,838m
169

Figure 2.27 Breakdown of other commercial TV channel revenue: 2013-2014
Source: Ofcom/broadcasters. Note: Percentage figures in brackets represent year-on-year change for total non-broadcast revenue versus 2014. TV shopping represents aggregate operating margin of products sold via television. A funding agreement which was reached in April 2013 meant that the majority of S4C funding now comes out of the BBC’s licence fee income. Totals may not equal the sum of the components due to rounding. Owing to the nature of these revenue components, annual changes may be a function of a higher number of broadcaster returns being made by the time of writing, rather than material changes in the contributions that these revenue components are making to total industry income.
2.2.3 TV revenue among multichannel genres Revenue generated by the multichannel sector continued to grow in 2014, driven by entertainment and factual channels
Across the main eight genres of programming broadcast by the multichannel sector, total revenue increased by 2% year on year to £5,481m in 2014. This overall increase was driven by the growing revenues attributed to entertainment (up 11% to £1,690m) and factual (up 13% to £264m) programming.
While sport remained the genre that generated the most TV revenue for the multichannel sector in 2014, total revenue decreased by 2% to £2,285m, following the high of £2,329m generated in 2013.
The greatest proportional decreases in revenue came from leisure (down 21% to £40m) and music (down 6% to £117m) programming.
Total ‘other’ revenue = £672m (+1%)
Sponsorship £208m (+8%)
ProgrammeSales £48m
(+8%)
Interactive £40m (+19%)
PPV £34m (+10%)
S4C £8m (-59%)
TV Shopping £146m (-6%)
Other £189m(-1%)
170
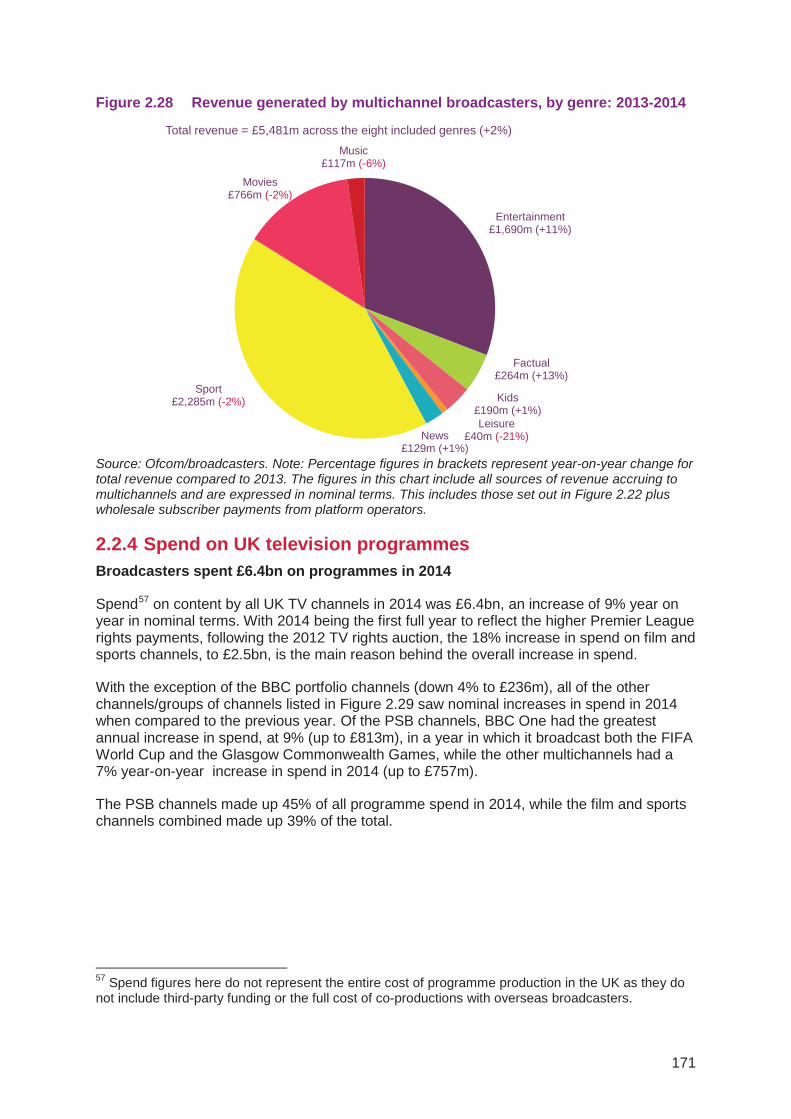
Figure 2.28 Revenue generated by multichannel broadcasters, by genre: 2013-2014
Source: Ofcom/broadcasters. Note: Percentage figures in brackets represent year-on-year change for total revenue compared to 2013. The figures in this chart include all sources of revenue accruing to multichannels and are expressed in nominal terms. This includes those set out in Figure 2.22 plus wholesale subscriber payments from platform operators.
2.2.4 Spend on UK television programmes Broadcasters spent £6.4bn on programmes in 2014
Spend57 on content by all UK TV channels in 2014 was £6.4bn, an increase of 9% year on year in nominal terms. With 2014 being the first full year to reflect the higher Premier League rights payments, following the 2012 TV rights auction, the 18% increase in spend on film and sports channels, to £2.5bn, is the main reason behind the overall increase in spend.
With the exception of the BBC portfolio channels (down 4% to £236m), all of the other channels/groups of channels listed in Figure 2.29 saw nominal increases in spend in 2014 when compared to the previous year. Of the PSB channels, BBC One had the greatest annual increase in spend, at 9% (up to £813m), in a year in which it broadcast both the FIFA World Cup and the Glasgow Commonwealth Games, while the other multichannels had a 7% year-on-year increase in spend in 2014 (up to £757m).
The PSB channels made up 45% of all programme spend in 2014, while the film and sports channels combined made up 39% of the total.
57 Spend figures here do not represent the entire cost of programme production in the UK as they do not include third-party funding or the full cost of co-productions with overseas broadcasters.
Entertainment£1,690m (+11%)
Factual£264m (+13%)
Kids£190m (+1%)Leisure
£40m (-21%)News£129m (+1%)
Sport£2,285m (-2%)
Movies£766m (-2%)
Music£117m (-6%)
Total revenue = £5,481m across the eight included genres (+2%)
171

Figure 2.29 Spend on network TV programmes: 2013-2014
Source: Ofcom/broadcasters. Note: Figures expressed in nominal prices. Figures do not include spend on nations’ and regions’ output. BBC portfolio channels includes BBC Three, BBC Four, BBC News, BBC Parliament, CBBC and CBeebies (but not BBC HD). ‘Other multichannels’ include all genres (excluding sports and films). Programme spend comprises in-house productions, commissions from independents, acquired programmes and repeats (originations and acquisitions).
2.2.5 UK independent sector Independent producers’ TV revenue declined in 2014 following the record high reported in 2013
According to PACT’s annual census of independent production companies in the UK, in 2014 TV revenues within the independent sector decreased by 2.5% to £2.71bn, following nearly a decade of growth.58 This decrease was primarily driven by drops in primary UK commissions (down by 4.9% to £1.59bn) and ‘other’ international income (i.e. primary commissions and co-productions from non-UK broadcasters, as well as revenue from companies’ overseas operations) which was down 8.1% year on year to £0.69bn in 2014. However, it is worth noting that the five-year compound annual growth rate remains positive for each revenue source, as shown in Figure 2.30.
58 A change in sampling from 2013 to 2014 slightly overstates the decline.
£2,093m £2,477m
£747m£813m
£794m£818m
£708m
£757m£486m
£492m£298m
£311m£246m
£236m£260m
£269m£179m
£181m
0
1,000
2,000
3,000
4,000
5,000
6,000
7,000
2013 2014
Channel 5
Other PSB portfolio channels
BBC portfolio channels
BBC Two
Channel 4
Other multichannels
ITV/ITV Breakfast
BBC One
Film/Sport channels
+9.4%£m 1 yr change
£5,811m £6,355m
+3%
+1%
+7%
+9%
+18%
+3%
-4%
+4%
+1%
172
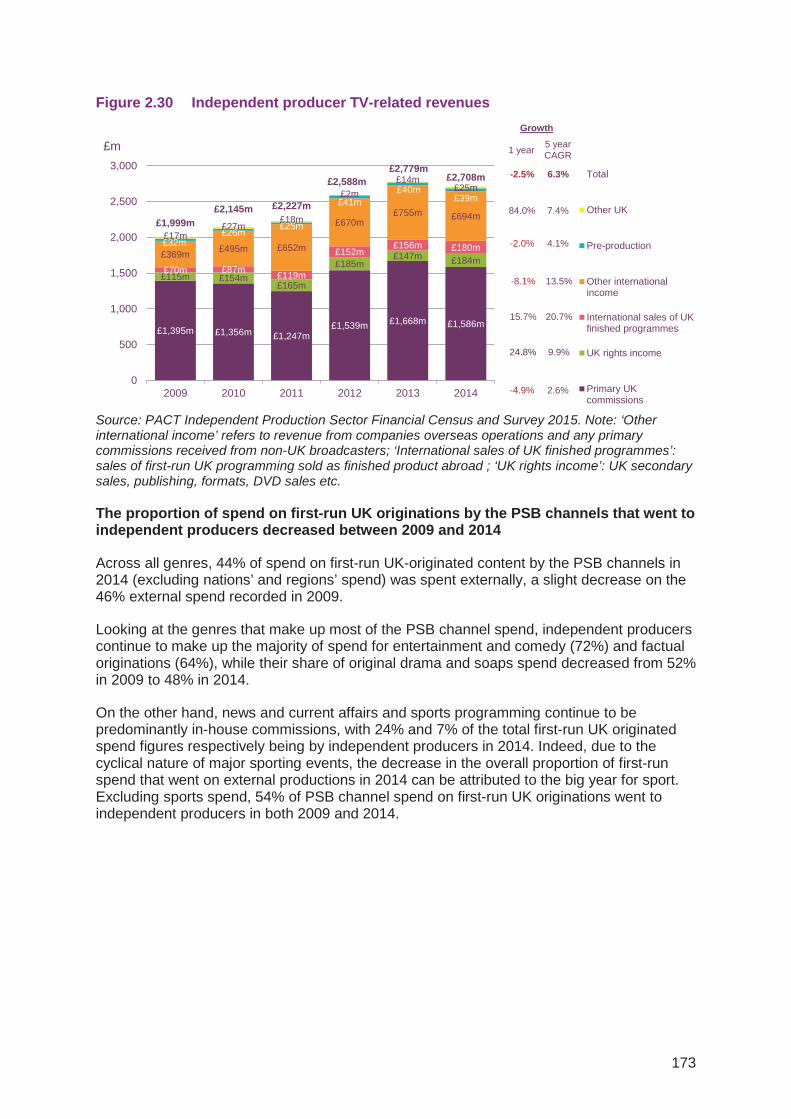
Figure 2.30 Independent producer TV-related revenues
Source: PACT Independent Production Sector Financial Census and Survey 2015. Note: ‘Other international income’ refers to revenue from companies overseas operations and any primary commissions received from non-UK broadcasters; ‘International sales of UK finished programmes’: sales of first-run UK programming sold as finished product abroad ; ‘UK rights income’: UK secondary sales, publishing, formats, DVD sales etc.
The proportion of spend on first-run UK originations by the PSB channels that went to independent producers decreased between 2009 and 2014
Across all genres, 44% of spend on first-run UK-originated content by the PSB channels in 2014 (excluding nations’ and regions’ spend) was spent externally, a slight decrease on the 46% external spend recorded in 2009.
Looking at the genres that make up most of the PSB channel spend, independent producers continue to make up the majority of spend for entertainment and comedy (72%) and factual originations (64%), while their share of original drama and soaps spend decreased from 52% in 2009 to 48% in 2014.
On the other hand, news and current affairs and sports programming continue to be predominantly in-house commissions, with 24% and 7% of the total first-run UK originated spend figures respectively being by independent producers in 2014. Indeed, due to the cyclical nature of major sporting events, the decrease in the overall proportion of first-run spend that went on external productions in 2014 can be attributed to the big year for sport. Excluding sports spend, 54% of PSB channel spend on first-run UK originations went to independent producers in both 2009 and 2014.
£1,395m £1,356m £1,247m£1,539m £1,668m £1,586m
£115m £154m£165m
£185m£147m £184m
£70m £87m £119m
£152m£156m £180m
£369m £495m £652m
£670m£755m £694m
£32m£26m
£25m
£41m£40m
£39m
£17m£27m
£18m
£2m£14m
£25m
£1,999m£2,145m £2,227m
£2,588m£2,779m
£2,708m
0
500
1,000
1,500
2,000
2,500
3,000
2009 2010 2011 2012 2013 2014
Total
Other UK
Pre-production
Other internationalincome
International sales of UKfinished programmes
UK rights income
Primary UKcommissions
-2.0%
15.7%
4.1%
20.7%
13.5%-8.1%
84.0% 7.4%
9.9%24.8%
-2.5% 6.3%
2.6%-4.9%
1 year 5 year CAGR
Growth
£m
173

Figure 2.31 Relative share of spend on first-run UK-originated content, by genre, in-house vs. independent producers: 2009 and 2014
Source: Ofcom/broadcasters. Note: Figures are expressed in nominal terms. Includes spend by the five main PSB channels and BBC portfolio channels on first-run originated content broadcast all day, and excludes nations’/regions’ output.
2.2.6 Spend on first-run UK-originated content by the main five PSB channels
There was a 5% increase in first-run UK-originated content spend by the main five PSB channels on network and nations’ and regions’ programming in 201459
Spend on first-run UK-originated programming by the main five PSB channels (including spend by the nations’ and regions’ channels and ITV Breakfast) increased by 5%, from £2,451m in 2013 to £2,585m in 2014 in nominal terms. Spend on first-run UK originations in peak time also increased year on year, to £1,515m (a 3% increase).
After falling in 2013, first-run spend in 2014 was nearly at the same level as in 2012. This fluctuation can be attributed to major sporting events; 2012 had the London Olympics and the European football championships, while 2014 featured the Brazil World Cup and the Glasgow Commonwealth games.
Overall, there is a compound annual growth rate of 1% in nominal terms across the five-year period from 2009 to 2014.
59 Further information on content spend across the PSB channels can be found in Ofcom’s PSB Review, in which figures are adjusted for inflation: http://stakeholders.ofcom.org.uk/consultations/psb-review-3/
£47£41
£91£88
£292£304
£569£516
£26 £420£20£7 £504
£15£451£13£482
£414£17£545
£2,342£2,521
Total spend on first-run originations (£m)
60% 53% 56% 60%78% 76%
48% 52%
22%
79%
30% 28% 34% 36%
55%
77%91% 93%
54% 56%
40% 47% 44% 40%22% 24%
52% 48%
78%
21%
70% 72% 66% 64%
100% 100%
45%
23%9% 7%
46% 44%
2009
2014
2009
2014
2009
2014
2009
2014
2009
2014
2009
2014
2009
2014
2009
2014
2009
2014
2009
2014
2009
2014
Arts &Classical
Music
Childrens News &Current Affairs
Drama &Soaps
Education Entertainment& Comedy
Factual Feature Films Religion &Ethics
Sports Grand Total
Internal External
174

Figure 2.32 Spend on first-run UK originated output on the five main networks
Source: Ofcom/broadcasters. Note: Figures are expressed in nominal terms. They include ITV Breakfast, spending in the nations and regions on English-language programming (and a small amount of Irish-language programmes) but do not include the BBC’s portfolio channels, BBC Alba or S4C
2.2.7 Television output on the PSB channels PSB output in context
There were 87,087 hours of content broadcast by the PSB channels (including programmes for the nations and regions) in 2014, with just over half (43,401 hours) being first-run UK originations, produced either in-house or commissioned from external producers.
Looking at the breakdown shown in Figure 2.33, of the 42,238 hours broadcast by the main five PSB channels in 2014, 45% were first-run UK originations. This compares to 40% (13,284 hours) of output on the BBC portfolio channels, while the vast majority of nations’ and regions’ output (94%) was first-run in 2014.
£1,357m £1,419m £1,429m £1,502m £1,476m £1,515m
£611m £624m £563m £564m £484m £549m
£189m £212m £247m £257m£229m
£244m£256m
£261m £267m £266m£263m
£277m£2,413m
£2,516m £2,506m £2,588m£2,451m
£2,585m
0
1,000
2,000
3,000
2009 2010 2011 2012 2013 2014
Nations &Regions
Late night
Day time
Peak time
£m
2%
1%
-2%
5%
5yr CAGR
6%
5%
14%
6%
1 yearGrowth
3% 2%
175
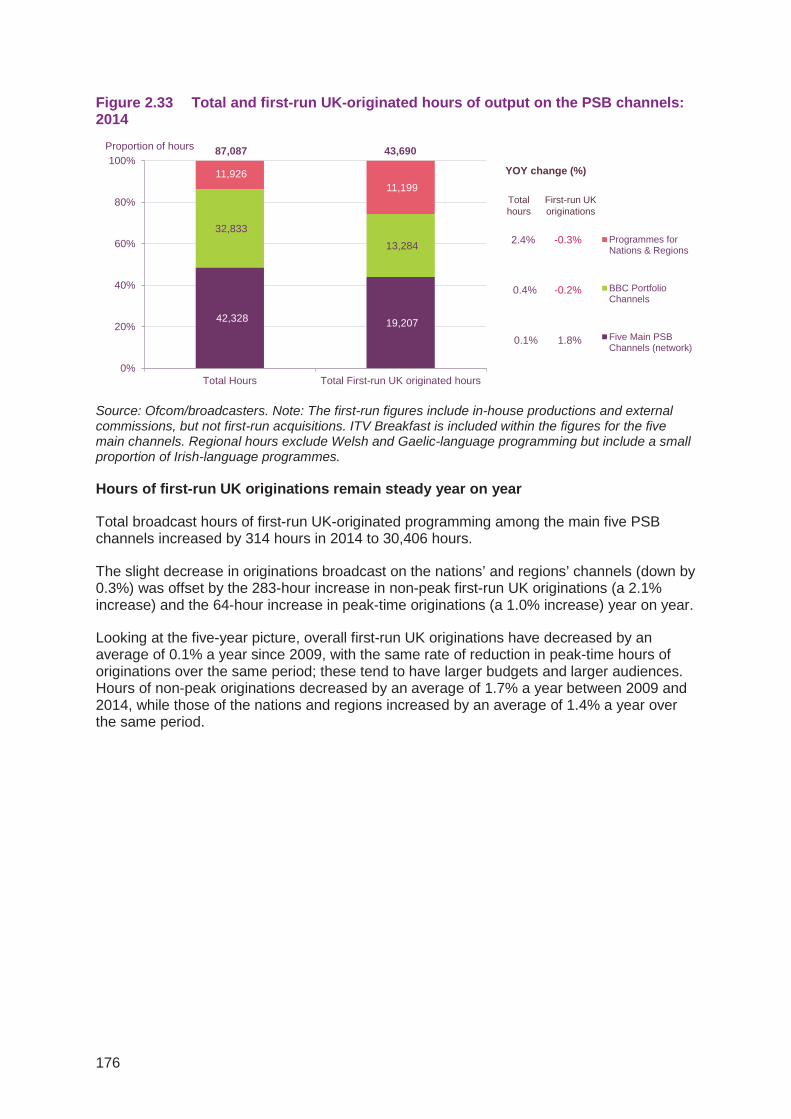
Figure 2.33 Total and first-run UK-originated hours of output on the PSB channels: 2014
Source: Ofcom/broadcasters. Note: The first-run figures include in-house productions and external commissions, but not first-run acquisitions. ITV Breakfast is included within the figures for the five main channels. Regional hours exclude Welsh and Gaelic-language programming but include a small proportion of Irish-language programmes.
Hours of first-run UK originations remain steady year on year
Total broadcast hours of first-run UK-originated programming among the main five PSB channels increased by 314 hours in 2014 to 30,406 hours.
The slight decrease in originations broadcast on the nations’ and regions’ channels (down by 0.3%) was offset by the 283-hour increase in non-peak first-run UK originations (a 2.1% increase) and the 64-hour increase in peak-time originations (a 1.0% increase) year on year.
Looking at the five-year picture, overall first-run UK originations have decreased by an average of 0.1% a year since 2009, with the same rate of reduction in peak-time hours of originations over the same period; these tend to have larger budgets and larger audiences. Hours of non-peak originations decreased by an average of 1.7% a year between 2009 and 2014, while those of the nations and regions increased by an average of 1.4% a year over the same period.
42,328 19,207
32,833 13,284
11,926 11,199
0%
20%
40%
60%
80%
100%
Total Hours Total First-run UK originated hours
Programmes forNations & Regions
BBC PortfolioChannels
Five Main PSBChannels (network)
87,087 43,690Proportion of hours
YOY change (%)
2.4% -0.3%
0.4% -0.2%
0.1% 1.8%
Total hours
First-run UK originations
176

Figure 2.34 Hours of first-run UK-originated output on the five main PSB channels
Source: Ofcom/broadcasters. Note: Figures include ITV Breakfast but do not include the BBC’s portfolio channels. Regional hours exclude Welsh and Gaelic-language programming but include a small proportion of Irish-language programmes.
All of the PSB groups increased their percentage of spend on new commissions in 2014
Of the commissions from the independent sector made by the PSBs, the majority continued to be on returning series in 2014; 85% of ITV’s spend was on such programming, according to the latest figures from PACT. However, each PSB group had a year-on-year increase in the proportion of spend on new commissions in 2014: Channel 5 by 23pp, to 38% of spend on producers, the BBC and Channel 4/S4C by 12pp, to 46% and 33% of spend respectively, and ITV by 7pp to 15% in 2014.
Figure 2.35 Proportion of spend on new commissions vs. returning series: PSB groups
Source: PACT Independent Production Sector Financial Census and Survey 2015. Note: Figures include commissions by the PSB portfolio channels.
5,414 5,665 5,696 5,685 5,680 5,744
14,632 13,316 13,338 13,365 13,180 13,463
10,439 11,060 11,647 11,002 11,232 11,199
30,485 30,041 30,681 30,052 30,092 30,406
0
5,000
10,000
15,000
20,000
25,000
30,000
35,000
2009 2010 2011 2012 2013 2014
Nations &Regions
Non-peaknetwork
Peak-timenetwork
Growth
5 yr CAGR
-0.1%
+1.4%
-1.7%
-0.1%
1 Year
+1.0%
-0.3%
2.1%
1.0%
hours
35%
29%
27% 34
%
34% 46
%
10% 21
%
19% 24
%
8% 15%
19% 27
% 35%
34%
21% 33
% 43%
18%
41%
22%
15%
38%
65%
71%
73% 66
%
66% 54
%
90% 79
%
81% 76%
92% 85
%
81% 73
% 65%
66%
79% 67
% 57%
82%
59%
78%
85%
62%
0%
20%
40%
60%
80%
100%
2009 2010 2011 2012 2013 2014 2009 2010 2011 2012 2013 2014 2009 2010 2011 2012 2013 2014 2009 2010 2011 2012 2013 2014
New Commission Returning Series
% of spend
BBC ITV/STV/UTV Channel 4/S4C Channel 5
63 27 47 57 41 52298 303 287 346 402 380374 398 313 388 367 486498 498 437 508 476 474
Estimated primary rights spend (£m)
177

The average number of first-run UK-originated hours broadcast per week on the PSB channels reached its highest level since 2009 in 2014
In 2014, the PSB channels broadcast an average of 624 hours of first-run UK-originated content per week, up from 619 hours in 2013, the highest average since the 629 hours per week broadcast in 2009. There were an average of 170 hours of peak-time first-run UK originations broadcast on the PSB channels in 2014, a three-hour decrease from the 173 hours per week average in 2013.
Looking at the main five PSB channels, ITV/ITV Breakfast was the only channel to decrease its average hours of first-run UK originations year on year, down by four hours to an average of 94 hours a week in 2014. The BBC portfolio channels combined also saw a slight decrease in average hours of originations, down by one hour to 255 hours in 2014.
Channel 5 broadcast an average of 14 hours of first-run UK originated content per week during peak time in 2014; this was its joint-highest average over the 2009-2014 period. BBC One and BBC Two also had five-year high averages in 2014 (at 27 hours and 23 hours per week respectively) while ITV/ ITV Breakfast and Channel 4 were both down by one hour (to 25 hours and 21 hours per week respectively) in 2014.
Figure 2.36 First-run UK-originated output by the PSB channels per week: all day and peak time
Source: Ofcom/broadcasters. Note: Figures do not include nations’ and regions’ output. BBC portfolio channels include BBC Three, BBC Four, BBC News, BBC Parliament, CBBC and CBeebies
There was a 6% increase in entertainment and comedy output during peak hours on the main five PSB channels in 2014
Looking at total programming, more hours of factual programming than of any other genre of programming were broadcast on the main five PSB channels during peak hours in 2014, although there was a 3% decrease (70 hours) to 2,559 hours from the 2013 figure.
There was a 6% (88-hour) increase in the number of entertainment and comedy hours broadcast on the main five PSB channels during peak hours since 2013, to total 1,579 hours in 2014. Over the same period, drama and soaps output decreased by 140 hours, to total 1,346 hours in 2014, continuing the decline seen since 2009, as shown in Figure 2.37.
26 26 26 27 26 27
20 22 21 22 22 23
26 26 26 26 26 25
22 22 23 23 22 21
11 12 14 12 12 14
6364 65 65 63 60
0
50
100
150
200
2009 2010 2011 2012 2013 2014
Hou
rs p
er w
eek BBC portfolio
channels
Channel 5
Channel 4
ITV/ITVBreakfast
BBC Two
BBC One
167 173 175 175 173 170
Peak-Time
104 106 105 107 124 128
70 73 66 66 54 57
101 101 101 99 98 94
57 58 59 64 57 5754 27 35 31 30 33
243 248 253 256 256 255
0
200
400
600
800
2009 2010 2011 2012 2013 2014
Hou
rs p
er w
eek BBC portfolio
channels
Channel 5
Channel 4
ITV/ITVBreakfast
BBC Two
BBC One
All Day
629 613 619 622 619 624
178
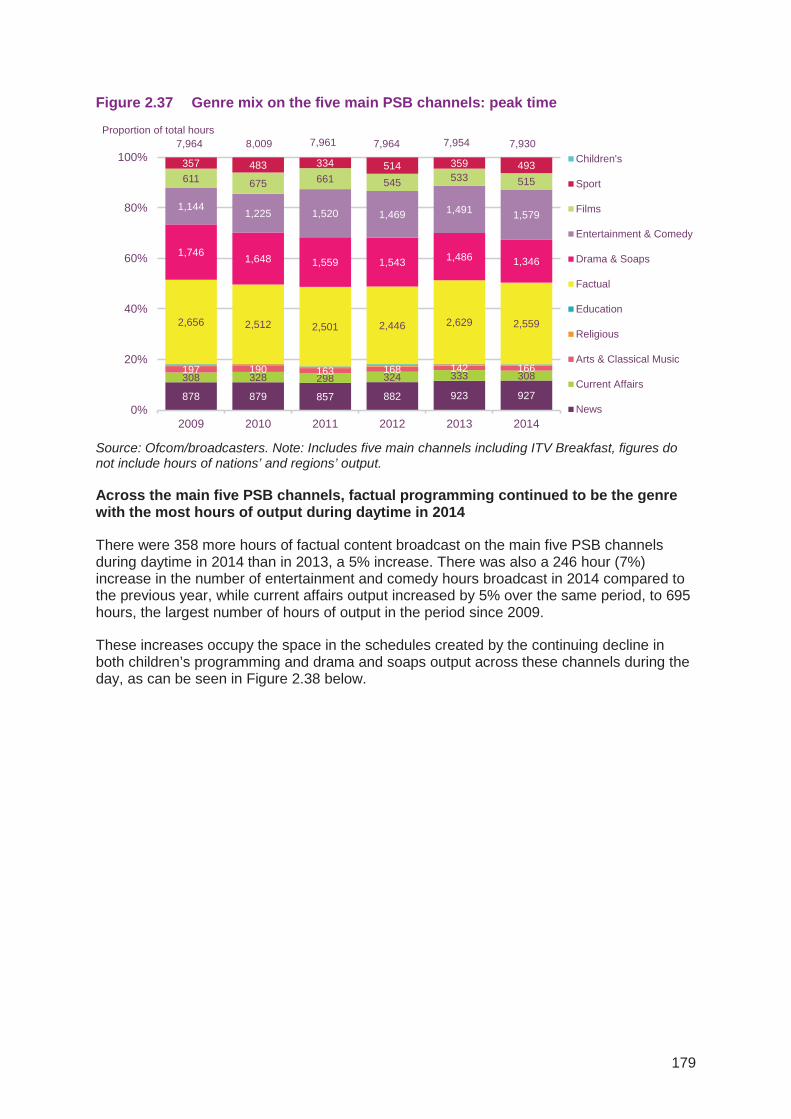
Figure 2.37 Genre mix on the five main PSB channels: peak time
Source: Ofcom/broadcasters. Note: Includes five main channels including ITV Breakfast, figures do not include hours of nations’ and regions’ output.
Across the main five PSB channels, factual programming continued to be the genre with the most hours of output during daytime in 2014
There were 358 more hours of factual content broadcast on the main five PSB channels during daytime in 2014 than in 2013, a 5% increase. There was also a 246 hour (7%) increase in the number of entertainment and comedy hours broadcast in 2014 compared to the previous year, while current affairs output increased by 5% over the same period, to 695 hours, the largest number of hours of output in the period since 2009.
These increases occupy the space in the schedules created by the continuing decline in both children’s programming and drama and soaps output across these channels during the day, as can be seen in Figure 2.38 below.
Proportion of total hours
878 879 857 882 923 927
308 328 298 324 333 308197 190 163 168 142 166
2,656 2,512 2,501 2,446 2,629 2,559
1,746 1,648 1,559 1,543 1,486 1,346
1,144 1,225 1,520 1,469 1,491 1,579
611 675 661 545 533 515
357 483 334 514 359 493
0%
20%
40%
60%
80%
100%
2009 2010 2011 2012 2013 2014
Children's
Sport
Films
Entertainment & Comedy
Drama & Soaps
Factual
Education
Religious
Arts & Classical Music
Current Affairs
News
7,954 7,930 7,964 8,009 7,961 7,964
179

Figure 2.38 Genre mix on the five main PSB channels: daytime
Source: Ofcom/broadcasters. Note: Includes five main channels plus ITV Breakfast. Figures do not include hours of nations’ and regions’ output.
Output on the BBC portfolio channels remains dominated by the single-genre channels
As four of the six BBC portfolio channels are single-genre (BBC News, BBC Parliament, CBBC and CBeebies), there has been very little movement in the genre mix among these channels since 2009.
There was a 15% increase (300 hours) in the number of factual hours broadcast across these channels in 2014, while with a 2% decrease (down by 32 hours to 1,970 hours), entertainment and comedy output declined across the BBC portfolio channels in 2014 following four years of growth.
2,881 2,793 2,679 2,536 2,750 2,632
438 440 549 594 661 695
4,775 5,232 5,777 6,0457,400 7,758
2,590 2,719 2,375 1,862
1,734 1,3672,814 2,596 2,627 2,877
3,716 3,9621,645 1,557 1,721 1,753
1,645 1,4151,505 1,650 1,488 1,624
1,608 2,0294,137 4,214 4,204 4,2131,946 1,668
0%
20%
40%
60%
80%
100%
2009 2010 2011 2012 2013 2014
Children's
Sport
Films
Entertainment & Comedy
Drama & Soaps
Factual
Education
Religious
Arts & Classical Music
Current Affairs
News
Proportion of total hours
21,74821,65421,597 21,610 21,665 21,680
180

Figure 2.39 Genre mix on the BBC portfolio channels: all day
Source: Ofcom/broadcasters. All figures are nominal. Note: BBC portfolio channels include BBC Three, BBC Four, BBC News, BBC Parliament, CBBC and CBeebies. Investment figures are nominal. ‘Other’ includes: education, drama, film, religion and sports
2.2.8 Television output and spend in the multichannel sector First-run originations/acquisitions made up 15% of all hours broadcast on the non-PSB channels in 2014
The multichannel sector consists of all TV channels that broadcast to the UK and are licensed by Ofcom, with the exception of the PSB channels. Of the 1.72 million hours broadcast by these channels in 2014, 15% were first-run originations/acquisitions.
Entertainment programming made up 28% of the output across the multichannel sector in 2014, with the large annual increase in both total and first-run output being due to the addition of new channels in 2014 (such as ITVBe and ITV Encore). Music programming was the second biggest genre among these channels, with 17% of all output in 2014.
Looking at first-run output, sports and news hours combined made up 57% of all original content across the non-PSB channels in 2014. Twelve per cent of all entertainment output across these channels in 2014 was first-run (58,584 hours).
16,546 16,460 16,555 16,710 16,566 16,517
1,339 1,472 1,421 1,204 1,256 1,323
8,406 8,213 8,178 8,306 8,362 8,409
2,629 2,405 2,648 2,703 1,999 2,2291,077 1,296 1,151 890 1,277 1,1361,532 1,768 1,908 1,988 2,002 1,9701,622 1,588 1,369 1,561 1,243 1,249
0%
20%
40%
60%
80%
100%
2009 2010 2011 2012 2013 2014
Other
Entertainment &Comedy
Arts & Classical Music
Factual
Children's
Current Affairs
News
33,202Proportion of total hours
32,83333,151 33,230 33,362 32,705
181

Figure 2.40 Total multichannel hours and first-run originations/acquisitions: 2014
Source: Ofcom/broadcasters. Note: Broadcast hours exclude Sky Box Office and ‘barker’ channels, which promote TV content, and replace previous data published by Ofcom. First-run hours include first-run in-house, commissioned and acquired content.
Spend on sports programming by the multichannel sector exceeded £2bn in 2014
There was a 21% increase in spend on sports programming across the multichannel sector in 2014, to reach £2,186m in nominal terms. This was predominantly because 2014 was the first full year to reflect the higher Premier League rights payments, following the 2012 TV rights auction.
Apart from this increase, spend on news output across this sector increased by 12% to total £89m in 2014, and there was a £52m (7%) increase in spend on entertainment programming, to total £772m. Spend on children’s content across these channels decreased by 11% (£5m) year on year, to total £38m in 2014.
Proportion of hours by channel genre (%)
485,639 58,584
208,050
6,453
138,761
1,633
58,139
1,589
127,112
59,020
180,386 85,236
229,738 7,930
298,332 34,075
0%
20%
40%
60%
80%
100%
1 2
Music
Movies
Sport
News
Leisure
Children's
Factual
Entertainment
Total = 1,726,157Total (2013 = 1,457,138)
Total = 254,520(Total 2013 = 199,880)
1 year change %Total First Run
-8% 52%
17% 1%
5% 5%
20% 7%
16% -4%
2% -41%
6% 17%
77% 153%All Hours First-Run Hours
182

Figure 2.41 Multichannel content spend in key genres: 2013-2014
Source: Ofcom/broadcasters. Note: Spend expressed in nominal terms. Excludes BBC portfolio channels.
Multichannel spend on sports rights alone will be over £2bn by 2017 On 10 February 2015, the Premier League announced its latest live TV rights deal for the three seasons from 2016/17, with Sky and BT paying £5,136m combined for 168 matches per year. This followed the announcement that BT would pay £897m for exclusive rights to broadcast live UEFA Champions League and Europa League matches for the three seasons from 2015/16. This means that from August 2016, these two broadcasters will be spending £2,011m a year on the rights to live coverage from these competitions alone.
Increases in the amounts paid for TV rights to other sporting events will further increase multichannel spend on sports programming over the next few years. Earlier this year Sky announced that it had purchased exclusive rights to live coverage of the Open Championship golf tournament from 201760, while BT recently announced an extension to its deal for English Premiership rugby rights from the 2017/18 season, which is reported to be on increased terms.61
60 http://www1.skysports.com/golf/news/12176/9698005/the-open-championship-to-be-broadcast-exclusively-live-on-sky-sports-from-2017 61 http://www.bbc.co.uk/sport/0/rugby-union/31902745
£1,808m£2,186m
£721m
£772m£285m
£292m
£77m
£81m
£80m
£89m
£43m
£38m
0
500
1,000
1,500
2,000
2,500
3,000
3,500
4,000
2013 2014
Leisure
Music
Children's
News
Factual
Movies
Entertainment
Sport
£m 1 year change %
14%
-9%
-5%
-11%
12%
5%
2%
7%
21%
£3,062m £3,503m
183

2.3 The TV and audio-visual viewer 2.3.1 Summary This section examines the availability and take-up of digital TV platforms and trends in television consumption, including some categories of non-broadcast TV viewing. It also analyses viewers’ attitudes to television. The key points include:
• The average number of minutes of broadcast TV watched on a TV set in 2014 fell for the second consecutive year. On average, people watched 220 minutes of broadcast television per day in 2014, 11 minutes per day less than in 2013. TV viewing varies greatly by age, and between 2013 and 2014 fell by varying degrees among all age groups. The largest decline was among children aged 4-15 with a 17 mins/day (-12.4%) fall, compared to a 1 min/day (-0.3%) decline among viewers aged 65+. The ‘Changes in TV viewing habits’ (section 1.4) explores the fall in viewing in further detail.
• The proportion of homes with a TV with a multi-channel signal has declined for the second consecutive period, to 92.9% of all homes (compared to 94.7% of all homes in 2013 and 95.5% in 2012). The decline may be attributable to households who watch audio-visual content using an internet connection only, those who do not use a television, and those who use a television set that does not receive any broadcast signal.
• The digital terrestrial platform remains the most popular method of viewing television, accounting for the highest proportion (44.3%) of total TV viewing hours. The digital satellite platform followed just 3.9 percentage points behind, accounting for the second largest proportion of total TV viewing hours (40.5%). The proportion of total hours of TV watched on the digital cable platform was 14.6%.
• Collectively, the main five PSBs accounted for 54.3% of audience share on the digital terrestrial platform, compared to 51.1% on digital cable and 45.9% on digital satellite. The greater choice of ‘other’ subscription channels in digital cable and satellite homes is likely to explain why their combined share (48.9% and 54.1% respectively) is higher than in digital terrestrial homes (45.7%).
• The combined share of the main five PSB channels accounted for over half (51.2%) of all viewing in 2014, up by 0.1 percentage point on the previous year. Taking the main five PSBs and their portfolio channels together, the combined family share was 71.9% in 2014. The share of viewing to all ‘other’ digital channels remained stable at 28.1% in 2014.
• Of the top 20 channels ranked by audience share in 2014, 17 were PSB main channel services or PSB-owned. Two Sky-owned channels and one UKTV-owned channel made up the remaining three of the top 20.
• About half of adult viewers say that the quality of TV programmes has ‘stayed the same’ over the past 12 months, while three in ten feel they have ‘got worse’ and 16% feel they have improved. Among those who thought programmes had got worse, the top four reasons were ‘more repeats’ (57%), ‘lack of variety’ (43%), ‘general lack of quality’ (32%) and ‘too many reality shows’ (30%).
185
Broadcast TV viewing BARB analysis is based on viewing to scheduled TV programmes such as those listed in TV listings magazines or on electronic programme guides (EPG) on TV sets. ‘Broadcast TV viewing’ refers to TV programmes watched on the TV set live at the time of broadcast (traditional TV viewing), or recordings of these programmes or viewing of these programmes through catch-up player services (referred to as time-shifted), up to seven days after they are televised.
Traditional TV viewing ‘Traditional TV viewing’ refers to TV programmes watched live at the time of broadcast on the TV set.
Time-shifted viewing ‘Time-shifted viewing’ is defined by BARB as viewing of programmes recorded and subsequently played back on a television set within seven days of live broadcast, as well as viewing after pausing or rewinding live TV. Recording devices included in BARB analysis include video cassette recorders (VCR); DVD recorders (which store programmes on writable DVDs); digital video recorders (DVRs) which use a hard disk to store programmes chosen from an electronic programme guide, and combination devices (which use a combination of internal hard disk and removable DVDs to store programmes).
Viewing any catch-up TV player services through the television set is also captured if the content has been broadcast live in the past seven days. This includes catch-up player services accessed through apps on smart TVs and games consoles, and any viewing on a laptop or personal computer connected to the television set. Viewing outside the seven-day window, viewing catch-up services on devices that are not connected to the TV set, and video on demand (VoD) services (such as Amazon Prime Instant Video and Netflix) that are not scheduled on a television channel, are not reported as time-shifted viewing.
Broadcaster family ‘Broadcaster family’ refers to all channels belonging to a particular channel group. For example, the Channel 5 family includes Channel 5, Channel 5 +1, 5*, 5 USA and Channel 5+24.
Digital terrestrial Digital terrestrial is a type of platform signal. It includes all televisions that receive their broadcast TV signal through an aerial. This includes services provided by Freeview, BT Vision and YouView.
Digital satellite Digital satellite is a type of platform signal. It includes all televisions that receive their broadcast TV signal through a satellite dish. This includes services provided by Sky and Freesat.
Digital cable Digital cable is a type of platform signal. It includes all televisions that receive their broadcast TV signal through a cable network. This includes services provided by Virgin Media.
186

2.3.2 Platform take-up Take-up of multichannel declined by 1.8 percentage points to 92.9% of all homes in Q4 2014. Figure 2.42 shows the proportion of UK households with a multichannel TV signal and the split by platform. Since completion of digital switchover in October 2012, multichannel is now the only form of broadcast signal available in the UK. Between 2001 and 2012 multichannel take-up increased year on year, but has declined since 2013.
Comparing 2014 to 2013, there has been a decline in the proportion of households that receive a multichannel signal, from 94.7% to 92.9%, so 7.1% of UK households now do not have any means of receiving broadcast television on a TV set. The decline may be attributable to households who watch audio-visual content using an internet connection only, households who do not use a television, or households who use a television set that does not receive any broadcast signal.
Figure 2.42 Platform take-up: 2001-2014
Source: BARB Establishment Survey. Note: Data points are based on household level data for Q4 of each year.
Platform demographics
Figure 2.43 shows the age and socio-economic mix of use of TV platforms in 2014, together with average television viewing hours per day by platform. Digital terrestrial only (DTT-only) households had a higher proportion of older viewers (over-65s) than households with digital cable and digital satellite platforms; these had a higher proportion of younger viewers (25-44s).
Digital satellite attracted the highest proportion of AB individuals (27%), followed by digital cable (26%), while DTT-only households had the largest proportion of DE individuals (33%). Across each of the platforms, individuals in DTT-only homes watched the most television (231 minutes/day), probably due to the older demographic skew in DTT-only homes. Individuals in digital cable homes watched the least amount of TV on average (207 minutes/day).
TV households (m)
02468
10121416182022242628
2001 2002 2003 2004 2005 2006 2007 2008 2009 2010 2011 2012 2013 2014
Analogue TerrestrialOnly
Digital Terrestrial only
Analogue cable
Digital cable
Free to view digitalsatellite
Pay digital satellite
Multichannel take-up (% all households)38.5% 39.4% 45.3% 52.9% 61.8% 69.4% 77.3% 84.3% 88.2% 91.5% 94.4% 95.5% 94.7% 92.9%
187

Figure 2.43 Platform demographics by age, socio-economic group and viewing minutes
Source: Platform profile – Ofcom Technology Tracker 2014. Average minutes – BARB 2014 data
The average number of minutes of broadcast TV watched on a TV set in 2014 fell for the second consecutive year, to 220 minutes.
According to BARB, the average number of minutes of broadcast television watched per person in the UK has fluctuated over the last 11 years. Viewing in 2014 (220 minutes, or 3 hours 40 minutes per day) was in line with viewing a decade ago, in 2004 (222 minutes, or 3 hours 42 minutes per day). Comparing 2014 to 2013, the data show a decline of 1162 minutes per day among all individuals, continuing the nine-minutes-per-day fall between 2012 and 2013. For a more in-depth discussion of the year-on-year decline in TV viewing minutes see ‘Changes in TV viewing habits’ (Section 1.4).
TV viewing varies greatly by age: children watched the least television (118 minutes a day) and adults aged 65 and over watched the most (340 minutes a day). Between 2013 and 2014, viewing among all age groups fell by varying degrees. The largest decline was among children aged 4-15, with a 17 minutes per day (-12.4%) fall, compared to a one minute per day (-0.3%) decline among viewers aged 65 or over.
62 Minutes spent watching TV per day declined by 11 minutes year on year, although values appear in the chart to not equate to 11 minutes due to rounding.
25% 22% 27% 26%
30% 28%31% 32%
18%17%
19% 19%
27% 33%23% 23%
16-24 25-44 45-64 65+ AB C1 C2 DE
15% 12% 17% 15%
37%31%
41% 39%
31%29%
31% 32%
18% 27%11% 14%
0%
20%
40%
60%
80%
100%220 231 219 207
0
50
100
150
200
250
Average minutes per day % platform profile
188

Figure 2.44 Average minutes of broadcast television viewing per day, by age: all homes
Source: BARB, Network, individuals 4+. Note: A new BARB panel was introduced in 2010. As a result, pre- and post-panel change data must be compared with caution.
TV audiences continue to peak between 9pm and 10pm
Figure 2.45 shows the size and distribution of viewing audiences throughout the day on weekdays compared to weekends.
The size of the audience tends to be larger at weekends; the exception to this is between 5am to 8am, when the weekday audience is higher.
The distribution of audiences throughout the day is broadly similar at weekends and on weekdays. At weekends viewing audiences gradually rise throughout the day, with viewing peaking between 9pm and 10pm. Similarly, weekday viewing increases throughout the day but audiences also spike at breakfast and lunchtime. On weekdays and at the weekend audiences average over 25 million viewers in the 9-10pm slot.
Figure 2.45 Average 2014 audiences, weekdays/weekends, by day part: all homes
Source: BARB, individuals 4+
Figure 2.46 shows when different age groups are watching TV on a weekday. Throughout the day adults aged 65+ are the largest audience group watching. Their viewing rises during breakfast and lunchtime hours, dipping in between, and peaking at almost 7 million viewers
306 301 294 301315 314
343 345 347 341 340
268 264 263 271 278 279
311 316 314 309 298
241 242 243 242253 255
269 270 269256 245
222 219 216 218 225 225242 242 241 232
220222 220 216 217 219 217234 232 227 216
199211 208 200 198 205 204 199 196 196 185
169156 157 155 151 150 154
169 165 157 148 138144 135 132 134 139 137151 147 142 134
118
0
50
100
150
200
250
300
350
2004 2005 2006 2007 2008 2009 2010 2011 2012 2013 2014
Adults 65+
Adults 55-64
Adults 45-54
Individuals
Adults 35-44
Adults 25-34
Adults 16-24
Children
Average minutes per day
0
4
8
12
16
20
24
28
06:00 -07:00
09:00 -10:00
12:00 -13:00
15:00 -16:00
18:00 -19:00
21:00 -22:00
24:00 -01:00
03:00 -04:00
WeekendWeekday
Average audience (millions)
189

between 9pm and 10pm. The volume of viewing across all adult age groups increases from 4pm onwards, reaching a peak between 9pm and 10pm. In contrast, children’s viewing climbs at a steeper rate and reaches a peak earlier in the evening, between 7pm and 8pm.
Figure 2.46 Average 2014 weekday audiences, by day part and age: all homes
Source: BARB, Individuals 4+ At weekends, the 65+ age group are again the largest audience group, watching throughout the day (Figure 2.47). The average number of viewers increases between 6am and 9am (except among 16-24s), levelling off in the late morning and rising at a steeper rate after 5pm, peaking between 9pm and 10pm. Among 16-24 year olds, however, the TV viewing audience rises at a slower and more consistent rate and peaks between 9pm and 10pm at just 1.78 million viewers. Among children, the average number of viewers peaks in the morning between 10am and 11am, and then again in the evening between 7pm and 8pm (2 million viewers).
Figure 2.47 Average 2014 weekend audiences, by day part and age: all homes
Source: BARB, individuals 4+
0
1
2
3
4
5
6
7
06:00 -07:00
09:00 -10:00
12:00 -13:00
15:00 -16:00
18:00 -19:00
21:00 -22:00
00:00 -01:00
03:00 -04:00
ChildrenAdults 16-24Adults 25-34Adults 35-44Adults 45-54Adults 55-64Adults 65+
Average audience (millions)
0
1
2
3
4
5
6
7
06:00 -07:00
09:00 -10:00
12:00 -13:00
15:00 -16:00
18:00 -19:00
21:00 -22:00
00:00 -01:00
03:00 -04:00
ChildrenAdults 16-24Adults 25-34Adults 35-44Adults 45-54Adults 55-64Adults 65+
Average audience (millions)
190
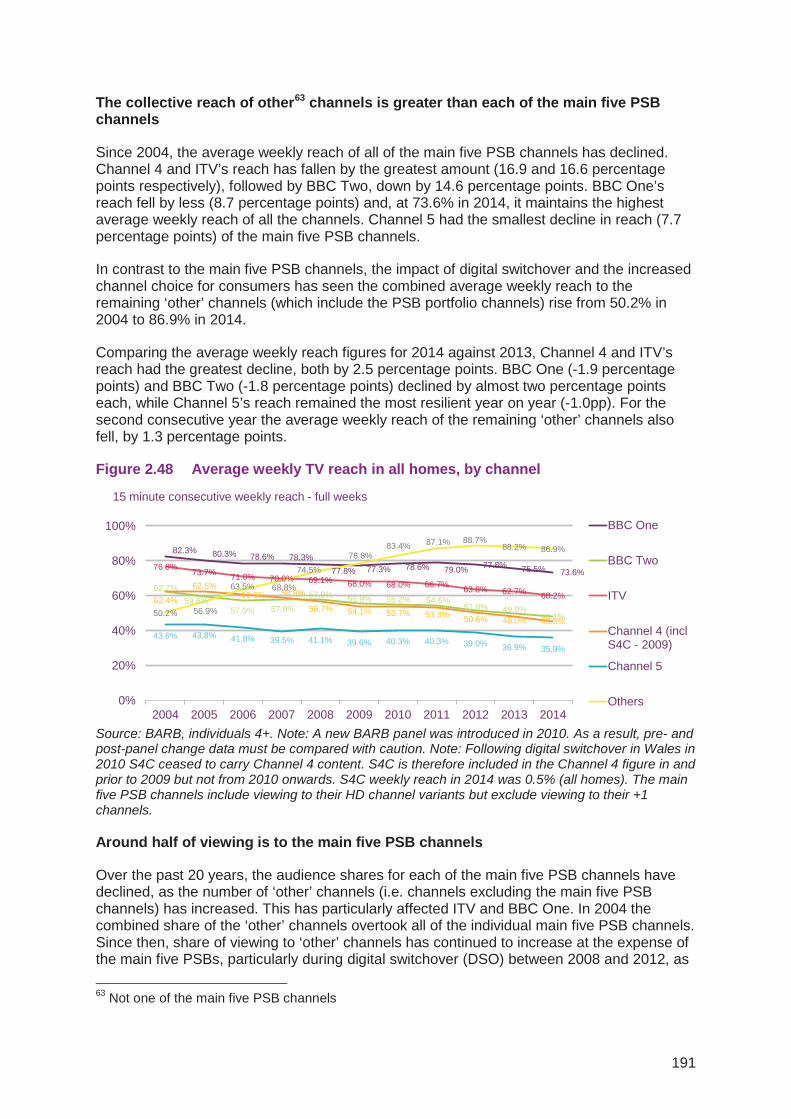
The collective reach of other63 channels is greater than each of the main five PSB channels
Since 2004, the average weekly reach of all of the main five PSB channels has declined. Channel 4 and ITV’s reach has fallen by the greatest amount (16.9 and 16.6 percentage points respectively), followed by BBC Two, down by 14.6 percentage points. BBC One’s reach fell by less (8.7 percentage points) and, at 73.6% in 2014, it maintains the highest average weekly reach of all the channels. Channel 5 had the smallest decline in reach (7.7 percentage points) of the main five PSB channels.
In contrast to the main five PSB channels, the impact of digital switchover and the increased channel choice for consumers has seen the combined average weekly reach to the remaining ‘other’ channels (which include the PSB portfolio channels) rise from 50.2% in 2004 to 86.9% in 2014.
Comparing the average weekly reach figures for 2014 against 2013, Channel 4 and ITV’s reach had the greatest decline, both by 2.5 percentage points. BBC One (-1.9 percentage points) and BBC Two (-1.8 percentage points) declined by almost two percentage points each, while Channel 5’s reach remained the most resilient year on year (-1.0pp). For the second consecutive year the average weekly reach of the remaining ‘other’ channels also fell, by 1.3 percentage points.
Figure 2.48 Average weekly TV reach in all homes, by channel
Source: BARB, individuals 4+. Note: A new BARB panel was introduced in 2010. As a result, pre- and post-panel change data must be compared with caution. Note: Following digital switchover in Wales in 2010 S4C ceased to carry Channel 4 content. S4C is therefore included in the Channel 4 figure in and prior to 2009 but not from 2010 onwards. S4C weekly reach in 2014 was 0.5% (all homes). The main five PSB channels include viewing to their HD channel variants but exclude viewing to their +1 channels.
Around half of viewing is to the main five PSB channels
Over the past 20 years, the audience shares for each of the main five PSB channels have declined, as the number of ‘other’ channels (i.e. channels excluding the main five PSB channels) has increased. This has particularly affected ITV and BBC One. In 2004 the combined share of the ‘other’ channels overtook all of the individual main five PSB channels. Since then, share of viewing to ‘other’ channels has continued to increase at the expense of the main five PSBs, particularly during digital switchover (DSO) between 2008 and 2012, as
63 Not one of the main five PSB channels
15 minute consecutive weekly reach - full weeks
82.3% 80.3% 78.6% 78.3%77.8% 77.3% 78.6% 79.0% 77.8% 75.5% 73.6%
62.7%59.6%
57.0% 57.9%
57.9% 55.9% 55.2% 54.6%51.8% 49.9%
48.1%
76.8% 73.7% 71.0% 70.0% 69.1% 68.0% 68.0% 66.7% 63.8% 62.7% 60.2%62.4%
62.5%60.6% 58.8%
56.7% 54.1% 53.7% 53.3% 50.6% 48.0% 45.5%
43.6% 43.8% 41.8% 39.5% 41.1% 39.6% 40.3% 40.3% 39.0% 36.9% 35.9%
50.2% 56.9%
63.5% 68.8%
74.5%
78.8%83.4% 87.1% 88.7%
88.2% 86.9%
0%
20%
40%
60%
80%
100%
2004 2005 2006 2007 2008 2009 2010 2011 2012 2013 2014
BBC One
BBC Two
ITV
Channel 4 (inclS4C - 2009)
Channel 5
Others
191

more homes gained access to an increasing number of channels. In 2014 the ‘other’ channels had an audience share of 48.8%.
The main five PSB channels have a number of additional portfolio channels that sit alongside their core services. Some of these services have operated since as early as the late 1990s (Film4 and ITV2 launched in 1998, and BBC News in 1999), and other channel launches took place a few years before DSO (ITV3 in 2004, More4 in 2005 and 5* and 5 USA in 2006). These services, along with ‘+1’ channels for the main five PSB channels and the rest of their families of channels, are included in the ‘other’ channel group shown in Figure 2.49 below.
Figure 2.55 details the contribution of these portfolio channels since 2004, which has continued to increase to date. The share of viewing to these portfolio channels over the long term has reduced viewing to all ‘other’ non-PSB family channel shares, and has kept the share of ‘other’ channels broadly static in more recent years.
Figure 2.49 Channel shares in all homes: 1988 to 2014
Source: BARB, TAM JICTAR and Ofcom estimates, individuals 4+. Notes: a new BARB panel was introduced in 2010, as a result, pre- and post-panel change data must be compared with caution (see dotted line); following digital switchover in Wales in 2010 S4C ceased to carry Channel 4 content, S4C is therefore included in the Channel 4 figure in and prior to 2009 but not from 2010 onwards; S4C share in 2014 was 0.1% (all homes); the main five PSB channels include viewing to their HD channel variants but exclude viewing to their +1 channels.
Combined share of the main five PSB channels remained steady year on year for the first time across the analysis period since 2004, at 51.2% in 2014
The combined share of the main five PSB channels accounted for over half (51.2%) of all viewing in 2014 (Figure 2.50). Despite a pattern of continued decline since 2004, when combined audience share stood at 73.8%, between 2013 and 2014 the main five PSBs increased their share by 0.1 percentage points.
The increase in the main five PSB channels’ combined viewing share was driven by BBC One and BBC Two; both channels increased their share compared to 2013, by 0.7 and 0.3 percentage points respectively. However, the shares of viewing for ITV, Channel 4 and Channel 5 all declined (by -0.6 percentage points, -0.2 percentage points and -0.1 percentage points respectively).
Since 2004, however, the share of each of the main five PSB channels has declined. ITV’s share has decreased the most, from 22.8% to 14.7%, followed by Channel 4 which has almost halved its share from 9.7 to 4.8%. BBC Two’s share fell by -3.9 percentage points
Audience share
38%
39%
37%
36%
34%
33%
32%
32%
33%
31%
29%
28%
27%
27%
26%
26%
25%
23%
23%
22%
22%
21%
21%
21%
21%
21%
22%
11%
11%
10%
11%
11%
10%
11%
11%
12%
12%
11%
11%
11%
11%
11%
11.0
%
10%
9% 9% 9% 8% 7% 7% 7% 6% 6% 6%
42%
42%
44%
43%
41%
40%
40%
37%
35%
33%
32%
31%
29%
27%
24%
24%
23%
22%
20%
19%
18%
18%
17%
16%
15%
15%
15%
9% 8% 9%
10%
10%
11%
11%
11%
11%
11%
10%
10%
11%
10%
10%
10%
10%
10%
10%
9% 8% 7% 6% 6% 6% 5% 5%
2% 4% 5% 6% 6% 6% 6% 7% 6% 6% 5% 5% 5% 5% 4% 4% 4% 4%
5% 6% 7% 9% 10%
12%
13%
14%
17%
20%
22%
24%
26%
30%
33%
36%
40%
42%
45%
46%
48%
49%
49%
0%
20%
40%
60%
80%
100%
198819891990199119921993199419951996199719981999200020012002200320042005200620072008200920102011201220132014
All otherchannels
Channel 5
Channel4(incl S4C- 2009)ITV
BBC Two
BBC One
192

between 2004 and 2014; from 10.0% to 6.1%, and BBC One’s share fell from 24.7% to 21.7% (-3.0 percentage points). Channel 5’s share declined by 2.6 percentage points since 2004; from 6.6% to 4.0%.
Figure 2.50 Main five PSB channels’ audience share, all homes
Source: BARB, individuals 4+. Note: A new BARB panel was introduced in 2010. As a result, pre- and post-panel change data must be compared with caution. Note: Following digital switchover in Wales in 2010 S4C ceased to carry Channel 4 content. S4C is therefore included in the Channel 4 figure in and prior to 2009 but not from 2010 onwards. S4C 2014 channel share = 0.1%. The main five PSB channels include viewing to their HD channel variants but exclude viewing to their +1 channels.
The combined share of the main five PSB channels is highest in digital terrestrial homes
Figure 2.51 shows how the main five PSB channels as a group have performed across homes with different television platforms. The total share of the main five PSB channels has remained stronger in digital terrestrial homes than in cable or satellite homes, but the share of the main PSB channels has fallen in all types of homes.
Audience share
24.7% 23.3% 22.8% 22.0% 21.8% 20.9% 20.8% 20.7% 21.3% 21.0% 21.7%
10.0% 9.4% 8.8% 8.5% 7.8% 7.5% 6.9% 6.6% 6.1% 5.8% 6.1%
22.8% 21.5% 19.6% 19.2% 18.4% 17.8% 17.0% 16.0% 14.9% 15.3% 14.7%
9.7%9.7% 9.8% 8.6% 7.5% 6.8% 6.2% 5.9% 5.6% 4.9% 4.8%
6.6%6.4%
5.7% 5.1% 5.0% 4.9% 4.5% 4.4% 4.2% 4.1% 4.0%
0%
20%
40%
60%
80%
100%
2004 2005 2006 2007 2008 2009 2010 2011 2012 2013 2014
Channel 5
Channel 4(incl S4C -2009)ITV
BBC Two
BBC One
73.8% 70.4% 66.7% 63.5% 60.5% 57.8% 55.4% 53.6% 52.1% 51.1% 51.2%
193

Figure 2.51 Main five PSB channels’ audience shares, by platform
Source: BARB, individuals 4+ in platform homes, based on share %. Note: A new BARB panel was introduced in 2010. As a result, pre- and post-panel change data must be compared with caution. Note: Following digital switchover in Wales in 2010 S4C ceased to carry Channel 4 content. S4C is therefore included in the Channel 4 figure in and prior to 2009 but not from 2010 onwards. S4C 2014 channel share = 0.1%. The main five PSB channels include viewing to their HD channel variants but exclude viewing to their +1 channels.
Each of the main five PSB channels gained a higher share in digital terrestrial homes, except Channel 4
Figure 2.52 compares the audience share in 2014 for each of the main five PSB channels and the remaining ‘other’ channels in digital terrestrial, digital cable and digital satellite homes. The chart shows that the share of each of the main five PSB channels, except Channel 4, was highest on the digital terrestrial platform. Channel 4 gained a higher audience share on digital cable (5.2% vs. 4.9% on digital terrestrial and 4.3% on digital satellite).
Collectively, the main five PSB channels accounted for 54.3% of audience share on the digital terrestrial platform, compared to 51.1% on digital cable and 45.9% on digital satellite. The greater choice of ‘other’ subscription channels in digital cable and satellite homes is likely to explain why their combined share (48.9% and 54.1% respectively) was higher than in digital terrestrial homes (45.7%).
0%
20%
40%
60%
80%
100%
Dec04
Dec05
Dec06
Dec07
Dec08
Dec09
Dec10
Dec11
Dec12
Dec13
Dec14
Digitalterrestrialhomes
All homes
Cable orsatellitehomes
Audience share
194
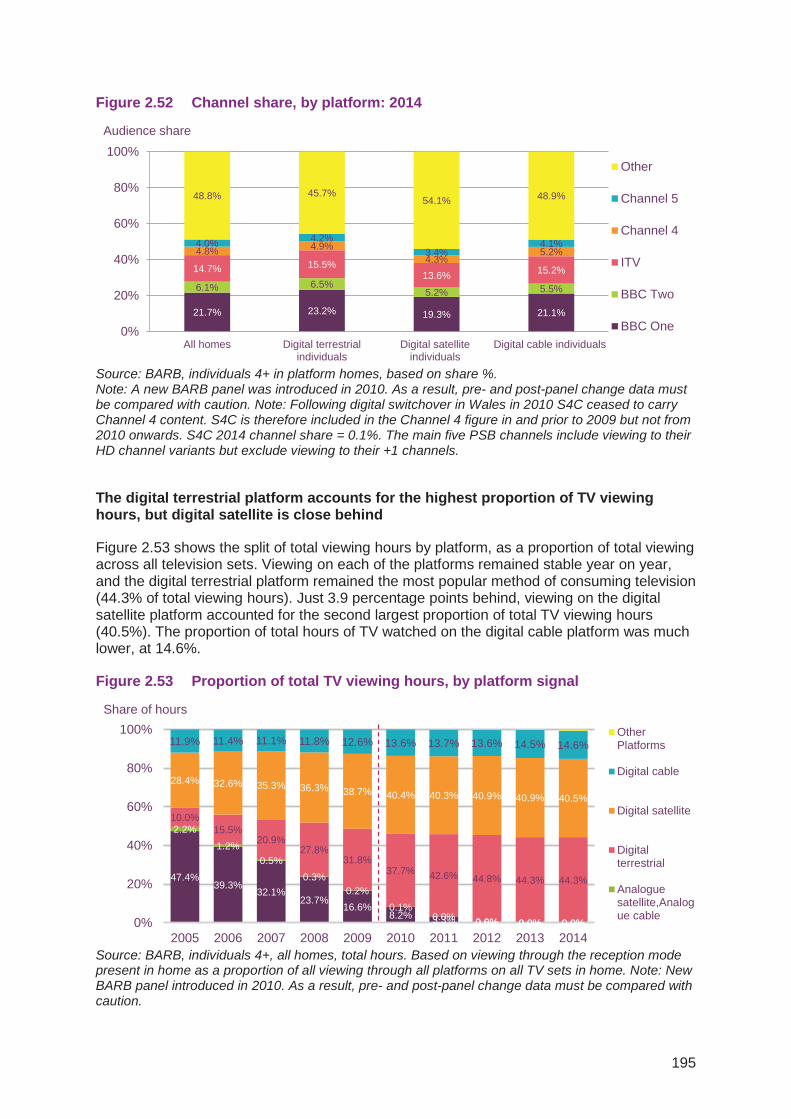
Figure 2.52 Channel share, by platform: 2014
Source: BARB, individuals 4+ in platform homes, based on share %. Note: A new BARB panel was introduced in 2010. As a result, pre- and post-panel change data must be compared with caution. Note: Following digital switchover in Wales in 2010 S4C ceased to carry Channel 4 content. S4C is therefore included in the Channel 4 figure in and prior to 2009 but not from 2010 onwards. S4C 2014 channel share = 0.1%. The main five PSB channels include viewing to their HD channel variants but exclude viewing to their +1 channels.
The digital terrestrial platform accounts for the highest proportion of TV viewing hours, but digital satellite is close behind
Figure 2.53 shows the split of total viewing hours by platform, as a proportion of total viewing across all television sets. Viewing on each of the platforms remained stable year on year, and the digital terrestrial platform remained the most popular method of consuming television (44.3% of total viewing hours). Just 3.9 percentage points behind, viewing on the digital satellite platform accounted for the second largest proportion of total TV viewing hours (40.5%). The proportion of total hours of TV watched on the digital cable platform was much lower, at 14.6%.
Figure 2.53 Proportion of total TV viewing hours, by platform signal
Source: BARB, individuals 4+, all homes, total hours. Based on viewing through the reception mode present in home as a proportion of all viewing through all platforms on all TV sets in home. Note: New BARB panel introduced in 2010. As a result, pre- and post-panel change data must be compared with caution.
Audience share
21.7% 23.2% 19.3% 21.1%
6.1% 6.5%5.2% 5.5%
14.7% 15.5%13.6% 15.2%
4.8% 4.9%4.3%
5.2%4.0% 4.2%
3.4%4.1%
48.8% 45.7%54.1% 48.9%
0%
20%
40%
60%
80%
100%
All homes Digital terrestrialindividuals
Digital satelliteindividuals
Digital cable individuals
Other
Channel 5
Channel 4
ITV
BBC Two
BBC One
Share of hours
47.4%39.3%
32.1%23.7%
16.6%8.2% 3.3% 0.6% 0.0% 0.0%
2.2%1.2%
0.5%0.3%
0.2%0.1%
0.0% 0.0% 0.0% 0.0%
10.0%15.5%
20.9%27.8%
31.8%37.7% 42.6% 44.8% 44.3% 44.3%
28.4% 32.6% 35.3% 36.3% 38.7% 40.4% 40.3% 40.9% 40.9% 40.5%
11.9% 11.4% 11.1% 11.8% 12.6% 13.6% 13.7% 13.6% 14.5% 14.6%
0%
20%
40%
60%
80%
100%
2005 2006 2007 2008 2009 2010 2011 2012 2013 2014
OtherPlatforms
Digital cable
Digital satellite
Digitalterrestrial
Analoguesatellite,Analogue cable
195

Over half of all viewing hours to the main five PSB channels combined are on digital terrestrial sets
In 2014, the digital terrestrial platform accounted for more than half of all viewing hours to the main PSB channels. This figure has fallen since 2013 (52.2% in 2013 vs. 50.7% in 2014) as the proportion of viewing hours on the digital satellite platform (+0.7pp) and the digital cable platform (+0.6pp) have grown.
Figure 2.54 Proportion of main five PSB channels’ viewing hours, by platform signal
Source: BARB, individuals 4+, total hours. Based on viewing through the reception mode present in home as a proportion of all viewing through all platforms through all TV sets in home. Note: New BARB panel introduced in 2010. As a result, pre- and post-panel change data must be compared with caution.
The main five PSBs and their portfolio channels together attracted 71.9% of total viewing in multichannel homes
The following charts and analysis are based on multichannel homes in order to capture long-term viewing trends spanning the analysis period up to the completion of digital switchover in October 2012 and for 2013 and 2014. 2013 and 2014 data reflect viewing from homes with 100% digital reception.
Since 2004 the share of the portfolio channels has increased from 7.6% to 20.7%, offsetting some of the decline in share of viewing to the main five PSB channels. Taking the main five PSBs and their portfolio channels together, their combined family share in multichannel homes has increased from 65.1% in 2004 to 71.9% in 2014. The share of viewing to all ‘other’ digital channels has fallen from 34.9% share to 28.1% share in 2014, although, year on year, the ‘other’ channels have collectively increased their share by 0.5 percentage points.
67.2%58.6%
50.3%39.0%
28.4%14.6%
6.0% 1.1% 0.0% 0.0%
1.4%0.8%
0.3%
0.1%
0.0%
0.1%0.0%
0.0% 0.0% 0.0%
8.6%13.7%
19.3%27.4%
33.9%42.0%
49.4% 53.1% 52.2% 50.7%
15.6% 19.5% 22.6% 25.0% 28.3%31.5% 32.4% 33.1% 33.7% 34.4%
7.2% 7.3% 7.5% 8.5% 9.2% 11.8% 12.2% 12.6% 14.0% 14.6%0.0% 0.0% 0.0% 0.0% 0.0% 0.0% 0.1% 0.1% 0.2% 0.3%
0%
20%
40%
60%
80%
100%
2005 2006 2007 2008 2009 2010 2011 2012 2013 2014
Other Platforms
Digital cable
Digital satellite
Digital terrestrial
Analogue cableand satellite
Analogueterrestrial
Share of hours
196

Figure 2.55 Main five PSB, PSB portfolio, and other channels’ shares in multichannel homes
Source: BARB. 2004-2009: individuals 4+, multichannel network. 2010-2012: Individuals in multichannel homes, Network. 2013+: individuals 4+, Network. Following digital switchover in 2012, from 2013 onwards all homes are multichannel homes. Note: A new BARB panel was introduced in 2010. As a result, pre- and post-panel change data must be compared with caution. The main five PSB channels include viewing to their HD channel variants but exclude viewing to their +1 channels.
The BBC channels combined have the largest share of viewing in multichannel homes
Driven by the growing contribution of their portfolio channels, all of the PSB broadcasters’ families of channels have increased their overall share of viewing since 2004. The BBC family of channels had the largest share of viewing in 2014, at 33.1%, up from 29.5% in 2004, and from 32.4% in 2013. ITV followed, with over a fifth (22.0%) of viewing share, an increase on 22.0% in 2004 but a decrease since 2013 (23.0%).
57.5% 57.7% 57.5% 56.7% 56.0% 54.8% 53.9% 53.1% 52.0% 51.1% 51.2%
7.6% 9.4% 11.6% 13.9% 15.7% 16.7% 18.6% 20.4% 21.3% 21.4% 20.7%
34.9% 32.9% 30.9% 29.4% 28.3% 28.5% 27.5% 26.5% 26.6% 27.6% 28.1%
0%
20%
40%
60%
80%
100%
2004 2005 2006 2007 2008 2009 2010 2011 2012 2013 2014
Others
PSB portfoliochannels
Main five PSBchannels
Audience share
197
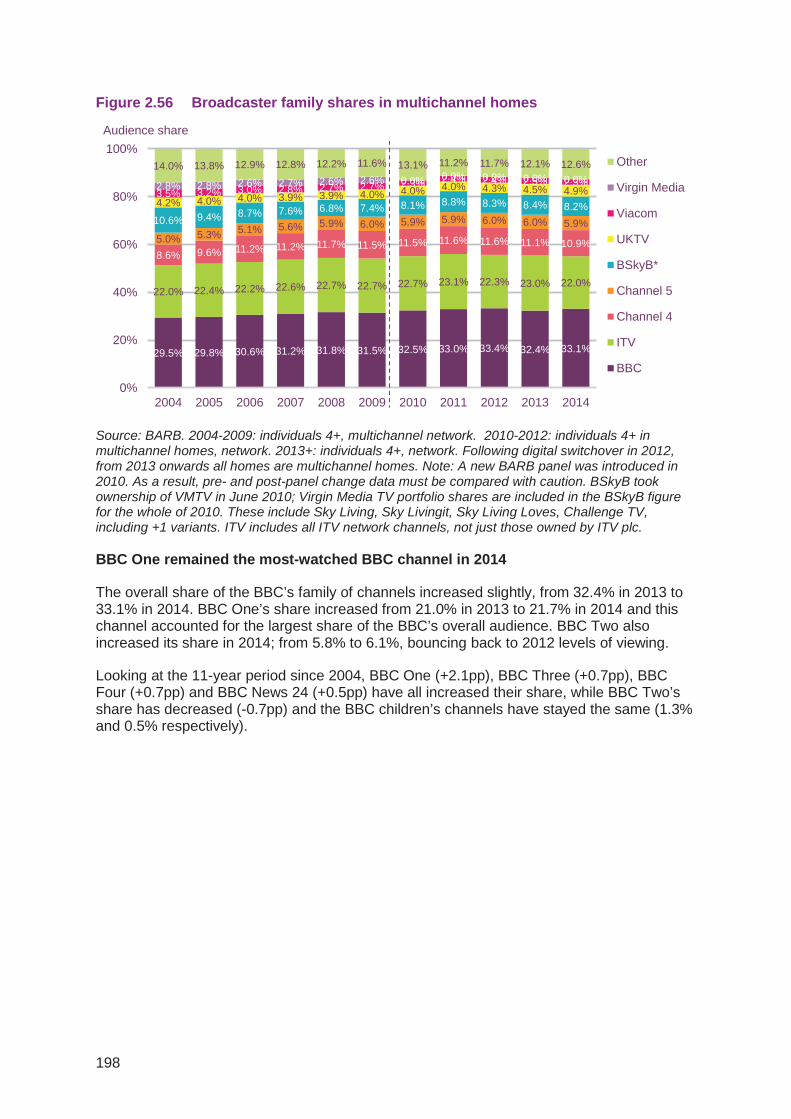
Figure 2.56 Broadcaster family shares in multichannel homes
Source: BARB. 2004-2009: individuals 4+, multichannel network. 2010-2012: individuals 4+ in multichannel homes, network. 2013+: individuals 4+, network. Following digital switchover in 2012, from 2013 onwards all homes are multichannel homes. Note: A new BARB panel was introduced in 2010. As a result, pre- and post-panel change data must be compared with caution. BSkyB took ownership of VMTV in June 2010; Virgin Media TV portfolio shares are included in the BSkyB figure for the whole of 2010. These include Sky Living, Sky Livingit, Sky Living Loves, Challenge TV, including +1 variants. ITV includes all ITV network channels, not just those owned by ITV plc.
BBC One remained the most-watched BBC channel in 2014
The overall share of the BBC’s family of channels increased slightly, from 32.4% in 2013 to 33.1% in 2014. BBC One’s share increased from 21.0% in 2013 to 21.7% in 2014 and this channel accounted for the largest share of the BBC’s overall audience. BBC Two also increased its share in 2014; from 5.8% to 6.1%, bouncing back to 2012 levels of viewing.
Looking at the 11-year period since 2004, BBC One (+2.1pp), BBC Three (+0.7pp), BBC Four (+0.7pp) and BBC News 24 (+0.5pp) have all increased their share, while BBC Two’s share has decreased (-0.7pp) and the BBC children’s channels have stayed the same (1.3% and 0.5% respectively).
29.5% 29.8% 30.6% 31.2% 31.8% 31.5% 32.5% 33.0% 33.4% 32.4% 33.1%
22.0% 22.4% 22.2% 22.6% 22.7% 22.7% 22.7% 23.1% 22.3% 23.0% 22.0%
8.6% 9.6% 11.2% 11.2% 11.7% 11.5% 11.5% 11.6% 11.6% 11.1% 10.9%5.0% 5.3% 5.1% 5.6% 5.9% 6.0% 5.9% 5.9% 6.0% 6.0% 5.9%10.6% 9.4% 8.7% 7.6% 6.8% 7.4% 8.1% 8.8% 8.3% 8.4% 8.2%4.2% 4.0% 4.0% 3.9% 3.9% 4.0% 4.0% 4.0% 4.3% 4.5% 4.9%3.5% 3.2% 3.0% 2.8% 2.7% 2.7% 2.3% 2.4% 2.4% 2.5% 2.3%2.8% 2.8% 2.6% 2.7% 2.6% 2.6% 0.0% 0.0% 0.0% 0.0% 0.0%14.0% 13.8% 12.9% 12.8% 12.2% 11.6% 13.1% 11.2% 11.7% 12.1% 12.6%
0%
20%
40%
60%
80%
100%
2004 2005 2006 2007 2008 2009 2010 2011 2012 2013 2014
Other
Virgin Media
Viacom
UKTV
BSkyB*
Channel 5
Channel 4
ITV
BBC
Audience share
198

Figure 2.57 BBC family shares in multichannel homes
Source: BARB. 2004-2009: individuals 4+, multichannel network. 2010-2012: individuals 4+ in multichannel homes, network. 2013+: individuals 4+, network. Following digital switchover in 2012, from 2013 onwards all homes are multichannel homes. Source: BARB. Note: ‘Other BBC’ includes BBC Parliament, BBC red button channels, BBC Olympics channels in 2012, BBC Choice, BBC HD and BBC Knowledge. The 24 BBC Olympics channels accounted for 0.21% share in 2012. A new BARB panel was introduced in 2010. As a result, pre- and post-panel change data must be compared with caution. HD and SD viewing included.
Over a fifth (22.0%) of viewing was to ITV channels in 2014
While ITV’s combined share for its family of channels has increased since 2004, viewing share fell year on year by one percentage point, and individual channel contributions have varied over time. With the exception of ITV Encore and ITVBe which both launched in 201464, ITV4 was the only ITV channel to increase its share in 2014 (by +0.04 percentage points). ITV’s main channel’s viewing share decreased the most, falling 0.6 percentage points to 15.6%, followed by ITV2 which fell by 0.3 percentage points.
64 ITV Encore launched on 9 June 2014 and is exclusive to Sky’s satellite platform as well as Sky+ HD, Sky Go, Now TV and SkyStore. ITVBe launched on 8 October 2014 and is available free-to-air on all major broadcasting platforms.
19.5% 19.3% 20.0% 19.9% 20.4% 20.0% 20.2% 20.5% 21.3% 21.0% 21.7%
6.7% 6.8% 6.9% 7.1% 7.0% 6.9% 6.6% 6.5% 6.1% 5.8% 6.1%0.7% 0.9% 1.0% 1.1% 1.2% 1.3% 1.4% 1.5% 1.7% 1.5% 1.4%0.6% 0.6%
0.6% 0.8% 0.8% 0.8% 1.1% 1.2% 1.0% 1.1% 1.0%1.3% 1.3% 1.2% 1.3% 1.3% 1.3% 1.3% 1.3% 1.2% 1.3% 1.3%
0%
5%
10%
15%
20%
25%
30%
35%
2004 2005 2006 2007 2008 2009 2010 2011 2012 2013 2014
Other BBC
CBeebies
CBBC
BBC News 24
BBC Four
BBC Three
BBC Two
BBC One
32.5% 33.0% 33.4% 32.4% 33.1%29.5% 29.8% 30.6% 31.2%
Audience share 31.8% 31.5%
199

Figure 2.58 ITV family shares in multichannel homes
Source: BARB. 2004-2009: individuals 4+, multichannel network. 2010-2012: individuals 4+ in multichannel homes, network. 2013+: individuals 4+, network. Following digital switchover in 2012, from 2013 onwards all homes are multichannel homes. Note: ITV, ITV2, ITV3 and ITV4 include their +1 services. HD variants are included with all channels where applicable. ‘Other’ includes (when relevant) ITV Play, ITV News, Men & Motors and Plus. ITV Encore and +1 commenced reporting 09.06.14, ITVBe started reporting 08.10.14 and ITVBe+1 on 19.11.14. 14 Note: A new BARB panel was introduced in 2010. As a result, pre- and post-panel change data must be compared with caution.
Channel 4’s family of channels gained a 10.9% share in 2014
The overall share of the Channel 4 family of channels in multichannel homes has increased from 8.6% in 2004 to 10.9% in 2014, peaking in 2008 at 11.7%. Since 2004, the main channel has accounted for the largest share of viewing, although after peaking at 8.2% in 2006 its share has declined each year. In 2014, the flagship channel’s share was 4.8% (5.6% with the inclusion of Channel 4 +1). The total share65 for E4, Film4 and More4 made up most (4.7%) of the remaining 5.3% share of the Channel 4 family.
E4 was the only channel in the Channel 4 family to increase its year-on-year share of viewing, up by 0.1 percentage points. Between 2013 and 2014, Channel 4’s main channel’s total share66 declined, while the remaining channels’ stayed the same. This resulted in a 0.2 percentage point fall in the overall share for the Channel 4 suite of channels.
65 including +1 variants 66 Channel 4 and Channel 4 +1
18.8% 18.4% 17.5% 17.6% 17.2% 16.9% 16.6% 16.5% 15.7% 16.2% 15.6%
2.0% 2.4% 2.3% 2.6% 2.4% 2.6% 2.6% 2.7% 2.7% 2.8% 2.4%
1.2% 1.4% 1.4% 1.6% 1.8% 2.2% 2.4% 2.5% 2.6%2.3%
0.5% 0.6% 1.0% 1.1% 1.0% 1.1% 1.1% 1.1%1.2%
0%
5%
10%
15%
20%
25%
30%
35%
2004 2005 2006 2007 2008 2009 2010 2011 2012 2013 2014
Other ITV
ITVBe
ITV Encore
CITV
ITV4
ITV3
ITV2
ITV
22.0% 22.4% 22.2% 22.6% 22.7%Audience share
22.7% 23.1% 22.3%22.7% 23.0% 22.0%
200

Figure 2.59 Channel 4 family shares in multichannel homes
Source: BARB. 2004-2009: individuals 4+, multichannel network. 2010-2012: individuals 4+ in multichannel homes, network. 2013+: individuals 4+, network. Following digital switchover in 2012, from 2013 onwards all homes are multichannel homes. Note: A new BARB panel was introduced in 2010. As a result, pre- and post-panel change data must be compared with caution. E4, More4 and Film 4 respective +1 channel shares are included. 4seven launched 4 July 2012. Note: Following digital switchover in Wales in 2010 S4C ceased to carry Channel 4 content. S4C is therefore included in the Channel 4 figure in and prior to 2009 but not from 2010 onwards. S4C 2014 channel share = 0.1%. HD and SD viewing included.
Channel 5 share remains stable at 4.4%
Like the other PSB broadcasters, the addition of Channel 5’s digital channels has helped increase its overall share from 5.0% in 2004 to 5.9% in 2014. Nonetheless, the main channel’s share has declined since 2004, from 5.0% to 4.4%, while its year-on-year share has remained stable. Following initial growth between 2006 and 2009, 5*’ and 5 USA’s shares have shown resilience, consistently achieving a 0.5% and a 1.0% share respectively. On 4 February 2014, Channel 5+24 was launched, and in 2014 its share was 0.1%.
7.3% 7.9% 8.2% 7.4% 6.8% 6.4% 6.1% 5.9% 5.6% 5.0% 4.8%
0.8% 0.8% 0.8% 0.9% 0.9%0.9% 0.8%
1.2%1.6%
1.9%1.8% 1.8% 1.8% 1.9% 1.8% 1.8%
1.9% 2.0%
0.5% 0.9% 1.0% 1.0% 1.2% 1.4% 1.5%1.5% 1.5%
0.6% 0.8% 1.0% 1.2% 1.1% 1.2% 1.2%1.2% 1.2%
0%
2%
4%
6%
8%
10%
12%
14%
2004 2005 2006 2007 2008 2009 2010 2011 2012 2013 2014
4seven
4Music
More4 Total
Film4 Total
E4 Total
Channel 4 +1
Channel4 (inclS4C - 2009)
8.6% 9.6% 11.2% 11.2% 11.5%11.7%Audience share
11.5% 11.6% 11.5% 11.1% 10.9%
201
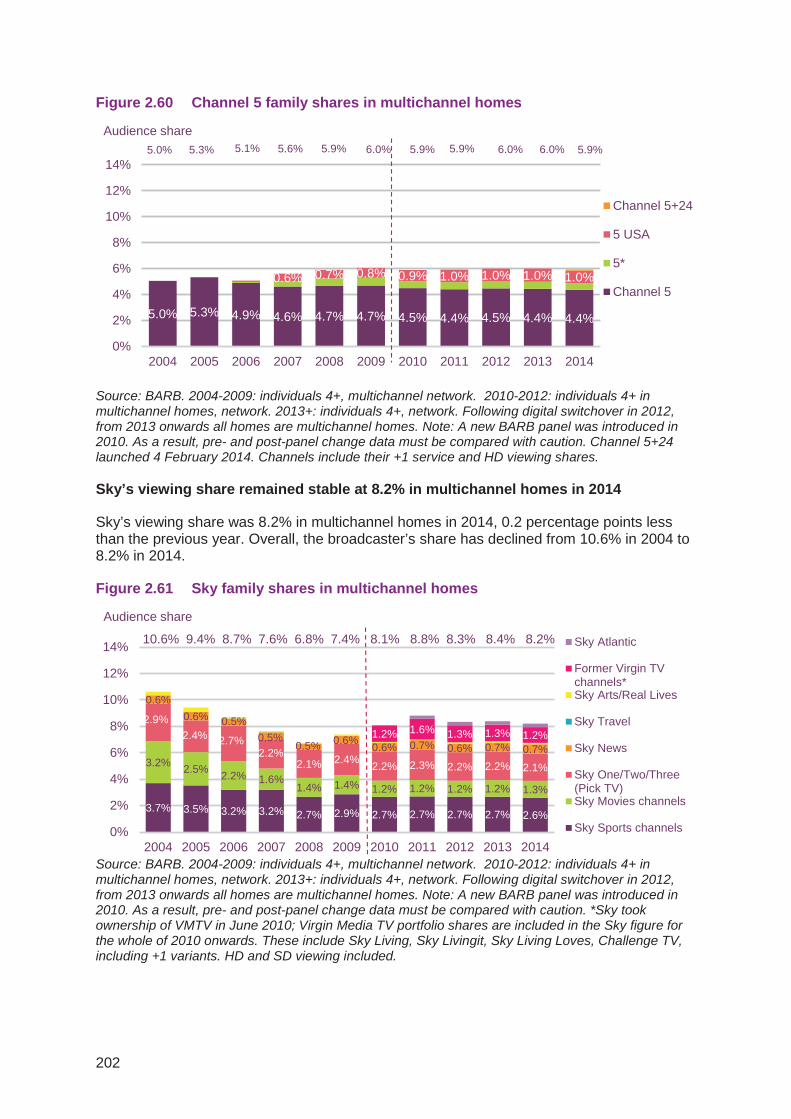
Figure 2.60 Channel 5 family shares in multichannel homes
Source: BARB. 2004-2009: individuals 4+, multichannel network. 2010-2012: individuals 4+ in multichannel homes, network. 2013+: individuals 4+, network. Following digital switchover in 2012, from 2013 onwards all homes are multichannel homes. Note: A new BARB panel was introduced in 2010. As a result, pre- and post-panel change data must be compared with caution. Channel 5+24 launched 4 February 2014. Channels include their +1 service and HD viewing shares.
Sky’s viewing share remained stable at 8.2% in multichannel homes in 2014
Sky’s viewing share was 8.2% in multichannel homes in 2014, 0.2 percentage points less than the previous year. Overall, the broadcaster’s share has declined from 10.6% in 2004 to 8.2% in 2014.
Figure 2.61 Sky family shares in multichannel homes
Source: BARB. 2004-2009: individuals 4+, multichannel network. 2010-2012: individuals 4+ in multichannel homes, network. 2013+: individuals 4+, network. Following digital switchover in 2012, from 2013 onwards all homes are multichannel homes. Note: A new BARB panel was introduced in 2010. As a result, pre- and post-panel change data must be compared with caution. *Sky took ownership of VMTV in June 2010; Virgin Media TV portfolio shares are included in the Sky figure for the whole of 2010 onwards. These include Sky Living, Sky Livingit, Sky Living Loves, Challenge TV, including +1 variants. HD and SD viewing included.
Audience share
5.0% 5.3% 4.9% 4.6% 4.7% 4.7% 4.5% 4.4% 4.5% 4.4% 4.4%
0.6% 0.7% 0.8% 0.9% 1.0% 1.0% 1.0% 1.0%
0%
2%
4%
6%
8%
10%
12%
14%
2004 2005 2006 2007 2008 2009 2010 2011 2012 2013 2014
Channel 5+24
5 USA
5*
Channel 5
5.3% 5.1% 5.6%5.0% 5.9% 6.0% 5.9%5.9% 5.9% 6.0% 6.0%
Audience share
3.7% 3.5% 3.2% 3.2% 2.7% 2.9% 2.7% 2.7% 2.7% 2.7% 2.6%
3.2% 2.5% 2.2% 1.6%1.4% 1.4% 1.2% 1.2% 1.2% 1.2% 1.3%
2.9%2.4% 2.7%
2.2%2.1% 2.4% 2.2% 2.3% 2.2% 2.2% 2.1%
0.6%0.6% 0.5%
0.5%0.5% 0.6% 0.6% 0.7% 0.6% 0.7% 0.7%
1.2% 1.6% 1.3% 1.3% 1.2%
0%
2%
4%
6%
8%
10%
12%
14%
2004 2005 2006 2007 2008 2009 2010 2011 2012 2013 2014
Sky Atlantic
Former Virgin TVchannels*Sky Arts/Real Lives
Sky Travel
Sky News
Sky One/Two/Three(Pick TV)Sky Movies channels
Sky Sports channels
10.6% 9.4% 8.7% 7.6% 6.8% 7.4% 8.1% 8.8% 8.3% 8.4% 8.2%
202

UKTV’s aggregate share in multichannel homes continues to increase
While the performance of Dave, G.O.L.D., Watch and Yesterday are key to the UKTV family maintaining its share, the increase between 2013 and 2014 was driven by Drama. Since its launch in mid-2013, Drama’s share has increased to 0.7%. Dave contributed the largest proportion to the UKTV total share at 1.3%, followed by Yesterday (0.7), G.O.L.D. (0.5%) and Watch (0.5%). The only other channel to increase its share in 2014 was Really, up by 0.1 percentage point.
Figure 2.62 UKTV family shares in multichannel homes
Source: BARB. 2004-2009: individuals 4+, multichannel network. 2010-2012: individuals 4+ in multichannel homes, network. 2013+: individuals 4+, network. Following digital switchover in 2012, from 2013 onwards all homes are multichannel homes. Note: In 2008 figures, new channel names and shares have been matched to old channels. Dave went live in Oct 2007. Drama launched in July 2013 and is included in ‘Other’ Note: A new BARB panel was introduced in 2010. As a result, pre- and post-panel change data must be compared with caution. HD and SD viewing included.
The main five PSB channels remain the top five most-viewed channels
The main five PSBs continued to occupy the top five positions for the most-viewed channels, with no change to last year’s order. The main five PSB channels and their families of channels made up 17 of the top 20, with Dave, Sky Sports 1 and Sky 1 comprising the other three. Of the top ten, the top seven channels remained the same. Both E4 and CBeebies climbed the ranking scale (from 9th to 8th and from 11th to 10th respectively) between 2013 and 2014, while BBC Three and Film4 slipped down the rankings (from 8th to 9th and from 10th to 12th respectively). ITV+1 was the only +1 channel variant in the top 20, rising up the ranking from 21st most-viewed channel in 2013 to 20th in 2014.
Audience share
1.9% 1.6% 1.4% 1.2% 0.9% 0.7% 0.7% 0.6% 0.6% 0.5% 0.5%
0.0% 0.0% 0.0% 0.0% 0.1% 0.5% 0.5% 0.5% 0.5% 0.5% 0.5%
0.8%0.6% 0.4% 0.3% 0.3% 0.2% 0.2% 0.1% 0.1% 0.1% 0.1%
0.4%0.4% 0.6% 0.6% 0.4% 0.4% 0.6% 0.8% 1.0% 0.8% 0.7%
0.3%0.3% 0.2% 0.2% 0.3% 0.2% 0.1% 0.1% 0.1% 0.1% 0.1%
0.2%0.2% 0.1% 0.1% 0.1% 0.1% 0.1% 0.1% 0.1% 0.1% 0.1%
0.1%0.2% 0.5% 0.6%
0.5% 0.4% 0.4% 0.4% 0.4% 0.4% 0.4%
0.2%0.2% 0.4% 0.7% 1.2% 1.3% 1.2% 1.1% 1.1% 1.3% 1.3%
0.0% 0.0% 0.0% 0.0% 0.3% 0.7%0.2% 0.4% 0.3% 0.2% 0.1% 0.1% 0.1% 0.0% 0.0% 0.0% 0.0%
0%
2%
4%
6%
8%
10%
12%
14%
2004 2005 2006 2007 2008 2009 2010 2011 2012 2013 2014
Other UKTV
Really
Drama
UKTV G2/Dave
Alibi
Eden
Good Food
Yesterday
Home
UKTV Watch
UKTV Gold/G.O.L.D
4.2% 4.0% 4.0% 3.9% 3.9% 4.0% 4.0% 4.0% 4.3% 4.5% 4.9%
203

Figure 2.63 Top channels by share, all homes: 2013-2014
Source: BARB, individuals 4+. Note: Includes viewing to HD variants but excludes viewing to channels’ +1 services.
Figure 2.64 plots the age and gender distribution of the 30 most-viewed channels in 2014. This is calculated relative to the TV population average (which includes children). Of the main five PSB channels, the audiences of BBC One, BBC Two and ITV were skewed slightly older than the average UK TV population, while Channel 5’s audience was in line with the average and Channel 4 skewed slightly younger.
ITV2 is the only channel in the ITV family of channels in the top 30 that skews younger than the average TV population. ITV, ITV3 and ITV4 all skew older than the average TV population, while ITV+1’s audience is in line with the average. And while ITV, ITV+1, ITV2 and ITV3 skew towards female, ITV4 skews strongly male, and all four of the Sky channels in the top 30 skew male (Sky Sports News, Sky Sports 1, Sky News and Sky 1).
As might be expected, the dedicated children’s channels, CBeebies and CBBC, attract a younger audience than the average viewer. E4, E4+1, BBC Three and Sky 1 also have a younger viewer profile.
Share Rank Share Rank
Channel 2014 2014 2013 Channel 2014 2014 2013
BBC One 21.7% 1 1 Dave 1.2% 11 12
ITV 14.7% 2 2 Film4 1.2% 12 10
BBC Two 6.1% 3 3 ITV4 1.1% 13 16
Channel 4 4.8% 4 4 BBC News 1.0% 14 15
Channel 5 4.0% 5 5 More4 1.0% 15 14
ITV3 2.1% 6 6 Sky Sports 1 1.0% 16 13
ITV2 1.9% 7 7 Sky 1 1.0% 17 18
E4 1.4% 8 9 BBC4 0.9% 18 19
BBC Three 1.4% 9 8 5 USA 0.9% 19 20
CBeebies 1.3% 10 11 ITV +1 0.8% 20 21
204

Figure 2.64 Age and gender profile of the 30 most-viewed channels, all homes: 2014
Source: BARB Note: The profile of a channel is calculated relative to the television population in all homes. Includes viewing to HD variants but excludes viewing to channels’ +1 services
2.3.3 Consumer attitudes towards television About half of adult viewers say that the quality of TV programmes has ‘stayed the same’ over the past 12 months
According to Ofcom’s 2014 Media Tracker research67, about half of adult television viewers felt that the quality of TV programmes had stayed the same, as opposed to getting any worse or better, over the past 12 months. When asked whether TV programmes had improved, stayed the same or got worse in the past 12 months, half (49%) of adult viewers said they had ‘stayed the same’. Three in ten (30%) felt programmes had ‘got worse’, while around half this number (16%) felt programmes had ‘improved’.
As shown in Figure 2.65, older adults aged 55-64 and aged 65 and over are more likely than all adults to feel that programmes have ‘got worse’ (40% and 52% vs. 30%), and those in C2DE socio-economic groups are more likely than those in ABC1 socio-economic groups (34% vs. 27%) to feel this.
67 For more information see: http://stakeholders.ofcom.org.uk/binaries/research/tv-research/attitudes-to-media/UK_audience_attitudes_towards_broadcast_media_2014.pdf
Younger (% under 45 years old)
CBeebies
ITV2
% Female
More 4
Channel 5
% Male
Older (% over 45 years old)
BBC1
Sky Sports News
Sky Sports 1
ITV4
Dave
BBC News Yesterday
BBC Four Sky News
Film4
Sky 1
E4+1
CBBC
BBC2
Pick TV
ITV35 USA
Channel 4+1
ITV
E4
Quest
BBC Three
Channel 4 5*ITV+1
205
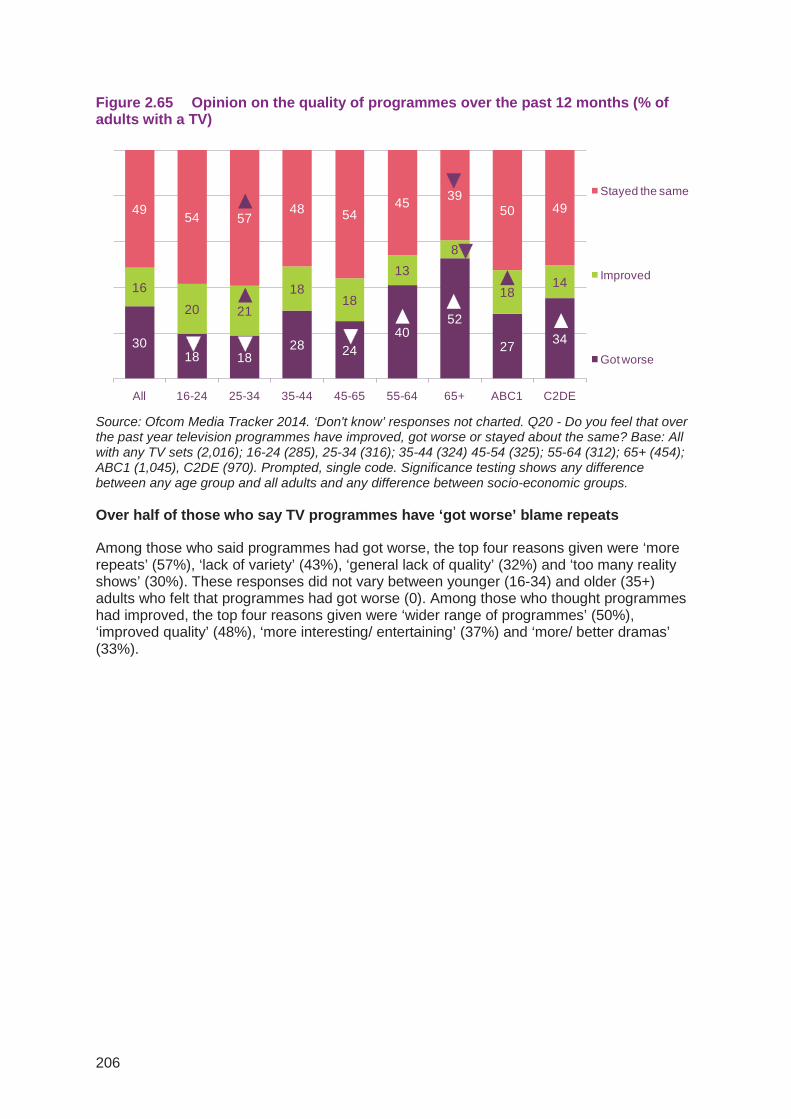
Figure 2.65 Opinion on the quality of programmes over the past 12 months (% of adults with a TV)
Source: Ofcom Media Tracker 2014. ‘Don't know’ responses not charted. Q20 - Do you feel that over the past year television programmes have improved, got worse or stayed about the same? Base: All with any TV sets (2,016); 16-24 (285), 25-34 (316); 35-44 (324) 45-54 (325); 55-64 (312); 65+ (454); ABC1 (1,045), C2DE (970). Prompted, single code. Significance testing shows any difference between any age group and all adults and any difference between socio-economic groups.
Over half of those who say TV programmes have ‘got worse’ blame repeats
Among those who said programmes had got worse, the top four reasons given were ‘more repeats’ (57%), ‘lack of variety’ (43%), ‘general lack of quality’ (32%) and ‘too many reality shows’ (30%). These responses did not vary between younger (16-34) and older (35+) adults who felt that programmes had got worse (0). Among those who thought programmes had improved, the top four reasons given were ‘wider range of programmes’ (50%), ‘improved quality’ (48%), ‘more interesting/ entertaining’ (37%) and ‘more/ better dramas’ (33%).
3018 18
28 2440
52
27 34
16
20 21
1818
138
1814
49 54 5748 54
45 3950 49
All 16-24 25-34 35-44 45-65 55-64 65+ ABC1 C2DE
Stayed the same
Improved
Got worse
206

Figure 2.66 Top reasons given for programmes getting worse in past 12 months
Source: Ofcom Media Tracker 2014. Q22 - In what ways do you think that the television programmes have got worse over the past year? Base: All saying programmes ‘got worse’ over past year (639); 16-34 (114); 35+ (525). Unprompted, multimode. Only top individual responses are charted. Significance testing shows any difference between age groups.
Four in ten adult viewers feel there is ‘too much’ violence and swearing on television
Figure 2.67 shows that around four in ten adult viewers felt there was ‘too much’ violence (43%) and swearing (40%) on television, while around three in ten (28%) felt there was ‘too much’ sex on television. Adults were most likely to feel there was ‘an acceptable amount’ of sex, violence or swearing on television, and very few felt there was ‘too little’ of each type of content.
Figure 2.67 Opinion on the amount of sex, violence and swearing on TV (% of adults with a TV)
Source: Ofcom Media Tracker 2014. Q46 - Do you think, in general, that there is too much, too little or an acceptable amount of each of the following on television: a) sex? b) violence? c) swearing? Base: All with any TV sets (2,016). Prompted, single code.
57
4332 30
12 12 10 9 8
5547
2619
6 5 9 6 8
58
4234 32
14 13 11 9 90%
10%
20%
30%
40%
50%
60%
70%
80%
Morerepeats
Lack ofvariety
Generallack ofquality
Too manyrealityshows
More badlanguage
Moreviolence
More sex Moreantisocialbehaviour
Other
Adults (16+) 16-34 35+
Base: All those who said programmes had got worse (30% of adults with a TV)
2843 40
57
47 52
23 113 7 6
Sex Violence Swearing
Don't know
Too little
An acceptable amount
Too much
207


