24
117 The International Communications Market 2016 4 4 TV and audio-visual

117
The International Communications Market 2016
4
4 TV and audio-visual

118
Contents
4.1 TV and audio-visual: overview and key market developments 119
Overview 119
Subscriptions to video-on-demand services continue to grow 121
4.2 The TV and audio-visual industry 125
Revenues 125
The licence fee and public funding 130
4.3 The TV and audio-visual consumer 132
Digital TV take-up 132
IPTV services and take-up 135
Value-added services 135
Broadcast television viewing 138
Legacy terrestrial channels viewing 139
Domestic publicly-owned channels viewing 140

119
4.1 TV and audio-visual: overview and key market developments
Overview
Subscription revenues continued to make up over half of total TV revenue
Global TV revenues from broadcast advertising, channel subscription and public funding including licence fees reached £263bn in 2015. Subscription revenues continue to make up over half of total revenue, at £137bn. TV revenue per capita in the UK was £221 in 2015, the third highest of our comparator countries after Germany (£289) and the US (£351).
South Korea had the highest take-up of pay TV at 99%, compared to the UK which had one of the lowest of our comparator countries at 62%. Just over half of UK television homes received an HD service in 2015 (51%), putting the UK in tenth position among our 18 comparator countries.
Declines in viewing to broadcast TV occurred across many countries
The UK experienced a year-on-year decline in viewing to broadcast TV (-1.9%), with people watching an average of 3 hours 36 minutes of TV each day. Within the UK, time-shifted viewing contributed 29 minutes, or 13%, to total daily viewing. This figure, however, was not enough to counter-balance the overall decline in live viewing.
Many of our comparator countries also experienced a decline in viewing to broadcast TV. This decrease is likely to be partly driven by the increased availability and popularity of over-the-top services, such as Netflix and Amazon Prime Video.
The UK ranked third for online TV and video revenues
The UK ranked third for online TV and video as revenues grew across each of our comparator countries. Although still small relative to the overall TV market, online TV and video revenue in the UK was £1.35bn in 2015. Per capita, the UK generated £20.81 of online TV and video revenue, compared to the US at £29.03.
The UK had the third largest proportion of subscribers to Video on Demand services
Take-up of subscription Video on Demand services delivered via the open internet stood at 30% of UK television households in 2015, compared to 21% in 2014. Recently released films remained the most watched content on services such as Netflix and Amazon Prime Video, cited by 69% of UK subscribers, but original programming made by the service provider is gaining traction as 60% cited this as content they watch.

120
Figure 4.1 Key metrics: 2015
UK
FR
A
GE
R
ITA
US
A
JPN
AU
S
ES
P
NE
D
SW
E
PO
L
SG
P
KO
R
BR
A
RU
S
IND
CH
N
NG
A
TV revenue (£bn) 14.3 7.8 23.3 5.5 113 18.2 3.8 2.7 2.3 1.6 1.9 0.5 6.1 9.1 2.2 6.3 24.8 0.6
Revenue per cap (£) 221 121 289 92 351 144 160 58 133 164 49 95 121 44 16 5 18 3
from advertising 64 37 74 39 133 62 80 32 41 48 17 53 37 20 10 2 9 0.1
from subscription 99 52 86 34 218 53 52 22 72 81 30 43 77 23 5 3 9 3
from public funds 58 32 130 19 0 29 27 4 20 35 2 0 7 1 0 0 0 0
Online TV revenues (£m) 1,347 502 453 271 9,348 632 306 161 228 210 61 13 151 464 147 114 2613 0.06
Largest TV platform Dsat IPTV Dsat DTT Dcab Dcab DTT DTT Dcab DTT Dsat DTT IPTV Dsat Dsat Dsat Dcab Aterr
% of homes (main set) 47 41 44 71 42 56 64 67 47 25 49 36 34 49 39 42 50 53
DTV take-up (%) 100 95 73 100 97 100 100 100 89 75 87 98 79 71 70 78 87 47
Pay TV take-up (%) 62 76 56 32 84 75 35 30 99 82 82 62 99 31 69 90 71 16
OTT SVoD take-up (%TV hh)
30 7 16 6 67 4 19 7 16 35 6 No
data 7 6 No
data 1 4 No
data
DSO* date 2012 2011 2008 2012 2009 2012 2013 2010 2006 2007 2013 2017 2012 2018 2019 2018 2020 2017
TV viewing (min/day) 216 224 223 254 274 262 196 234 190 154 264 N/A 193 234 246 N/A 155 N/A
Sources: IHS / industry data / Ofcom. Notes: pay-TV take-up refers to the number of TV households that pay for a DTT, satellite, cable or IPTV subscription service. Notes: Online TV revenues refers to advertising, subscription, retail and rental on-demand revenue derived from online services delivering TV and video content. Pay-TV take-up refers to the number of TV households that pay for a DTT, satellite, cable or IPTV subscription service. OTT SVoD refers to subscription services that offer video-on-demand content (VoD) delivered via the internet, or services that offer live streaming to a selection of channels/content as well as VoD content. For the purposes of this table most figures have been rounded to the nearest whole number. *DSO = Digital switchover

121
Subscriptions to video-on-demand services continue to grow
The UK had the third largest proportion of subscribers to over-the-top video-on-demand (SVoD) services in 2015
There were 7.8 million subscribers to these types of services109 in the UK in 2015. This equates to 30% of UK television households, up 10 percentage points year-on-year.
Figure 4.2 Television households’ subscriptions to over-the-top VoD services: 2015
Source: Ampere Analysis. Data were unavailable for Russia and Singapore. Figures include subscriptions to services that offer video on demand, live streaming and catch-up services delivered over the internet, such as Netflix, Amazon, Hulu, iQIYI, Hollywood VIP, Youku Premium, Ditto TV, WWE, TVing and Now TV. *pp = percentage points
Six in ten UK respondents watched catch-up or on-demand TV or films on free-to-access services
Live TV or films on free-to-access channels, were the most-watched type of content across most comparator countries. However, in Japan ‘recorded TV or films’ was the most popular answer (at 58% of respondents) and in the UK ‘Catch-up or on-demand TV or films from free-to-access broadcaster services’ scored one percentage point above live viewing (61% and 60% respectively). The UK leads the way in the use of free-to-access broadcaster services such as the BBC iPlayer and All4 by some margin; the second highest result in this category was returned by Spain (42%).
109 Audio-visual over-the-top video on demand services, in this context, refers to subscription services that offer video-on-demand content (SVoD) delivered via the internet, or services that offer live
streaming to a selection of channels/content as well as VoD content. These services include Netflix, Amazon, Hulu, iQIYI, Hollywood VIP, Youku Premium, Ditto TV, WWE, TVing and Now TV among others. Not all services are universally available in all comparator countries.
67%
35%30%
19%16% 16%
7% 7% 7% 6% 6% 6% 4% 4%1%
USA SWE UK AUS GER NED ESP KOR FRA BRA POL ITA CHN JPN IND
Proportion of television homes (%)
YoY increase (pp*) 17 17 10 15 6 4 5 2 3 2 2 4 3 2 0.5
2015 subscriptions (m) 82.1 1.7 7.8 1.5 7.0 1.2 1.3 1.2 1.8 3.7 0.8 1.4 16.7 1.9 1.2

122
Figure 4.3 Types of content watched: 2016
Source: Ofcom consumer research, October 2016 Q.8a Which of the following types of content do you watch? Base: All respondents, UK=1000, FRA=1008, GER=1010, ITA=1032, USA=1016, JPN=1011, AUS=1007, ESP=1016, SWE=1000
Seven in ten SVoD users in the UK watch recently released films / movies
Taking a closer look at subscription VoD (SVoD) in the UK, 69% of those who subscribe to a VoD service claimed to watch recently released films/ movies. This was closely followed by programmes/ series made in the US, and programmes/ series made in the UK.
Recently released films/movies and back-catalogue films/movies were the most popular types of programme watched by individuals or families on subscription services across all our comparator countries. Original programmes, made by the service provider, were watched by more than half the respondents in English-speaking countries (and Germany). The proportion in non-English speaking countries was significantly lower. Italy and Japan were the only countries where respondents were more likely to choose programmes made in their own country than programmes made in the US.
60%
51%
44%
61%
76%
43%
36% 40%
72%
41% 47
%
40%
66%
46% 55
%
39%
55%
42%
41%
29%
54% 58%
31%
18%
62%
38% 43
%
36%
73%
44% 54
%
42%
67%
32% 42
%
34%
Live TV or films on free-to-accesschannels
Recorded TV or films Video content from other sites orproviders
Catch-up or on-demand TV or filmsfrom freeto-access broadcaster
services
Proportion of all respondents (%)33
%
21%
35%
33%
27%
20%
16%
14%
16%
19% 25
%
15%25
%
47%
23%
23%
44%
28%
46%
18%
14%
25%
11%
4%
26%
23% 27
%
12%
31%
42%
21%
10%
39%
23%
34%
8%
Live TV or films on paid for channels,including subscription channels and
pay-perview
Downloaded rented or purchasedvideo/ films
TV or films on subscription video-ondemand services
TV or films using video-on-demandservices through a Pay TV provider
UK FRA GER ITA USA JPN AUS ESP SWE

123
Figure 4.4 Types of programmes watched on SVoD services: 2016
Source: Ofcom consumer research October 2016 Q.8c Which of the following types of programmes do you or your family watch on <Netflix / Amazon Instant Video / Wuaki / Other subscription service>? Base: All respondents who use a VOD service, UK=359, FRA=168, GER=253, ITA=253, USA=482, JPN=118, AUS=293, ESP=236, SWE=321
Among users of SVoD services, more said that they would miss content from those services than live broadcast content
When asked which type of content they would miss most if they did not have access to it, 34% of UK respondents who have a SVoD service chose it, compared to 13% who chose live free-to-air television. Fifteen per cent in the UK chose catch-up services, more than double any other nation in our survey; perhaps driven by the popularity of the BBC iPlayer. SVoD services were the most popular choice in all countries in the survey.
Figure 4.5 Types of content that would be missed most 2016
Source: Ofcom consumer research, October 2016 Q.8b Which type of content would you miss the most if you did not have access to it?
69%
51% 59
%68%
37%
31%
75% 82
%
48%
74%
70%
28%
71%
40%
55%
55%
82%
17%
78%
50% 61
%75%
59%
45%
72%
58%
47%
Recently released films/ movies Back-catalogue films/ movies Original programmes made by the serviceprovider
61%
63%
25%40
%
61%
43%
61% 75
%
46%52
%
46%
43%
71%
71%
34%
61%
45%
29%
54% 68
%
47%60
% 71%
50%56
% 71%
51%
Programmes/ series made in your country Programmes/ series made in the US Programmes/ series made in other countries
UK FRA GER ITA USA JPN AUS ESP SWE
Proportion of respondents with a video-on-demand subscription (%)13
%
6% 7%
15%
24%
9% 8% 7%
15%
2%
7%
4%
15%
5% 7% 7%
14%
11%
8%
5%
21%
2%
21%
4%
16%
8%
5% 7%
13%
9% 8% 6%
16%
9%
4%
7%
Live TV or films on free-to-accesschannels
Live TV or films on paid for channels,including subscription channels and
pay-per-view
Recorded TV or films Catch-up or on-demand TV or filmsfrom free-to-access broadcaster
services
7%
34%
11%
3%3%
36%
6% 4%7%
44%
12%
2%
12%
32%
10%
8%
2%
43%
9%
4%1%
24%
10%
7%
3%
38%
13%
3%5%
30%
14%
10%
2%
39%
14%
2%
TV or films using video-on-demandservices through a Pay TV provider
TV or films on subscription video-on-demand services
Video content from other sites orproviders
Downloaded rented or purchased video/films
UK FRA GER ITA USA JPN AUS ESP SWE
Proportion of respondents with a video-on-demand subscription (%)

124
Base: All respondents who use a VOD service, UK=359, FRA=168, GER=253, ITA=253, USA=482, JPN=118, AUS=293, ESP=236, SWE=321
Almost three-quarters of UK respondents were satisfied with the amount of UK programmes available on their SVoD services
In the UK, US and France over seven in ten respondents with an SVoD service (such as Netflix or Amazon Prime Video) said they were satisfied with the amount of domestically produced content available on their service.
Less than half of the respondents in Germany were satisfied with the content available on their SVoD services that was produced in their country. The US was the only comparator country in which respondents were more likely to be ‘very satisfied’ with the domestically produced content than dissatisfied or neutral. This is unsurprising and reflects the fact that many of the high-profile original productions by these services are produced in the US, such as House of Cards on Netflix and Transparent on Amazon Prime Video.
Figure 4.6 Satisfaction with the amount of own country-produced content on SVoD: 2016
Source: Ofcom consumer research, October 2016 Q.8d How satisfied are you with the amount of programmes produced in your country that are available on the video-on-demand services you subscribe to? Base: All respondents who use a VOD service, UK=359, FRA=168, GER=253, ITA=253, USA=482, JPN=118, AUS=293, ESP=236, SWE=321
Proportion of respondents (%)
25%17% 14% 18%
42%
14% 13% 15% 13%
49%54%
33%
42%
35%
40% 43% 35% 42%
15% 22%
35%18%
11%
35%25% 34%
32%
8%5%
12% 16%8% 9%
16% 12% 10%
3% 1% 6% 5% 4% 2% 3% 4% 4%
UK FRA GER ITA USA JPN AUS ESP SWE
Very dissatisfied
Fairly dissatisfied
Neither satisfied nordissatisfied
Fairly satisfied
Very satisfied
74% 71% 47% 61% 76% 54% 56% 50% 54%Very or fairly
satisfied

125
4.2 The TV and audio-visual industry
Revenues
Global TV revenues were £263bn in 2015
Ofcom estimates that global TV revenue110 in 2015 reached £263bn. Subscription revenues made up just over half of the total included revenue in 2015, at £137bn. Global net advertising revenue (NAR) was £106bn.
Public funding from TV licence fees was £20bn; this has changed little over the past four years.
Figure 4.7 Global TV industry revenues, by source: 2011 - 2015
Source: Data derived from PwC Global entertainment and media outlook 2016-2020 @ www.pwc.com/outlook. Notes: Ofcom is responsible for all growth calculations displayed. Ofcom uses an exchange rate of $1.53 to the GBP in line with the IMF average for 2015. All figures expressed in nominal terms.
European TV revenues reached £59.3bn in 2015
Revenues from subscriptions, net advertising and public funds, across the UK and our 17 comparator countries, totalled £244bn in 2015. The revenue gap widened to over £14bn between the BRIC countries and Nigeria combined, and the Asia/Pacific countries, the two regions in our analysis with the lowest TV revenues. In the US, the country with the largest television revenues globally, revenues were made up of 99.9% subscription and advertising spend, with virtually no public funding.
110 Our analysis of global television revenues incorporates three components: net broadcast advertising revenue, public funding including licence fees, and television subscriptions. It excludes revenues generated from OTT services available via the open internet such as Netflix and Amazon Instant Video (see Figure 4.14 for online television revenues).
113.4 119.6 125.2 131.6 137.4
18.7 18.8 19.2 19.5 19.6
92.997.1
99.6104.7 105.9
225.0 235.5
243.9 255.8 262.9
2011 2012 2013 2014 2015
Annual revenue (£bn) YOY
CAGR
(4yr)
All 2.8% 4.0%
Advertising 1.2% 3.3%
Public TV
licence fees0.1% 1.2%
Subscriptions 4.4% 4.9%

126
Figure 4.8 Total TV industry revenues among comparator countries: 2011 - 2015
Source: IHS / industry data / Ofcom. Notes: Revenues include advertising, subscriptions and sources of public funding only, and not OTT services. BRIC is Brazil, Russia, India and China. All figures expressed in nominal terms. Europe includes UK, France, Germany, Italy, Spain, Sweden, Netherlands and Poland. Asia Pacific includes Japan, South Korea, Singapore and Australia.
UK television revenues were £14.3bn in 2015
UK television revenues (from advertising, subscriptions and public funding111) totalled £14.3bn in 2015.112 This is attributable to rising spend, both in advertising and subscriptions, and a small increase in public funding. Germany was Europe’s largest TV market in terms of monetary value in 2015, at £23.3bn. Like the UK, Germany benefits from substantial public funding of television services.
111 In the UK public funding is derived from the TV licence fee which is now paid by all viewers who watch live television or watch or download BBC programmes from the BBC iPlayer, regardless of the device they use. 112Revenue figures and other data may differ from those in the UK Communications Market Report 2016, as sources differ. In the CMR 2016, revenues are calculated from data supplied by UK broadcasters. In order to make various comparisons across nations, UK data in the ICMR 2016 are compiled and calculated in the same way as for other nations, by IHS Markit.
56.0 55.8 56.6 57.8 59.3
98.6 102.4106.8
111.4 113.1
25.2 26.1 27.0 28.1 28.6
27.532.8
35.740.6
43.0
2011 2012 2013 2014 2015
207 217 226 238 244
Total revenues (£bn)
USA
Europe
Asia
Pacific
BRIC &
Nigeria
TOTAL

127
Figure 4.9 TV industry revenues among European countries: 2011 - 2015
Source: IHS / industry data / Ofcom. Notes: Revenues include advertising, subscriptions and sources of public funding only. All figures expressed in nominal terms.
Over five years, the UK has increased all three of its major television revenue streams
The UK and Germany maintained their positions as the largest European TV markets, both experiencing growth in all three of the included revenue sources between 2010 and 2015. In the UK, subscription revenue continued to make up 45% of TV income in 2015.
Among our comparator countries, only Spain experienced a decline in TV revenues between 2010 and 2015, partly because state broadcaster TVE lost the right to show advertising, and due to cuts of 30% in public funding between 2010 and 2013.
Figure 4.10 TV revenues among selected comparator countries: 2010 and 2015
Source: IHS / industry data / Ofcom
13.1 12.9 13.4 13.8 14.3
7.3 7.4 7.5 7.6 7.8
20.821.3
21.922.7
23.3
6.4 5.9 5.6 5.5 5.5
3.0 2.7 2.6 2.6 2.7
1.4 1.5 1.5 1.5 1.6
2011 2012 2013 2014 2015
56.0 55.8 56.6 57.8
Total revenues (£bn)
59.3
GER
UK
FRA
ITA
ESP
NED
POL
SWE
TOTAL
1.0 1.1 1.3 1.1 2.1 2.2 3.9
2.5 4.0
2.0 3.3 2.5
4.8 1.9
6.4 5.7 6.7 4.9
6.9 4.9
12.5
6.3 1.1 1.2 2.1
2.0
3.7 3.6
3.7
3.6
10.4
10.0
-
-
1.5 1.8 1.9 1.9
2.3 3.1 1.9 1.5
2.3
1.2
2.4 2.5
4.2
2.8
4.2 3.4
7.8
7.5
6.0
5.4 12.3
7.1
2015201020152010201520102015201020152010201520102015201020152010201520102015201020152010
ESPAUSITAKORINDFRABRAUKJPNGERCHN
Subscriptions Public Funding Advertising
7058
43
36
20152010
USA
Revenues (£bn)

128
Note: The USA was the largest market by a considerable margin and is accommodated here using a different scale from the other comparator countries. All figures are nominal.
TV revenue per head in the UK was £221 in 2015
In 2015, TV revenue per head in the UK was £221, the third highest of our comparator countries after Germany (£289) and the US (£351). Breaking this down, the UK reported the second highest subscription revenue per head, at £99 per person per year. The US was the highest at £218. The UK’s public funding (via the licence fee) was £58 per person, the second highest of our comparator countries, but still less than half that of Germany (£130).
TV revenues per head for the BRIC countries and Nigeria remained lower than in most other comparator countries in 2015, with the exception of Brazil (£54).
Figure 4.11 TV revenue per capita, by revenue source: 2015
Source: IHS / industry data / Ofcom. Notes: Revenues include advertising, subscriptions and sources of public funding only; figures inside the bars represent industry revenue per capita by source (£GBP). All figures expressed in nominal terms.
Average pay-TV revenue per user stood at £384 in the UK
The UK was in third place on pay-TV ARPU among our comparator countries in 2015, following the US and Australia.
Between 2010 and 2015 most of our comparator countries increased their pay-TV ARPU113. However, there were decreases in Australia, the UK, France and Spain since 2010. These may be attributable to pricing competition, consumers downgrading their packages and increased take up of IPTV114 in France and Spain, where IPTV is now available bundled into low-cost triple-play services (see Figure 3.45).
113 Average revenue per user (ARPU) can provide insights into the relative performance of pay-TV operators by country. 114 Internet protocol television (IPTV) is the term used to describe the television platform that delivers channels to viewers using internet protocol (IP) technology over a broadband connection.
134
74 64 5680
6241 37 37 53 39 32 17 20 8.9 10.2
0.2 130
5840
2729
20 327 19
218 86
99
89 5253
72 5277 43 34
2230 23
351
289
221
184
159144
133121 121
95 92
5849 44
18 165 3.44
USA GER UK SWE AUS JPN NED FRA KOR SGP ITA ESP POL BRA CHN RUS IND NGA
Total
Subscription
Public funding
Advertising
Revenue per capita (£)
YoY change 2% 3% 4% 4% 0% 1% 1% 3% 7% -2% 0% 3% 2% 4% 5% -5% 14% 28%

129
Figure 4.12 Pay-TV ARPU by country: 2015
Source: IHS / industry data / Ofcom. Notes: ARPU is average revenue per pay-TV household, representing the average revenue generated per pay-TV subscriber. All figures expressed in nominal terms.
UK online TV and video revenue exceeded £1bn in 2015
In addition to the revenues discussed above, online TV and video revenue115 in the UK contributed £1.35bn, or a further 9%.116 Rapid growth was also evident in the US, the country with the largest revenue of this type among our comparator countries, where spend in 2015 was £9.3bn, adding a further 8% to that country’s television revenues.
UK revenues in 2015 were greater than those of France (£502m, or an additional 6%) and Germany (£453m, additional 2%) combined. The figure for UK revenue also remained well above that of Japan (£643m, additional 3%). In the UK, growth was driven predominantly by the increased popularity of services such as Netflix and Amazon Prime Video.
On a revenue-per-capita basis, the UK (£20.81) was second only to the US (£29.03) in annual revenues in 2015, reflecting the high take-up of OTT services in the US (Figure 4.2).
115 Online revenues are in addition to previously discussed revenues from advertising, subscriptions and public funding. 116 Short and long-form online TV and video revenue is made up of subscription fees and advertising revenue, as well as electronic sell-through retail and on-demand revenue from online services delivering TV and video content. Typically, in the UK it includes services such as catch-up TV, Netflix, Xbox Video, Hulu, Hulu Plus, iTunes and YouTube.
705
386 384
319
256 253 249217 209
183 174 164 155105 97
44 26 20
USA AUS UK GER ITA SGP BRA KOR SWE ESP JPN NED FRA POL NGA CHN IND RUS
ARPU (£)
Change since
2010 (£) 130 -95 -23 90 43 8 54 47 45 -64 29 26 -47 12 0 11 7 8

130
Figure 4.13 Online TV and video revenue for selected countries: 2011 – 2015
Source: IHS / industry data / Ofcom. Notes: Different scale used for USA due to larger size. “Online TV and video revenue” refers to advertising revenue and subscription revenue as well as retail and rental on-demand revenue derived from online services delivering TV and video content. Typically, it includes services such as catch-up TV services, Netflix, Xbox Video, Hulu and Hulu Plus, iTunes and YouTube, among others. All figures expressed in nominal terms.
Figure 4.14 Online TV and video revenue per head, selected countries: 2015
Source: IHS / industry data / Ofcom. Notes: ‘Online TV and video revenue’ refers to advertising revenue and subscription revenue as well as retail and rental on-demand revenue derived from online services delivering TV and video content. Typically, it includes services such as catch-up TV services, Netflix, Xbox Video, Hulu and Hulu Plus, iTunes and YouTube amongst others. All figures expressed in nominal terms.
The licence fee and public funding
Public funding via a licence fee is an important element of TV finance in eight of our comparator countries
259201
136261
1347
502 453
632
0
200
400
600
800
1,000
1,200
1,400
UK FRA GER JPN
2011 2012 2013 2014 2015
Online TV video revenue
2.7
9.3
0
1
2
3
4
5
6
7
8
9
10
USA
£bn£m
29.03
20.81
7.795.62 4.99
USA UK FRA GER JPN
Online TV and video revenue per capita (£)

131
At £145.50, the cost of the UK licence fee117 was the third highest among the comparator countries that had a licence fee, in 2015. The UK television licence fee last rose, by £3.00, in April 2010.
Figure 4.15 Cost of a TV licence fee: 2015
Source: IHS / industry data / Ofcom. All figures expressed in nominal terms. Note: Chart excludes countries where there is no licence fee: the USA, Australia, Spain, Netherlands, Brazil, Russia, India, China, and Nigeria. Singapore abolished TV licence fees in 2011
117 In the UK, public funding is derived from the TV licence fee, which is now paid by all viewers who watch live television or watch or download BBC programmes from the BBC iPlayer, regardless of the device they use.
171.91
152.44145.50
99.45
75.63 72.59
42.53
17.35
SWE GER UK FRA JPN ITA POL KOR
Change since
2010+ £10.86 - £4.18 + £3.00 + £12.34 - £8.10 - £6.53 + £9.98 -

132
4.3 The TV and audio-visual consumer
Digital TV take-up
The UK is one of five comparator countries where 100% of those with a TV set receive a digital service, having completed digital switchover in 2012. Between 2010 and 2015 the greatest increases in digital television on main television sets were reported in India (+51pp), Russia (+42pp) and South Korea (+30pp). In Europe, Germany has the lowest DTV take-up, possibly because strong publicly-funded channels remain available over analogue cable.
Figure 4.16 Take-up of digital television on main sets: 2010 and 2015
Source: IHS/ industry data/ Ofcom
Digital satellite is the most popular digital platform on main sets in UK households
At 36%, digital terrestrial TV (DTT) remains strong in the UK, although digital satellite leads the way at 41%. DTT continues to dominate the TV markets in Italy, Spain and Australia. With 56% and 50% share of main sets, digital cable is the most popular platform in Japan and China.
In recent years there has been a surge in take-up of IPTV in France and Spain (seeFigure 4.20) as the service is now offered as part of low-cost triple-play bundles. Other notable IPTV markets include South Korea (34% take-up on main sets) and the Netherlands (28%).
Proportion of TV households (%)
100% 100% 100% 100% 100% 98% 97% 95%89% 87% 87%
79% 78% 75% 73% 71% 70%
47%
UK AUS SGP USA FRA KOR ESP ITA NED CHN RUS IND BRA POL JPN SWE GER NGA
Change since
2010 (pp)7pp 4pp 2pp 9pp 2pp 26pp 9pp 7pp 21pp 24pp 25pp 30pp 51pp 1pp 21pp 23pp 42pp 5pp

133
Figure 4.17 TV platform take-up, main set: 2015
Source: IHS/industry data/ BARB Establishment Survey/TRP Research/Ofcom. Note: Digital satellite includes free-to-air as well as paid-for services. Data includes main TV sets only and is based on a proportion of TV homes. UK data is sourced from the BARB Establishment Survey/TRP Research, for Q4 2015. Based on main TV set in home (nominated by respondents) and from homes with a BARB working TV set. For TV sets with multiple platforms in the UK, a hierarchy based approach has been applied to determine the platform: DSAT beats DCAB, DCAB beats IPTV, and IPTV beats Freeview. Digital Terrestrial = Freeview, IPTV= BT or TalkTalk or YouView, Other = includes direct access to the internet such as via computer or games console or dongles such as Amazon Firestick and Google Chromecast. This accounts for 1% not shown in the chart above.
Take-up of digital services continues to grow
The proportion of digital TV households increased between 2014 and 2015 in 13 of our 18 comparator countries. The remaining five countries, of which the UK is one, are now 100% digital. The move to digital platforms, in all comparator countries, is predominantly at the expense of former analogue cable households. There has also been migration from analogue terrestrial households in countries that have yet to complete their digital switchover.
Looking at year-on-year trends for individual digital platforms, the number of UK digital terrestrial homes decreased by 1.8% in 2015, mainly to the benefit of digital satellite (+1.2%). The greatest move to digital occurred in Russia, India and China.
15%
5%
17%
42%
56%
10% 7%
47%
18% 19%
35%
23%
13%7%
36%
50%
5%
27%
3%
11%
25%13%
21%
24%
22%
9%
41%
34%
44%
27%
28%
30%
22%
8%
8%
16%
49%20%
49%
39%
42%
23%
34%
36%
15%
6%
71%
16%
6%
64%
67%
6% 25%
16%
36%
1% 10%
15%
13%
28%5% 4%
53%
7%
41%
6%11% 8% 4%
17%
28%
17%
3%
26%34%
9% 11%
UK FRA GER ITA USA JPN AUS ESP NED SWE POL SGP KOR BRA RUS IND CHN NGA
IPTV
Analogue Terrestrial
Digital Terrestrial
Analogue Satellite
Digital Satellite
Analogue Cable
Digital Cable
Proportion of TV homes (%)

134
Figure 4.18 Year-on-year changes in platform take-up, by country: 2014 - 2015
Source: IHS / industry data / Ofcom. Note: Figures represent percentage point increase across all TV homes.
More than six in ten TV households in the UK used a pay-TV service in 2015
Take-up of pay-TV in the UK in 2015 was 62%, eight percentage points higher than in 2010. Growth in the UK pay-TV market may have been driven in part by the IPTV platform offerings introduced by BT and TalkTalk. France had the largest increase in pay-TV households; a 30pp increase. The attraction of pay-TV in France may be that IPTV is available as part of even the lower-cost triple-play bundles. Italy had the largest fall in the number of pay-TV homes over the period.
Among our non-European comparator countries, the US was the only one in which pay-TV take-up fell; 2015 take-up at 84% was down slightly on 2010 (87%). The high take-up of OTT services in the US (see Figure 4.2) may be a factor in this. Growth continues across the BRIC countries: the average for 2015 was 72%, up from 55% in 2010. In South Korea 99% of TV homes had pay-TV in 2015.
Figure 4.19 Take-up of pay TV: 2015
UK FRA GER ITA USA JPN AUS ESP NED SWE POL SGP KOR BRA RUS IND CHN NGA
Digital Terrestrial -1.8% -1.2% 0.2% -0.5% 2.0% -1.9% -3.3% -3.5% -1.0% 1.0% 1.1% 2.1% -2.1% 2.3% -0.1% 0.0% 0.4% 3.5%
Digital Satellite 1.2% -0.3% 0.2% -0.2% -1.1% 0.4% 1.8% -3.4% -0.3% -0.6% -0.9% 0.0% 0.3% -2.1% 3.4% 0.4% -0.9% -0.4%
Digital Cable -0.2% 1.3% 1.3% 0.0% 0.5% 1.2% 0.1% 1.4% -0.3% 0.3% 1.4% -0.9% 0.8% 0.5% 0.5% 7.1% 3.8% 0.0%
IPTV 0.8% 0.3% 0.3% 0.7% -0.1% 0.3% 1.4% 5.7% 3.6% 0.6% 0.3% -0.1% 4.2% 0.2% 1.4% 0.0% 2.8% 0.0%
Total Digital 0.0% 0.0% 2.0% 0.0% 1.2% 0.0% 0.0% 0.1% 1.9% 1.3% 1.9% 1.1% 3.1% 0.8% 5.37% 7.5% 6.1% 3.1%
Analogue Cable 0.0% 0.0% -2.0% 0.0% -1.2% 0.0% 0.0% -0.1% -1.9% -1.3% -1.9% 0.0% -3.1% -0.1% -1.1% -7.5% -3.5% 0.0%
Analogue Satellite 0.0% 0.0% 0.0% 0.0% 0.0% 0.0% 0.0% 0.0% 0.0% 0.0% 0.0% 0.0% 0.0% 0.0% -0.13% 0.0% 0.0% 0.0%
Analogue Terrestrial 0.0% 0.0% 0.0% 0.0% 0.0% 0.0% 0.0% 0.0% 0.0% 0.0% 0.0% -1.1% 0.0% -0.6% -4.1% 0.0% -2.6% -3.1%
Total Analogue 0.0% 0.0% -2.0% 0.0% -1.2% 0.0% 0.0% -0.1% -1.9% -1.3% -1.9% -1.1% -3.1% -0.8% -5.37% -7.5% -6.1% -3.1%
99% 98%
90%84% 82% 82%
76% 75%71% 69%
62% 62%56%
35% 32% 31% 30%
16%
KOR NED IND USA POL SWE FRA JPN CHI RUS SGP UK GER AUS ITA BRA ESP NIG
Take-up (% of TV households)
Change since
2010 (pp)+11pp 0pp +16pp -3pp -1pp +2pp +30pp +14pp +16pp +22pp +5pp +8pp -1pp +7pp -11pp +14pp +5pp +13pp
Average 70%

135
Source: IHS/ industry data/ Ofcom
IPTV services and take-up
In 2015, internet protocol television (IPTV)118 continued to compete with other digital platform technologies, encouraged by the growth of triple-play bundled services in countries with high-bandwidth infrastructure. Indeed, in France and South Korea, IPTV was the most popular TV platform. Of the countries with 10% take-up or more, Spain experienced the strongest year-on-year growth (+53%). In the UK, 9% of homes now take IPTV on their main set, a 10.7% increase on the previous year. Figure 3.34 and Figure 3.37 in the Broadband Scorecard and Figure 4.20 below demonstrate the correlation between high availability of broadband services over 10Mbit/s, take-up of broadband services and the popularity of IPTV in some countries.119 For the purposes of this report, hybrid systems such as BT TV in the UK (i.e. those that provide television services through both an aerial and an IP connection) are considered as IPTV platforms.
Take-up of IPTV on main TV sets was at least 10% in eight of our 18 comparator countries in 2015.
Figure 4.20 Take-up of IPTV on main television sets: 2015
Source: IHS/ industry data/ Ofcom. Note: For the purposes of this report, hybrid systems such as BT TV in the UK (i.e. those that provide television services through both an aerial and an IP connection) are considered to be IPTV platforms.
Value-added services
HDTV120 is now available and accessed in over half of UK homes
Just over half of UK television homes received an HD service in 2015 (51%), putting the UK in tenth position among our 18 comparator countries. In the UK, almost all of those receiving cable services and almost half of those with satellite services were receiving HD. Satellite HD services were also common in Germany, Poland and Russia.
Cable HD services led the way in Italy, Spain, Netherlands, the US, Japan and China. HD over IPTV is now an established service in France, Sweden, Singapore and South Korea, all
118 Internet protocol television (IPTV) is the term used to describe delivery of television channels to viewers using internet protocol (IP) technology over a broadband connection. 119 A broadband speed of at least 2Mbit/s is recommended for accessing IPTV services. Higher speeds are preferable for accessing high definition channels using IPTV. 120 HDTV refers to high-definition television. A technology that provides viewers with better quality, higher resolution pictures than standard definition. Requires both an HD-capable set and an HD signal.
Proportion of TV households (%)
YoY change (%) +1.6 +15.1 +15.9 +0.8 +4.2 +53.1 +36.4 -0.4 +19.3 +10.7 +4.0 +6.5 +59.7 +13.0 +106 +83.3 +12.5
41%
34%
28% 26%
17% 17%11% 11% 9% 9% 8% 6% 4% 3% 1% 0% 0%
FRA KOR NED SGP SWE ESP CHN USA RUS UK JPN GER AUS POL ITA BRA IND
136
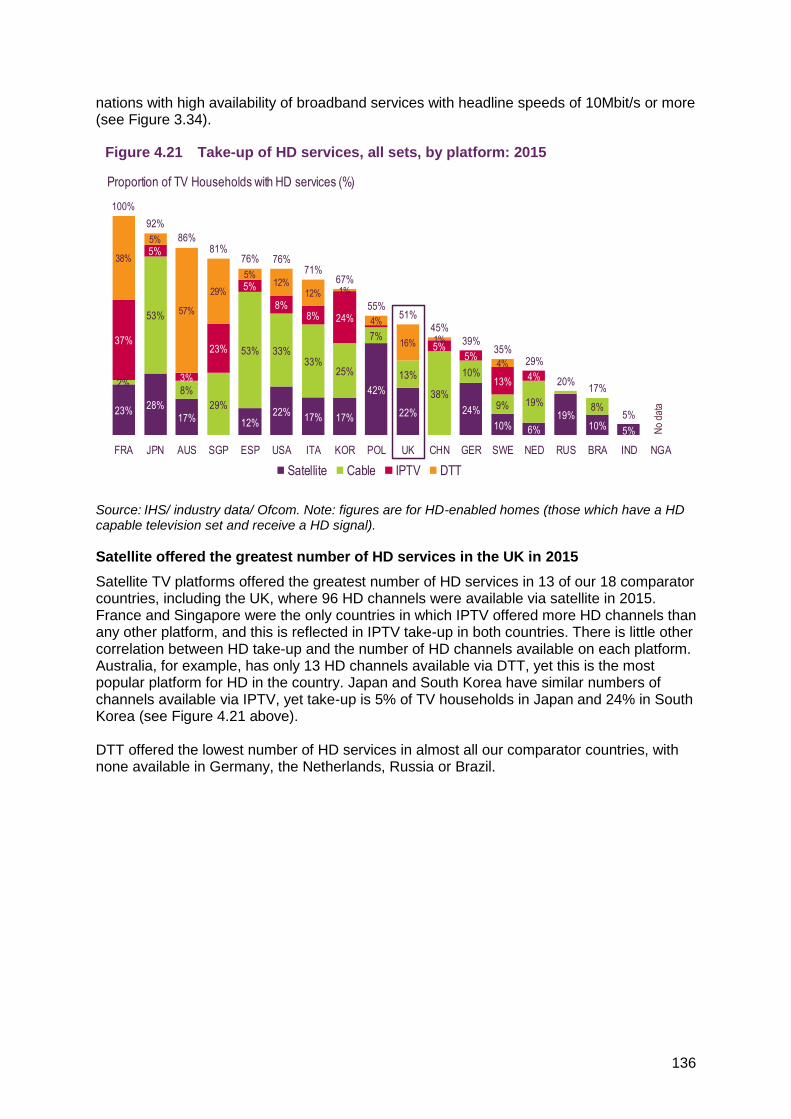
nations with high availability of broadband services with headline speeds of 10Mbit/s or more (see Figure 3.34).
Figure 4.21 Take-up of HD services, all sets, by platform: 2015
Source: IHS/ industry data/ Ofcom. Note: figures are for HD-enabled homes (those which have a HD capable television set and receive a HD signal).
Satellite offered the greatest number of HD services in the UK in 2015
Satellite TV platforms offered the greatest number of HD services in 13 of our 18 comparator countries, including the UK, where 96 HD channels were available via satellite in 2015. France and Singapore were the only countries in which IPTV offered more HD channels than any other platform, and this is reflected in IPTV take-up in both countries. There is little other correlation between HD take-up and the number of HD channels available on each platform. Australia, for example, has only 13 HD channels available via DTT, yet this is the most popular platform for HD in the country. Japan and South Korea have similar numbers of channels available via IPTV, yet take-up is 5% of TV households in Japan and 24% in South Korea (see Figure 4.21 above). DTT offered the lowest number of HD services in almost all our comparator countries, with none available in Germany, the Netherlands, Russia or Brazil.
Proportion of TV Households with HD services (%)
23%28%
17% 12%22%
17% 17%
42%
22% 24%
10% 6%
19%10% 5%
0%
2%
53%
8%
29%
53% 33%33%
25%
7%
13%
38%
10%
9% 19% 8%
37%
5%
3%
23%
5%
8%8% 24%
5%5%
13% 4%
38%
5%
57%
29%
5%12%
12% 1%
4%
16% 1%
4%
100%
92%
86%81%
76% 76%71%
67%
55%51%
45%
39%35%
29%
20%17%
5%
FRA JPN AUS SGP ESP USA ITA KOR POL UK CHN GER SWE NED RUS BRA IND NGA
Satellite Cable IPTV DTT
No
data

137
Figure 4.22 Number of HDTV channels: 2015
Source: IHS/ industry data/ Ofcom
One in ten UK households claim to own an ultra-HD TV121 set
One in ten respondents in the UK claimed to own an ultra-high-definition television set, along with France and Sweden. This was half the proportion in Italy (19%), but in line with most of the other comparator countries.
Figure 4.23 Household ownership of ultra-HD TV sets: 2015
Source: Ofcom consumer research, October 2016 Base: All respondents, UK=1000, FRA=1008, GER=1010, ITA=1032, USA=1016, JPN=1011, AUS=1007, ESP=1016, SWE=1000 Q.3a Which of the following devices do you have in your home, whether or not you use it personally?
121 Ultra-HD is the next generation of high-definition broadcast, which offers up to four times the definition of HD. At the time of publishing, in the UK, UHD services were available via BT’s UHD sports channel, the Sky Q set-top box and some Netflix, Amazon Prime Video and YouTube content.
Number of HD channels
217168
114 116 107 96 87 78 66 55 62 5994
38 650
186
5390 71 86
65 61 62
76
5342 46 50
4138
6
185
178
9989 88
20 5110 24
38 15
48
14
11
157
15 2
75
58
66 13
USA FRA KOR JPN GER UK NED POL CHN ESP SWE RUS BRA ITA SGP AUS IND NGA
Satellite Cable IPTV DTT
No
data
19%
12%11%
10% 10% 10%9% 9%
4%
ITA USA ESP UK FRA SWE GER AUS JPN
Proportion of respondents (%)

138
Broadcast television viewing
The average minutes of broadcast television viewing per person per day in the UK fell by 1.9% in 2015
The average time spent watching broadcast TV,122 across our 15 comparator countries, was 3 hours 41 minutes per person per day in 2015, compared to 3 hours 43 minutes in 2014.
The UK experienced a year-on-year decline in viewing broadcast TV (-1.9%), with people watching an average of 3 hours 36 minutes of TV each day. The decline was more pronounced in the Netherlands, Australia, Italy and the US, all as a result of falls in live123 rather than time-shifted124 viewing. With the exception of Italy, these markets all experienced a year-on-year increase in time-shifted viewing.
In the UK in 2015, time-shifted viewing contributed 13% to total daily viewing, while in the US it contributed 11%. This growth, however, is not enough to counter-balance the overall decline in live viewing. Factors that influence the decline in live viewing are time-shifted viewing, the increasing take-up of SVoD services,125 streaming video, and other types of non-broadcast viewing activities on devices like smartphones, e.g. watching short-form video.126
122 Scheduled TV programming which is available to all viewers simultaneously (such as those listed in electronic programme guides (EPG)). It includes time-shifted viewing of these programmes up to a specified number of days. Appendix B in the Technical appendix details what is reported for each comparator country: https://www.ofcom.org.uk/research-and-data/cmr/cmr16/international 123 Watching programmes during broadcast at the scheduled time, not only to live events such as football matches. 124 Includes any playback within a number of days after live broadcast, as well as pausing or rewinding live TV. Not all comparator countries measure or report time-shifted viewing, so please see the methodology section for further information. 125 A subscription service (usually paid monthly) that offers video-on-demand content (SVoD) usually delivered via the internet. Services may offer live streaming to a selection of channels/content as well as VoD content. For further information, please see Appendix B of the Technical appendix: https://www.ofcom.org.uk/research-and-data/cmr/cmr16/international 126 For more information on the UK please see sections 2.1.4 Behaviour and attitudes of SVoD users and 2.3.2 Recent changes in TV viewing in Ofcom’s 2016 Communications Market Report: https://www.ofcom.org.uk/__data/assets/pdf_file/0024/26826/cmr_uk_2016.pdf

139
Figure 4.24 Average minutes of broadcast TV viewing per person per day: 2014 – 2015
Source: Médiamétrie, Eurodata TV Worldwide – One Television Year in the World 2016. Time-shifted viewing not recorded/measured in the following countries: JPN, POL, KOR, BRA, RUS and CHN. Viewing in France relates to France National. Japan Kanto region, considered to be the main TV market in Japan (national data are not available). Viewing in Australia relates to Australia Regional which is calculated on the regions Queensland, Northern NSW, Southern NSW, Victoria & Tasmania and Regional Western Area. Note: the definition of Australia regional changed in 2014 to include Regional Western Australia.
Legacy terrestrial channels viewing
The combined share of the main five PSB channels in the UK remained stable year on year
The legacy terrestrial channels127 across the UK, France, Germany and Italy continued to account for over half of total TV viewing in 2015. In the UK, the share of viewing to legacy terrestrial channels (BBC One, BBC Two, ITV, Channel 4 and Channel 5) remained generally steady at 50.5%.
Figure 4.25 Legacy terrestrial channels: 2014 - 2015
127 Legacy terrestrial channels are based on Médiamétrie’s definition of channels considered to be ‘historical leaders’ in their respective markets.
245 264 262 253 246 231 234 220 222 188 183 193 178 155 146
29 13 4 1
28 13 12
8
USA POL JPN ITA RUS ESP BRA FRA GER UK AUS KOR NED CHN SWE
Live viewing Time-shiftedAverage minutes per day
-2.8% +1.5% +0.8% -3.1% +0.4% -2.5% +4.5% +1.4% +0.9% -1.9% -3.9% -1.5% -5.0% -1.3% +0.7%
Average
221 mins
274 264 262 234 224254 246 234 222 216 154155190193196
proportional
change in
minutes of
viewing per
person per day,
2014 - 2015
Total daily
viewing (minutes)
51.3%
64.3% 62.1% 60.0%
50.5%
63.0%59.7% 59.1%
UK FRA GER ITA
2014 2015
-0.8pp -1.3pp -2.4pp -0.9pp
Audience share (%)
Change in share
of viewing
2014 – 2015 (percentage points)

140
Source: Médiamétrie, Eurodata TV Worldwide – One Television Year in the World 2016. Notes: Legacy terrestrial channels are based on Médiamétrie’s definition of channels considered to be ‘historical leaders’. UK= BBC One, BBC Two, ITV, Channel 4, Channel 5 (inc HD variants, exc +1s) Germany = ARD, ARD 3, ZDF, RTL, Sat1, Pro7 France = TF1, France 2, France 3, Canal+, France 5 24/24H, Arte 24/24H, M6 Italy = Rai Uno, Rai Due, Rai Tre, Canale 5, Italia 1, Rete 4, La 7
Domestic publicly-owned channels viewing
Audience share of viewing to publicly-owned channels in the UK was stable year on year
In the UK, the publicly-owned channels from the BBC, Channel 4128 and S4C showed a combined share of 43.6%, which remained stable year on year. While BBC One marginally increased its share, BBC Two’s share dipped and Channel 4’s was unchanged. These three channels alone accounted for the majority of viewing to all publicly-owned channels in the UK.129
Figure 4.26 Viewing of domestic publicly-owned channels: 2014 - 2015
Source: Médiamétrie, Eurodata TV Worldwide – One Television Year in the World 2016. Notes: UK - all channels including HD and +1 feeds and BBC red button channels. GER: includes Fernsehen regional channels. ITA - includes all Rai channels. Mixed ownership (domestic/private) channels included in chart for Russia (Pervy Kanal, Karusel), France (Gulli) and South Korea (Euronews)
128 BBC One, BBC Two, BBC Three (ceased March 2016), BBC Four, BBC News, BBC Parliament,
CBBC, CBeebies and BBC red button services, along with Channel 4, E4, More4, Film4, 4seven, 4Music including HD and +1 variants. 129 For more information, please see section 2.3.3 Broadcast TV viewing trends in Ofcom’s Communications Market Report 2016:
https://www.ofcom.org.uk/__data/assets/pdf_file/0024/26826/cmr_uk_2016.pdf
63.4
57.4
44.0
43.3
41.4
37.6
34.5
32.7
33.7
30.2
24.9
20.2
18.5
1.2
1.2
62.5
56.4
43.6
40.5
38.4
37.2
35.9
33.1
31.4
31.2
24.2
19.8
19.0
1.2
0.7
CHN GER UK KOR RUS ITA SWE FRA NED POL ESP JPN AUS USA BRA
2014 2015
-0.9 -1.0 -0.4 -2.8 -3.0 -0.4 +1.4 +0.4 -2.3 +1.0 -0.7 -0.4 +0.5 0.0 -0.5
Audience share (%)
Change in share
of viewing
2014 – 2015
(percentage points)


