The Composition and Formation Mechanism of a Banded Scale in Clay Pipe Sewers David Jenkins Professor Emeritus Environmental Engineering University of California Berkeley Prepared for Mr. Joe Parker National Clay Pipe Institute - Southern California PO BOX 549, 23835 Temescal Canyon Rd., Corona, CA 91718, USA February 16, 2009
Transcript
The Composition and Formation Mechanism of a Banded Scale in Clay Pipe Sewers
David Jenkins Professor Emeritus
Environmental Engineering University of California
Berkeley
Prepared for Mr. Joe Parker
National Clay Pipe Institute - Southern California PO BOX 549, 23835 Temescal Canyon Rd.,
Corona, CA 91718, USA
February 16, 2009
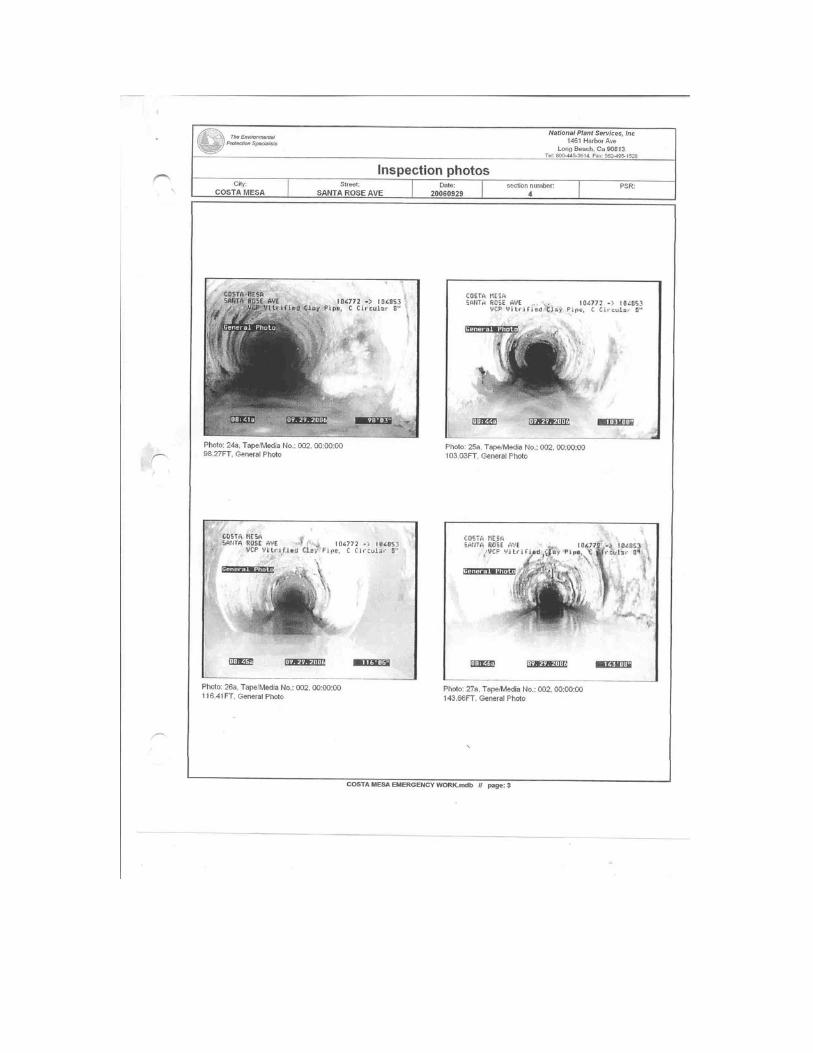
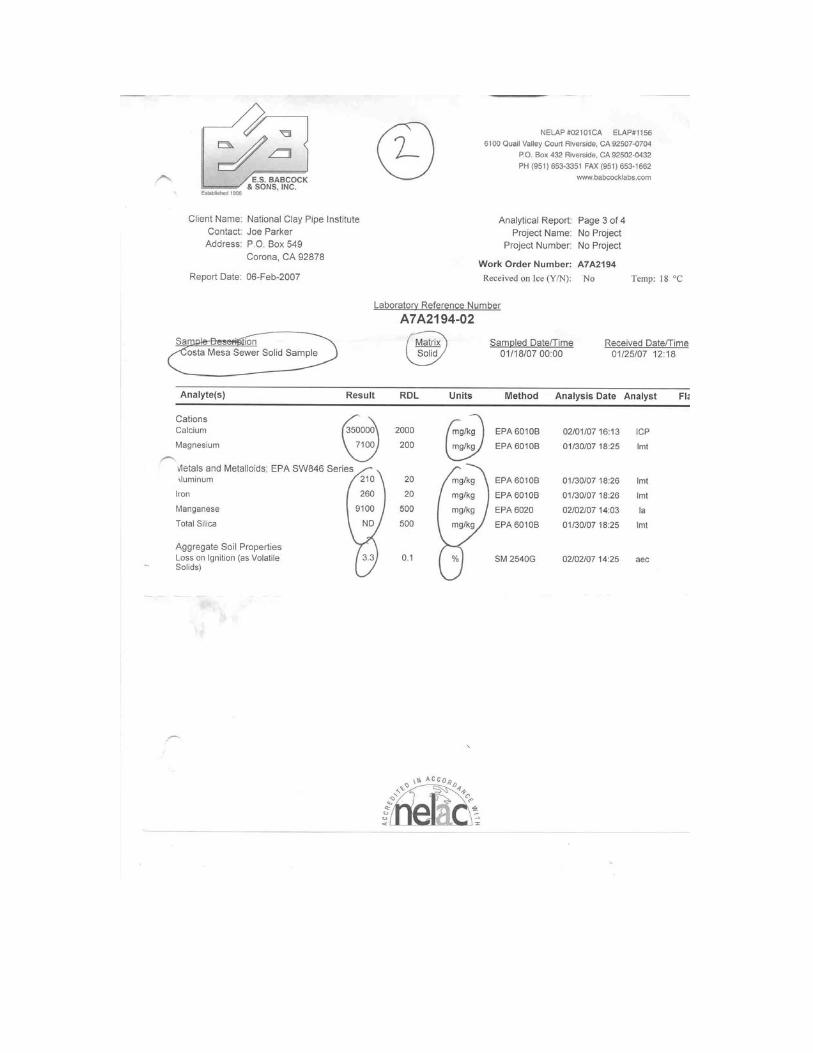
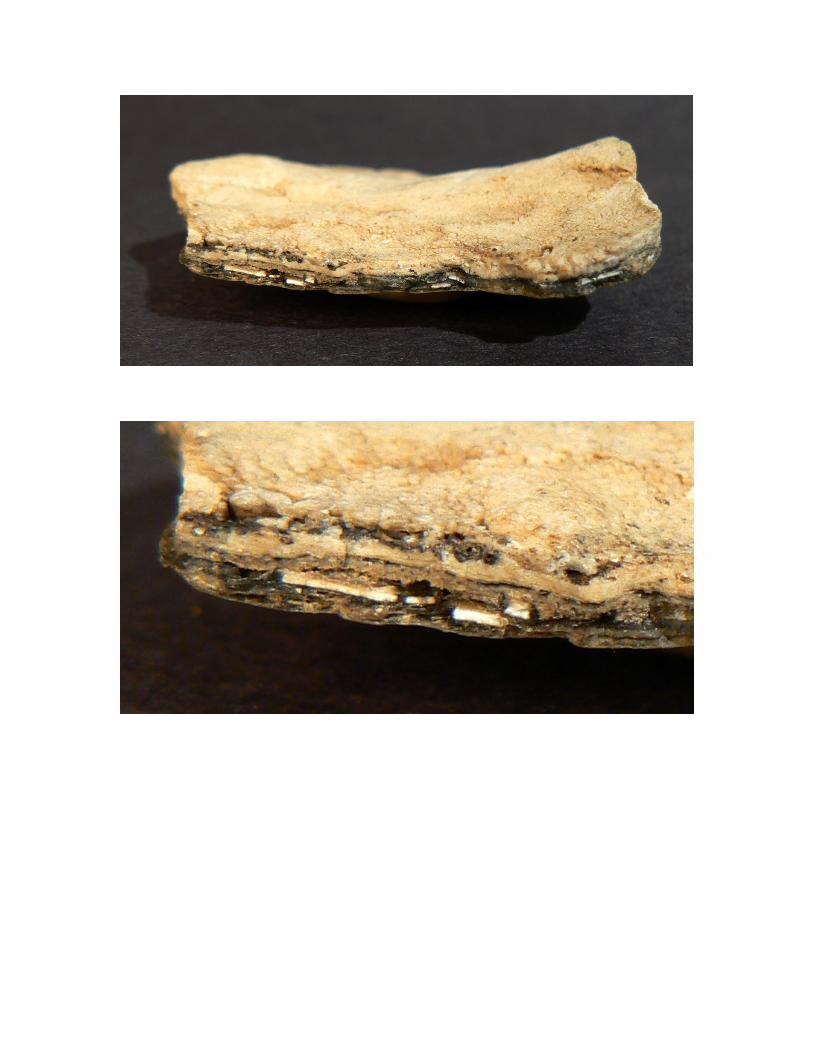
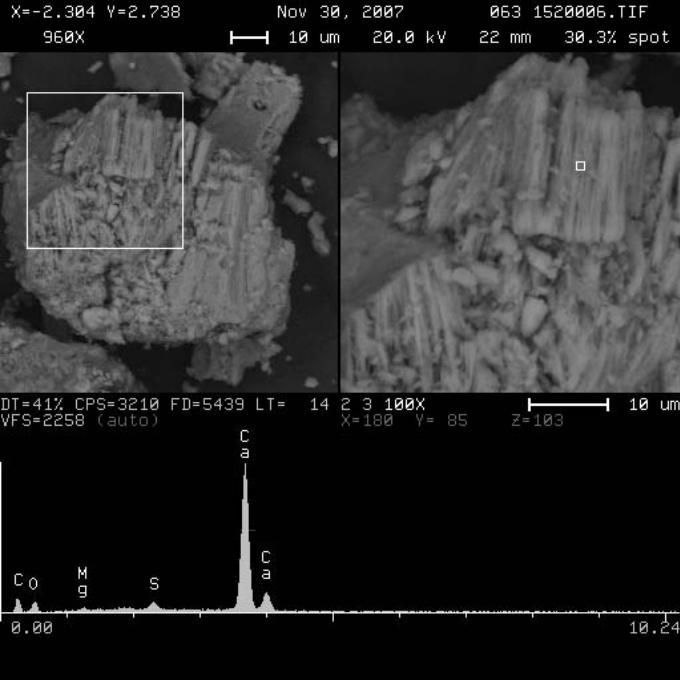
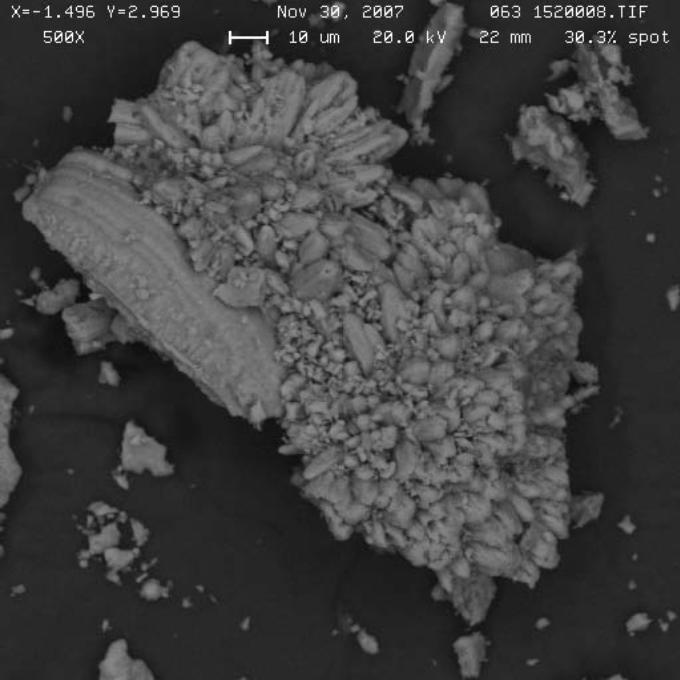
The Problem At several locations in the sewerage systems of communities tributary to the Orange County Sanitation District wastewater treatment plants a ‘whitish scale’ formed on the pipe surface above the ‘water’ level. In some locations the scale was of a thickness that caused concern over its influence on the flow capacity of the sewer. Objectives The objectives of this study were to determine the chemical nature of the scale, to provide an explanation of the mechanism by which it forms and to recommend methods for its removal and prevention. Method of Investigation The following materials and information were provided: 1. Several pieces of scale taken from sewers in Costa Mesa by Mr. Joe Parker, National Clay Pipe Institute (NCPI). 2. Photographs taken from TV inspections of Costa Mesa sewer lines experiencing the scaling problem (Appendix 1). 3. Laboratory reports on the gross chemical composition by E.S. Babcock and Sons Inc. (Babcock) and West Coast Analytical Services Inc. (West Coast) (Appendix 2). Closer visual examination of the scale samples revealed that they had a banded structure with whitish (major) and black (minor) layers (Appendix 3). Material was removed from each layer of the scale by scraping the individual layers with a scalpel and a knife point. An intact scale sample and the powdered materials scraped from each layer were sent to R.J. Lee Group (Lee) for analysis by scanning electron microscopy with energy dispersive spectroscopy (SEM/EDS) and by X-ray diffraction (XRD). SEM/EDS analysis provides information on the overall morphology and the elemental composition of solids (Appendix 4). XRD analysis yields information on the crystalline nature of solids (Appendix 4). Results TV inspection of the sewers showed that the scale was present only above the sewage level and it was heaviest at, and close to, the manholes. The analyses by Babcock and West Coast suggested that the scale was a solid containing major amounts of calcium (Ca), magnesium (Mg) and manganese (Mn). When the scale was treated with dilute hydrochloric acid it fizzed. This suggested that carbonate minerals were present in the scale.
SEM/EDS analysis showed that the whitish layer was composed primarily of calcium carbonate with trace amounts of magnesium and sulfur. The black layer was primarily manganese with some calcium and/or iron and other trace elements. XRD analysis showed that the whitish layer contained major amounts of the calcium carbonate mineral aragonite and minor amounts of the calcium carbonate mineral calcite. The black layer contained major amounts of the manganese mineral todokorite (or possibly the mineral calcium buserite) and the calcium carbonate mineral, calcite. Minor amounts of the silica mineral, quartz, were also present. The Lee report was sent to Professor Alain Manceau, University of Grenoble, France - one of the world’s leading experts on manganese minerals and the interpretation of XRD spectra of minerals. Prof. Manceau’s conclusion was that the XRD spectra were typical of a two-layer hydrate form of buserite. Interpretation of Results The laboratory analytical results, the field observations and the visual appearance of the scale suggest that it is being formed from groundwater that seasonally leaks into the sewer/manhole system. The following scenario is proposed: (i). In the areas where the affected sewers are located, the groundwater level fluctuates with season, being high enough to inundate the sewer system during the wet season but leaving the sewer system ‘high and dry’ during the dry season. (ii). Due to biological activity in the soil the groundwater is both devoid of oxygen (anaerobic) and has a high dissolved carbon dioxide concentration. The high dissolved carbon dioxide concentration lowers the groundwater pH compared to what it would be if the groundwater were exposed to the surface atmosphere (such as in a sewer).. At this low pH the groundwater dissolves carbonate minerals in the soil, thereby increasing its calcium and magnesium concentrations. The anaerobic conditions also ensure that any iron or manganese salts present in the groundwater are in their reduced forms (ferrous and manganous) rather than in their oxidized forms (ferric and manganic). Ferrous and manganous salts are much more soluble than the equivalent ferric and manganic salts. (iii). When the groundwater level rises during the wet season, the groundwater infiltrates the sewer and manholes where it encounters an oxygenated (aerobic), lower carbon dioxide-content atmosphere. The infiltrated groundwater pH increases. This causes precipitation of calcium carbonate (the whitish scale). (iv). Sewer infiltration by groundwater ceases during the dry season when the groundwater levels subside. The scale on the sewer surface becomes aerobic and over time communities of microorganisms capable of oxidizing ferrous iron to ferric iron and manganous salts to manganic salts become established on the surface of the precipitated calcium carbonate. Since the oxidized iron and manganese salts are less soluble than their ferrous and manganous counterparts, precipitation of ferric and manganic-containing minerals takes place (the black layer). Field observations support this mechanism of scale formation as follows:
(i). Scale never forms below the high water (sewage) level in the sewer. This is explained by the fact that the sewage flow dilutes the infiltrated groundwater flow so that the solubilities of any calcium, ferric or manganic salts are not be exceeded. (ii). The amount of scale formed in different regions of the sewer is not identical. The scale was most prominent at locations proximate to a manhole. This can be explained because the since the manhole structures are the most likely parts of the sewer system that would allow groundwater infiltration. As the infiltrated groundwater flows along the interior sewer surface, away from the manhole, it becomes less and less saturated with the scale forming salts (because they have already precipitated). Thus precipitation ceases and there is no more scale formation. (iii). The scale has a banded structure consisting of alternating layers of whitish calcium carbonate and a black manganic oxide mineral. The banded structure of the scale is explained by the seasonal variation of the groundwater level. Successive layers of scale are laid down as the groundwater rises and falls during the wet (high groundwater) and dry (low groundwater) seasons. The whitish calcium carbonate precipitates first because its precipitation relies solely on the pH change encountered when the groundwater is exposed to the lower carbon dioxide content of the sewer atmosphere. The manganic oxide precipitation occurs later because it requires the development of a microbial community capable of oxidizing the manganous salts in the infiltrated ground water to manganic salts. Resolution of the Scaling Problem Two types of action may be needed: (i). Remove the existing scale. This is only required if the scale is serious enough to restrict existing and future anticipated sewage flows. (ii). Prevent further scaling from occurring. The manhole structures should be sealed and made watertight to groundwater infiltration. The City of Costa Mesa has already taken this action. It would be interesting to determine whether this action provided a remedy to the scaling problem.
Appendix 1. Photographs of Scale in Costa Mesa Sewers
Appendix 2. Laboratory Reports of E. S. Babcock and Sons Inc. and West Coast Analytical Service.
Appendix 3. Photographs of Scale Showing its Banded Structure
Appendix 4. SEM/EDS and XRD Analytical Reports
SEM/EDS Analytical Reports
0631520 - white particles
0631521 - black particles. XRD Analytical Report
TEH711217.pdf
LABORATORY REPORT David Jenkins & Associates 11 Yale Circle Kensington, CA 94708‐1015 ATTENTION: Dr. David Jenkins Telephone: (510)527‐0672
RJ Lee Group Job No.: TEH711217Client Job No.: N/A
Purchase Order No.: N/A
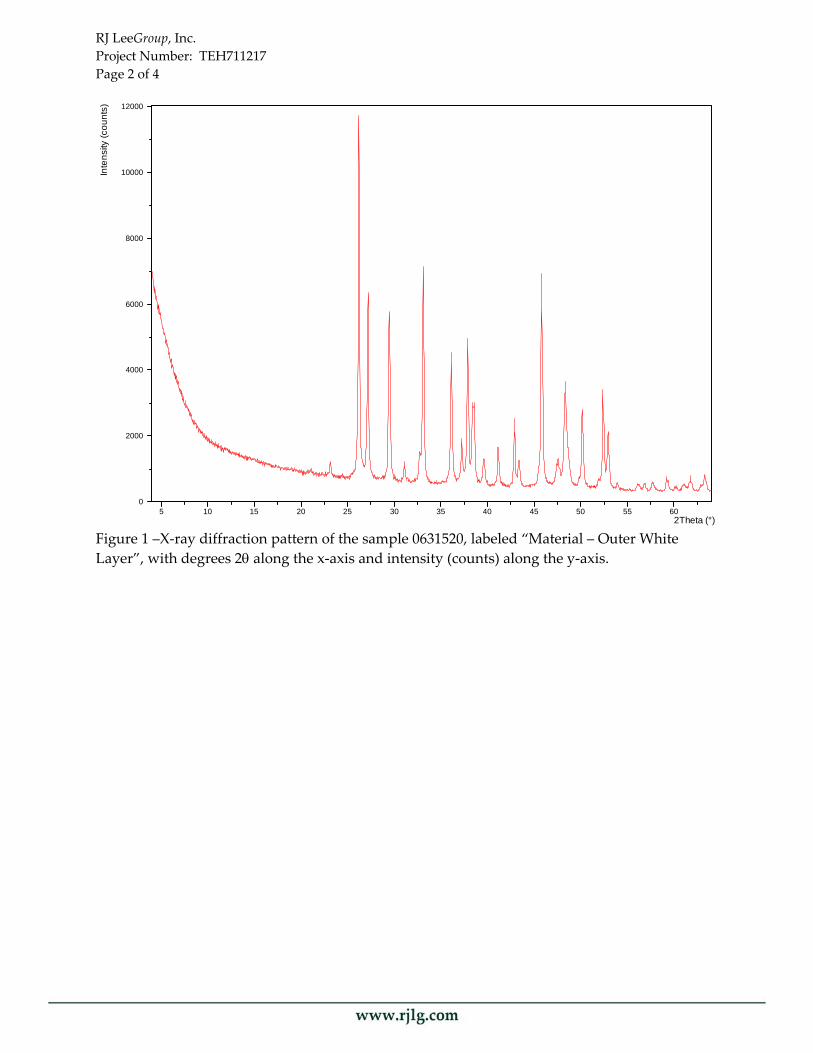
ANALYSIS: X‐ray diffraction (XRD) for crystalline phases A portion of each sample was ground and mounted into a small XRD holder for analysis. The sample was run on a PANalytical X’Pert Pro diffractometer using copper radiation. Client Sample No.: Material ‐ Outer White Layer RJ Lee Group Sample No.: 0631520
Phase Composition Concentration
Aragonite CaCO3 Major Calcite CaCO3 Minor
RJ LeeGroup, Inc. Project Number: TEH711217 Page 2 of 4
5 10 15 20 25 30 35 40 45 50 55 602Theta (°)
0
2000
4000
6000
8000
10000
12000In
tens
ity (c
ount
s)
Figure 1 –X‐ray diffraction pattern of the sample 0631520, labeled “Material – Outer White Layer”, with degrees 2θ along the x‐axis and intensity (counts) along the y‐axis.
RJ LeeGroup, Inc. Project Number: TEH711217 Page 3 of 4
Client Sample No.: Material – Inner Black Layer RJ Lee Group Sample No.: 0631521
Phase Composition Concentration
Todorokite* (Na,Ca,K)2(Mn4+,Mn3+)6O12 • 3‐4.5H2O Major Calcite CaCO3 Major Quartz SiO2 Trace
* This phase is extremely poorly crystalline and it may also include a Ca‐buserite (expanded or hydrated birnessite δ‐MnO2), Mn‐oxide phase.
5 10 15 20 25 30 35 40 45 50 55 602Theta (°)
0
2000
4000
6000
8000
Inte
nsity
(cou
nts)
Figure 2 –X‐ray diffraction pattern of the sample 0631521, labeled “Material – Inner Black Layer”, with degrees 2θ along the x‐axis and intensity (counts) along the y‐axis.
RJ LeeGroup, Inc. Project Number: TEH711217 Page 4 of 4
5 10 15 20 25 30 35 40 45 50 55 602Theta (°)
2000
4000
6000
8000
10000
Inte
nsity
(cou
nts)
Figure 3 ‐ Overlay plot of the diffractograms for the “Outer White Layer” (red) and the “Inner Black Layer” (blue) samples, with degrees 2θ along the x‐axis and intensity (counts) along the y‐axis. Authorized Signature ______________________________ Date _12/12/07_
Christina L. Lopano, Ph.D. Scientist, X‐ray Diffraction Group These results are submitted pursuant to RJ Lee Groupʹs current terms and conditions of sale, including the companyʹs standard warranty and limitation of liability provisions. No responsibility is assumed for the manner in which the results are used or interpreted. Unless notified in writing to return the samples covered by this report, RJ Lee Group will store the samples for a period of thirty (30) or liability days before discarding. A shipping and handling fee will be assessed for the return of any samples. This laboratory operates in accord with ISO 17025 guidelines, and holds limited scopes of accreditation under AIHA lab ID 100364, NY ELAP Lab Code 101208‐0, EPA Lab Code PA00162, CA ELAP Certificate 1970, PA DEP lab ID 02‐00396, VA DCLS Lab