34
The compound feed industry in the EU livestock economy

The compound feed
industry in the EU livestock
economy

Value of EU-28 farm production in 2017
Source: Eurostat
Beef, Veal & Milk93 bio. € / 22%
Pigs 39 bio. € / 9%
Poultry & eggs32 bio. € / 7%
Other animal products 12 bio. € / 3%
Other farm products255 bio. € / 59%

EU-28 Livestock sourcing in
feedingstuffs – 489 mio. t in 2017
Source: FEFAC / EU Commission
235
53
41
160
Forages Home-grown cereals
Purchased straight feedingstuffs Industrial compound feed

Value of purchased compound feed
in total animal output value in 2017
Source: FEFAC
0%
10%
20%
30%
40%
50%
60%
70%
Cattle Pigs Poultry Average

Compound feed production in
European production
(Index of volume: 1995=100)
Source: FEFAC / Eurostat
95
105
115
125
135
145
155
1995 1997 1999 2001 2003 2005 2007 2009 2011 2013 2015 2017
GDP at market prices Industrial production Food industry Compound feed industry

Comparison between prices for animal
products and for feedingstuffs (Index
1995=100)
Source: FEFAC / Eurostat
80
90
100
110
120
130
140
150
160
170
1995 1997 1999 2001 2003 2005 2007 2009 2011 2013 2015 2017
Animal products Feedingstuffs

Key figures of the European
compound feed industry

Turn-over of the compound feed
industry
Source: FEFAC
24.000
29.000
34.000
39.000
44.000
49.000
54.000
59.000
1991 1993 1995 1997 1999 2001 2003 2005 2007 2009 2011 2013 2015
Mio. €
(EU-15 from 1994, EU-25 from 2004 - EU-27 from 2007 - EU-28 from 2013 Without Greece, Luxembourg and Malta)

Evolution of number and average size
of feed production units
Source: FEFAC
0
500
1.000
1.500
2.000
2.500
3.000
3.500
4.000
4.500
20
25
30
35
40
45
50
01 02 03 04 05 06 07 08 09 10 11 12 13 14 15 16 17
EU
pro
du
cti
on
per
un
it,
in 1
000 t
Nu
mb
er
of
un
its
(EU-15 until 2003, EU-25 from 2004, EU-27 from 2007, EU-28 from 2013)

Industrial compound feed production
per country
161.3 mio. t in 2018 in the EU-28
Source: FEFAC
BE6.6
CZ2.5
DE23.8
DK 4.1
ES23.0
FR20.7
HU3.4
IT13.7
IE5.0
NL 14.7
PT3.2
RO2.9 PL
11.6
UK 17.0
AT1.6
CY0.3
EE0.2
FI1.4
LT0.6
LV0.3
SE2.0
SI0.4 BU
1.1
SK0.7
HR0.6
Other9.3

Industrial compound feed production in
the EU-28 in 2018
161.3 mio. t (per category)
Source: FEFAC
Cattle28.5%
Pigs31.6%
Poultry & eggs34.3%
Milk replacers0.7%
Others4.9%
Source: FEFAC

EU-28 compound feed production
development per category
+0.8% in 2018 vs 2017)
20
25
30
35
40
45
50
55
60
0
20
40
60
80
100
120
140
160
180
1996 1998 2000 2002 2004 2006 2008 2010 2012 2014 2016 2018
per
cate
go
ry in
mio
. t
tota
l in
mio
. t
Total Cattle Pigs Poultry
EU-15 from 1995 to 2003, EU- 25 from 2004 to 2006, EU-27 from 2007 to 2012, EU-28 from 2013
Source: FEFAC

Evolution of compound feed production
in some EU-15 countries
Source: FEFAC
70
80
90
100
110
120
130
140
150
160
1996 1999 2002 2005 2008 2011 2014 2017
Ind
ex 1
00 =
1995
FR IT NL UK ES DE

Evolution of compound feed production
in other EU-15 countries
Source: FEFAC
70
90
110
130
150
170
190
1996 1998 2000 2002 2004 2006 2008 2010 2012 2014 2016 2018
Ind
ex 1
00 =
1995
BE IE DK PT AT SE FI
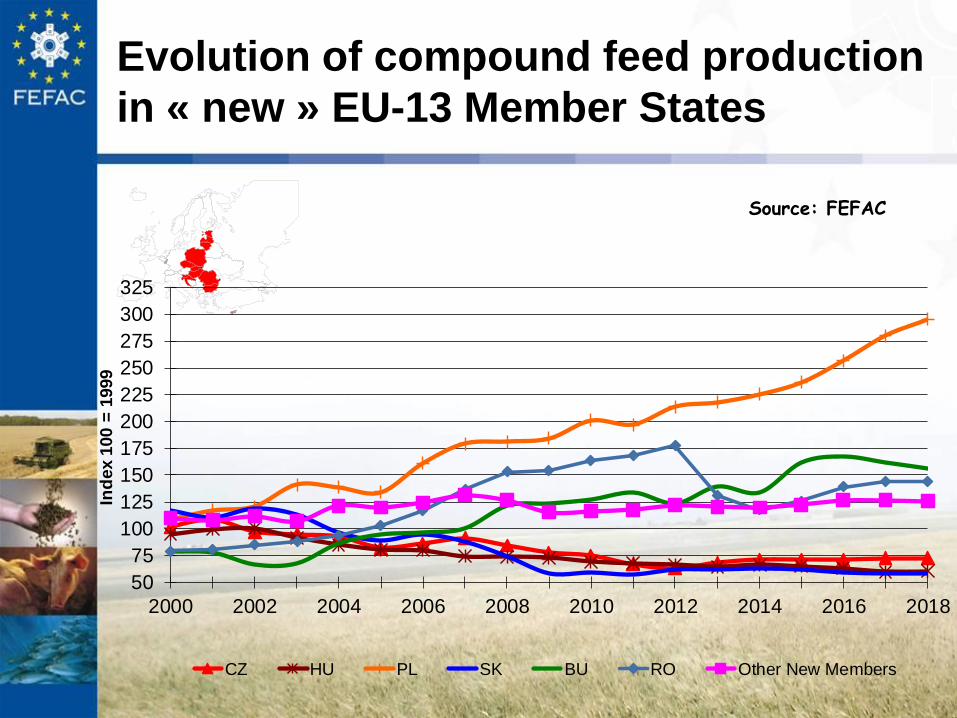
Evolution of compound feed production
in « new » EU-13 Member States
Source: FEFAC
50
75
100
125
150
175
200
225
250
275
300
325
2000 2002 2004 2006 2008 2010 2012 2014 2016 2018
Ind
ex 1
00 =
1999
CZ HU PL SK BU RO Other New Members

Consumption of feed
materials

Feed material consumption by the
EU-28 feed industry in 2017
Source: FEFAC
Feed cereals50%
Co-products from Food & Bioethanol Industries
11.5%
Oils & Fats2%Cakes & Meals
26%
Pulses1.5%
Dairy products0.5%
Dried forage1.5%
Minerals, Additives & Vitamins
3.5%
All others 4%

1990 2005
Feed material consumption by the
EU compound feed industry
Cakes & Meals
25%
Pulses
5%
Dairy products
1%
Dried forage
3%
Minerals, Additives & Vitamins
2%
Tapioca
5.5%
All others
6.5%
Oils & Fats
2%
Co-products from Food Industry
14.5%Animal meals
3%
Feed cereals
32%
Oils & Fats
1.5%
Dried forage
1.5%
Mineral salts, Additives
& Vitamins 3%
Dairy products
1%
Feed cereals
47%
Tapioca
0.5%
All others
5%
Pulses
1.5%
Co-products from
Food Industry
12.5%
Cakes & Meals
27%
Source: FEFAC
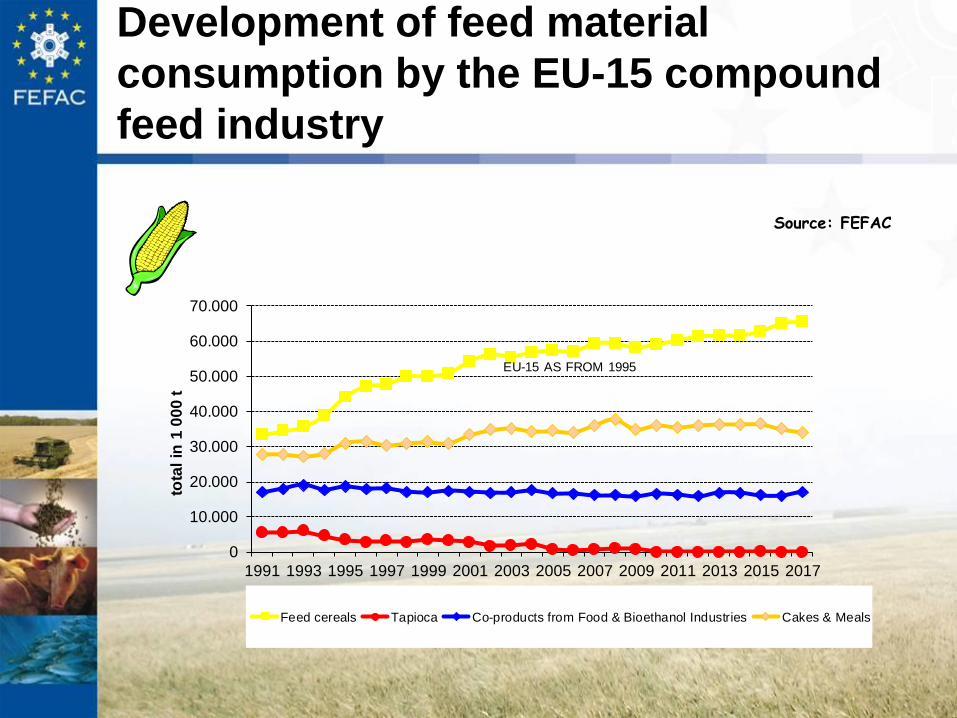
Development of feed material
consumption by the EU-15 compound
feed industry
Source: FEFAC
0
10.000
20.000
30.000
40.000
50.000
60.000
70.000
1991 1993 1995 1997 1999 2001 2003 2005 2007 2009 2011 2013 2015 2017
tota
l in
1 0
00
t
Feed cereals Tapioca Co-products from Food & Bioethanol Industries Cakes & Meals
EU-15 AS FROM 1995

Usage of cereals in the EU-28 in
2017-18
Source: DG AGRI
Feed industry28%
On farm feed use33%
Seeds3%
Food use23%
Biofuels5%
Other internal use8%

Imports of feed materials in the
EU-28 in 2017: 47 mio. t
Source: EUROSTAT
Feed Cereals14.6
Corn Gluten Feed0.5
DDGS1.1
Molasses1.6
Citrus pellets0.2
Oilmeals25.4
Fishmeal0.2
Pulses0.3
Miscellaneous3.2

EU-28 balance sheet for protein
rich feed materials in 2016/17
Source: DG Agriculture(*): including soy protein concentrate
(**): from EU produced seeds
(***): excluding on farm uses for co-products other than soy, rapeseed and sunflower meal
(****): excluding on farm uses
EU total feed use (mio. t proteins)
EU feed use of EU origin
(mio. t proteins)
Self-sufficiency (%)
CROPS
Thereof wheat
barley
maize
oilseeds
pulses
18.30
5.76
4.12
4.22
0.50
0.77
16.60
5.40
4.12
3.24
0.50
0.71
91
94
100
77
100
92
CO-PRODUCTS (***)
Thereof soyabean meal(*)
rapeseed meal
sunflower meal
25.57
13.37
4.36
2.43
9.77
0.67
3.43
1.02
38
5
79
42
OTHER (****) 0.92 0.86 93
Thereof fishmeal
skimmed milk powder
0.36
0.06
0.31
0.06
86
100
TOTAL 44.79 27.21 61

Sources of proteins for feed use in
the EU-28 in 2016/17
Expressed in "equivalent
protein", excl. forages
wheat13%
barley9%
maize3%
other cereals7%
oilseeds1%
pulses2%
soybean meal30%
rapeseed meal10%
sunflower meals5%
other co-products12%
fishmeal1%
others1%
Source: DG AGRI
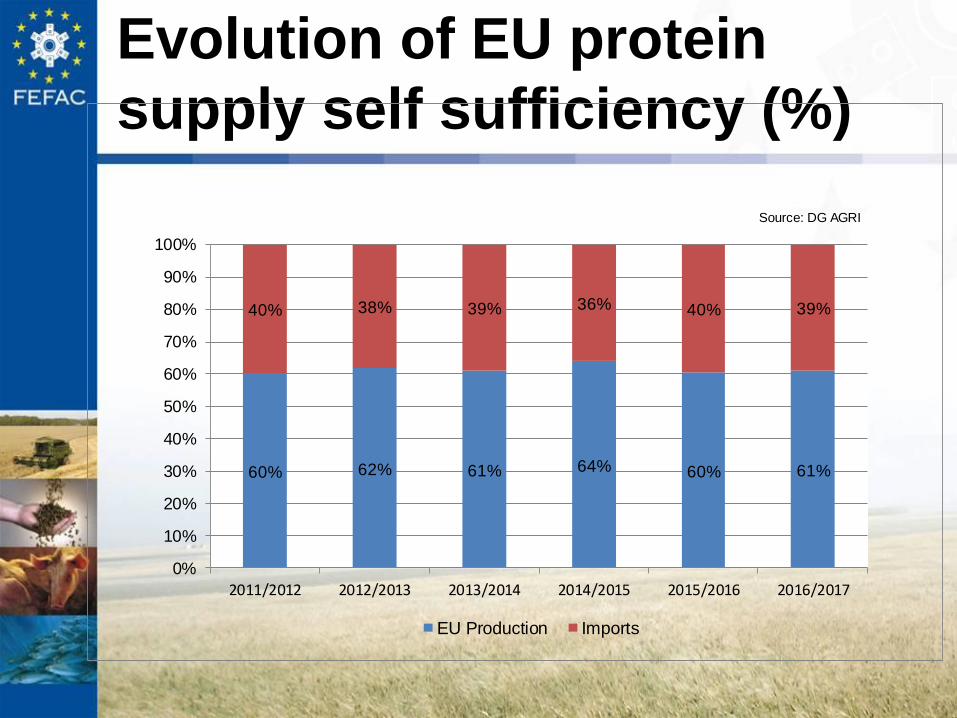
Evolution of EU protein
supply self sufficiency (%)
60% 62% 61% 64% 60% 61%
40% 38% 39% 36% 40% 39%
0%
10%
20%
30%
40%
50%
60%
70%
80%
90%
100%
2011/2012 2012/2013 2013/2014 2014/2015 2015/2016 2016/2017
EU Production Imports
Source: DG AGRI

Contribution of feed materials to protein
supply and level of EU dependency in
2016/2017
0
10
20
30
40
50
60
70
80
90
100
Cereals Oilseeds Pulses Soybean meals Rapeseed meal Sunflower meal Feed materials of
animal origin
Other co-products
food and biofuels
industry
Self sufficiency Protein supply (percentage of total proteins)
%
Crops Oilseed meals
Source: DG AGRI

Compound feed production in
EU-28 and other European countries in
2017 (in mio. t)
Source: FEFAC / Alltech
EU-28 (incl. EL)
163.0
Russia37.6
Ukraine6.6
Serbia1.0
Turkey22.4
Other non-EU13.6
Switzerland1.5
Norway3.8
Europe non-EU86.5

Global compound feed
production in 2017 (1,053 mio. t)
Source: FEFAC / Alltech
EU-28 (incl. EL)163
Other Europe87
China187
Japan24Other Asia
171
Brazil70
Mexico34
USA173
Canada22
Other America56
Others66

Evolution of global compound feed
production (Index 100 = 1999)
Source: FEFAC / Alltech / Feed International
60
80
100
120
140
160
180
200
220
240
260
2003 2004 2005 2006 2007 2008 2009 2010 2011 2012 2013 2014 2015 2016 2017
EU-28 Other Europe Brazil USA China

Livestock production and
consumption in the EU

Livestock population in the EU
Source: Eurostat
20000
40000
60000
80000
100000
120000
140000
160000
180000
2005 2006 2007 2008 2009 2010 2011 2012 2013 2014 2015 2016 2017
(*1 0
00 h
ead
s)
(*1,0
00 h
ead
s)
EU-25 from 2004, EU-27 from 2007, EU-28 from 2013

Meat production development
in the EU per categorySource: DG AGRI, a.v.e.c.
0
5
10
15
20
25
0
5
10
15
20
25
30
35
40
45
50
02 03 04 05 06 07 08 09 10 11 12 13 14 15 16 17
per
cate
go
ry,
in m
io. t
tota
l m
eat,
in
mio
. t
Total meat Beef & Veal Pig meat Poultry meat
EU-15 from 1999 to 2003, EU-25 from 2004 to 2006, EU-27 from 2007 to 2012, EU-28 since 2013
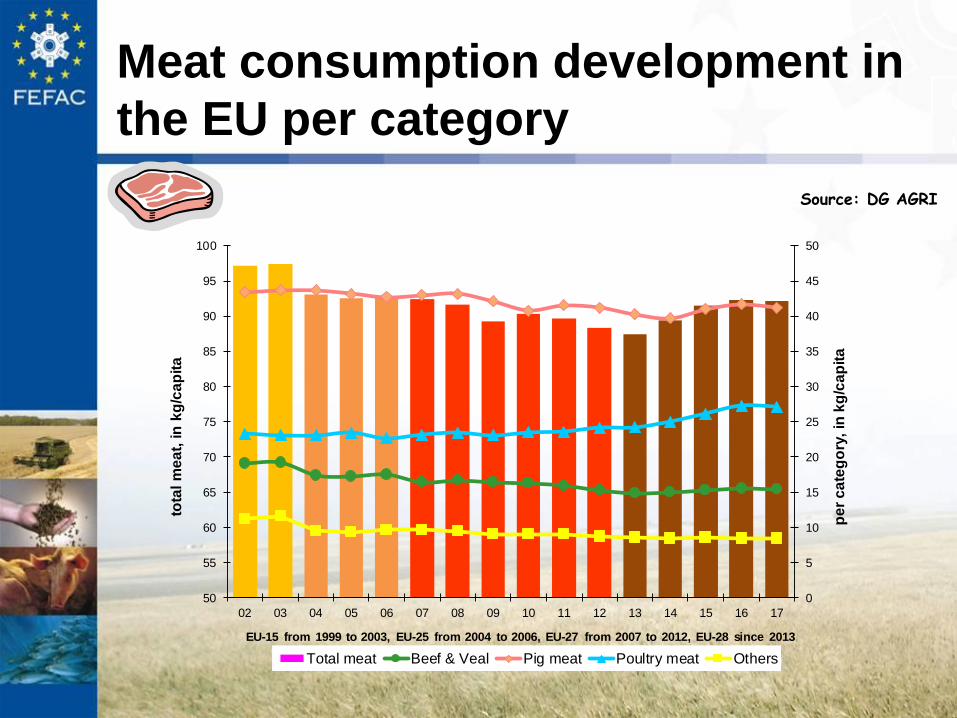
Meat consumption development in
the EU per category
0
5
10
15
20
25
30
35
40
45
50
50
55
60
65
70
75
80
85
90
95
100
02 03 04 05 06 07 08 09 10 11 12 13 14 15 16 17
pe
r c
ate
go
ry,
in k
g/c
ap
ita
tota
l m
ea
t, i
n k
g/c
ap
ita
Total meat Beef & Veal Pig meat Poultry meat Others
EU-15 from 1999 to 2003, EU-25 from 2004 to 2006, EU-27 from 2007 to 2012, EU-28 since 2013
Source: DG AGRI

Total meat consumption per capita
in the EU-28 per category in 2017
Source: DG AGRI
Beef & Veal16.7%
Pig meat44.7%
Poultry meat29.4%
Sheep & Goat meat2.2%
Others6.9
%

EU self sufficiency in some EU
agricultural products in 2017Source: EUROSTAT/ DG AGRI
0 20 40 60 80 100 120 140 160 180
Oilseed meals
Beef and veal
Poultry
Eggs
Cheese
Butter
Cereals
Pork
Sugar
Skimmed milk powder
in %


![Biparental defensive endowment alkaloid Utetheisa · alkaloids [for example, monocrotaline (compound I) and I C20H H20 If OH CHO,4' usaramine (compound H)]. Utetheisa larvae feed](https://static.documents.pub/doc/80x56/5fab730a62c7c73ed161d7a5/biparental-defensive-endowment-alkaloid-utetheisa-alkaloids-for-example-monocrotaline.jpg)


