The Concept of Middle Income Countries through a Health Lens INNOVATION AND ACCESS TO MEDICAL TECHNOLOGIES 5 November 2014 David B Evans Director, Health Systems Governance and Financing World Health Organization, Geneva
Transcript
The Concept of Middle Income Countries through a Health Lens
INNOVATION AND ACCESS TO MEDICAL TECHNOLOGIES
5 November 2014
David B EvansDirector, Health Systems Governance and Financing
World Health Organization, Geneva
Background1. Low, middle and high income classifications linked to
World Bank lending – eligibility for IDA. 2. 2015 fiscal year
I. low-income (34): GNI per capita (WB Atlas Method) ≤ $1,045 in 2013;
II. Middle-income economies (105): $1,045 > GNI per capita < $12,746;
(Lower-middle-income and upper-middle-income economies are separated at a GNI per capita of $4,125) III. High-income economies (75): GNI per capita ≥ $12,746.
3. 77 IDA-eligible countries; 59 IDA-only; and 18 blend countries. In addition, India is receiving transitional support
Country Income Classifications and Health
1. Since the financial crisis (2008), increasing demands from external financial partners in health for countries to become "self-sufficient" and prove "value for money" or "results".
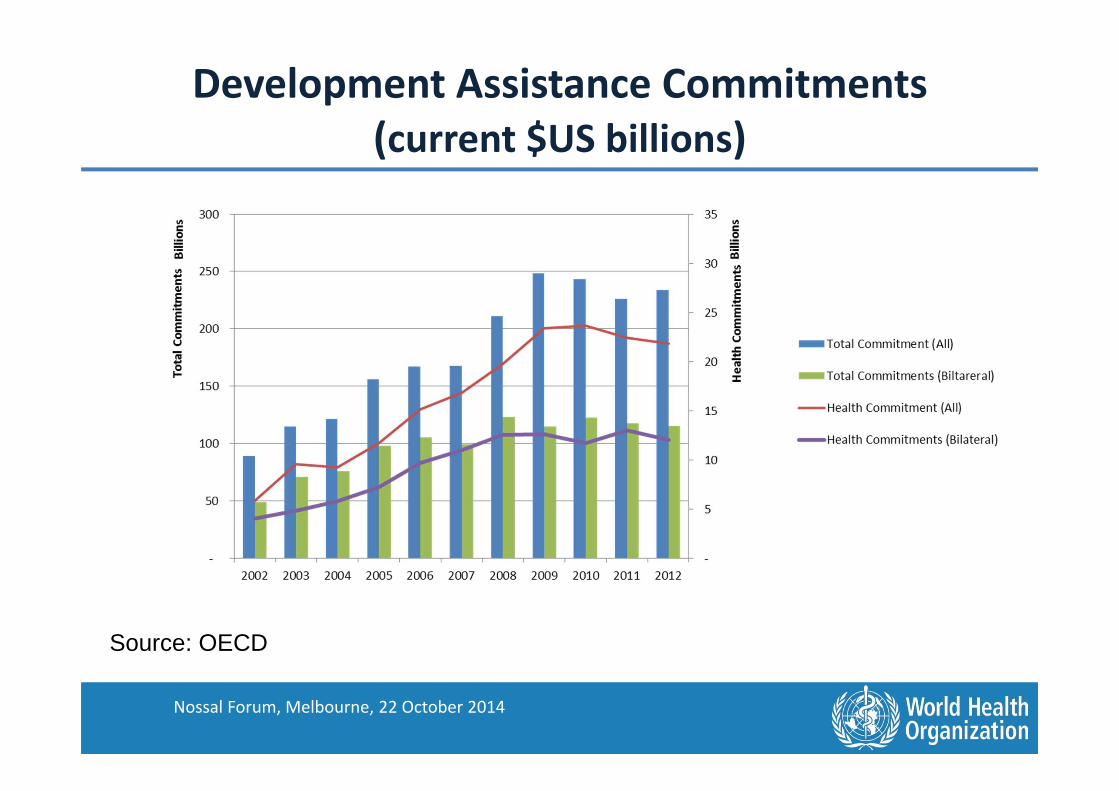
Development Assistance Commitments (current $US billions)
Source: OECD
Nossal Forum, Melbourne, 22 October 2014
Country Income Classifications and Health
1. Since the financial crisis (2008), increasing demands from external financial partners in health for countries to become "self-sufficient" and prove "value for money" or "results".
2. Income per capita is featuring heavily in the idea that countries should raise more funds domestically and be "weaned" off external support
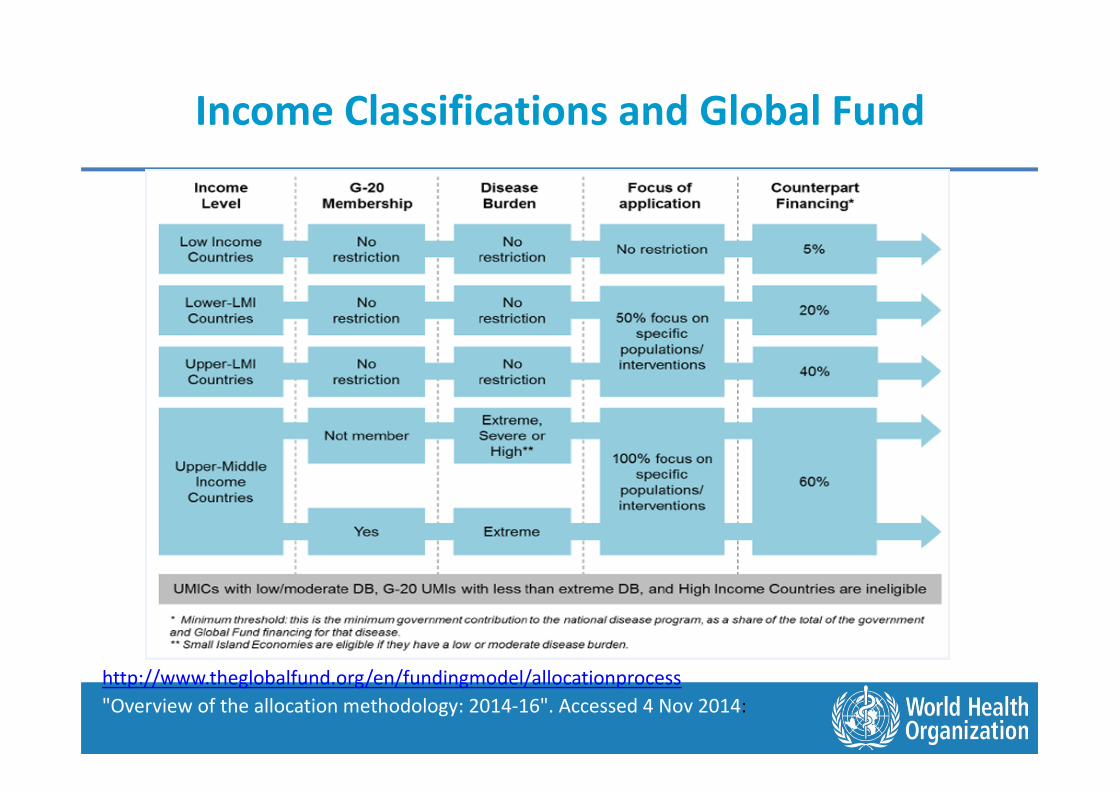
3. GAVI eligibility (53): GNI per capita ≤ $15704. Also requires co-funding of $0.20 per dose, rising linearly to full
cost over time.5. Global fund: based on income classifications, with
modifications. Includes a 15% additional payment on evidence of "willingness to pay".
Income Classifications and Global Fund
http://www.theglobalfund.org/en/fundingmodel/allocationprocess"Overview of the allocation methodology: 2014-16". Accessed 4 Nov 2014:
Capacity to Pay for Health and Income
Classifications
Total health expenditure (THE) per capita (2012)and GNI per capita (log scale)
0
200
400
600
800
1000
1200
1400
1600
1800
5 6 7 8 9 10
THE
per c
apita
$
GNI per capita (WB Atlas method), log
Low income
Middle income
Sources: THE – WHO Global Health Expenditure DatabaseGNI per capita – WB, World Development Indicators
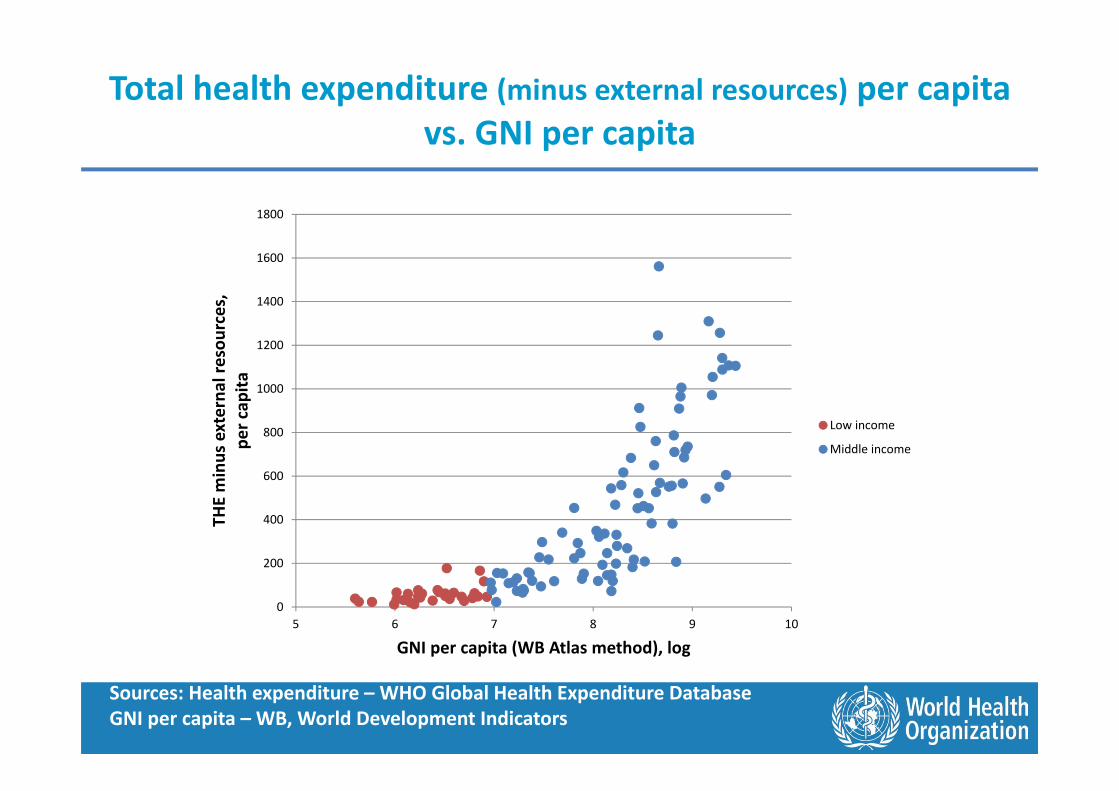
Total health expenditure (minus external resources) per capita vs. GNI per capita
0
200
400
600
800
1000
1200
1400
1600
1800
5 6 7 8 9 10
THE
min
us e
xter
nal r
esou
rces
,pe
r cap
ita
GNI per capita (WB Atlas method), log
Low income
Middle income
Sources: Health expenditure – WHO Global Health Expenditure DatabaseGNI per capita – WB, World Development Indicators
What would happen if donors withdrew aid?
020040060080010001200140016001800
0%
50%
100%
150%
200%
250%
Mal
awi
Cent
ral A
fric
an R
epub
licN
iger
Mad
agas
car
Ethi
opia
Uga
nda
Guin
ea-B
issau
Moz
ambi
que
Tanz
ania
Mal
iAf
ghan
istan
Beni
nCo
mor
osKe
nya
Tajik
istan
Mau
ritan
iaSo
uth
Suda
nKy
rgyz
Rep
ublic
Yem
en, R
ep.
Cote
d'Iv
oire
Sao
Tom
e an
d Pr
inci
peLe
soth
oSo
lom
on Is
land
sGh
ana
Uzb
ekist
anHo
ndur
asBh
utan
Kirib
ati
Nig
eria
Vanu
atu
Phili
ppin
esSa
moa
Geor
gia
Tim
or-L
este
El S
alva
dor
Mon
golia
Ukr
aine
Mar
shal
l Isla
nds
Fiji
Beliz
eBo
snia
and
Her
zego
vina
Jord
anJa
mai
caEc
uado
rDo
min
ican
Rep
ublic
Iran,
Isla
mic
Rep
.Pe
ruTu
valu
Dom
inic
aSt
. Luc
iaM
onte
negr
oGr
enad
aBo
tsw
ana
Cost
a Ri
caM
exic
oPa
nam
aPa
lau
Braz
il
THE minus external resources, per capita External resources for health, per capita
% increase of domestic resources if donors withdrew aid
Source: WHO internal calculations
GNI per capita growth (annual %), 2003-2012
-6
-4
-2
0
2
4
6
8
10
2003
2004
2005
2006
2007
2008
2009
2010
2011
2012
High income
Middle income
Low income
Source: World Bank, World Development Indicators
Trends: Government Commitment to Health (un-weighted average)
General government expenditure on health % General government expenditure (GGE)
Source: WHO, Global Health Expenditure Database, www.who.int/nha
Share of Government Expenditure in GNI
0
5000
10000
15000
20000
25000
30000
35000
40000
45000
0%
10%
20%
30%
40%
50%
60%
70%
80%
90%
Bang
lade
shEt
hiop
iaM
ali
Mad
agas
car
Nep
alCo
ngo,
Dem
. Rep
.Li
beria
Afgh
anist
anGu
inea
Tanz
ania
Rwan
daBu
rkin
a Fa
soTo
goKe
nya
Eritr
eaM
alaw
iTu
rkm
enist
anSu
dan
Phili
ppin
esIra
n, Is
lam
ic R
ep.
Mex
ico
Paki
stan
Kaza
khst
anVa
nuat
uAr
men
iaCo
te d
'Ivoi
reSo
uth
Suda
nZa
mbi
aEl
Sal
vado
rCo
lom
bia
Surin
ame
Nig
eria
Sene
gal
Bela
rus
Ghan
aPa
pua
New
Gui
nea
Tuni
siaGe
orgi
aLe
bano
nGu
yana
Egyp
t, Ar
ab R
ep.
Cabo
Ver
deJo
rdan
Rom
ania
Kyrg
yz R
epub
licBu
lgar
iaCo
ngo,
Rep
.Ho
ndur
asBo
tsw
ana
Yem
en, R
ep.
Ango
laPa
ragu
ayM
oldo
vaEc
uado
rM
aurit
ania
Bosn
ia a
nd H
erze
govi
naBo
livia
Liby
aSa
o To
me
and
Prin
cipe
Bhut
anM
onte
negr
oSe
rbia
Mar
shal
l Isla
nds
Leso
tho
Cuba
Tuva
luU
nite
d Ar
ab E
mira
tes
Antig
ua a
nd B
arbu
daCh
ileBa
hrai
nSt
. Kitt
s and
Nev
isQ
atar
Brun
ei D
arus
sala
mSa
udi A
rabi
aLi
thua
nia
Kuw
ait
Slov
ak R
epub
licLa
tvia
Uni
ted
Stat
esN
ew Z
eala
ndPo
land
Luxe
mbo
urg
San
Mar
ino
Czec
h Re
publ
icM
alta
Cypr
usSp
ain
Uni
ted
King
dom
Net
herla
nds
Aust
riaGr
eece
Finl
and
Denm
ark
gge_gdp
gge_pc
Source: World Bank World Development Indicators
Under-five mortality rate vs. GNI per capita, 2013
0
20
40
60
80
100
120
140
160
180
5 6 7 8 9 10
Und
er-fi
ve m
orta
lity
rate
(per
1,0
00 li
ve b
irths
)
GNI per capita (Atlas method), log
Low income
Middle income
Sources: under-5 mortality: WHOGNI – WB World Development Indicators
Least Developed CountriesA country is classified as a Least Developed Country if it meets three criteria (48 in 2014):• Poverty (adjustable criterion: three-year average GNI
per capita of less than US $992, which must exceed $1,190 to leave the list as of 2012)
• Human resource weakness (based on indicators of nutrition, health, education and adult literacy) and
• Economic vulnerability (based on instability of agricultural production, instability of exports of goods and services, economic importance of non-traditional activities, merchandise export concentration, handicap of economic smallness, and the percentage of population displaced by natural disasters)
Conclusion• Becoming middle income does not necessarily
mean greater spending on health or capacity to spend
• A number of countries would find it impossible to replace instantaneously the current external funding they receive for health if all donors decide to use the WB classifications for providing funding for health
• A continuous index perhaps broader than the HDI to allow a slow phase out of external assistance would be a lot more preferable to ensure affordability of health and health products


![Analysis of Regional Variations in Influence of … · low-income than in middle-income and high-income countries. [5] Developing countries with poor water quality, sanitation ...](https://static.documents.pub/doc/80x56/5b9103f409d3f2f1278d0c5d/analysis-of-regional-variations-in-influence-of-low-income-than-in-middle-income.jpg)


