1. Make multiple copies of a shape2. Translate those copies around3. Combine them with either their:
Union, , in the case of dilation, Intersection, , in the case of erosion,
Dilation makes things biggerErosion makes things smaller
4
Binary Morphology: Basic Idea
Q: How do we designate: The number of copies to make? The translation to apply to each copy?
A: With a structuring element (s.e.) A (typically) small binary image. We will assume the s.e. always contains the origin.
For each marked pixel in the s.e.: Make a new copy of the original image Translate that new copy by the coordinates of the current pixel in
the s.e.
5
Dilation Example
=
fB = s.e.10
9
8
7
6
5
4
3
2
1
0
0 1 2 3 4 5 6 7 8 9 10
3
2
1
0
-1
-2
-3
-3 -2 -1 0 1 2 3
10
9
8
7
6
5
4
3
2
1
0
0 1 2 3 4 5 6 7 8 9 10
fA
A = { (2,8),(3,8),(7,8),(8,8),(5,6),(2,4),(3,4),(3,3),(4,3),(5,3),(6,3),(7,3),(7,4),(8,4) }
B = { (0,0),(0,-1) }
6
Erosion Example
For erosion, we translate by the negated coordinates of the current pixel in the s.e.
=
fB = s.e.10
9
8
7
6
5
4
3
2
1
0
0 1 2 3 4 5 6 7 8 9 10
3
2
1
0
-1
-2
-3
-3 -2 -1 0 1 2 3
fA10
9
8
7
6
5
4
3
2
1
0
0 1 2 3 4 5 6 7 8 9 10
=
109876543210
0 1 2 3 4 5 6 7 8 9 10
109876543210
0 1 2 3 4 5 6 7 8 9 10
7
NotationA (binary) image: fAThe set of marked pixels in fA: A
A = { (x1,y1), (x2,y2), … }
A translated image or set: fA(dx,dy) or A(dx,dy)The number of elements in A: #AComplement (inverse) of A: Ac
Reflection (rotation) of A: ÃÃ = { (-x,-y) | (x,y) A }
2
1
0
-1
-2
-2 -1 0 1 2
2
1
0
-1
-2
-2 -1 0 1 2
8
Properties
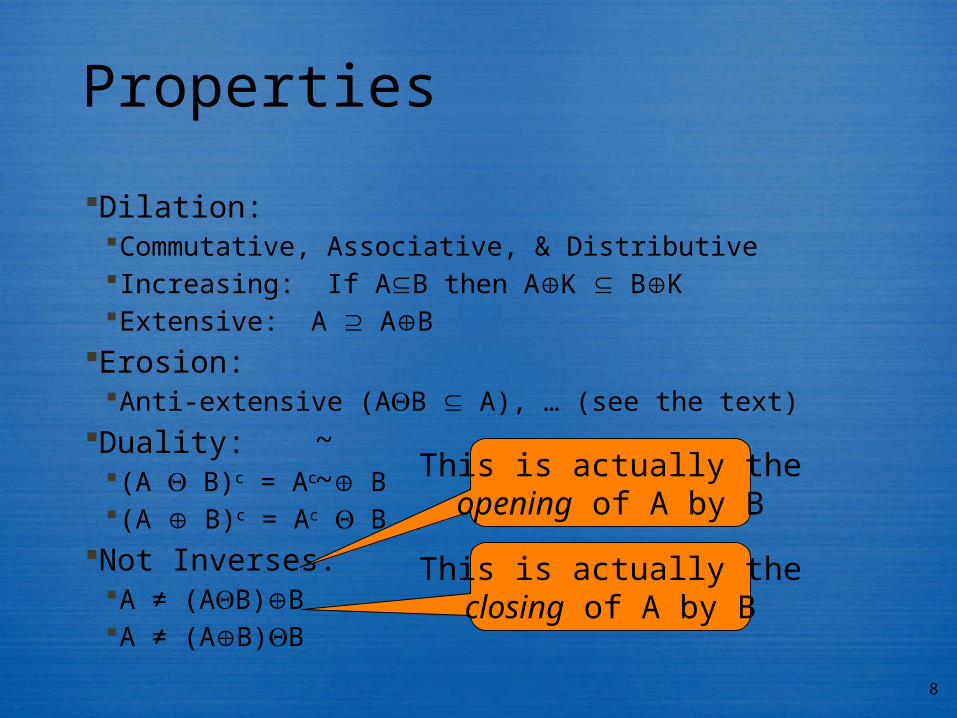
Dilation: Commutative, Associative, & Distributive Increasing: If AB then AK BK Extensive: A AB
Erosion: Anti-extensive (AB A), … (see the text)
Duality: (A B)c = Ac B (A B)c = Ac B
Not Inverses: A ≠ (AB)B A ≠ (AB)B
~~ This is actually the
opening of A by B
This is actually theclosing of A by B
9
Opening
fA o fB = (fA fB) fB
Preserves the geometry of objects that are “big enough”Erases smaller objects
Mental Concept: “Pick up” the s.e. and place it in fA. Never place the s.e. anywhere it covers any pixels in fA that are not
marked. fA o fB = the set of (marked) pixels in fA which can be covered by the
s.e.
10
Opening Example
Use a horizontal s.e. to remove 1-pixel thick vertical structures: 1
0
-1
-1 0 1
10
9
8
7
6
5
4
3
2
1
0
0 1 2 3 4 5 6 7 8 9 10
10
9
8
7
6
5
4
3
2
1
0
0 1 2 3 4 5 6 7 8 9 10
10
9
8
7
6
5
4
3
2
1
0
0 1 2 3 4 5 6 7 8 9 10
Erosion Dilation
11
Gray-Scale Morphology
Morphology operates on setsBinary images are just a set of marked pixelsGray-scale images contain more informationHow can we apply morphology to this extra
intensity information?We need to somehow represent intensity as
elements of a set
12
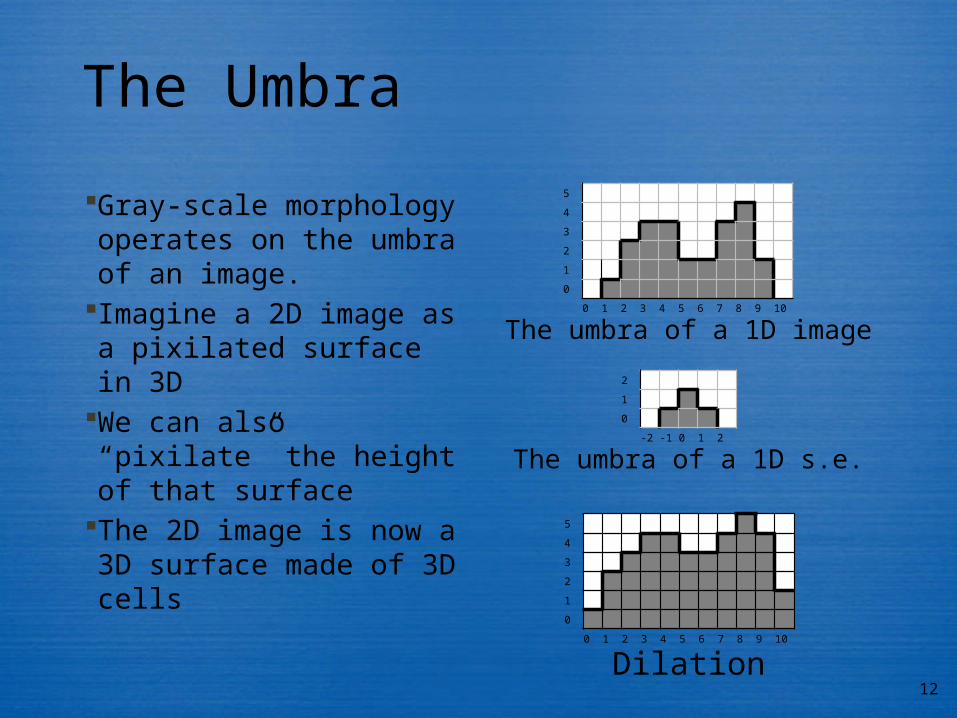
Gray-scale morphology operates on the umbra of an image.
Imagine a 2D image as a pixilated surface in 3D
We can also “pixilate” the height of that surface
The 2D image is now a 3D surface made of 3D cells
The Umbra
The umbra of a 1D image
5
4
3
2
1
0
0 1 2 3 4 5 6 7 8 9 10
The umbra of a 1D s.e.
2
1
0
-2 -1 0 1 2
Dilation
5
4
3
2
1
0
0 1 2 3 4 5 6 7 8 9 10
13
Records at each pixel the distance from that pixel to the nearest boundary (or to some other feature).
Used by other algorithms The DT is a solution of the
Diff. Eq.: || DT(x) || = 1, DT(x) = 0 on boundary
Can compute using erosion DT(x) = iteration when x
disappears Details in the book
1 1 1
1 1 1
1 1 1 1 2 1
1 2 2 1 2 2 1
1 2 2 3 2 1
1 2 3 2 2 1
1 2 2 1 2 1
1 2 1 1 1
1 1
1
The Distance Transform (DT)
DT of a region’s interior
14
Voronoi Diagram
Divides space Related to DT
Q: To which of a set of regions (or points) is this point the closest?
Voronoi Diagram’s boundaries = points that are equi-distant from multiple regions
Voronoi Domain of a region = the “cell” of the Voronoi Diagram that contains the region
Details in the text
The voronoi diagram of a set of 10 points is public domain from:http://en.wikipedia.org/wiki/File:2Ddim-L2norm-10site.png
Template ≈ a relatively small reference image for some feature we expect to see in our input image.
Typical usage: Move the template around the input image, looking for where it “matches” the best (has the highest correlation).
Rotation & scale can be problematic Often require multiple passes if they can’t be ruled out a-priori
How “big” do we make each template? Do we represent small, simple features Or medium-size, more complex structures?
17
Eigenimages
Goal: Identify an image by comparing it to a database of other images
Problem: Pixel-by-pixel comparisons are two expensive to run across a large database
Solution: Use PCA
18
Big Picture: Fitting a hyper-ellipsoid & then (typically) reducing dimensionality by flattening the shortest axes
Same as fitting an (N+1)-dimensional multivariate Gaussian, and then taking the level set corresponding to one standard deviation
Mathematically, PCA reduces the dimensionality of data by mapping it to the first n eigenvectors (principal components) of the data’s covariance matrix
The first principal component is the eigenvector with the largest eigenvalue and corresponds to the longest axis of the ellipsoid
The variance along an eigenvector is exactly the eigenvector’s eigenvalue This is VERY important and VERY useful. Any questions?
PCA (K-L Expansion)
x’
y’
b1b2
x
y
19
Eigenimages: Procedure
Run PCA on the training images See the text for efficiency details
Store in the database:The set of dominant Eigenvectors = the principle components = the Eigenimages
For each image, store its coefficients when projected onto the Eigenimages
Match a new image:Project it onto the basis of the EigenimagesCompare the resulting coefficients to those stored in the
The face database and the derived Eigenface examples are all from AT&T Laboratories Cambridge:http://www.cl.cam.ac.uk/research/dtg/attarchive/facedatabase.html & http://en.wikipedia.org/wiki/File:Eigenfaces.png
Which training image(s) does each face most resemble?
21
Matching Simple Features
Classification based on featuresEx: mean intensity, area, aspect ratio
Idea:Combine a set of shape features into a single feature
vectorBuild a statistical model of this feature vector between
and across object classes in a sequence of training shapes
Classification of a new shape = the object class from which the new shape’s feature vector most likely came.
22
One of two maximal cliques
Graph Matching:Association Graphs Match nodes of model to segmented patches in image Maximal cliques represent the most likely correspondences
Clique = a totally connected subgraph Problems: Over/under segmentation, how to develop appropriate rules,
often > 1 maximal clique
2
3
1
Model
B
C
A
Image
1A
2B
3C
3B
2C
23
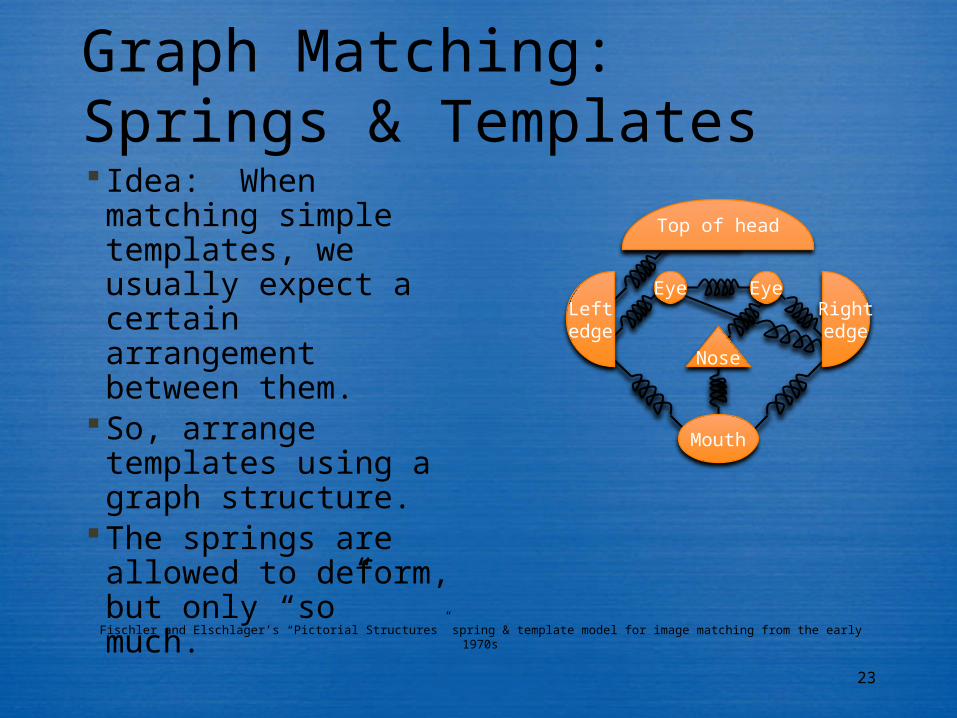
Idea: When matching simple templates, we usually expect a certain arrangement between them.
So, arrange templates using a graph structure.
The springs are allowed to deform, but only “so” much.
Graph Matching:Springs & Templates
Eye Eye
Nose
Leftedge
Rightedge
Top of head
Mouth
Fischler and Elschlager’s “Pictorial Structures” spring & template model for image matching from the early 1970s
24
A match is based on minimizing a total cost.
Problem: Making sure missing a point doesn’t improve the score.