Page 1
1
THE DAY OF THE WEEK EFFECT IN THE COMPANIES
WITHIN THE LQ45 STOCK INDEX FROM 2008-2016
Katherina Jessica Clorinda
A. Jatmiko Wibowo
International Business Management Program, Faculty of Economics, Atma Jaya
Yogyakarta University, Jalan Babarsari 43-44, Yogyakarta
ABSTRACT
The purpose of this research is to investigate the existence of the day of the week
effect in the company within the LQ45 stock Index from 2008-2016. Day of the
week effect is a calendar anomaly that happen when stock has a different return
every day. Day of the week is usually used as one of investor strategy to get an
abnormal return. In this research, the data used is the daily adjusted stock price,
which is secondary data of the LQ45 company stock index member used as a
sample. The data will then be processed to be a daily percentage return of the LQ45
company stock index. The method of analyzing the data is using OLS Method and
GARCH (1,1) Model, but before utilizing OLS Method and GARCH (1,1) Model,
some test are required like the stationary test using the Augmented Dickey-Fuller
and the heteroscedasticity test using the ARCH-LM.
The result shown that there is volatility within the company in the LQ45 stock
index, which result in the return of the company differ for each day, which lead to
the conclusion of the existence of day of the week effect within the company in the
LQ45 stock index.
Keywords: the day of the week effect, calendar anomaly, capital market, Efficient
Market Hypothesis, LQ45, stock return, OLS Method, GARCH
Page 2
2
INTRODUCTION
Financial market is a market where an individual, group or even corporation
that can do a buy-or-sell transaction in term of financial securities (Ross,
Westerfield, & Jordan, 2006). The form of financial securities itself can be in the
form of stock or bond. Financial market itself can be divided into two types of
market, Capital Market and Money Market. Capital Market deal securities
transaction in term of long-term securities transaction, while Money Market deal
on the short-term securities transaction.
Investing in financial market mean doing an act or activity of buying
securities in the financial market in the hope that in the future it will generate profit
or appreciated. And the person that do this kind of activity is called as investor.
There are two kind of investor the risk seeker or the risk avoider.
Capital market can be describe as market that deals of buying and selling
transaction of equity and debt instrument at a long-term period of time, it include
those of primary market where stock and bonds are issued, and secondary market a
place where investor can trade existing securities. In a country, capital market is
very important not only provide a buying and selling medium for the securities
investor, but it also has a function for the country financial and economy.
Capital market can be seen as a medium where the two party, the buyer and
seller, can have a transaction that could benefit both party. Where the buyer can
lend some capital to the seller in the hope that their investment will be appreciated
in the future, without any worry of managing the company. As for the seller, they
can borrow some capital from the investor to fund some of their company or
organization activity.
Efficiency in the context of capital market has been defined in many ways,
but the most common way has been defined in terms of what sort of information is
available to market participants, and how they handle that information. From this
view, according to Dimson and Mussavian (1998) in Gharaibeh and Al Azmi
(2015), an efficient capital market is one where prices of financial assets accurately
reflect all information and quickly adjust to new information, which is referred to
as informational efficiency. So in some way, to gain more return from the
investment the investor will try to gain an upper hand from the market by trying to
make it become inefficient or finding a suitable strategy in defeating the market.
The study of market efficiency is quite crucial for investors, investment manager,
and policy makers, by understanding the market efficie
In capital market sometimes there is a situation where some kind of seasonal
anomaly occur in the market, where there is actually a seasonal pattern that occur
in the capital market. One of the most discussed anomaly is the day of the week
Page 3
3
effect, where there is a difference in the average daily return of the market for all
days of the weeks.
According to Jaffe and Westerfield (1985), Wong et al. (1992), and Agrawal
and Tandon (1994) in Patel and Mallikarjun (2014), day of the week effect is a
global phenomenon, and this might be the result of spillover effect of developed
stock market. This anomaly can be used by the investor as one of their strategy to
gain more return from their investment, if the day of the week effect is prominent
in the stock market investor can use such opportunities or clues regarding their
investment decisions. Another strategy to use the day of the week effect is where
the investor can time their investment to where they can buy and sell their securities
where it would gain them additional return.
PROBLEM STATEMENT
The main problem of this study is “Is there a Day of the Week Effect in the
stock return of Indonesia LQ-45 company stock Index?”
OBJECTIVE OF THE RESEARCH
The objective of this research is to analyze the day of the week effect on the
stock return of LQ-45 stock market index member.
THEORITICAL BACKGROUND AND HYPOTHESIS DEVELOPMENT
Capital Market
One of the widely quoted definitions of the capital market is given by
Nwankwo (1998) in Mary et al. (2012), who says that the capital market comprises
the complex of institution and mechanism through which intermediate term funds
and long term funds are pooled and made available to business, government, and
individual. According to Herbert (2004) quoted in Mary et al. (2012), the
instrument in capital market is the types of the securities that are traded in capital
market. There are 3 types of it, ordinary shares, preference shares and debt
instrument.
Return
According to Ross et al. (2006), when investor but an asset of any sort, their
gain or loss from that investment is called the return of investment. In investing
something the investor will seek some profitable compensation of their investment,
it could be either in the form of cash directly (income component) or the change of
value of their assets (capital gain or loss). And in calculating the return of one
investment, the investor usually use the term of dollar return and percentage return.
But usually investor prefer to summarize their return in the percentage return,
because the return will not depend on how much the investor actually invest.
Efficient Market Hypothesis
The Efficient Market Hypothesis (EMH) asserts that well-organized capital
markets are efficient markets, it argue that although inefficiencies may exist, they
Page 4
4
are relatively small and not common (Ross, Westerfield, & Jordan, 2006). In here,
it can be assume that in EMH the Net Present Value (NPV) investment in market is
zero. The reason is because all of the price of the securities in the market reflect the
available information the price of the securities is just right, not too low and not too
high. The investor and the corporation will get the exact price for their securities
and investment. Which mean that the investor will not have to worry whether their
investment is in a “fair” price or not, this also goes for the corporation.
According to Ross et al. (2006), depending on the degree of efficiency, there are
three form of EMH:
1. Weak form Efficient
According to Reilly and Brown (2006) in Mazviona and Ndlovu (2015),
weak form market efficiency assumes that current stock prices fully reflect all
security market information including the historical sequence of prices, rates of
return, trading volume data, and other market generated information such as odd lot
locations, block trades and transactions by exchange specialist.
2. Semi-strong form Efficient
The semi-strong form EMH asserts that security prices adjust rapidly to the
release of all public information, that is current security prices fully reflect all public
information, which includes, in addition to past prices, fundamental data on the
firm’s product line, quality of management, balance sheet composition, patents,
accounting practices and earnings forecasts (Mazviona & Ndlovu, 2015).
3. Strong form Efficient
According to Chikoko and Muparuri (2013) in Mazviona and Ndlovu
(2015), the strong form EMH contends that stock prices fully reflect all information
from public and private sources and this means that no group of investors has
monopolistic access to information relevant to the information of prices.
Calendar Anomaly
Anomalies refers to any deviation from efficient market hypothesis, while
calendar anomalies refer to the existence of any irregularities, fluctuations, or the
specific pattern, occurring in a recurring manner during a definite time within a year
(Khan, Khan, & Khan, 2014). Calendar anomalies are not only important for traders
to get abnormal returns but also for the test of efficient markets (Basdas, 2011).
Because when the price become predictable because of a certain pattern that exist,
it will become easier for the investor to take advantages of it and gaining more
profitable return. So in other word, Calendar anomalies comprise one widely
studied set of pricing anomalies (Philpot & Peterson, 2011).
Below are some of the seasonal anomaly that can be found in the market:
1. Day of the Week Effect
Page 5
5
The day of the week effect, also referred to as weekend effect or Monday
effect is an important area of study and many researchers tried to find observable
patterns by testing equality of returns across all days of the week (Mazviona &
Ndlovu, 2015). The day of the week effect is the phenomenon where stock returns
and volatilities behave differently on different days of the week (Plimsoll, Saban,
Spheris, & Rajaratnam, 2013).
2. January Effect
According to Floros (2008), Moller and Zilca (2008), Lynch et al. (2014),
the January effect is a calendar anomaly reported in the financial markets wherein
the returns in the month of January are higher that the returns during any other
month of the year (Kumar & Pathak, 2016).
3. Turn of the Month Effect
Turn of the month effect is where an average returns on securities are higher
on last and first three days of a month due to the investors behavior (Khan, Khan,
& Khan, 2014).
4. Turn of the Year Effect
Turn of the year effect is when small capitalization stocks tend to heavily
outperform large capitalization stocks on the last trading day of December and the
first five trading days in January (Szakmary & Kiefer, 2004).
5. The Month of the Year Effect
The Month of the Year Effect is when stock return on a particular month are
higher than the other month, and one of the example of this is January Effect and
November Effect (Minimol, Makesh, & Radhika, 2013).
6. Time of the Month Effect
According to Chandra (2009), the time of the month effect is when the
returns of stock are different at some points in time during a month (Khan, Khan,
& Khan, 2014).
7. Trading Month Effect
The trading month effect is the tendency for statistically increased returns
in each month’s first fortnight in comparison to the second (Vasileiou & Samitas,
2015).
Previous Research
Many research regarding the day of the week effect in the world has been
done with mixed result. In determining the day of the week effect, previous research
done by French (1980), Junkus (1986), Ma (1986), Yakob (2005), and Brahmana
et al. (2012) use two types of hypothesis in determining the existence of day of the
week effect. They are the calendar time hypothesis and the trading time hypothesis.
Page 6
6
Calendar time hypothesis stated that the process operates continuously and the
expected return for Monday is three times the expected return for other days of the
week, while the trading time hypothesis stated that returns are generated only during
active trading and the expected returns is the same for each day of the week (French,
1980). This research will use the trading time hypothesis which is popularly used
by other researchers. Because it eliminates the Monday Dummy to avoid the
dummy trap because there are more than three dummies in the variables (Brahmana,
Hooy, & Ahmad, 2012).
Based on th previous research then the alternative hypothesis that will be used in
this research is :
Ha : The expected return is not the same of each day, which conclude there is a day
of the week
effect.
RESEARCH METHODOLOGY
Population, Sample and Research Data
The population of this research would be the member of LQ45 stock index
from 2008-2016. And the sample that will be used in here will be the daily stock
return of the 38 companies that has been a member of LQ45 stock index for 6
semester or more (The companies listed as sample will be stated in the Appendix
1). The daily stock return will be calculated using the daily-adjusted close price of
the stock. And the share price that is reported on public holiday and mass leave of
Indonesia will be excluded from the data set.
Data Collection Method
This research will use secondary data of the LQ45 stock index member that
is used as a sample. The gathering and collecting of the data will be done by
downloading the data from the website of Yahoo Finance (finance.yahoo.com) and
Google Finance (google.com/finance). Data that can be obtain from the website
include that of the day of the trading. The data that is use in the research is the daily
percentage return of a share. To find the data, the adjusted stock price data of a
company that is obtain from Yahoo Finance and Google Finance and must be
calculated using a formula of natural logarithm of current adjusted closing price of
the share divided by the closing share price of the share.
Data Analysis Method
The analysis method that will be used in this research of the presence day of the
week effect on LQ45 company stock index is GARCH (1,1) model. This model is
used based on research done by (Kamath and Liu, 2011) and (Patel and Mallikarjun,
2014) to investigate the presence of day of the week effect. The first step is to
calculate daily percentage return which can be obtain by using the formula of
(Plimsoll, Saban, Spheris, & Rajaratnam, 2013) :
Page 7
7
𝑟𝑡 = ln (𝑃𝑡
𝑃𝑡−1)
And in this research the firm will also be divided into three types of portfolio, the
winner, average and loser. And in processing the portfolio, the portfolio expected
return must be calculated using :
𝐸(𝑅𝑝) = 𝑥1 × 𝐸(𝑅1) + 𝑥2 × 𝐸(𝑅2)+. . . +𝑥𝑖 × 𝐸(𝑅𝑛)
After that there are other step of data analysis that must be done, they are :
1. Descriptive Statistic Analysis
The component of the descriptive statistic will be mean, median, maximum
value, minimum value, standard deviation, skewness, kurtosis, JB Statistics, and
Prob.
2. Stationary Test
In using the GARCH (1,1) model there are some requirement for the data that
is the data time series pattern has to be stationary. An alternative test of stationary
that has recently become popular is known as the unit root test (Gujarati, 1995). In
determining the unit root test, this study will use the Augmented Dickey-Fuller
(ADF) test.
3. ARCH-LM Test
According to Engle (1995) in Widarjono (2013), ARCH-LM test or Lagrange
Multiplier (LM) test is a test that was developed to detect heteroscedasticity in a
time series data. To use the GARCH (1,1) model in determining day of the week
effect it is important for the data to have heteroscedasticity.
4. OLS Method Test
The OLS Method formula that is used in this method is : (Gharaibeh & Hammadi,
2013)
𝑅𝑡 = 𝑏1 + 𝑏2𝐷2𝑡 + 𝑏3𝐷3𝑡 + 𝑏4𝐷4𝑡 + 𝑏5𝐷5𝑡 + 휀𝑡
5. GARCH (1,1) Model Test
The GARCH (1,1) model that has been adapt to suit this research is : (Patel &
Mallikarjun, 2014)
𝑅𝑡 = 𝛼1+𝛼2𝐷2𝑡 + 𝛼3𝐷3𝑡 + 𝛼4𝐷4𝑡 + 𝛼5𝐷5𝑡 + ∑ 𝛼𝑖
𝑚
𝑡=1
𝑅𝑡−1 + 휀𝑡
휀𝑡|𝜙𝑡−1~ 𝑖𝑖𝑑 𝑁 (0, ℎ𝑡)
ℎ𝑡2 = 𝛾0 + 𝛿1휀𝑡−1
2 + 𝛾1ℎ𝑡−1
Page 8
8
RESULT AND DISCUSSION
Descriptive Statistic
Tabel 2
Descriptive Statistic of Daily Stock Return of the 38 Companies
From 2008 – 2016
Firm Obs. Mean Std. Dev. Skew. Kurtosis Jarque-Bera Prob.
AALI 2177 -0.0001 0.0290 -0.0126 11.3327 6298.3480 0.0000
ADHI 2177 0.0003 0.0325 0.4197 8.5812 2889.4060 0.0000
AKRA 2177 0.0007 0.0264 0.0094 7.1598 1569.6590 0.0000
ANTM 2177 -0.0007 0.0316 0.4342 14.2156 11478.4600 0.0000
ASII 2177 0.0010 0.0278 0.5693 11.6886 6965.3000 0.0000
ASRI 2177 0.0003 0.0316 0.2686 8.0787 2365.8440 0.0000
BBCA 2177 0.0007 0.0213 -0.0063 6.9018 1380.9280 0.0000
BBNI 2177 0.0005 0.0265 -0.2180 16.2174 15864.0600 0.0000
BBRI 2177 0.0006 0.0269 0.3177 7.2834 1700.9240 0.0000
BDMN 2177 -0.0003 0.0299 0.3625 16.2864 16060.3800 0.0000
BMRI 2177 0.0006 0.0257 0.3759 8.6567 2953.8340 0.0000
BMTR 2177 -0.0003 0.0343 1.1408 10.8321 6036.5120 0.0000
CPIN 2177 0.0012 0.0317 0.2186 7.3112 1703.2680 0.0000
CTRA 2177 0.0005 0.0337 0.3657 6.0207 876.2249 0.0000
EXCL 2177 0.0000 0.0412 0.6009 16.4052 16431.1700 0.0000
GGRM 2177 0.0009 0.0265 0.8716 10.7742 5757.8860 0.0000
INCO 2177 -0.0016 0.0600 -25.2960 969.8402 85024508.0000 0.0000
INDF 2177 0.0006 0.0249 -0.1114 7.8409 2130.1660 0.0000
INTP 2177 0.0003 0.0295 0.3330 42.7018 143017.6000 0.0000
ISAT 2177 -0.0001 0.0249 -0.0431 15.0604 13194.5200 0.0000
ITMG 2177 0.0000 0.0321 0.1949 9.6861 4068.7550 0.0000
JSMR 2177 0.0004 0.0214 0.2433 11.5957 6723.5950 0.0000
KLBF 2177 0.0008 0.0249 0.7727 11.9228 7438.5450 0.0000
LPKR 2177 0.0000 0.0237 -0.0006 9.6085 3961.4820 0.0000
LSIP 2177 -0.0001 0.0312 -0.1569 10.8376 5580.9990 0.0000
MEDC 2177 -0.0006 0.0305 0.5657 9.7603 4261.5790 0.0000
MNCN 2177 0.0003 0.0342 1.1197 10.0775 4998.5980 0.0000
Page 9
9
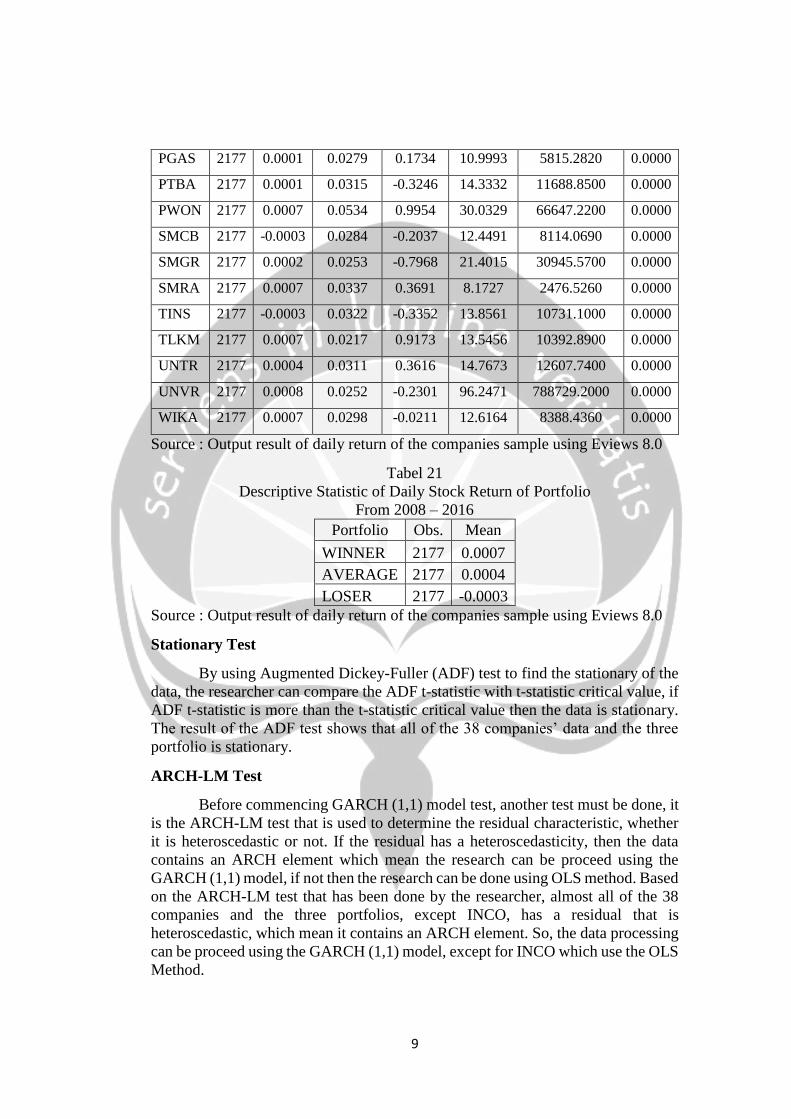
PGAS 2177 0.0001 0.0279 0.1734 10.9993 5815.2820 0.0000
PTBA 2177 0.0001 0.0315 -0.3246 14.3332 11688.8500 0.0000
PWON 2177 0.0007 0.0534 0.9954 30.0329 66647.2200 0.0000
SMCB 2177 -0.0003 0.0284 -0.2037 12.4491 8114.0690 0.0000
SMGR 2177 0.0002 0.0253 -0.7968 21.4015 30945.5700 0.0000
SMRA 2177 0.0007 0.0337 0.3691 8.1727 2476.5260 0.0000
TINS 2177 -0.0003 0.0322 -0.3352 13.8561 10731.1000 0.0000
TLKM 2177 0.0007 0.0217 0.9173 13.5456 10392.8900 0.0000
UNTR 2177 0.0004 0.0311 0.3616 14.7673 12607.7400 0.0000
UNVR 2177 0.0008 0.0252 -0.2301 96.2471 788729.2000 0.0000
WIKA 2177 0.0007 0.0298 -0.0211 12.6164 8388.4360 0.0000
Source : Output result of daily return of the companies sample using Eviews 8.0
Tabel 21
Descriptive Statistic of Daily Stock Return of Portfolio
From 2008 – 2016
Portfolio Obs. Mean
WINNER 2177 0.0007
AVERAGE 2177 0.0004
LOSER 2177 -0.0003
Source : Output result of daily return of the companies sample using Eviews 8.0
Stationary Test
By using Augmented Dickey-Fuller (ADF) test to find the stationary of the
data, the researcher can compare the ADF t-statistic with t-statistic critical value, if
ADF t-statistic is more than the t-statistic critical value then the data is stationary.
The result of the ADF test shows that all of the 38 companies’ data and the three
portfolio is stationary.
ARCH-LM Test
Before commencing GARCH (1,1) model test, another test must be done, it
is the ARCH-LM test that is used to determine the residual characteristic, whether
it is heteroscedastic or not. If the residual has a heteroscedasticity, then the data
contains an ARCH element which mean the research can be proceed using the
GARCH (1,1) model, if not then the research can be done using OLS method. Based
on the ARCH-LM test that has been done by the researcher, almost all of the 38
companies and the three portfolios, except INCO, has a residual that is
heteroscedastic, which mean it contains an ARCH element. So, the data processing
can be proceed using the GARCH (1,1) model, except for INCO which use the OLS
Method.
Page 10
10
GARCH (1,1) Model Test, OLS Method Test and Discussion
1. Testing H1 : there is a day of the week effect in the 38 companies within the
LQ45 index
GARCH (1,1) Model Result in all the 37 companies and three portfolios show
a consistent probability value from Monday to Friday, with the value of 0.0000 for
ARCH(1) and 0.0000 for GARCH(1) that is less than α (0.05). The probability
value shown that the return of the companies and the portfolios within the research
sample significantly contain an ARCH and GARCH elements that shown the
existence of volatility within it. The volatility in the company’s stock return can be
the result of many factors. From some of those factors the day of the week
phenomenon is one of them is the day of the week effect. If the result of the return
of the company is the same (=) for each day in a week then it means, there is no
volatility in the company stock that could lead to a phenomenon called day of the
week effect. However, if the result of the return of the company is not the same (≠)
for each day in a week, it means that there is volatility in the company stock that
could lead to a phenomenon called day of the week effect. From the result of the
data analysis, it shown that there is volatility within the 37 company stock and three
portfolios, in other words, the expected return of the company is not the same (≠)
for each day, which conclude that there is a day of the week effect (H1 Accepted).
As for the OLS Method result for INCO shows that the F-Statistic probability
has a value of 0.2921, that is more than α (0.05). In addition, all of the coefficient
probability is more than α (0.05). If the value of the F-Statistic and at least one of
the variable probability is less than alpha, it is significant, which mean that the
expected return of the company stock is not the same for each day and it indicates
the existence of day of the week effect within the stock return. But if the value of
the F-statistic and all of the variable probability is more than alpha, it is not
significant, which mean that the expected return of the company stock is the same
for each day and it indicate that there is no day of the week effect. Based on the
criteria and the result of INCO OLS method, it indicates that the expected return of
INCO stock is the same for each day. It can be conclude that there is no day of the
week effect in INCO stock return (H0 Accepted).
CONCLUSION
Conclusion
1. Based on the data analysis conducted in chapter IV about the day of the week
existence in the companies within LQ45 stock index, the result of GARCH
(1,1) Model shown that the expected return of the 37 companies and the 3
portfolios using the model is not the same for each day, which concludes that
there is a day of the week effect (H1 Accepted). While the result of the OLS
method shown that the stock return of INCO has the same expected return for
each day, which concludes that there is no day of the week effect. (H0
Accepted.)
2. The test result of agriculture sector stock return that consist of AALI and LSIP
from 2009-2016 shows that the return of the company in the agriculture sector
Page 11
11
from day to day in a week is not the same, which mean H1 Accepted for AALI
and LSIP from 2009-2016.
3. The test result of basic industry and chemicals sector stock return that consist
of CPIN, INTP, SMCB and SMGR from 2009-2016 shows that the return of
the company in the basic industry and chemicals sector from day to day in a
week is not the same, which mean H1 Accepted for CPIN, INTP, SMCB and
SMGR from 2009-2016.
4. The test result of consumer goods industry sector stock return that consist of
GGRM, INDF, KLBF and UNVR from 2009-2016 shows that the return of the
company in the consumer goods industry sector from day to day in a week is
not the same, which mean H1 Accepted for GGRM, INDF, KLBF and UNVR
from 2009-2016.
5. The test result of finance sector stock return that consist of BBCA, BBNI,
BBRI, BDMN and BMRI from 2009-2016 shows that the return of the
company in the finance sector from day to day in a week is not the same, which
mean H1 Accepted for BBCA, BBNI, BBRI, BDMN and BMRI from 2009-
2016.
6. The test result of infrastructure, utilities and transportation sector stock return
that consist of EXCL, ISAT, JSMR, PGAS and TLKM from 2009-2016 shows
that the return of the company in the infrastructure, utilities and transportation
sector from day to day in a week is not the same, which mean H1 Accepted
for EXCL, ISAT, JSMR, PGAS and TLKM from 2009-2016.
7. The test result of mining sector stock return that consist of ANTM, ITMG,
MEDC, PTBA and TINS from 2009-2016 shows that the return of the company
in the mining sector from day to day in a week is not the same, which mean H1
Accepted for ANTM, ITMG, MEDC, PTBA and TINS from 2009-2016.
8. While the test result of mining sector stock return that consist of INCO from
2009-2016 shows that the return of INCO stock is the same for each day, which
mean H0 Accepted for INCO from 2009-2016.
9. The test result of miscellaneous industry sector stock return that consist of ASII
from 2009-2016 shows that the return of the company in the miscellaneous
industry sector from day to day in a week is not the same, which mean H1
Accepted for ASII from 2009-2016.
10. The test result of property, real estate and building construction sector stock
return that consist of ADHI, ASRI, CTRA, LPKR, PWON, SMRA and WIKA
from 2009-2016 shows that the return of the company in the property, real
estate and building construction sector from day to day in a week is not the
same, which mean H1 Accepted for ADHI, ASRI, CTRA, LPKR, PWON,
SMRA and WIKA from 2009-2016.
11. The test result of trade, service and investment sector stock return that consist
of AKRA, BMTR, MNCN and UNTR from 2009-2016 shows that the return
of the company in the trade, service and investment sector from day to day in
a week is not the same, which mean H1 Accepted for AKRA, BMTR, MNCN
and UNTR from 2009-2016.
12. The test result of company’s portfolio stock return that is divided into winner
portfolio, average portfolio and loser portfolio from 2009-2016 shows that the
Page 12
12
return of the company in the three portfolios from day to day in a week is not
the same, which mean H1 Accepted based on the three form of portfolio from
2009-2016.
Managerial Implication
The research of day of the week effect existence in the return of companies
within LQ45 stock index are expected to help the party that is involved in the stock
market, such as the investor. Based on the research result, the researcher hope that
the investor can use the information from this research to help them in determining
the best investment by using the company trend within the LQ 45 stock index. And
because of the more firm-specified level of the research, it could hopefully help the
investor more in predicting the trend movement of the stock.
And based on the research result, the investor can expect and foresaw the
stock price movement, using this knowledge the investor can then decide which day
is the best day to start an investment. Based on the result of the research, investor
should consider to buy stock from the 38 companies in the LQ45 index in Monday,
where the stock price is lower than the other day of the week. And then the investor
could sell the shares again at the end of the week, to gain a profit.
Research Limitation
1. The research are only limited to the companies within the LQ45 index that are
selected as the sample, and the period of the research is only within 9 year
which is from 2009-2016.
2. The research is done only by using OLS Method and GARCH (1,1) model,
which mean there is a limitation in the analysis tools and technique. There is
no new method development to compare with, by comparing many types of
analysis tools and technique the researcher can determine the best model for
the data and gives the best analytical result.
Suggestion for Further Research
Based in the research limitation, the writer will give suggestion for future
research as followed :
1. The future research are suggested to add more company stock, and not only the
companies included in the LQ45 stock index.
2. The future research are suggested to also analyze the day of the week effect
based on the sector or industry.
3. The future research are suggested to use other analytic tools and techniques,
and to compare them to determine the best analytical tools for the research
within the day of the week effect.
4. The future research are suggested to add period of the research, so it can be
analyze whether the day of the week phenomenon is a long term phenomenon
or not.
Page 13
13
REFERENCES
Al-Khazali, O. (2008). The Impact of Thin Trading on Day-of-the-Week Effect:
Evidence from the United Arab Emirates. Review of Accounting and
Finance Vol. 7, No. 3, 270-284.
Basdas, U. (2011). The Day of the Week Effect for Istanbul Stock Exchange: A
Stochastic Dominance Approach. Journal of Applied Finance and Banking,
Vol. 1 No. 4, 223-238.
Bollerslev, T. (1986). Generalized Atutoregressive Conditional heteroskedasticity.
Journal of Econometrics, Vol. 31, 307-327.
Brahmana, R., Hooy, C., & Ahmad, Z. (2012). Weather, Investor Irrationality and
Day-of-the-Week Anomaly: Case of Indonesia. J Bioecon Vol. 14, 129-146.
Cross, F. (1973). The Behavior of Stock Market Price on Fridays and Mondays.
Financial Analysts Journal Vol. 29 No. 6, 67-69.
Degutis, A., & Novickyte, L. (2014). The Efficient Market Hypothesis: A Critical
Review of Literature and Methodology. EKONOMIKA Vol. 93 No. 2, 7-23.
French, K. (1980). Stock Returns and the Weekend Effect. Journal of Financial
Economics Vol. 8, 55-69.
Gharaibeh, A., & Al Azmi, A. (2015). Test of the Day of the Week Effect: The Case
of Kuwait Stock Exchange. Asian Economic and Financial Review, Vol. 5,
No. 5, 757-765.
Gharaibeh, A., & Hammadi, F. (2013). The Day of the Week Anomaly in Bahrain's
Stock Market. International Management Review Vol. 9, No. 2, 60-69.
Gujarati, D. (1995). Basic Econometrics, Third Edition. Singapore: McGraw-Hill.
Junkus, J. (1986). Weekend and Day of the Week Effect in Returns on Stock Index
Futures. The Journal of Futures Markets (1986-1998) Vol.6 No. 3, 397-407.
Kamath, R., & Liu, C. (2011). The Day-of-the-Week Effect in the Santiago Stock
Exchange of Chile. Journal of International Business Research, Vol. 10,
Special Issue Number 1, 11-20.
Khan, M., Khan, M., & Khan, A. (2014). Calendar Anomalies, Reality or an
Illusion? KSE-Pakistan. Journal of Economics and International Finance
Vol. 6 No. 4, 80-84.
Kumar, S., & Pathak, R. (2016). Do the Calendar Anomalies Still Exist? Evidence
from Indian Currency Market. Managerial Finance Vol. 42, No. 2, 136-150.
Kumar, S., Mahadevan, A., & Gunasekar, A. (2012). Market Reaction to Dividend
Announcement: An Emphirical Study Using Event Study Technique.
Prestige International Journal of Management & IT-Sanchayan Vol. 1 No.
1, 141-153.
Page 14
14
Mary, J., Adedinran, S., & Elizabeth, A. (2012). Capital Market as a Veritable
Source of Development in Nigeria Economy. Jurnal of Accounting and
Taxation Vol.4(1), 7-18.
Mazviona, B., & Ndlovu, M. (2015). Day of the Week Effect on the Zimbabwe
Stock Exchange: A non-linear GARCH Analysis. International Journal of
Business and Economic Development Vol.3 No. 3, 1-12.
Minimol, M., Makesh, K., & Radhika, A. (2013). Seasonality in Emerging
Economies: Evidence from Indian Stock Market. International Journal of
Financial Management, Vol. 3, No.3, 26-36.
Patel, S., & Mallikarjun, M. (2014). Settlement Cycle and Day of the Week
Anomaly: Empirical Evidence from Indian Stock Market. Decision Vol. 41,
No. 3, 327-337.
Philpot, J., & Peterson, C. (2011). A Brief History and Recent Developments in
Day-of-the-Week Effect Literature. Managerial Finance Vol. 37, No. 9,
808-816.
Plimsoll, J., Saban, B., Spheris, A., & Rajaratnam, K. (2013). The Day of the Week
Effect: An Analysis of the Johannesburg Stock Exchange Top 40 Firms.
International Business and Economics Research Journal, Vol. 12, No. 3,
319-330.
Ross, S. A., Westerfield, R. W., & Jordan, B. D. (2006). Corporate FInance
Fundamental Seventh Edition. New York: McGraw-Hill/Irwin.
Szakmary, A., & Kiefer, D. (2004). The Dissappearing January/Turn of the Year
Effect: Evidence from Stock Index Futures and Cash Markets. The Journal
of Futures Markets Vol.24, No. 8, 755-784.
Vasileiou, E., & Samitas, A. (2015). Does the FInancial Crisi Influence the Month
and the Trading Month Effects? Evidence from the Athens Stock Exchange.
Studies in Economics and Finance Vol. 32 No. 2, 181-203.
Widarjono, A. (2013). Ekonometrika : Pengantar dan Aplikasinya, Edisi Keempat.
Yogyakarta: UPP STIM YKPN.
Winarno, W. (2015). Analisis Ekonometrika dan Statitiska dengan EViews, Edisi 4.
Yogyakarta: UPP STIM YKPN.
Winarno, W. W. (2007). Analisis Ekonometrika dan Statistika dengan Eviews,
cetakan pertama. Yogyakarta: UPP STIM YKPN.
Yakob, N., Beal, D., & Delpachitra, S. (2006). Seasonality in the Asia Pacific Stock
Markets. Journal of Asset Management, Vol.6, No. 4, 298-318.